Sample Category Title
BoJ Kuroda: We need to patiently maintain our powerful monetary easing
BoJ Governor Haruhiko Kuroda reiterated to the parliament today that it's still premature to discuss details on stimulus exit. "Given recent price developments, we need to patiently maintain our powerful monetary easing," he said.
Kuroda said consumer prices are likely to rise. However, he warned that "instead of leading to higher wages and corporate profits, such cost-push inflation will weigh on the economy in the long run by hurting corporate profits and households' real income."
Fed Powell hints on 50bps hike next, 10-year yield surges
US benchmark treasury yield jumped sharply overnight after Fed Chair Jerome Powell gave green light to more aggressive tightening pace. He said, "there is an obvious need to move expeditiously to return the stance of monetary policy to a more neutral level, and then to move to more restrictive levels if that is what is required to restore price stability."
In particular, he added, "if we conclude that it is appropriate to move more aggressively by raising the federal funds rate by more than 25 basis points at a meeting or meetings, we will do so."
Fed fund futures are now indicating 61.6% chance of a 50bps hike at May 4 meeting to 0.75-100%, up from 43.9% a day ago.
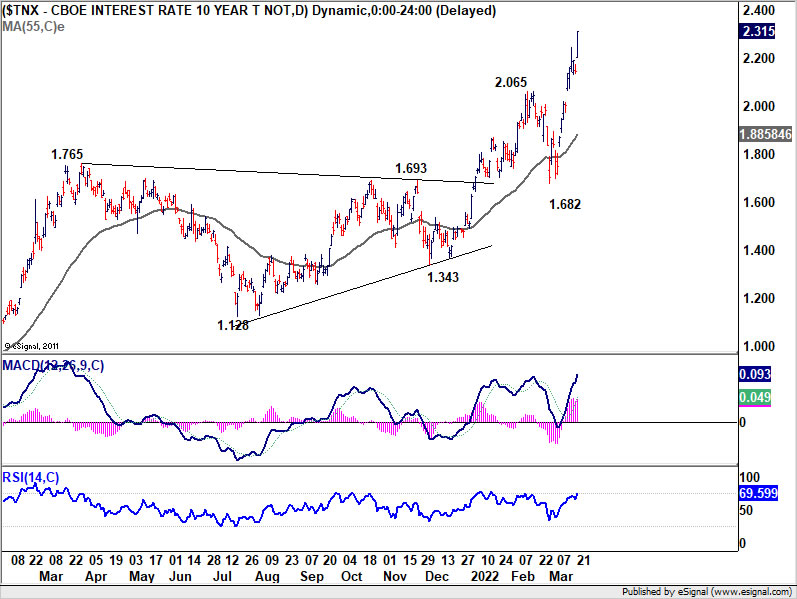
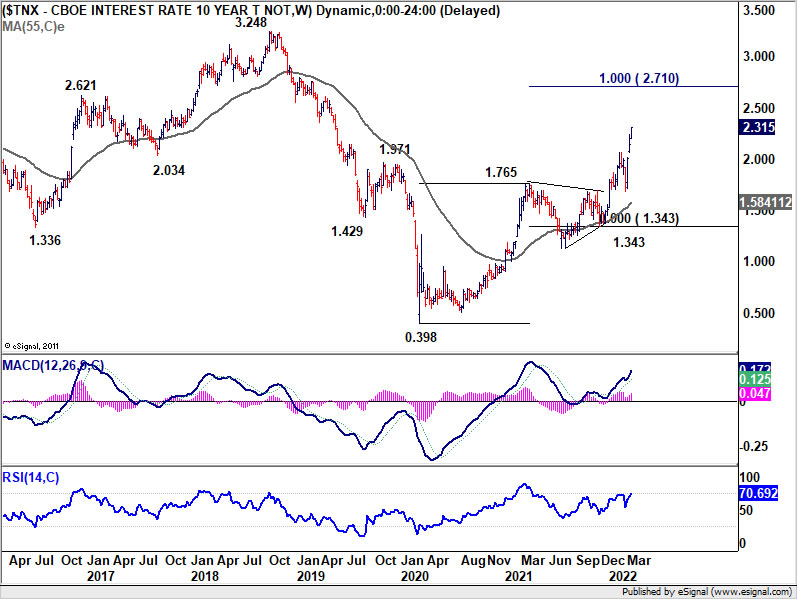
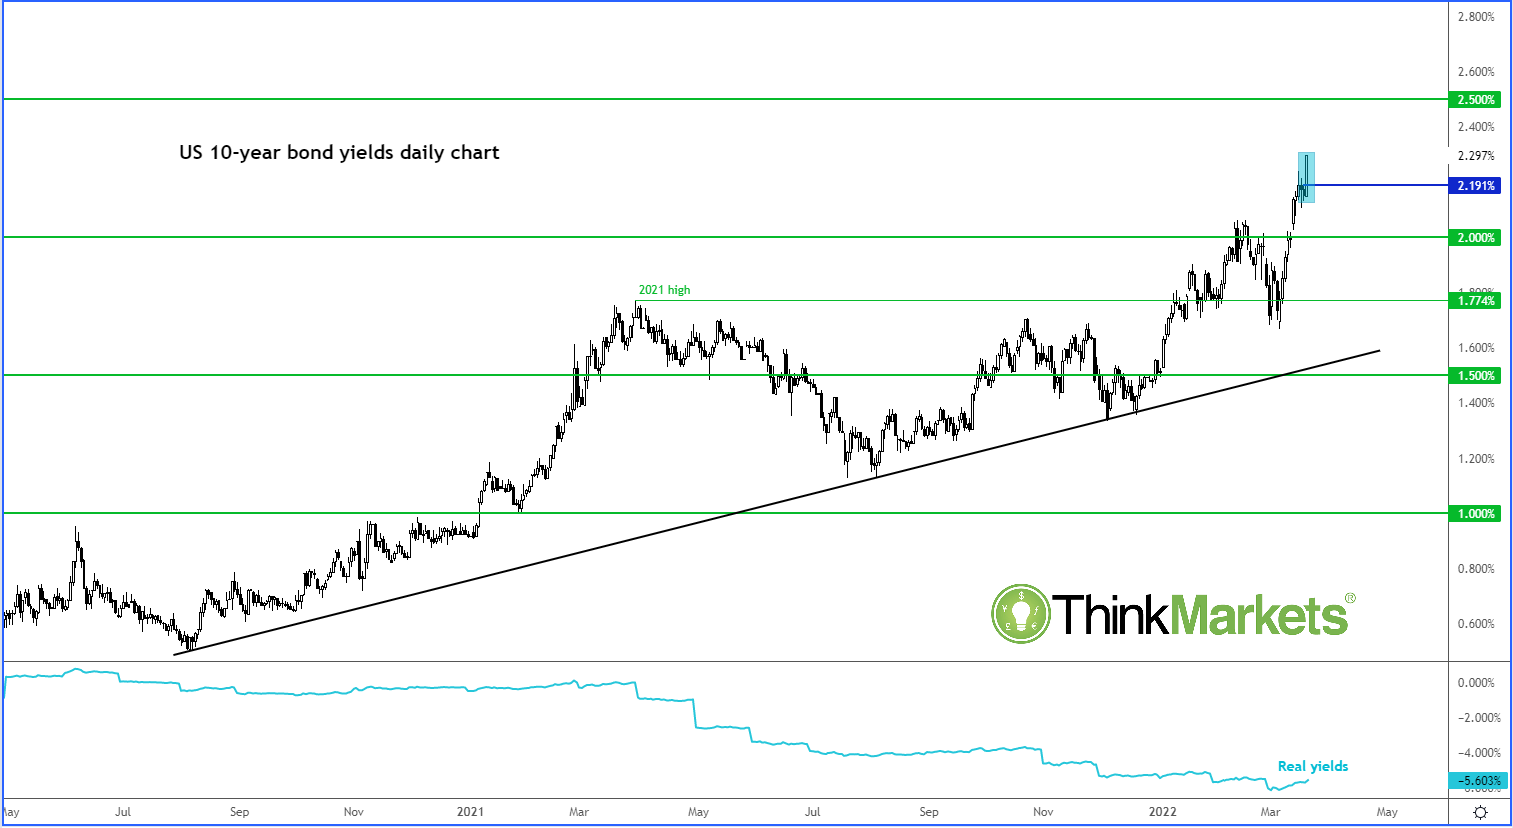
10-year yield rose 0.167 to close at 2.315. Near term outlook in TNX will stay bullish as long as 2.065 resistance turned support holds. Next target is 100% projection of 0.398 to 1.765 from 1.343 at 2.710.
Technical Outlook and Review
DXY:
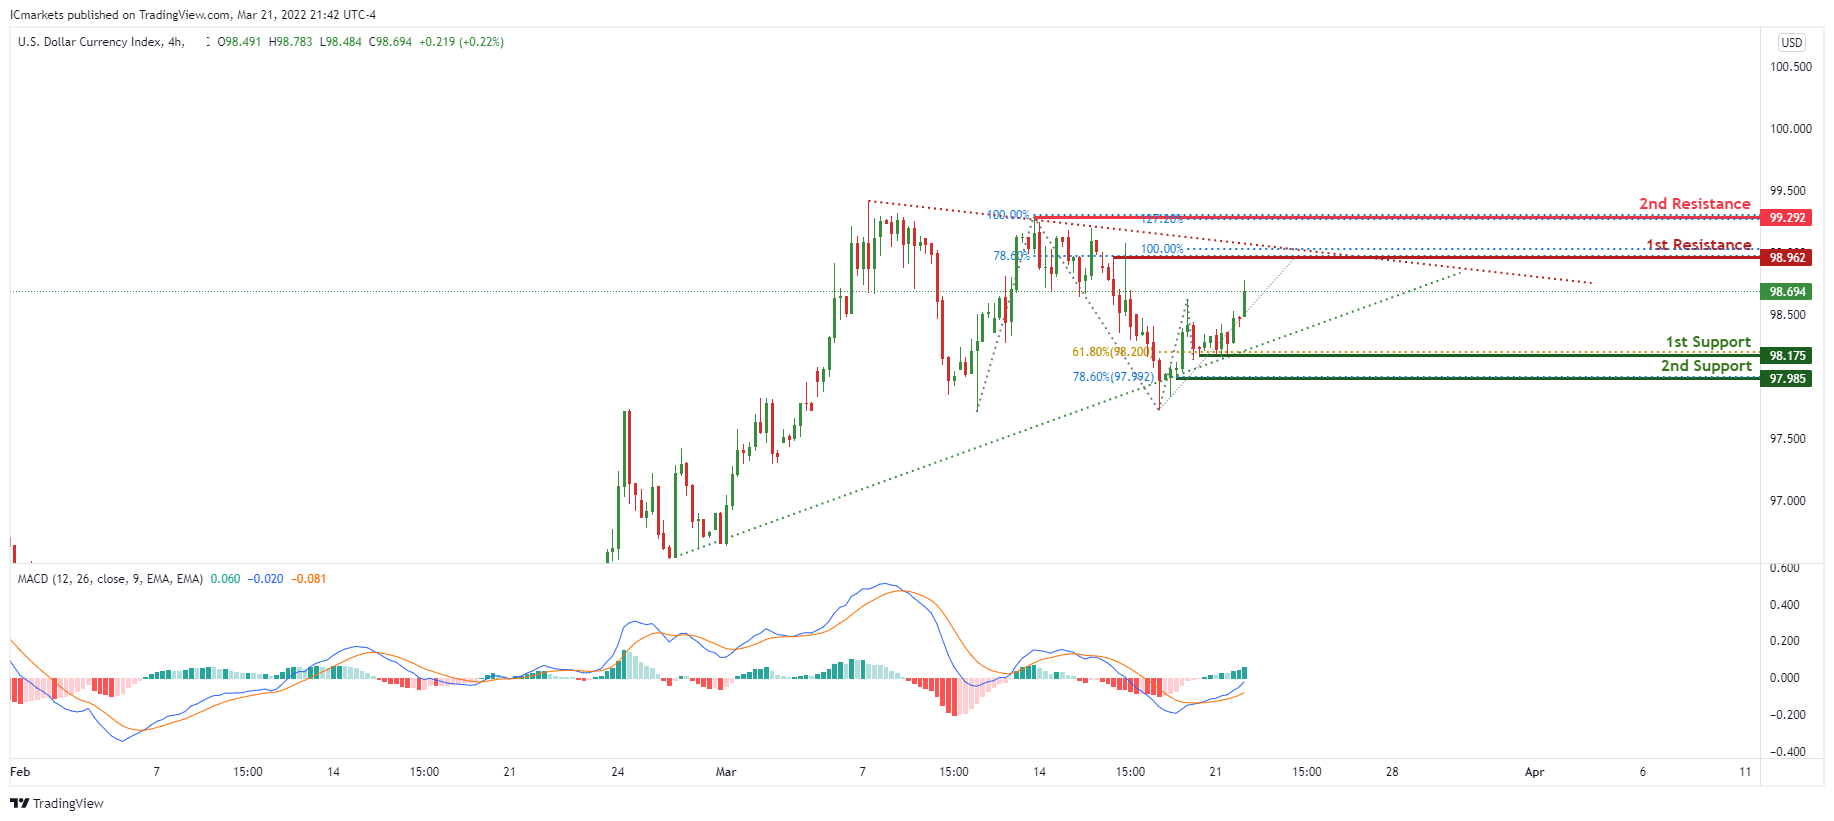
On the H4 timeframe, prices are on bullish momentum and consolidating in a triangle pattern. We see the potential for further bullish momentum from our 1st support at 98.175 in line with 61.8% Fibonacci retracement towards our 1st resistance at 98.962 in line with 78.6% Fibonacci projection and 100% Fibonacci Projection. MacD are showing bullish momentum from our crossovers, further supporting our bullish bias.
Areas of consideration:
- H4 time frame, 1st resistance at 98.962
- H4 time frame, 1st support at 98.175
XAU/USD (GOLD):
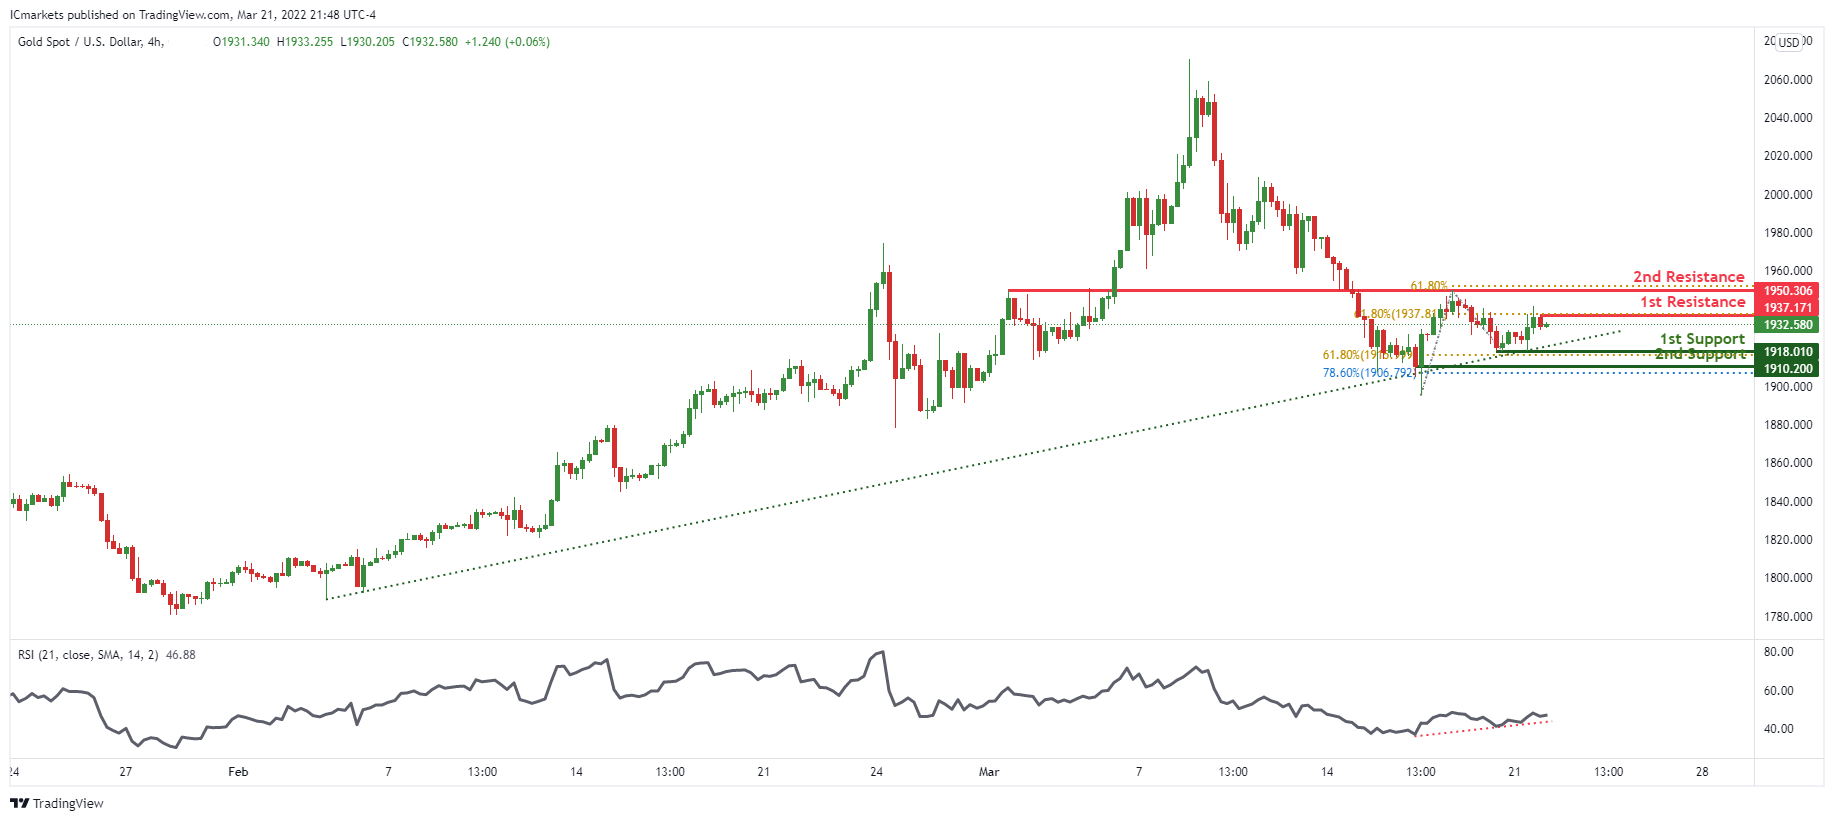
On the H4, prices are on bullish momentum and abiding to our ascending trendline support. We see the potential for further bullish continuation from our 1st support at 1918.010 in line with 61.8% Fibonacci retracement towards our 1st resistance at 1937.171 in line with 61.8% Fibonacci Projection and alsoa graphical swing high. RSI is on bullish momentum, further supporting our bullish bias.
Areas of consideration:
- 4h 1st support at 1918.010
- 4h 1st resistance at 1937.171
GBP/USD:
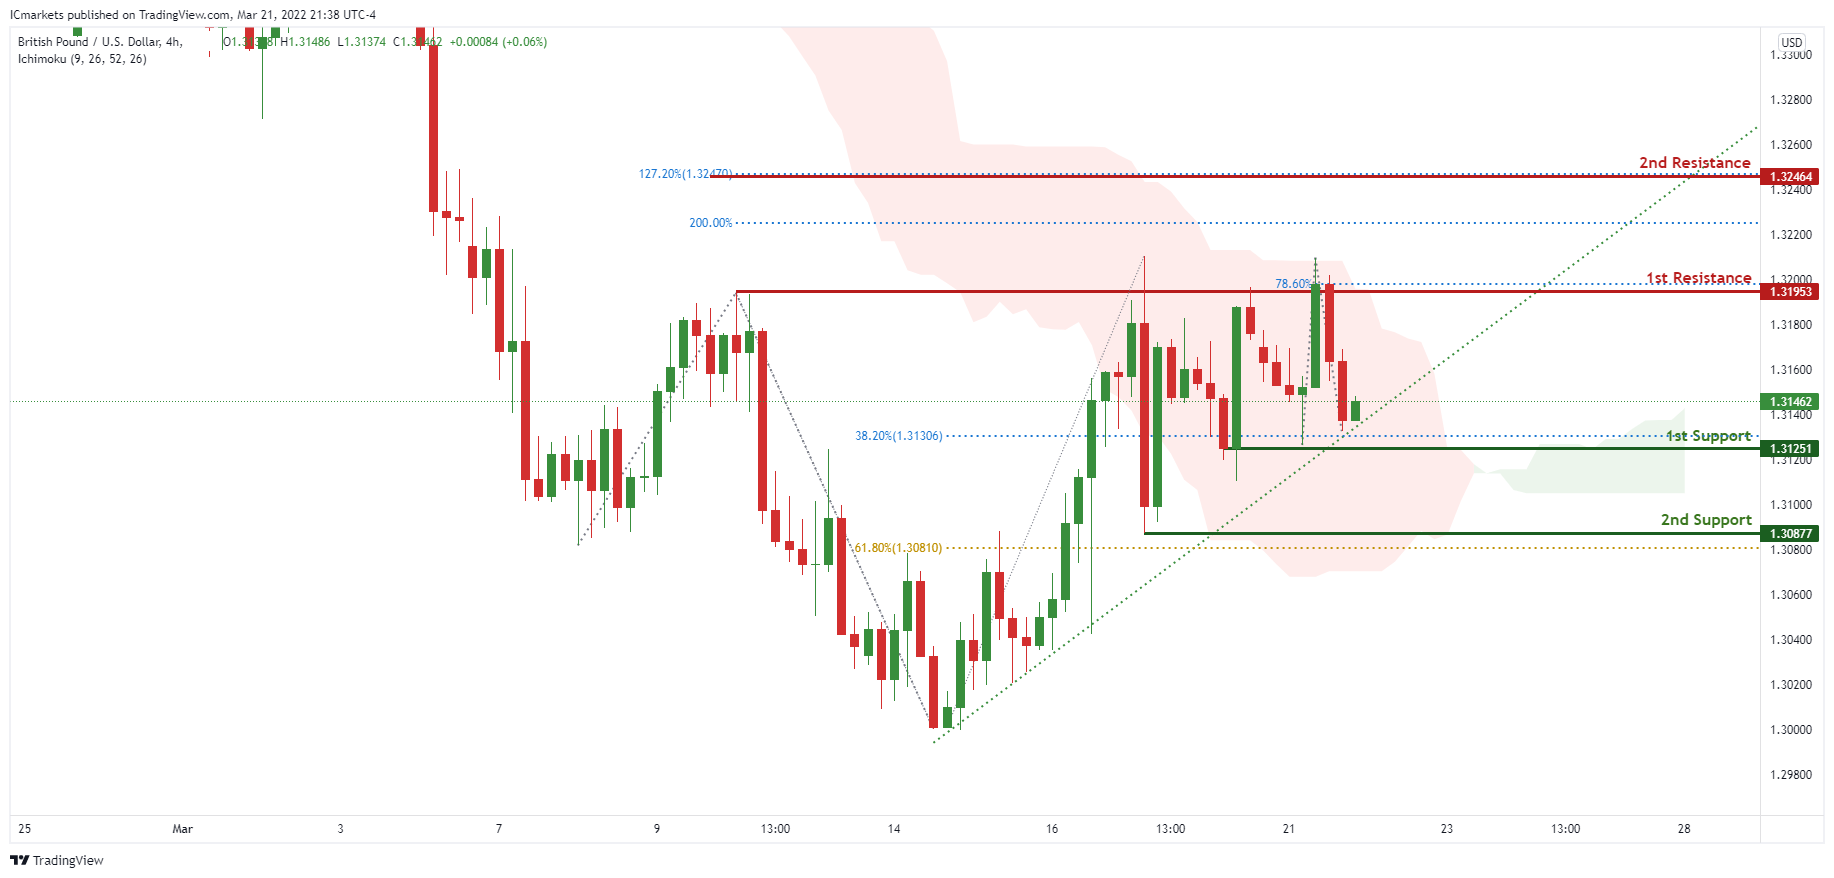
On the H4, prices are on bullish momentum and abiding to our ascending trendline support. We see the potential for further bullish continuation from our 1st support at 1.31251 in line with 38.2% Fibonacci Retracement towards our 1st resistance at 1.31953 in line with 78.6% Fibonacci Projection. Ichimoku clouds are forecasting the bullish clouds, further supporting our bias.
Areas of consideration
- H4 1st resistance at 1.31953
- H4 1st support at 1.31251
USD/CHF:
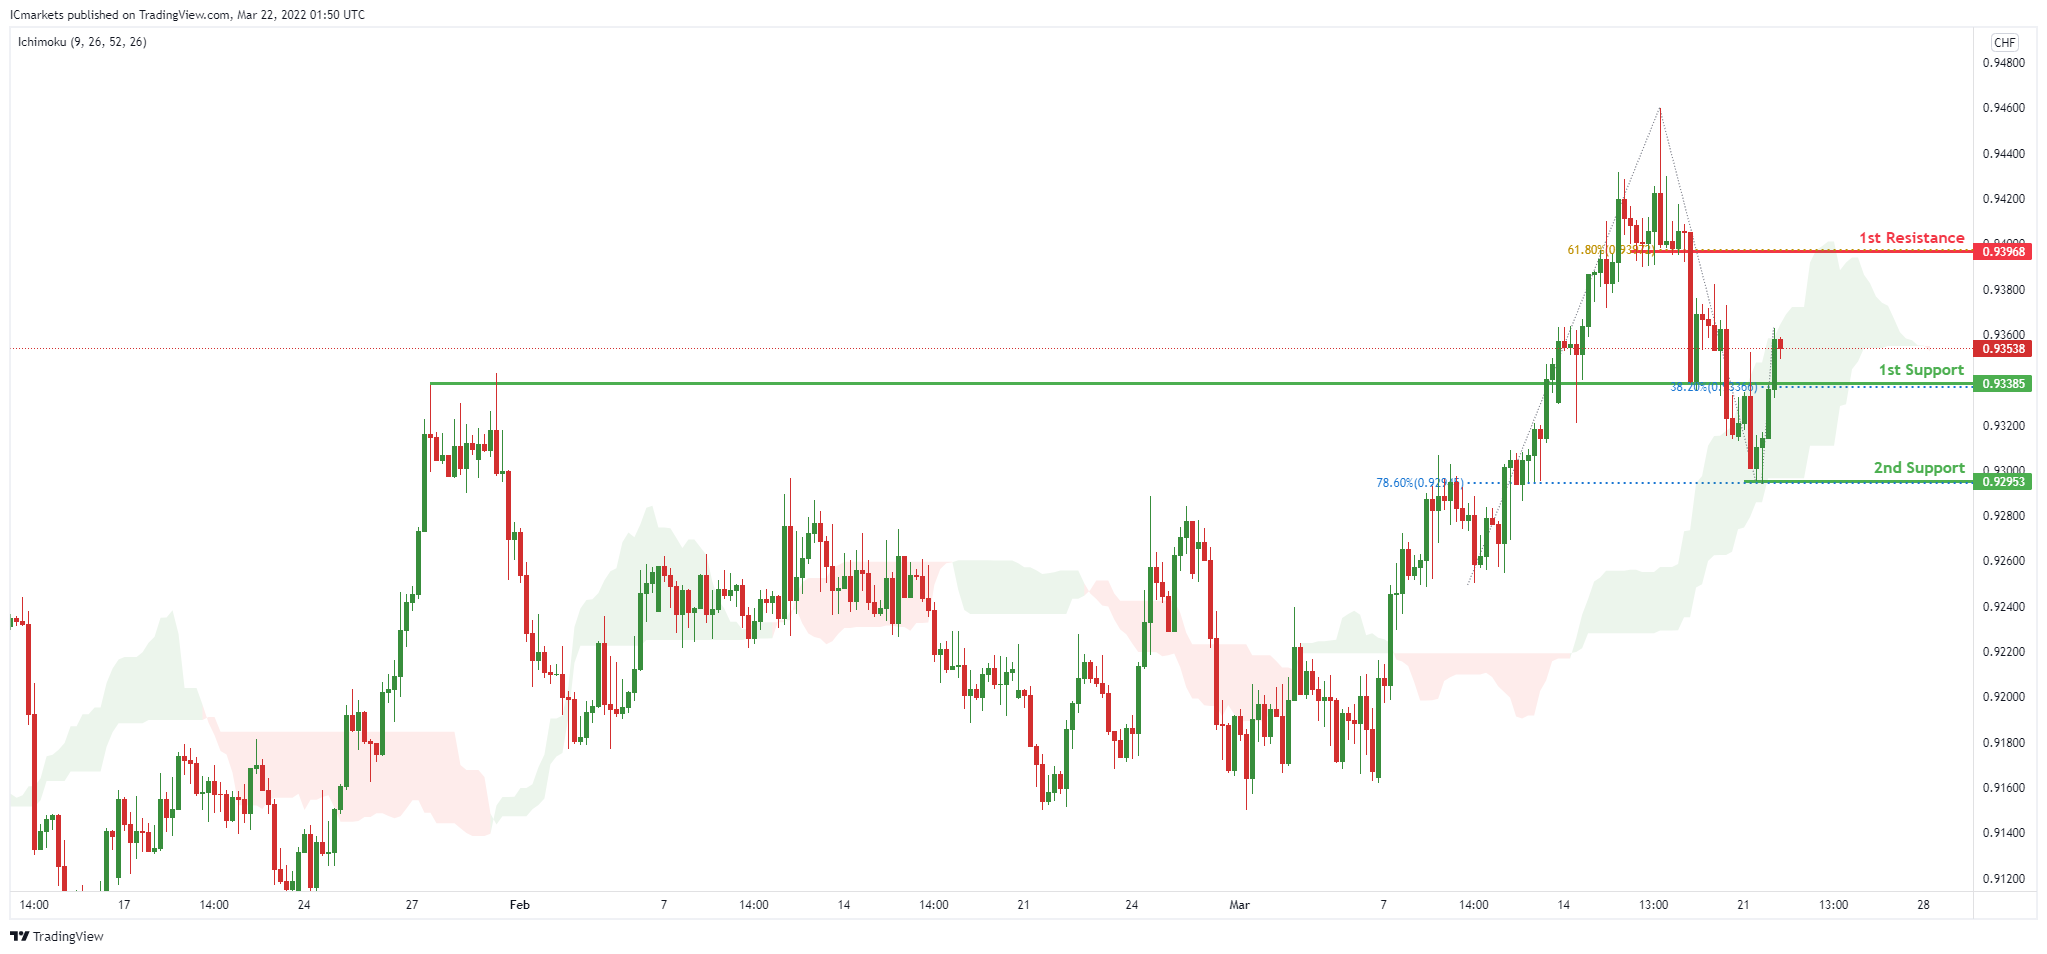
On the H4, with price moving above the ichimoku cloud, we have a bias that price will rise to our 1st resistance at 0.93968 in line with the 61.8% Fibonacci retracement from our 1st support at 0.93385 in line with the horizontal pullback support and 38.2% Fibonacci retracement. Alternatively, price may break 1st support structure and head for 2nd support at 0.92953 in line with the 78.6% Fibonacci retracement
Areas of consideration
- 1st support level 0.93385
- 1st resistance 0.93968
EUR/USD :
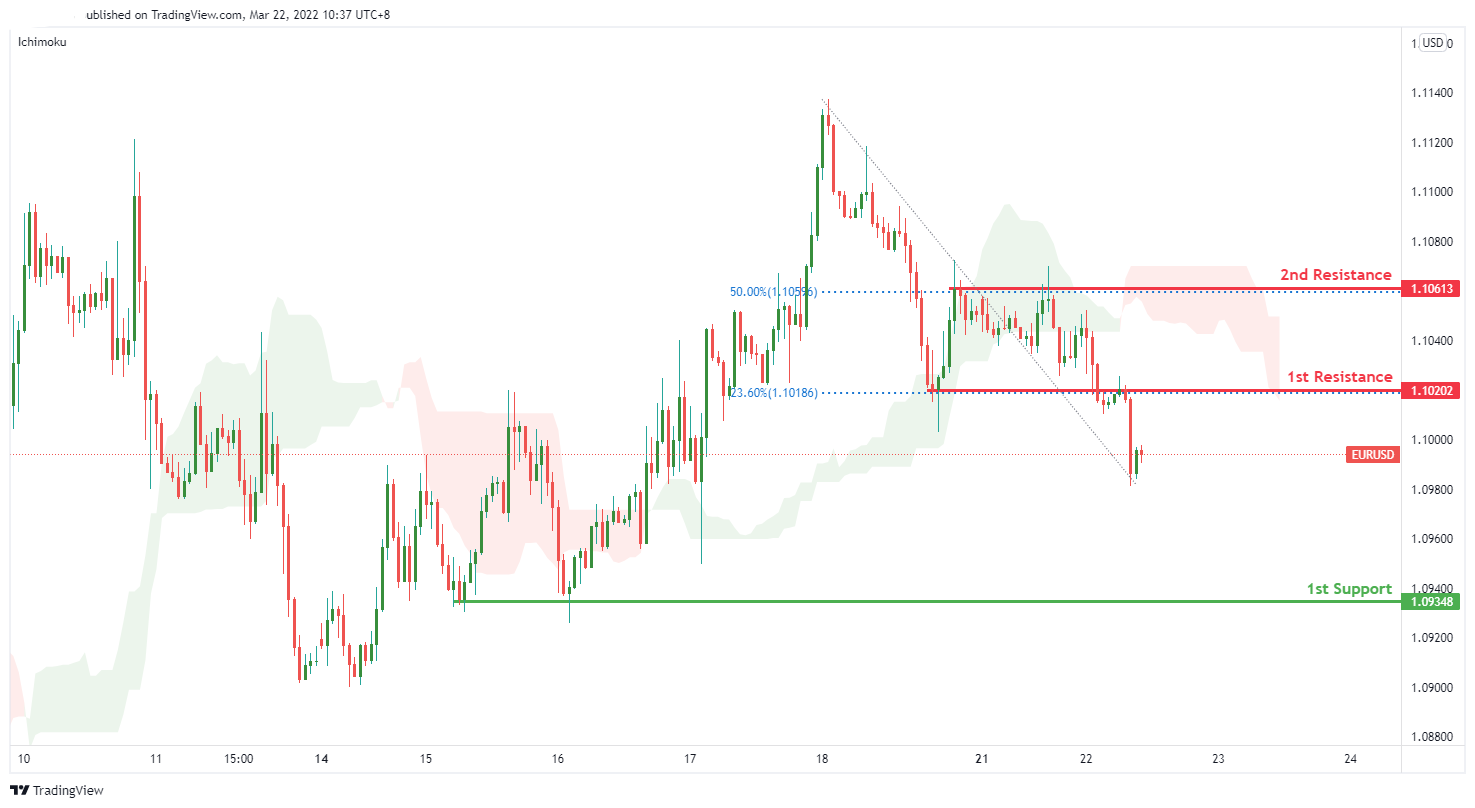
On the H1, price is near 1st resistance level of 1.10202 in line with 23.6% Fibonacci retracement. Price can move towards the 1st support level of 1.09367 which is in line with a graphical swing low support. Our bearish bias is supported by price trading under the Ichimoku cloud indicator.
Areas of consideration :
- H1 1st resistance at 1.10202
- H1 1st support at 1.09348
USD/JPY:
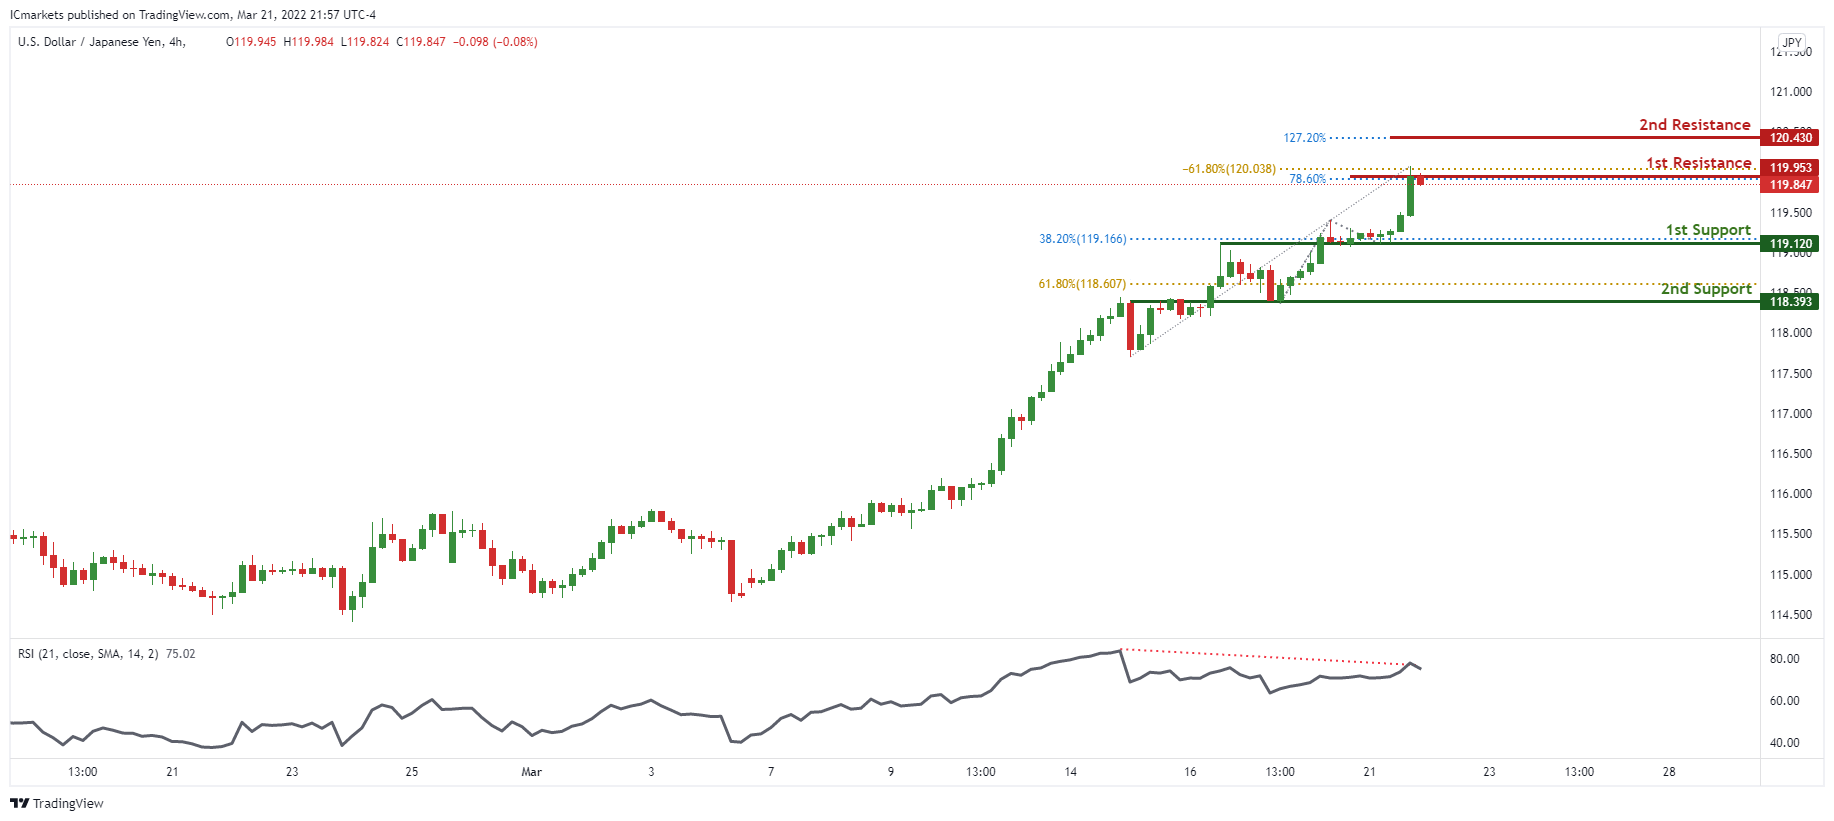
On the H4 timeframe, prices have approached pivot and swing high. We see the potential for a short pullback from our 1st resistance at 119.953 in line with -61.8% Fibonacci expansion and 78.6% Fibonacci projection towards our 1st support at 119.120 in line with 38.2% Fibonacci retracement. Divergence is spotted on RSI, further supporting our bearish bias.
Areas of consideration:
- H4 time frame, 1st resistance at 119.953
- H4 time frame, 1st support at 119.120
AUD/USD:
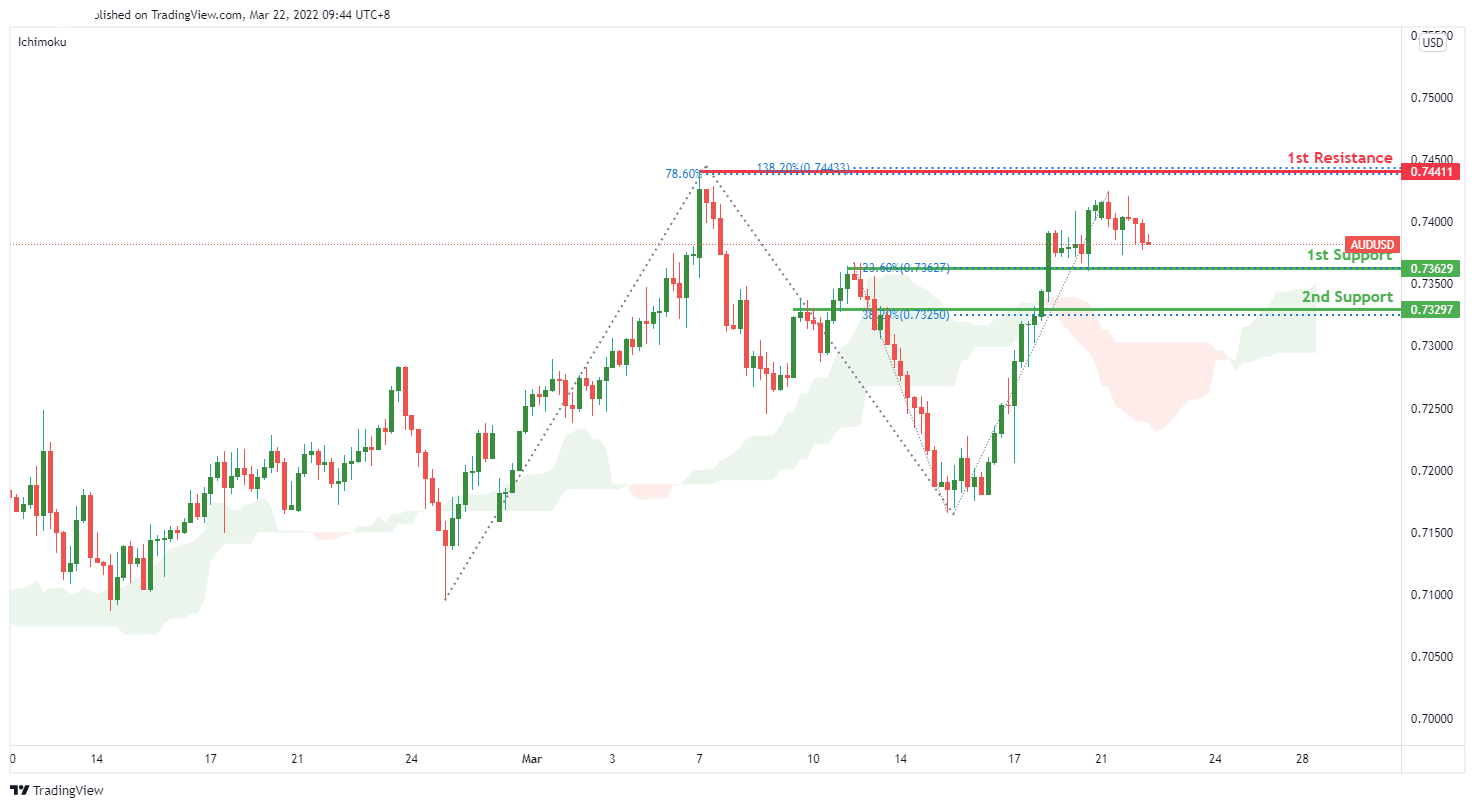
On the H4, price is near 1st support level of 0.73629 in line with 23.6% Fibonacci retracement. Price can move towards the 1st resistance level of 0.74411 which is in line with 138.2% Fibonacci extension and 78.6% Fibonacci projection.Our bullish bias is supported by price trading above Ichimoku cloud indicator.
Areas of consideration
- H4 1st resistance at 0.74411
- H4 1st support at 0.73629
NZD/USD:
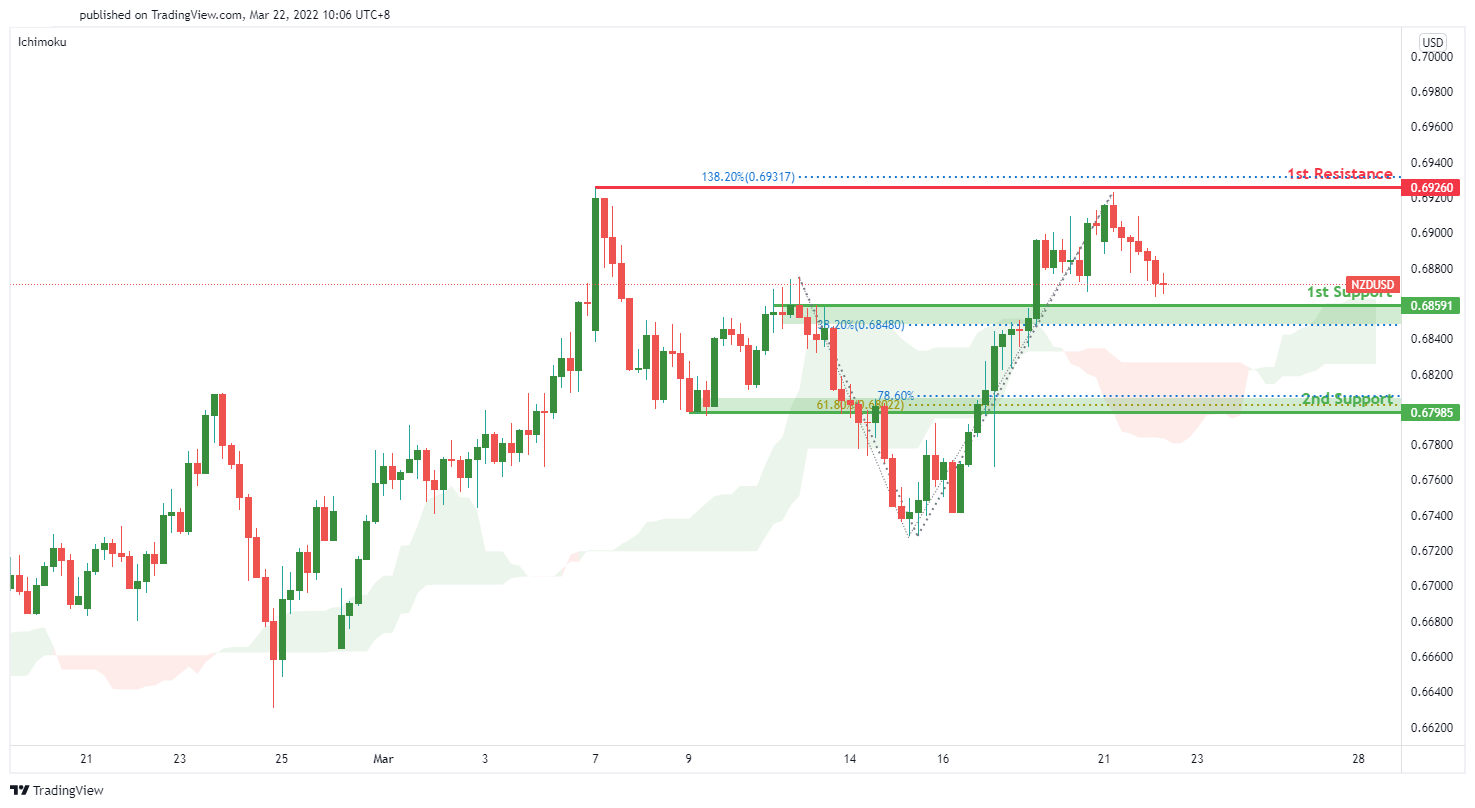
On the H4, price is near 1st support level of 0.68591 in line with 38.2% Fibonacci retracement. Price can move towards the 1st resistance level of 0.69260 which is in line with 138.2% Fibonacci extension.Our bullish bias is supported by price trading above Ichimoku cloud indicator.
Areas of consideration :
- H4 1st resistance at 0.69260
- H4 1st support at 0.68591
USD/CAD:
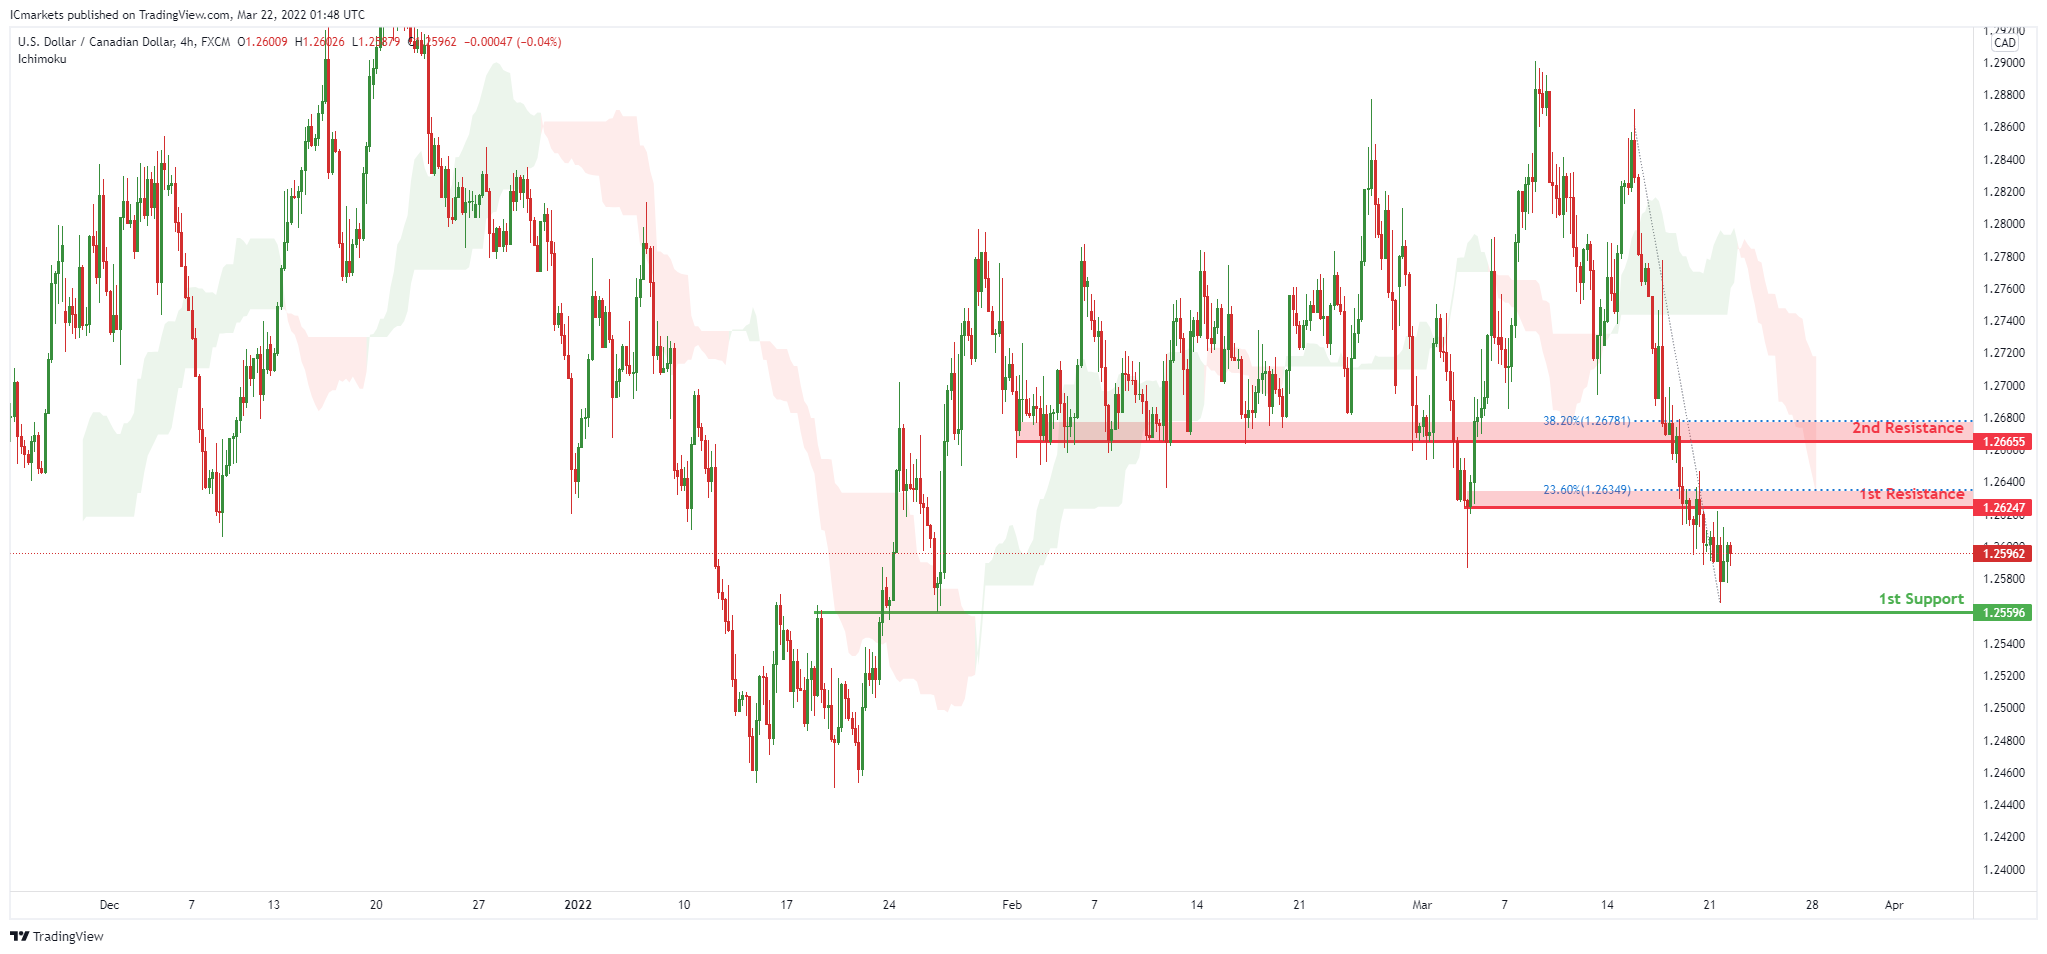
On the H4, with price moving below the ichimoku cloud, we have a bias that price will drop from 1st resistance at 1.26247 in line with the horizontal pullback resistance and 23.60% Fibonacci retracement to 1st support at 1.25596 in line with the swing low support .Alternatively, price may break 1st resistance and head for 2nd resistance at 1.26655 in line with the 38.2% Fibonacci retracement.
Areas of consideration:
- H4 time frame, 1st support at 1.25596
- H4 time frame, 1st resistance at 1.26247
OIL:
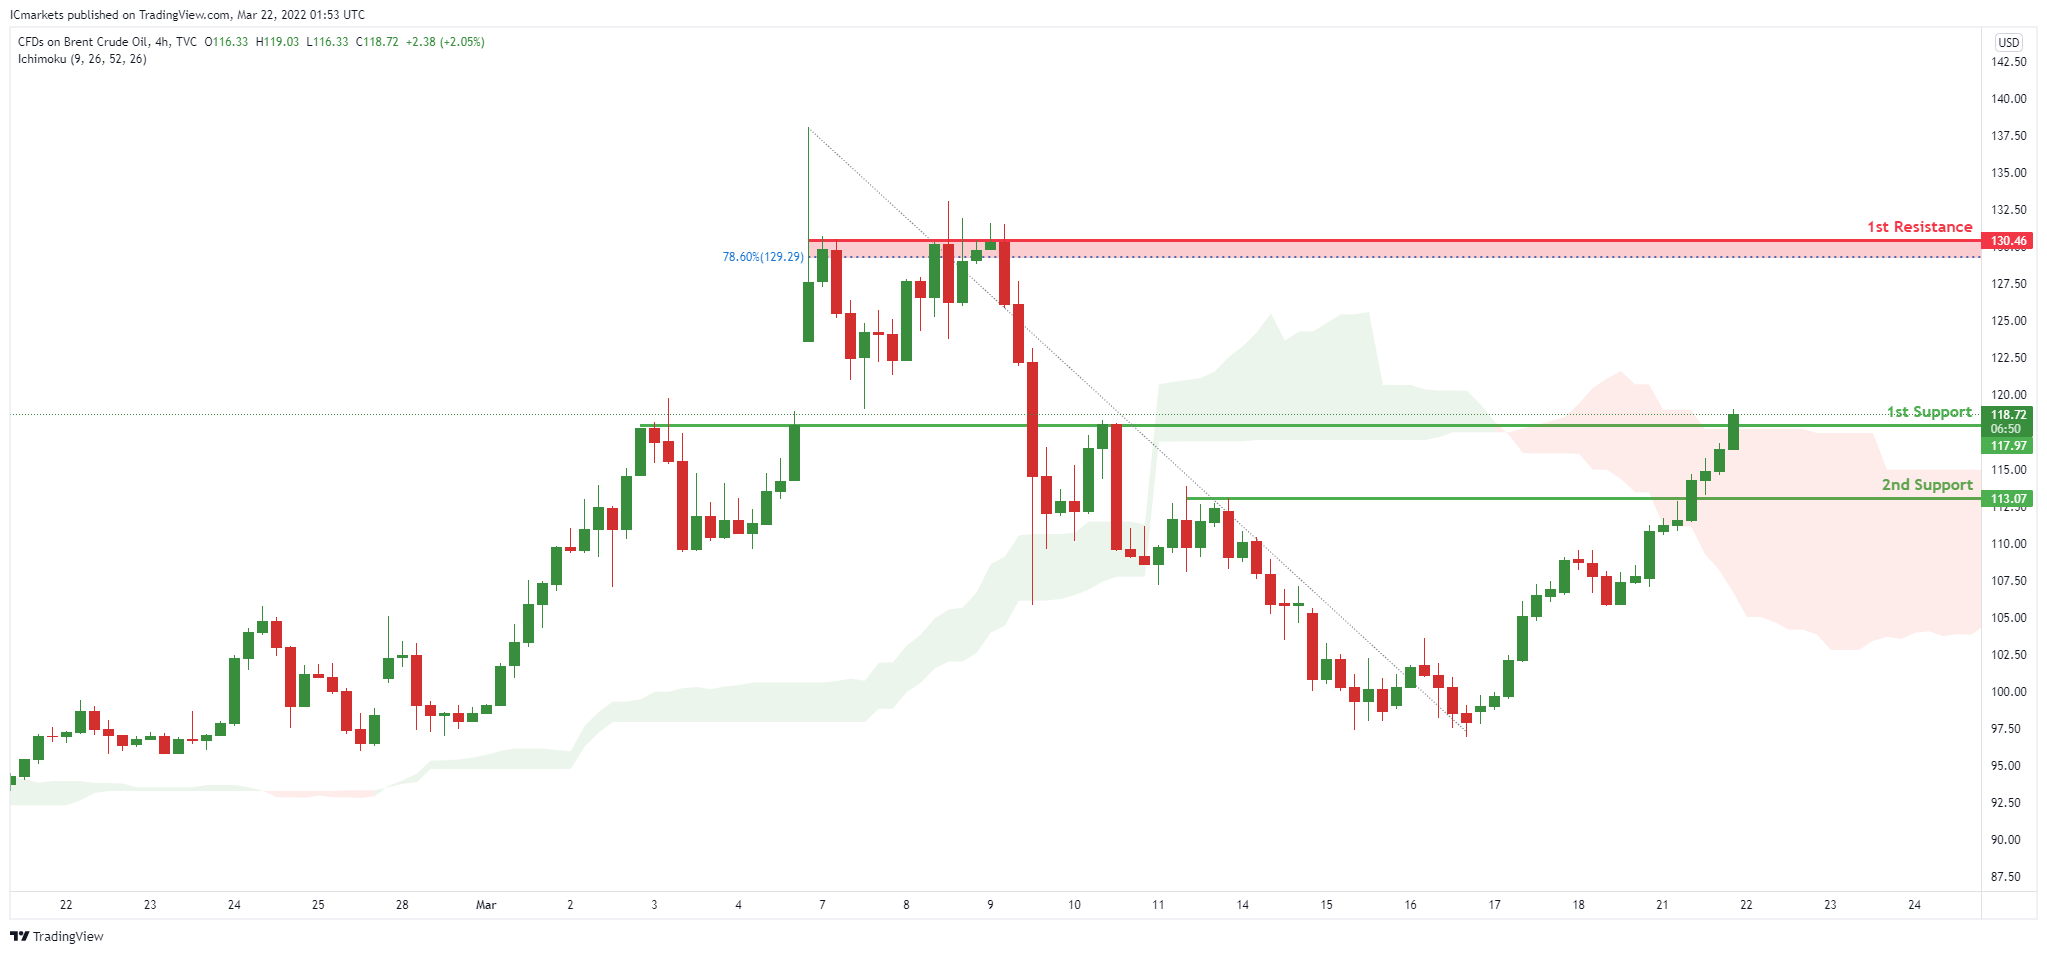
On the H4, with price moving above the ichimoku cloud, we have a bias that price will rise to our 1st resistance at 130.46 in line with the 78.6% Fibonacci retracement from our 1st support at 117.9 in line with the horizontal overlap support. Alternatively, price may break 1st support structure and head for 2nd support at 113.07 in line with the horizontaL overlap support.
Areas of consideration:
- H4 time frame, 1st resistance of 130.46
- H4 time frame, 1st support of 117.9
Dow Jones Industrial Average:
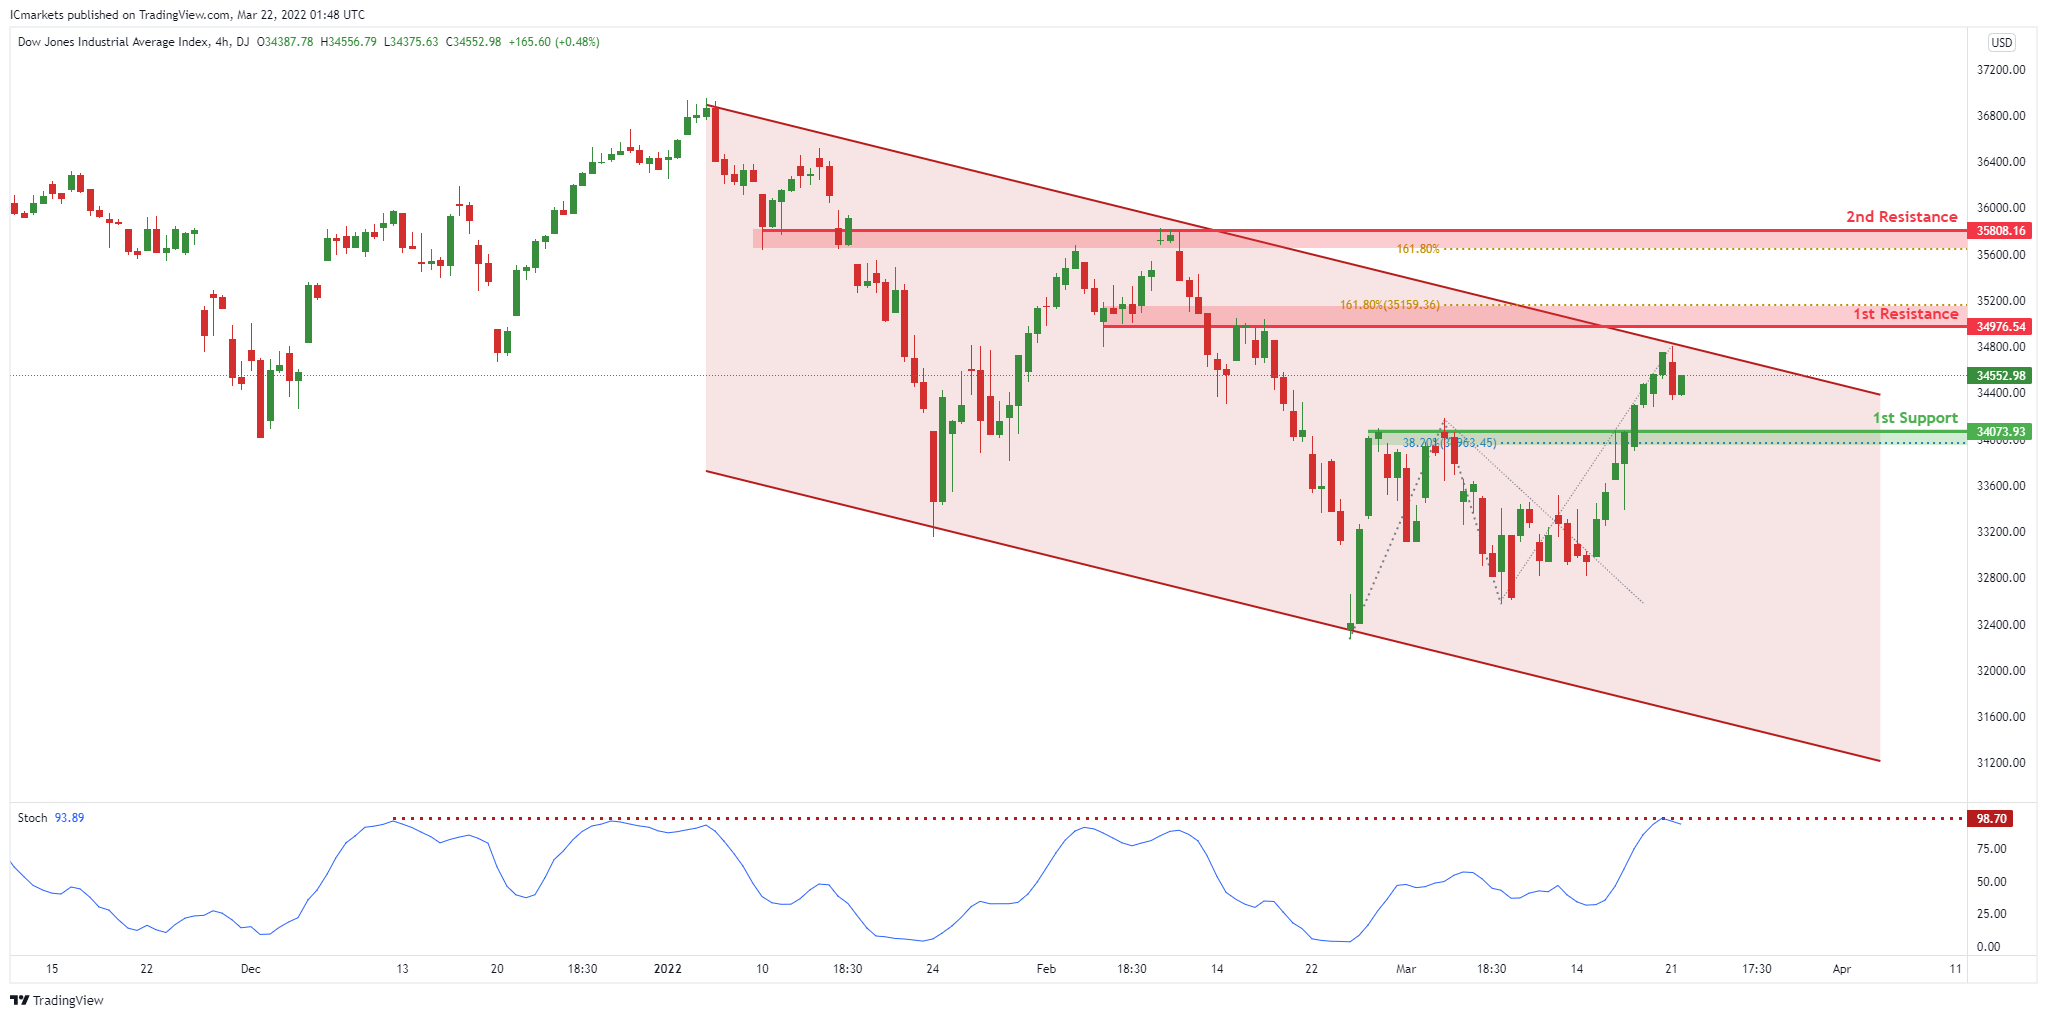
On the H4, with price expected to reverse off the stochastics level, we have a bias that price will drop from 1st resistance at 34976 in line with the horizontal overlap resistance and 161.8% Fibonacci extension to 1st support at 34073 in line with the pullback support .Alternatively, price may break 1st resistance and head for 2nd resistance at 35808 in line with the 161.8% Fibonacci extension.
Areas of consideration :
- H4 1st support at 34073
- H4 1st resistance at 34976
GBP/USD Could Extend Gains, Dollar Dips
Key Highlights
- GBP/USD started a fresh increase above the 1.3120 resistance.
- A key bullish trend line is forming with support near 1.3140 on the 4-hours chart.
- EUR/USD must clear 1.1120 to start a steady increase.
- Gold price is consolidating gains above the $1,900 support.
GBP/USD Technical Analysis
The British Pound started a fresh increase above the 1.3100 resistance against the US Dollar. GBP/USD even broke the 1.3150 resistance to move into a positive zone.
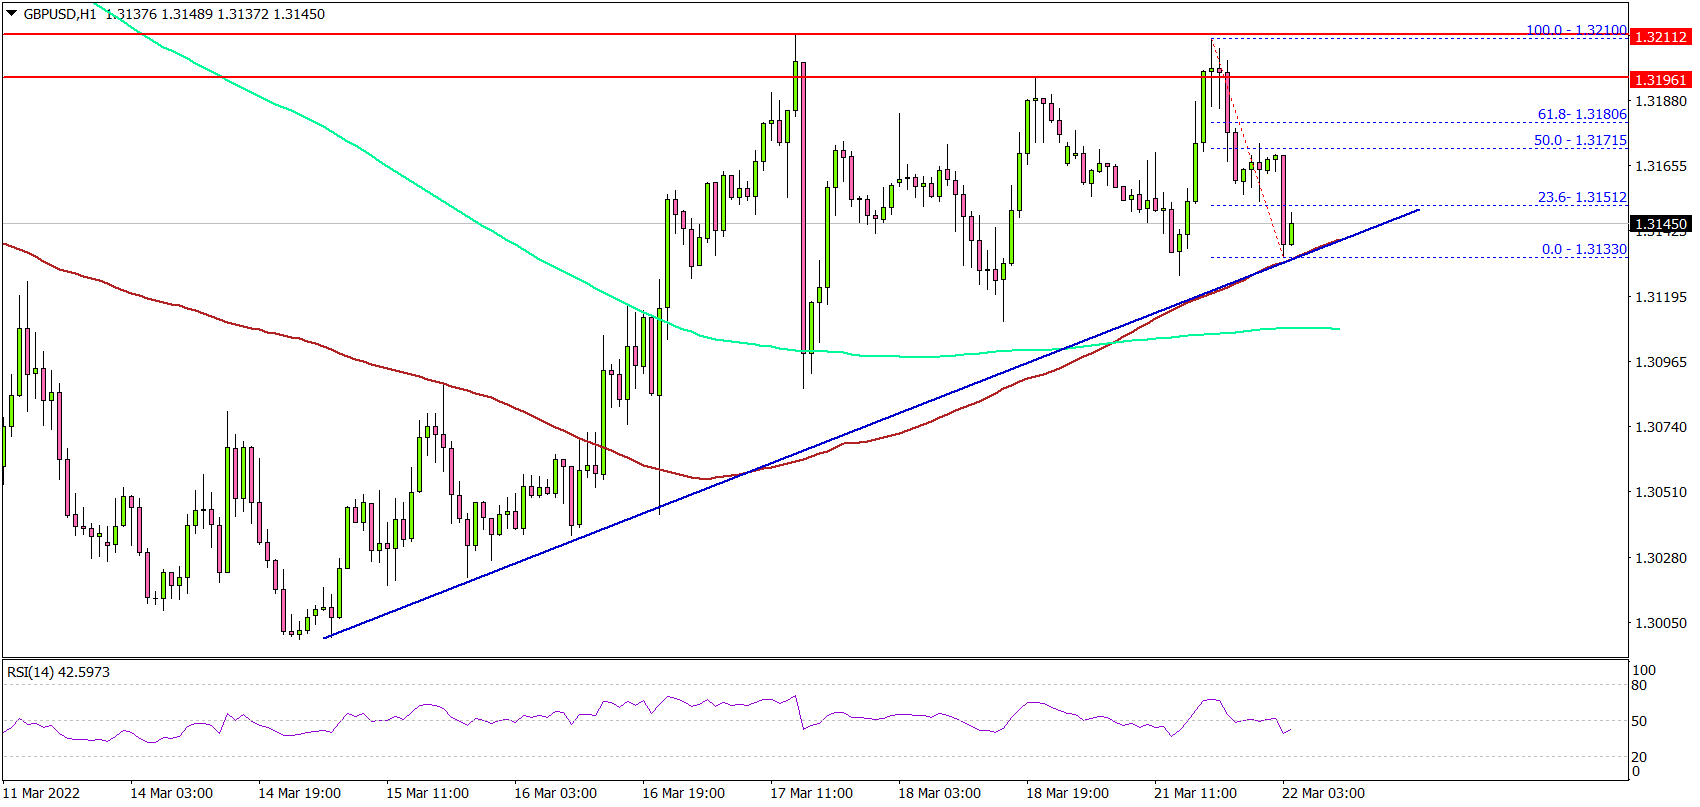
Looking at the 4-hours chart, the pair settled above the 1.3150 level, the 100 simple moving average (red, 4-hours), and the 200 simple moving average (green, 4-hours).
The pair made a few attempts to clear the 1.3200 and 1.3220 resistance levels. If there is a close above 1.3200, the pair could start another increase. In the stated case, the pair might rise towards the 1.3320 resistance zone.
On the downside, the pair might find support near the 1.3150 level. There is also a key bullish trend line forming with support near 1.3140 on the same chart.
A downside break below the trend line support could start a fresh decline towards the 1.3100 level. The next major support sits near the 1.3050 level.
Looking at EUR/USD, the pair is still struggling to clear the 1.1100 and 1.1120 resistance levels. On the downside, there is a key support sits at 1.0950.
Economic Releases
- ECB's President Lagarde speech.
Powell: Fed Could Hike by 0.5%
Jerome Powell's latest remarks caused a bit of panic as investors realised that the Fed is open to an even more aggressive rate hiking path. Powell noted that – if necessary – the Fed would be open to raising rates by a more aggressive 50-basis points at any of its upcoming meetings.
Powell said:
We will take the necessary steps to ensure a return to price stability…In particular, if we conclude that it is appropriate to move more aggressively by raising the federal funds rate by more than [a quarter-point] at a meeting or meetings, we will do so.
Following his comments, the major indices took a quick nosedive while the dollar found support and gold eased off its earlier highs, as yields soared. If it does hike by 50 bps, it would be the first time since May 2000 to do that. The Fed has already signalled a much stronger appetite to combat inflation, indicating a further 6 rate increases in 2022. But judging by Powell’s latest comments and those from some of the Fed officials, there is a good possibility that we may even see a 50 basis point increase in May. Let’s see if there is much appetite for that, and what plans they might have for running down the central bank’s $8.9 trillion balance sheet.
Ukraine-Russia uncertainty continues…
While Powell’s remarks have caused a bit of a sell-off in stocks, this comes on the back of a strong rally last week despite continued uncertainty surrounding the Ukraine and Russia.
On that front, no agreements have been reached yet in negotiations with Ukraine. Ukraine’s president has said his country could never surrender Kyiv, Mariupol or Kharkiv to Russia. Russia says there needs to be significant progress made first before a possible meeting between Putin and Zelensky. Last week, hopes over a possible deal had lifted sentiment in the market. Russia’s negotiator on Friday, for example, said that the two sides were now 'halfway there' on the issue of Ukraine's demilitarization, and that on the issues where their views are most-closely aligned is Ukraine's neutral status and not joining NATO. Let’s see if the gap closes in the days ahead, but it doesn’t look promising.
Still, if you look at the financial markets over the past week or so, it is as if the Ukraine war never happened, or the Fed was not very hawkish. Stock markets roared back higher to close solidly in the black last week. This was the second consecutive weekly positive close for European indices, but the first one for Wall Street and Asia Pacific (APAC) markets. STOXX Europe 600 erased all the losses it had suffered since the invasion of Ukraine began. Risk-sensitive commodity dollars surged higher, while safe-haven Japanese yen and gold slumped. Yen pairs had a wonderful week. Cryptocurrencies traded mostly higher. Crude oil bounced sharply off the lows but still ended lower for the second consecutive week. But that rebound has continued into the new week with Brent reaching $111 and WTI $108 per barrel. Oil prices must be watched closely given ongoing concerns over soaring inflation, as any further sustained pressure will intensify those concerns and potentially have repercussions elsewhere in the financial markets.
Economic data highlights for the rest of the week
In terms of macro data, the highlights include durable goods orders and housing market data. From the UK, we have CPI and retail sales, while in Switzerland, the SNB will be making a “decision” on interest rates. Hint: no rate increases are coming. Another set of key data will be the latest PMI numbers, due on Wednesday from Eurozone.
Tuesday 22 March
- Central bank speech: ECB’s Lagarde, FOMC’ Williams, SNB’s Jordan and MPC’s Cunliffe
- UK spring statement and Consumer Price Index (CPI) for February
- Central bank speech: BoE’s Bailey, FOMC’s Powell and Bullard
- SNB rate decision
- Flash PMIs from France, Germany and UK
- US durable goods orders, jobless claims and flash PMIs
- UK retail sales
- German Ifo
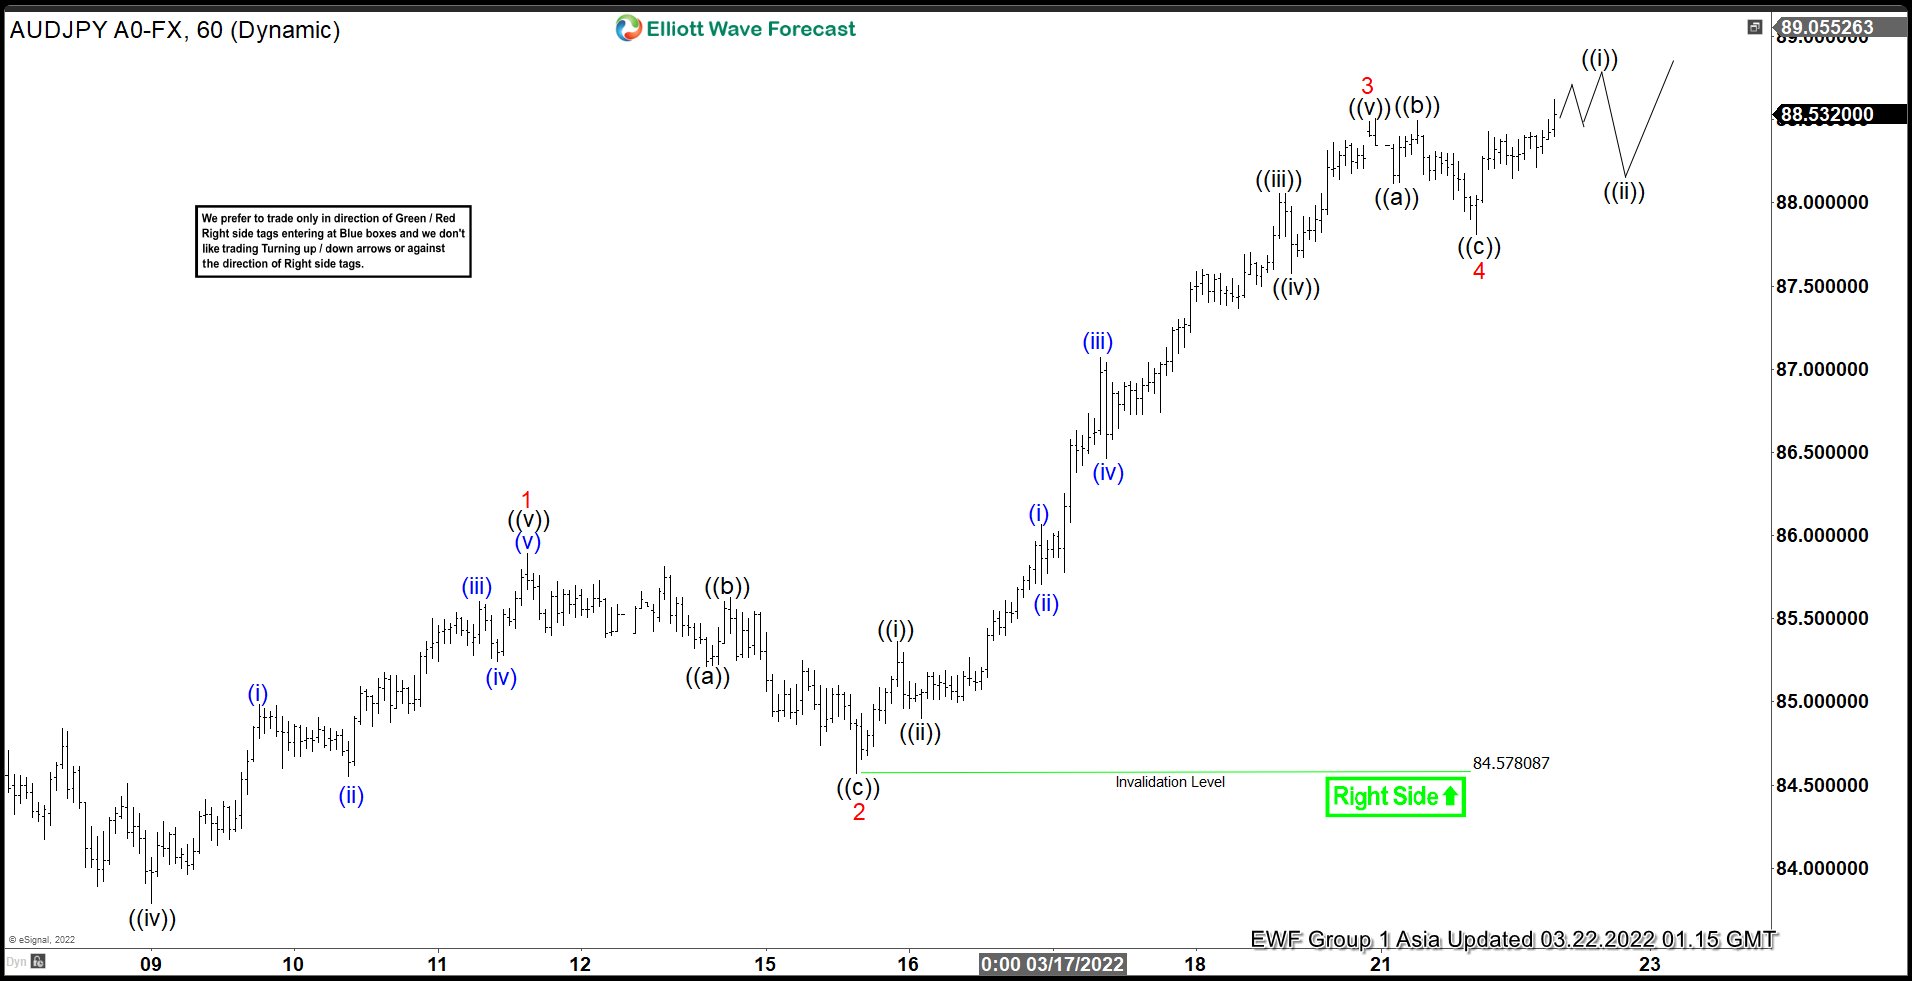
Elliott Wave View: AUDJPY Starts a New Bullish Cycle
AUDJPY manages to break above the previous daily high on October 21, 2021 at 86.26. This suggests that pair may have started a new bullish cycle. Short Term Elliott Wave View in the pair suggests the rally from January 29, 2022 low is unfolding as a 5 waves impulse. Up from January 29 low, wave 1 ended at 85.89 and pullback in wave 2 ended at 84.54. Pair then extended higher in wave 3 towards 88.5 with internal subdivision a 5 waves in lesser degree. Up from wave 2, wave ((i)) ended at 85.36 and wave ((ii)) ended at 84.9. Pair continued higher in wave ((iii)) towards 88.059, and wave ((iv)) ended at 87.57. Final leg wave ((v)) ended at 88.5 which also completed wave 3. Pullback in wave 4 ended at 87.81.
Wave 5 is currently in progress higher. Near term, as far as wave 2 pivot at 84.57 stays intact, pair should see further upside in 5 waves before ending wave 5. This should then end cycle from January 29, 2022 low and pair should see larger pullback to correct that cycle in the sequence of 3, 7, or 11 swing before the next leg higher again.
AUDJPY 60 Minutes Elliott Wave Chart
Brent Crude Oil Wave Analysis
- Brent crude oil reversed from key support level 95.00
- Likely to rise to resistance level 115.00
Brent crude oil recently reversed up with the daily Morning Star from the key support level 95.00 intersecting with the support trendline from December and the 61.8% Fibonacci correction of the sharp upward impulse from December .
The upward reversal from the support level 95.00 started the active short-term wave (b).
Brent crude oil can be expected to rise further toward the next resistance level 115.00 (target for the completion of the active short-term correction (b)).

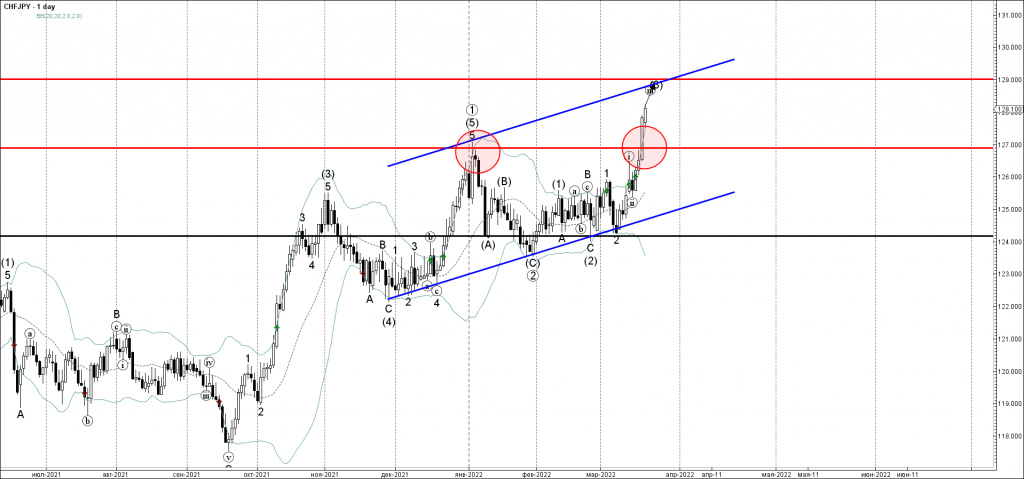
CHFJPY Wave Analysis
- CHFJPY broke key resistance level 127.00
- Likely to rise to resistance level 129.00
CHFJPY continues to rise after the earlier breakout of the key resistance level 127.00 (previous monthly top from January)
The breakout of the resistance level 127.00 accelerated the active short-term impulse wave (iii) of wave (3) from last month.
CHFJPY can be expected to rise further toward the next resistance level 129.00 (target for the completion of the active wave (3), intersecting with the daily up channel from December).
Eco Data 3/22/22
[php_everywhere instance="1"]
Dollar/Yen Closing in on 120 Level
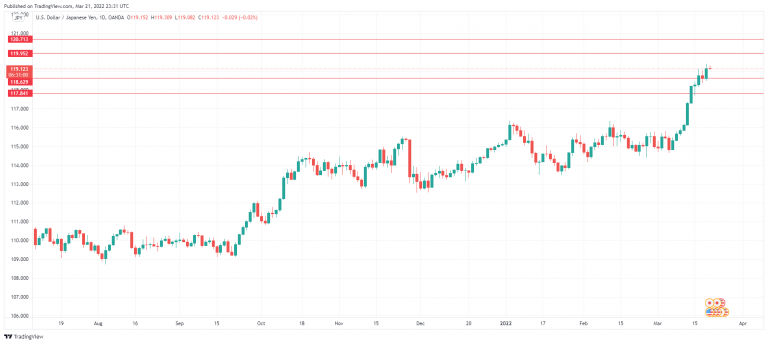
It was another dreadful week for the Japanese yen, which fell 1.60%. USD/JPY climbed as high as 119.39 on Friday, its highest level since February 2016. The yen has lost its footing, and the 120 line, which has psychological significance, is in danger of being breached.
Japanese yen headed for 120
The yen has traditionally served as a safe-haven asset in time of crisis, but the currency has not lived up to its reputation this time around. Risk appetite has taken some hits in the current turbulent landscape, with surging commodity prices and the war in Ukraine. Investors have responded by snapping up dollars rather than yen and commodities are priced in US dollars. As well, with US Treasury yields moving higher, the US/Japan rate differential has widened, which has boosted the US dollar. The yen has wilted in March, falling 3.67%, and it seems only a matter of time before USD/JPY breaks above the 120 level.
The Bank of Japan maintained interest rates at -0.10% at last week’s meeting, where they have been pegged for years. We’re seeing the major central banks embark on a tightening cycle, with the notable exception of the BoJ. The Bank not only said it would continue its quantitative and qualitative easing policies for as long as needed but stated that it could take further easing measures due to Covid-19. The possibility of further easing is putting more pressure on the struggling yen.
The war in Ukraine has dragged on for a month, and the Russian invasion has stalled in the face of stiff Ukrainian resistance. Civilian casualty figures continue to rise as Russia has stepped up its campaign of hitting civilian targets. Over the weekend, the Turkish foreign minister said that the two sides were making progress on a peace agreement, but previous such announcements all proved to be premature. If there are tangible signs of progress towards a ceasefire, we could see risk apprehension fall and a rotation out of US dollars.
USD/JPY Technical
- USD/JPY faces resistance at 119.94 and 120.72
- There is support at 118.62 and 117.84