Sample Category Title
Market Will be Flooded With Comments from Fed and ECB Policy Makers
Markets
With still only mixed signals on any progress in the negotiations between Ukraine and Russia, European investors on Friday initially took some chips off the table after last week’s rally. US investors were less worried on the impact on their economy. US indices gained 0.80% (Dow) to 2.05% (Nasdaq). European equities also reversed losses (EuroStoxx +0.44%).
In the wake of last week’s policy meeting, Fed hawks Waller and Bullard were the first speakers to defend/reinforce their view. Waller openly voiced support for a 50 bps hike at one of the coming meetings. Bullard already dissented for such a step last week and sees a good reason for a 3%+ policy rate end this year. These comments don’t express the Fed consensus but are signs the FOMC is prioritizing inflation.
The US yield curve flattened with the 2-year rising 2.25 bps while the very long end declined 4.9 bps (30-y). Changes in European yields were limited with German yields finishing unchanged (2-y/30-y) to 1.2/1.3 bps lower for the 5/10 y sector.
The dollar rebounded after a rather dismal post-Fed performance. Gains were modest still given growing interest rate support at the short end of the curve. DXY closed at 98.23, off the intraday top near 98.62. The euro lost traction with EUR/USD finishing at 1.1051 (from 1.1091). Sterling regained most of Thursday’s post-BoE losses (cable close 1.3878; EUR/GBP declined to 0.8386 from 0.8435) even as UK yields decline further (2-y -8.9 bps).
This morning, Chinese markets are turning to a wait-and-see approach as they look for more concrete action from authorities to support growth as signaled last week. Chinese banks kept their 1 and 5 year prime loans rates unchanged.
A rebound in crude oil (Brent $ 111.25) illustrates that geopolitical tensions keep their grip on markets with ongoing mixed headlines on any progress to solve to crisis in Ukraine and tensions in the Middle East (Houti attacks on Saudi installations). This might set the stage for a mild risk-off start in Europe this morning.
The US eco calendar is thin this week. The EMU PMI’s will be published on Thursday. Aside from geopolitical headlines, the market will be flooded with comments from Fed and ECB policy makers. Today’s speakers already include ECB’s Lagarde, Makhlouf and Nagel. On the Fed side Bostic and Powell will speak at the NABE conference.
Even as, especially Fed, speakers will reiterate their priority on reining in inflation, especially yields at longer term maturities might be heading for some short-term consolidation/pause with resistance at 2.24% for the US 10-y yield. The German 10-y yield also shows signs of a pause near the 0.40/0.41% area.
Recently, a cautious risk sentiment combined with higher oil/commodity prices favoured the dollar over the likes of the yen, but also over the euro. EUR/USD 1.1121/37 looks like a rather solid resistance short-term.
The UK calendar this week contains CPI data, PMI’s and retail sales. Markets will also look out whether UK Fin Min Sunak will use any budgetary room to alleviate the sharp decline in citizens disposable income (budget statement Wednesday). A post BoE setback of sterling last week was short-lived even as short-term rates declined. EUR/GBP 0.8458/78 remains a high profile resistance for further EUR/GBP gains. In Belgium, the debt agency today sells 2032, 2040 and 2029 bonds in a regular auction.
News Headlines
The Australian government announced an alumina export ban to Russia. The country relies on Australia for nearly 20% of its alumina needs. The move will limit Russia capacity to produce aluminum, which is a critical export for Russia. In a statement, the government added that it will work closely with exporters and peak bodies that will be affected by the ban to find new and expand existing markets. Aluminum prices spike around 5% higher this morning.
Rating agency S&P raised the outlook on the Spanish A rating from negative to stable. The medium term outlook for Spanish growth is favourable, with tourism positioned for a strong 2022-2023 recovery and €150bn (11.5% of GDP) in Next Generation and EU budgetary grants to be disbursed from 2022-2027. Fiscal performance is improving, but continues to lag peers. External surpluses and benefits from E(M)U membership are other long term positives. S&P uses the best credit rating for Spain amongst majors, with Fitch (A-) and Moody’s (Baa1) rating the country respectively one and 2 notches lower.
Daily Technical Analysis
EUR/USD
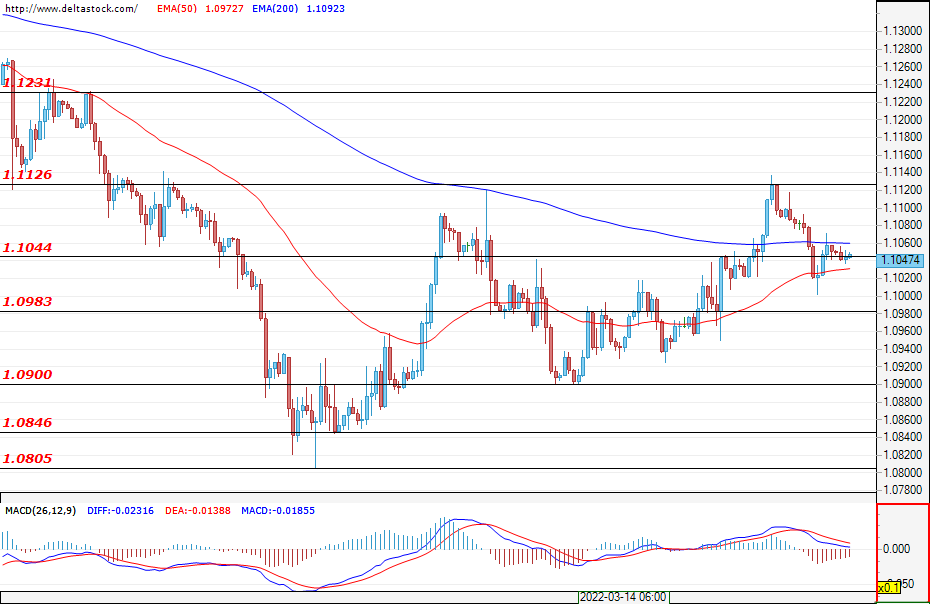
Last week, the pair managed to finish in green territory and broke a streak of five consecutive losing weeks. The bulls managed to test the resistance at around 1.1125 and the response of the bears was not late. In the early hours of today, prices gravitate around the 1.1044 support, however expectations are for a second test of 1.1125. The first support for buyers is the area at around 1.0980 – 1.1000. The area at around 1.0900 is the weekly support and it is expected to hold off a possible bearish pressure. The market is trying to move upwards and the lower time frames already reveal new peaks and successive higher lows. In order for the transition to be completed, however, prices would first need to overcome the barrier at 1.1360. The zone to watch is 1.1125 as it will signal for the development of this scenario. In case the bulls fail their attack, then the correction should continue and the main support will remain in the zone between 1.0900 and 1.0850.
USD/JPY
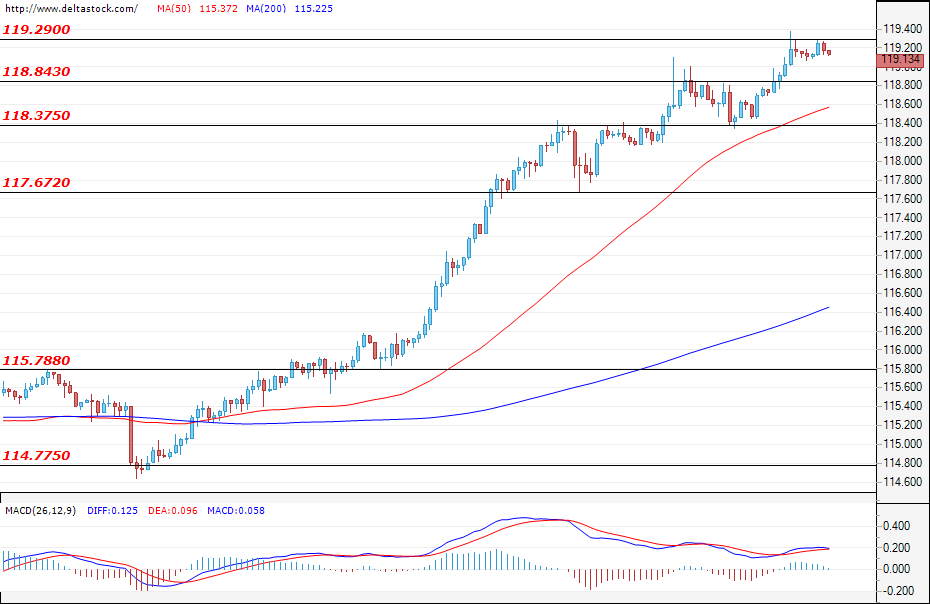
The uptrend for the Ninja remains strong and the market managed to form several supports over the past week. Pullbacks in the trend are shallow and are caused by realised profits rather than the bears entering the market. The support at 118.84 has not yet been tested and confirmed and 118.37 can be noted as the main one, followed by the weekly level of 117.67. If the rally continues, then the next target may be 121.20, but should the market enter a corrective phase, then it is expected to be limited by the support at 117.67.
GBP/USD
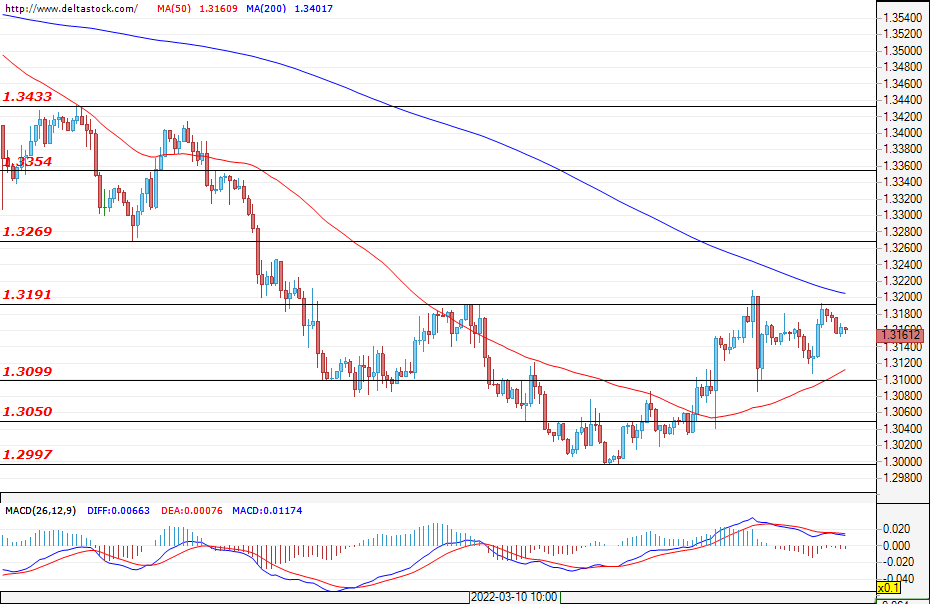
The British pound also performed well last week as the bulls are trying to reverse the downtrend. The market managed to form support at around 1.3100 and it will be the first support for today. The current price structure can be interpreted as an inverted "head and shoulders" figure, which is a formation signalling a trend reversal. A confirmation of this formation would be a breach of 1.3191, followed by corrective movement and a successful test of the figure’s “neck” zone. Upon completion of the formation, a subsequent rally with the potential to reach the resistance at around 1.3400 can be expected.
EUGERMANY40
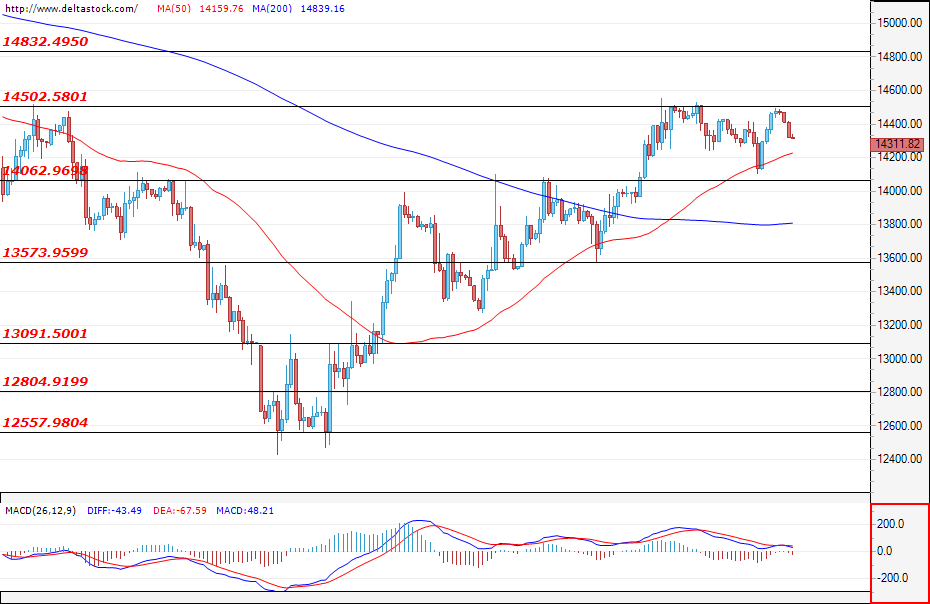
The German index continued its recovery throughout last week and is currently limited by the resistance zone at 14500. There is no significant change in the fundamental factors and the recovery may be purely mechanical. With a new impulse move and a breach of 14500, a test of 14830 can be expected. This zone comes from the higher time frames and has been supporting the market since April 2021. Even if it is reached, however, expectations are for a follow-up aggressive bearish pressure around this level. Their first support for today the bulls can expect at about 14060, while the main weekly one sits at 13570.
US30
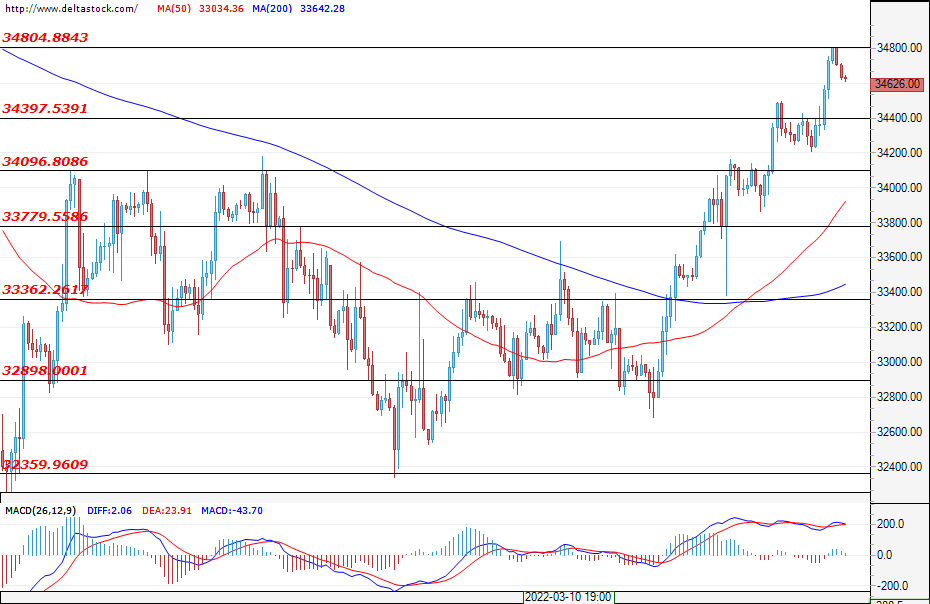
The U.S. blue chips marked a stunning recovery last week. The index managed to overcome the key resistance at 34100 and this should contribute towards improved sentiment. The first local support is 34400 and significant support buyers can expect at around 34100. The market is likely to reverse part of its gains, and given the higher volatility, the cycle may deepen towards 33780. The months of April and May are traditionally favourable for the U.S. markets and so the recovery may still have some fuel left in its tank. With a breach of 34800, the next targets for the bulls could be the levels of 35050 and 35690.
Gold Struggles to Extend Declines after Hitting a Floor at 1,920
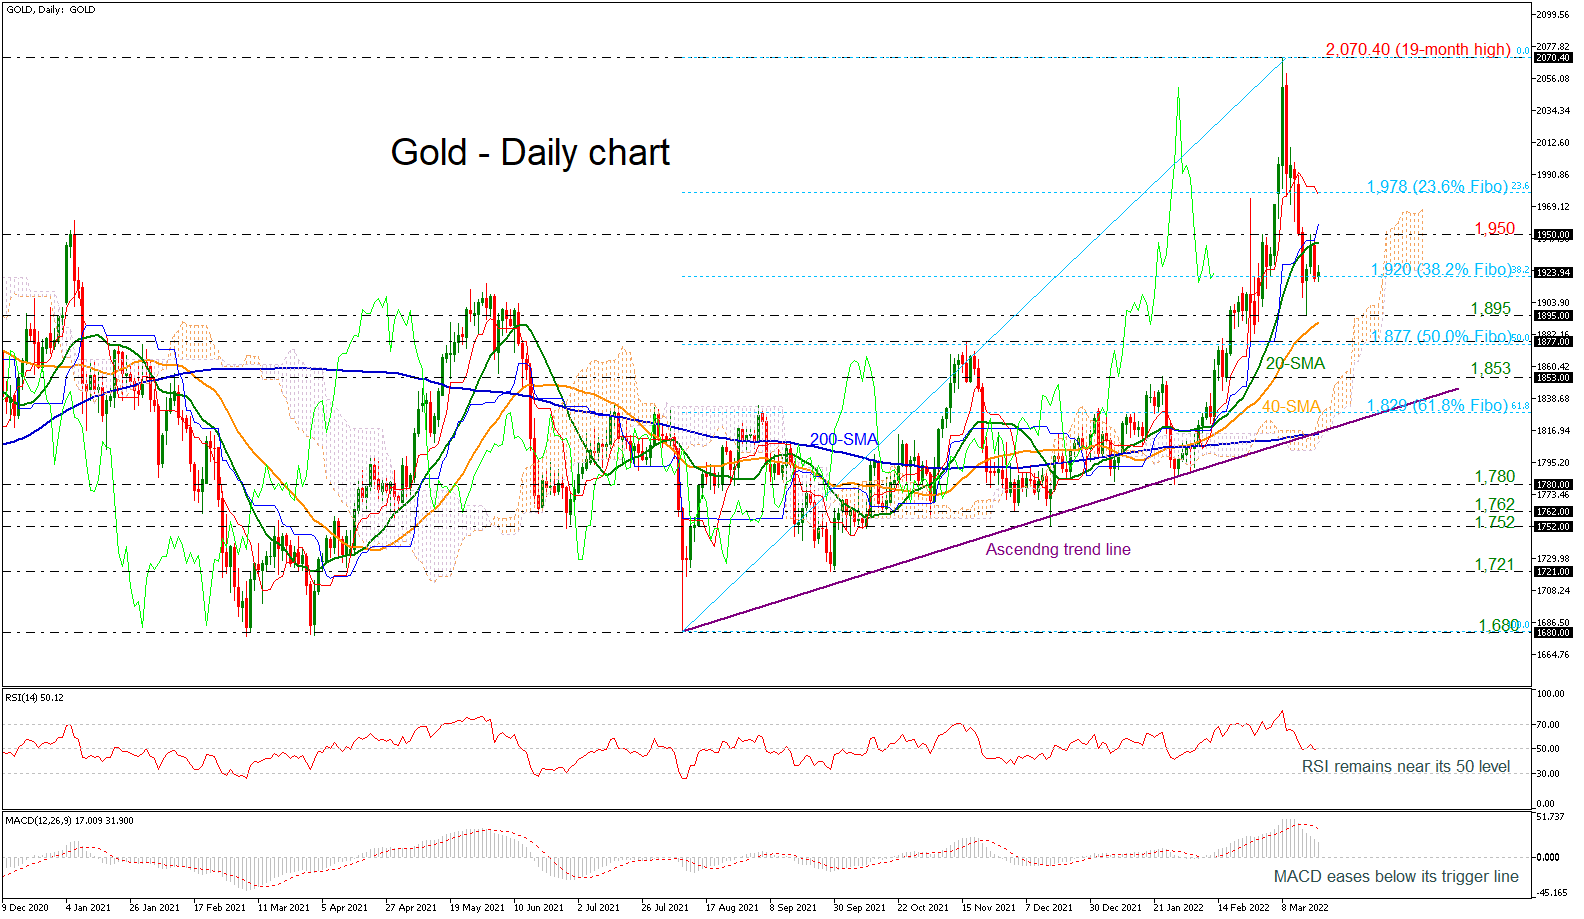
Gold prices are continuing last week’s move around the key level of 1,920, which is the 38.2% Fibonacci retracement level of the up leg from 1.680 to 2,070.40 and at the same time is confirming the pullback from the 1,950 resistance and the 20-day simple moving average (SMA).
The short-term bias looks negative as the MACD keeps losing ground below its red signal line, while the RSI seems to be making its way near its 50-neutral mark, though a further decline is needed from both indicators to confirm the negative momentum.
The 1,895 support and the 40-day SMA currently at 1,890 could be a trigger point for steeper bearish action if the pair manages to break the 38.2% Fibonacci. Lower, support could come towards from the 50.0% Fibonacci at 1,877, a strong barrier last year, though more sellers could take the price until the 1,853 key level, which stands slightly above the uptrend line.
However, if the pair reverses back to the upside, investors could watch first the 1,950 resistance and then the 23.6% Fibonacci of 1,978, which overlaps with the red Tenkan-sen line of the Ichimoku indicator. If the price continues to rise, resistance could next come somewhere near the 19-month high of 2,070.40.
In the short-term picture, the pullback off the multi-month high turned the strongly bullish outlook to negative.
However, in the bigger picture, chances for another bullish move are still rising as the yellow metal is still holding above the ascending trend line and the 200-day SMA.
EUR/CHF Daily Outlook
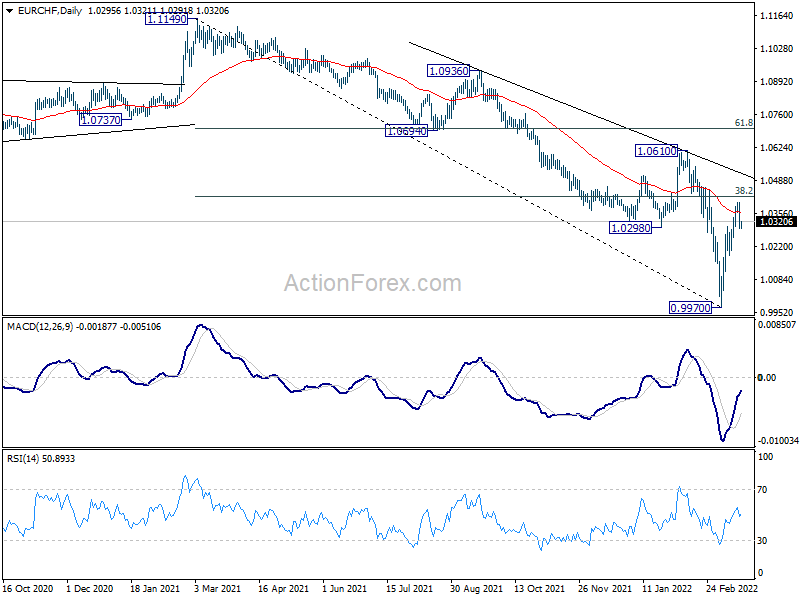
Daily Pivots: (S1) 1.0259; (P) 1.0330; (R1) 1.0368; More....
Intraday bias in EUR/CHF remains neutral first. On the upside, break of 1.0400 would resume the rebound to 1.0610 key structural resistance. However, break of 1.0184 minor support will argue that the rebound is finished, ahead of 38.2% retracement of 1.1149 to 0.9970 at 1.0420. In this case, intraday bias will be turned back to the downside for retesting 0.9970 low.
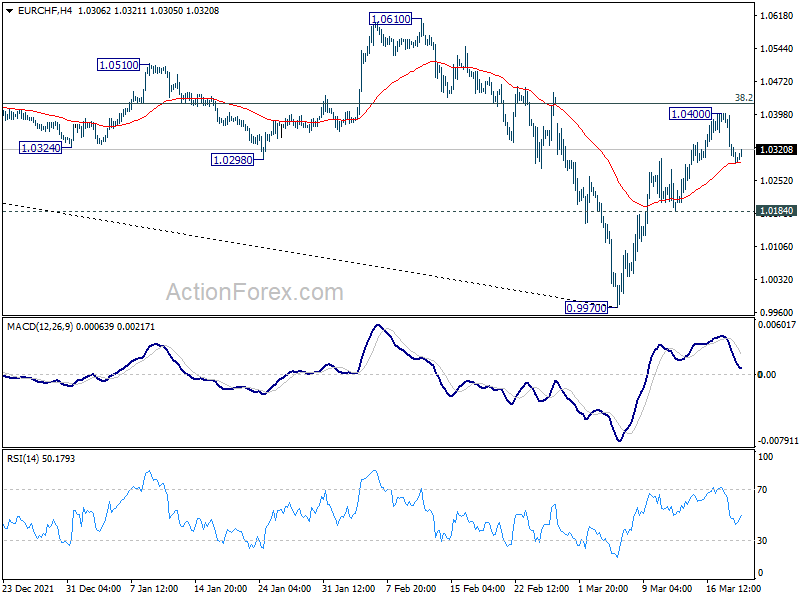
In the bigger picture, long term down trend from 1.2004 (2018 high) is still in progress. Next target is 100% projection of 1.2004 to 1.0505 to 1.1149 at 0.9650. In any case, sustained break of 1.0505 support turned resistance is needed to be the first sign of medium term bottoming. Otherwise, outlook will remain bearish.
EUR/AUD Daily Outlook
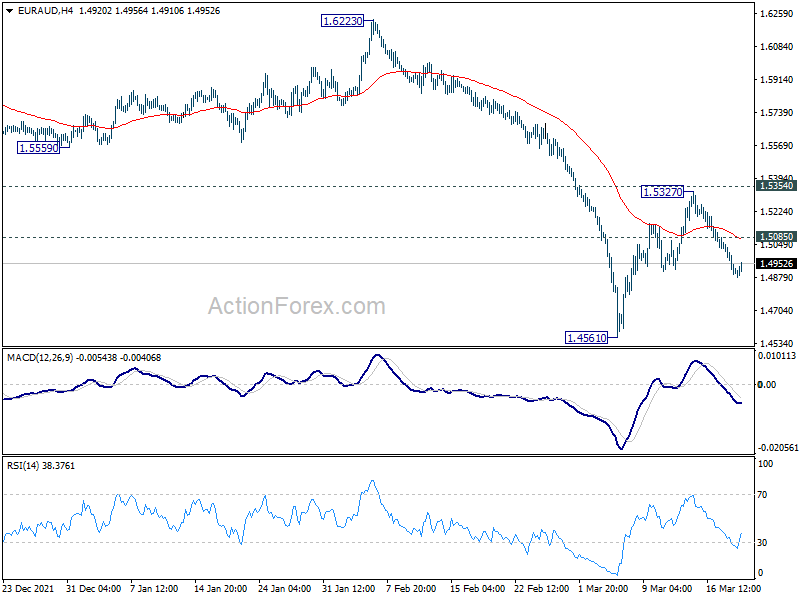
Daily Pivots: (S1) 1.4850; (P) 1.4950; (R1) 1.5007; More...
Intraday bias in EUR/AUD is mildly on the downside for the moment. Rebound from 1.4561 could have completed at 1.5327, ahead of 1.5354 support turned resistance. Deeper fall would be seen back to retest 1.4561 low. However, break of 1.5085 minor resistance will turn bias back to the upside for 1.5237, and possibly another take on 1.5354.
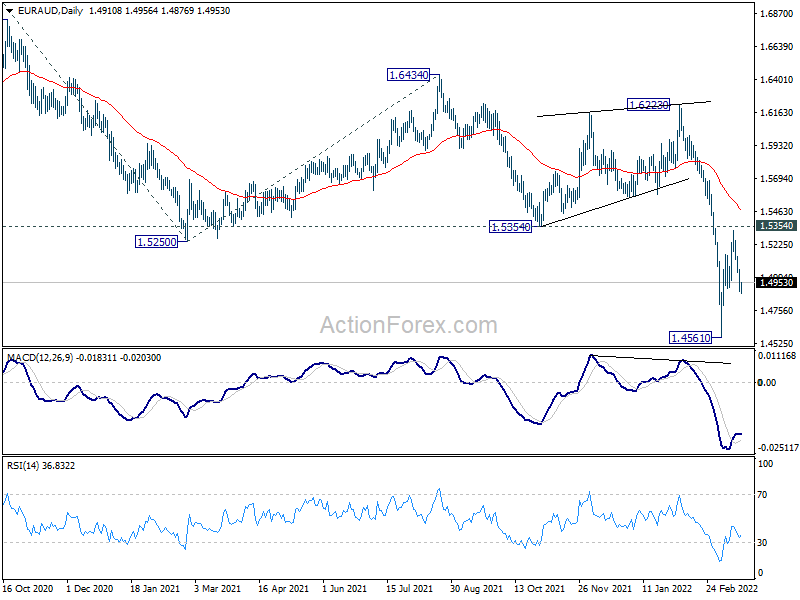
In the bigger picture, fall from 1.9799 is seen as a long term impulsive move. Next target is 61.8% projection of 1.9799 to 61.8% projection of 1.9799 to 1.5250 from 1.6434 at 1.3623, which is close to 1.3624 long term support (2017 low). Some support could be seen there to bring interim rebound. But overall, break of 1.5354 support turned resistance is needed to be the first sign of medium term bottoming. Otherwise, outlook will stay bearish in case of recovery.
EUR/GBP Daily Outlook
Daily Pivots: (S1) 0.8363; (P) 0.8400; (R1) 0.8424; More...
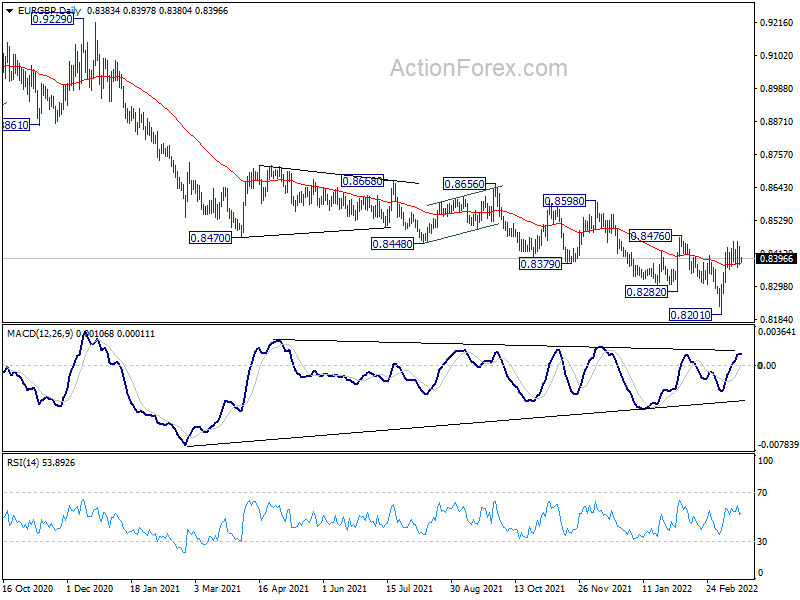
Intraday bias in EUR/GBP remains neutral for the moment. On the upside, above 0.8456 will target 0.8476 structural resistance first. Firm break there will carry larger bullish implication and target 0.8598 resistance next. However, on the downside, break of 0.8315 minor support will retain near term bearishness, and bring retest of 0.8201 low.
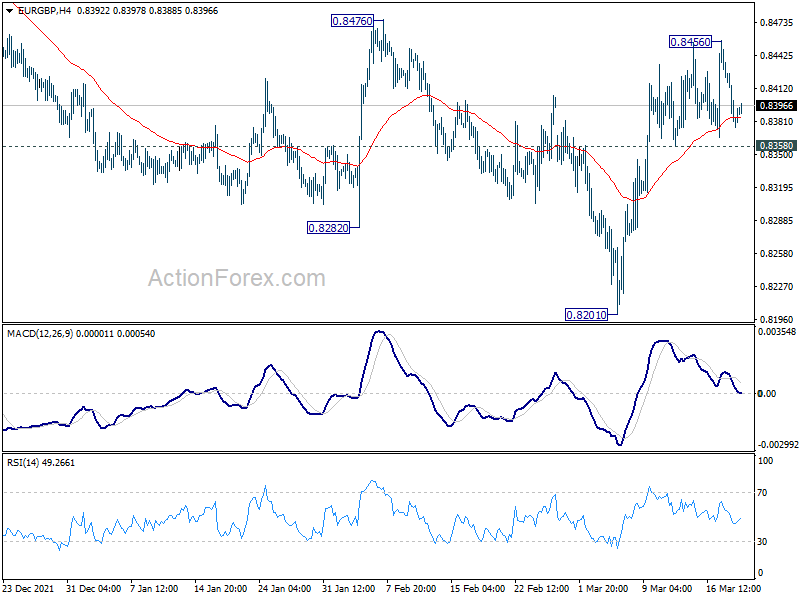
In the bigger picture, the down trend from 0.9499 is expected to continue as long as 0.8476 resistance holds. Sustained trading below 0.8276 support will argue that the whole up trend from 0.6935 (2015 low) has reversed. Deeper fall should be seen to 61.8% retracement of 0.6935 to 0.9499 at 0.7917 next. However, firm break of 0.8476 will indicate medium term bottoming at least. Focus will be back on 55 week EMA (now at 0.8523) for more evidence of bullish reversal.
EUR/JPY Daily Outlook
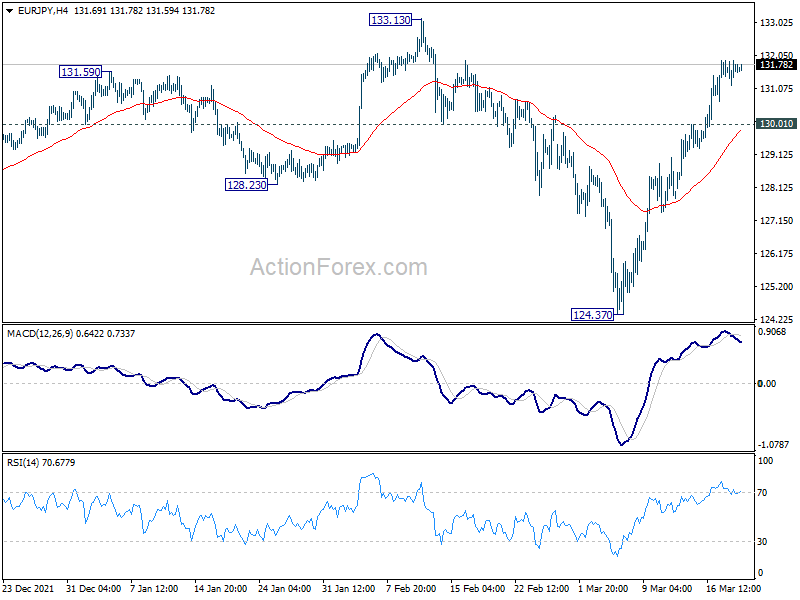
Daily Pivots: (S1) 131.26; (P) 131.59; (R1) 131.99; More....
Intraday in EUR/JPY remains mildly on the upside at this point. Corrective pattern from 134.11 might have completed at 124.37 already. Further rise should be seen to retest 133.13/134.11 resistance zone first. Decisive break there will resume larger up trend. However, break of 130.01 minor support will mix up the near term outlook and turn intraday bias neutral first.
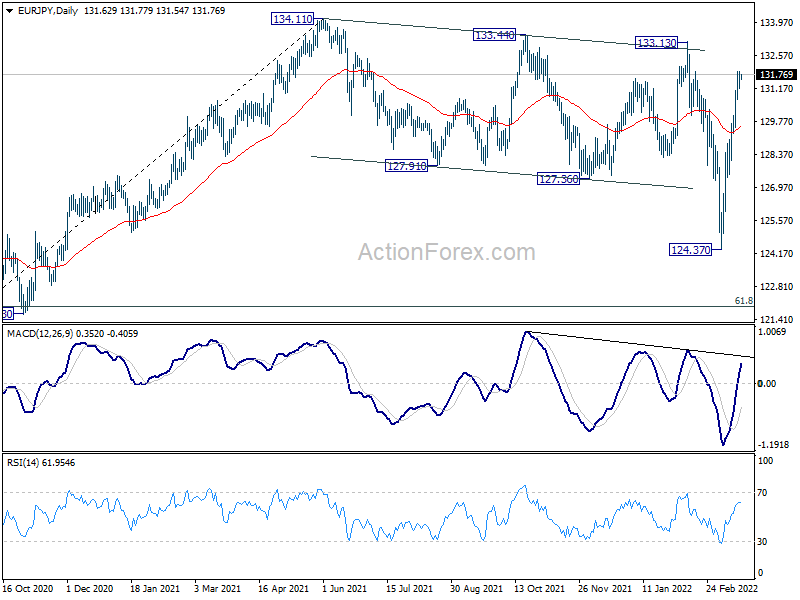
In the bigger picture, medium term outlook remains neutral for now. Price actions from 134.11 are so far still seen as a corrective pattern. That is, rise from 114.42 (2020 low) is in favor to resume at a later stage. But before that, the corrective pattern from 134.11 could still extend further, sideway or downward. In the latter case, break of 124.37 will target 61.8% retracement of 114.42 to 134.11 at 121.94.
GBP/JPY Daily Outlook
Daily Pivots: (S1) 156.17; (P) 156.70; (R1) 157.54; More...
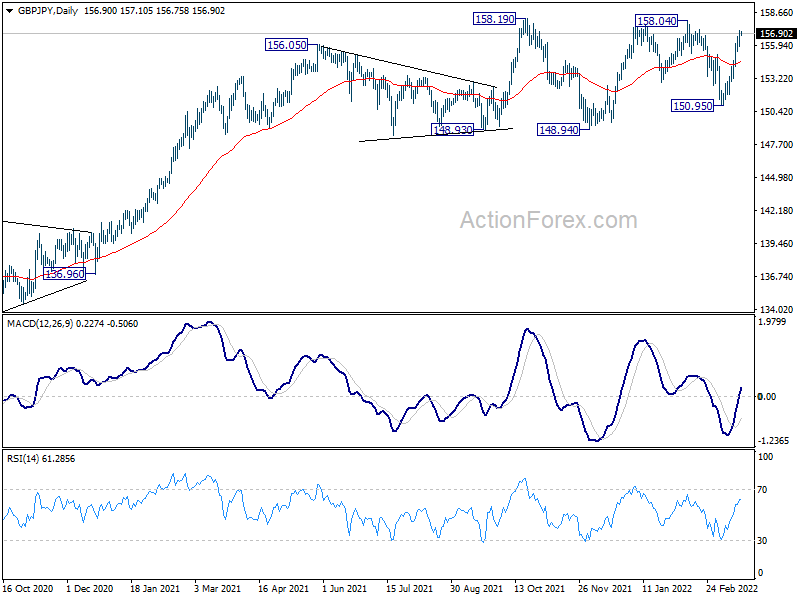
Intraday bias in GBP/JPY remains mildly on the upside at this point. Corrective pattern from 158.19 could have completed with three waves to 150.95 already. Further rise would be seen to 158.04/19 resistance zone. Decisive break there will resume larger up trend. On the downside, below 155.43 minor support will delay the bullish case and turn intraday bias neutral first.
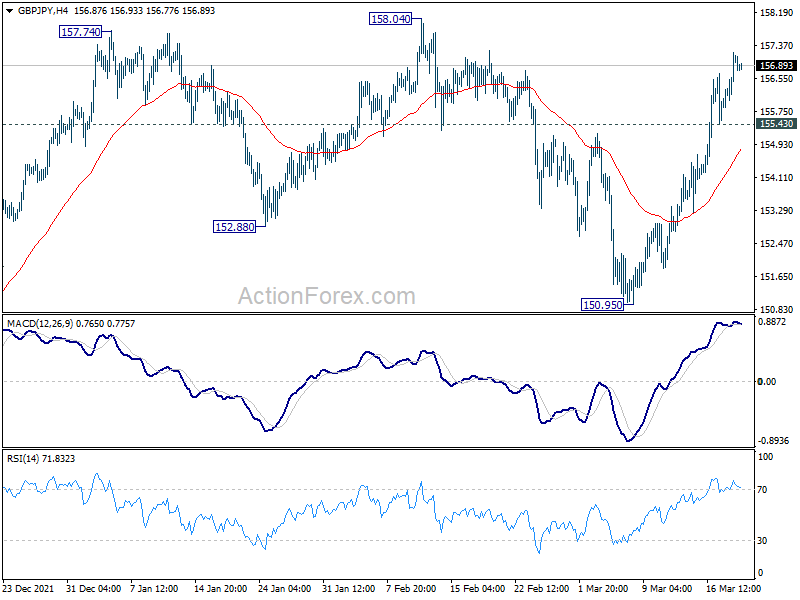
In the bigger picture, up trend from 123.94 (2020 low) should still be in progress, and notable support from 5 week EMA affirms medium term bullishness. Next target is 61.8% retracement of 195.86 to 122.75 at 167.93. This will now remain the favored case as long as 148.94 support holds.
USD/CAD Daily Outlook
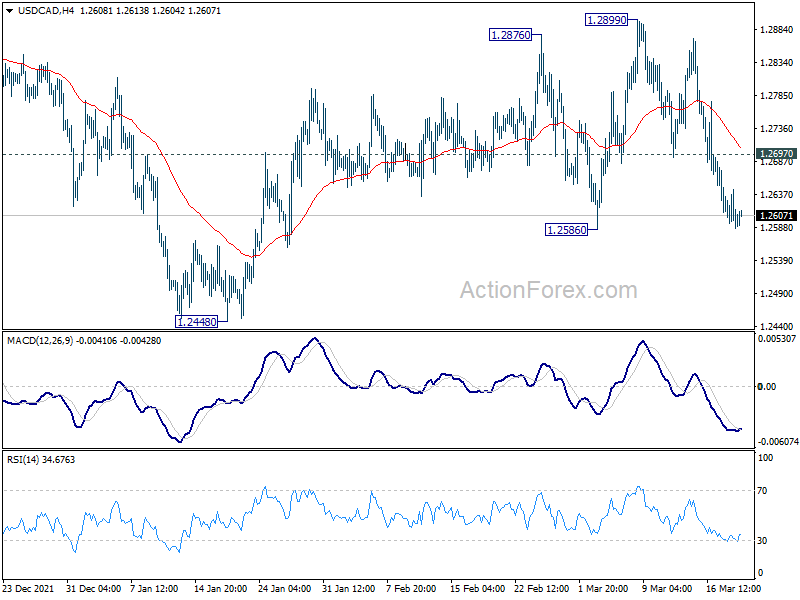
Daily Pivots: (S1) 1.2579; (P) 1.2613; (R1) 1.2637; More...
Intraday bias in USD/CAD remains mildly on the downside with focus on 1.2586 support. Firm break there will argue that rebound from 1.2448 has completed at 1.2899. Deeper fall would be seen back to 1.2448 support first. On the upside, however, break of 1.2697 minor resistance will turn intraday bias neutral again.
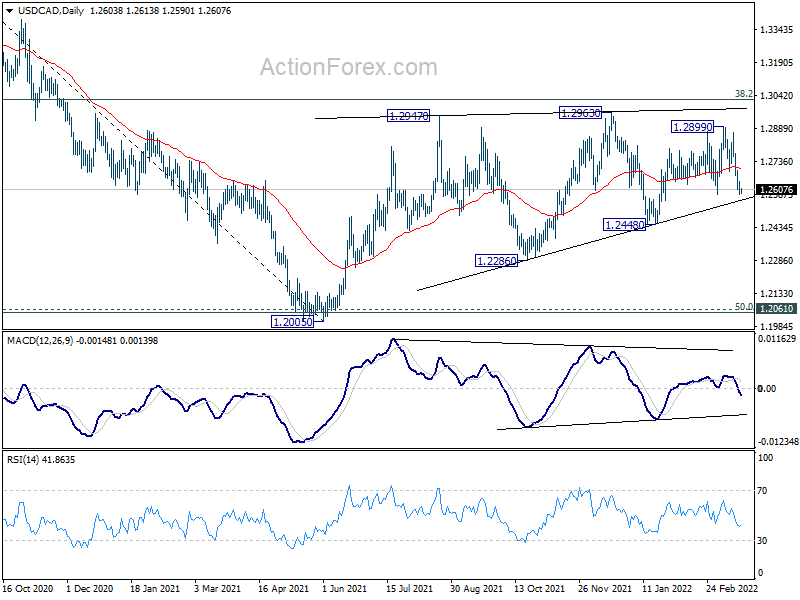
In the bigger picture, focus stays on 38.2% retracement of 1.4667 (2020 high) to 1.2005 (2021 low) at 1.3022. Sustained break there should confirm that the down trend from 1.4667 has completed after defending 1.2061 long term cluster support. Further rise would then be seen towards 61.8% retracement at 1.3650. However, rejection by 1.3022 will maintain medium term bearishness. Break of 1.2005 will resume the down trend from 1.4667 and that carries larger bearish implications too.
AUD/USD Daily Report
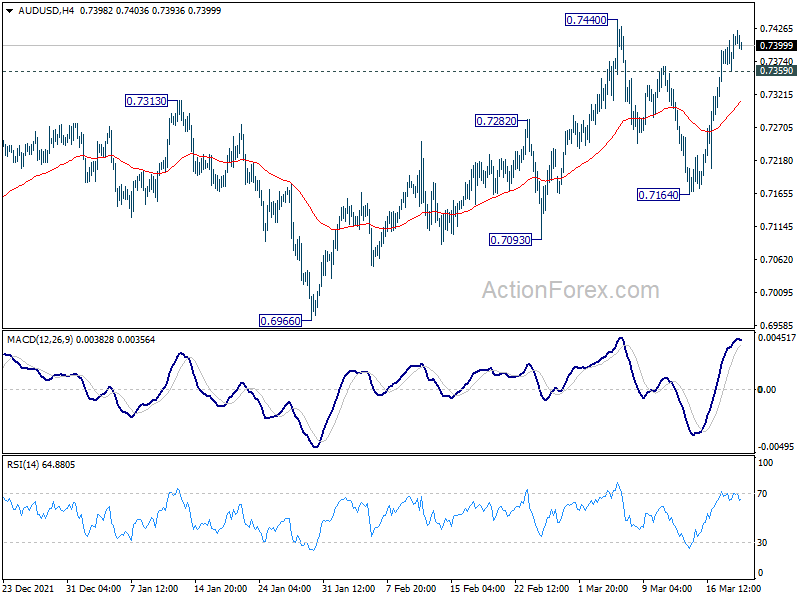
Daily Pivots: (S1) 0.7378; (P) 0.7398; (R1) 0.7435; More...
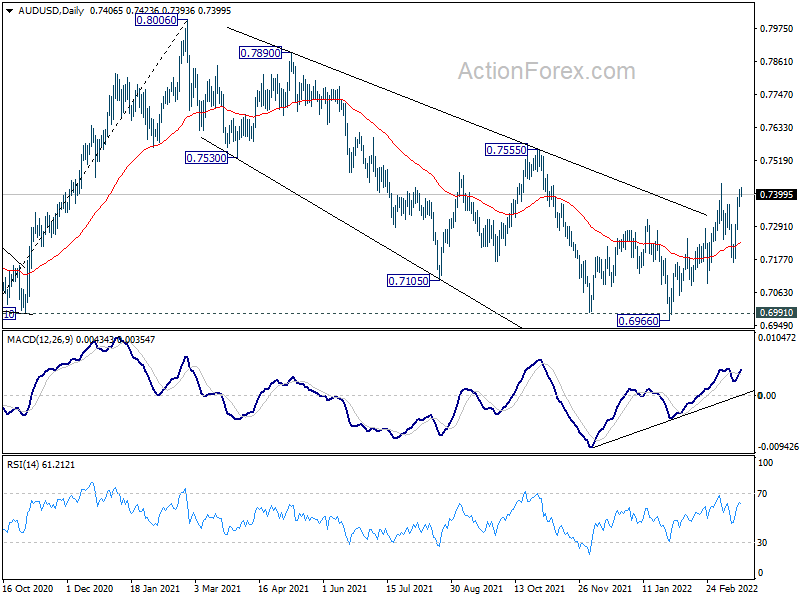
Intraday bias in AUD/USD remains mildly on the upside for 0.7440 resistance. Break there will resume whole rise from 0.6966 to 0.7555 resistance. Decisive break there should confirm that whole corrective decline from 0.8006 has completed at 0.6966. On the downside, below 0.7359 minor support will turn bias neutral first. But further rally will remain in favor as long as 0.7164 support holds.
In the bigger picture, focus remains on 0.6991 key structural support. Sustained break there will argue that the whole up trend from 0.5506 might be finished at 0.8006, after rejection by 0.8135 long term resistance. Deeper decline would then be seen back to 61.8% retracement of 0.5506 to 0.8006 at 0.6461. Meanwhile, strong rebound from 0.6991 will retain medium term bullishness. That is, whole up trend from 0.5506 is still in progress for another rise through 0.8006 at a later stage.