

Sample Category Title
EUR/USD Daily Outlook
Daily Pivots: (S1) 1.0997; (P) 1.1058; (R1) 1.1113; More...
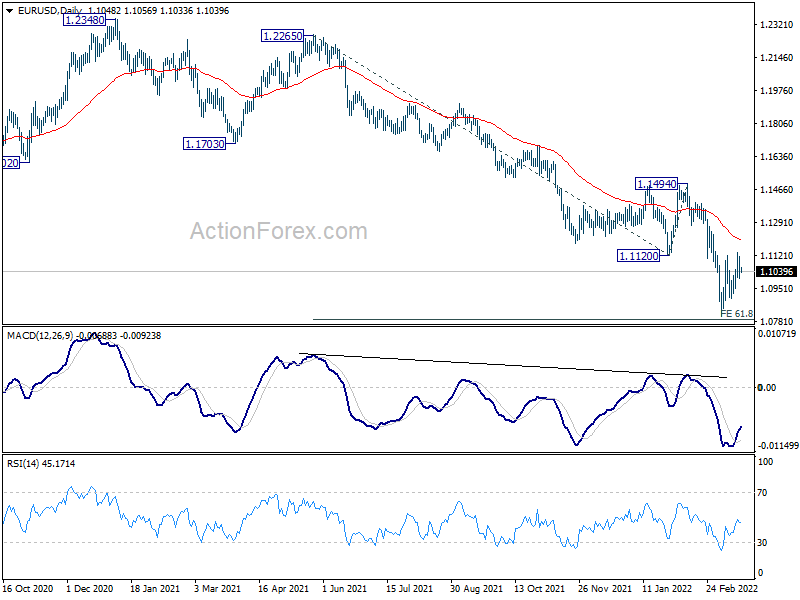
Intraday bias in EUR/USD remains neutral for the moment. On the downside, below 1.0899 minor support will turn bias back to the downside for 61.8% projection of 1.2265 to 1.1120 from 1.1494 at 1.0786. However, firm break of 1.1120 will confirm short term bottoming at 1.0805. Bias will be back on the upside for 55 day EMA (now at 1.1204) and above.
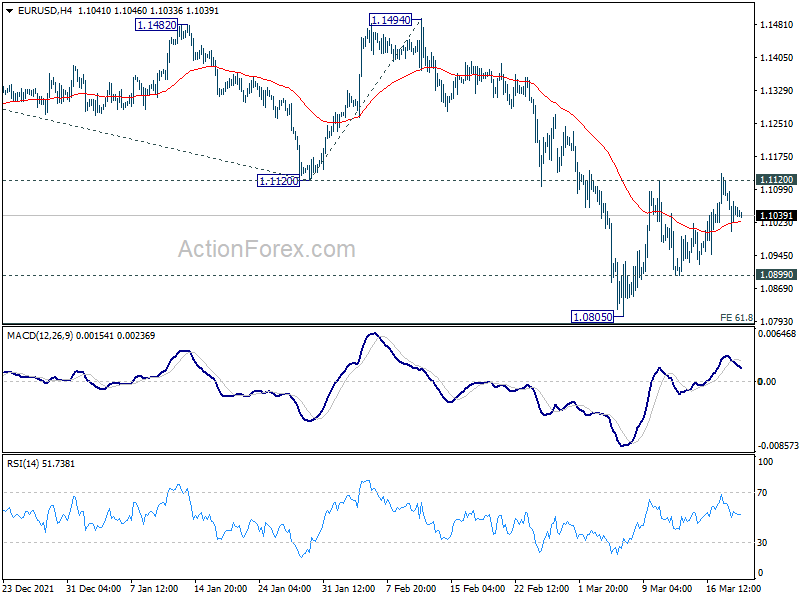
In the bigger picture, the decline from 1.2348 (2021 high) is expected to continue as long as 1.1494 resistance holds. Firm break of 1.0635 (2020 low) will raise the chance of long term down trend resumption and target a retest on 1.0339 (2017 low) next. Nevertheless, break of 1.1494 will maintain medium term neutral outlook, and extending term range trading first.
GBP/USD Daily Outlook
Daily Pivots: (S1) 1.3127; (P) 1.3162; (R1) 1.3213; More...
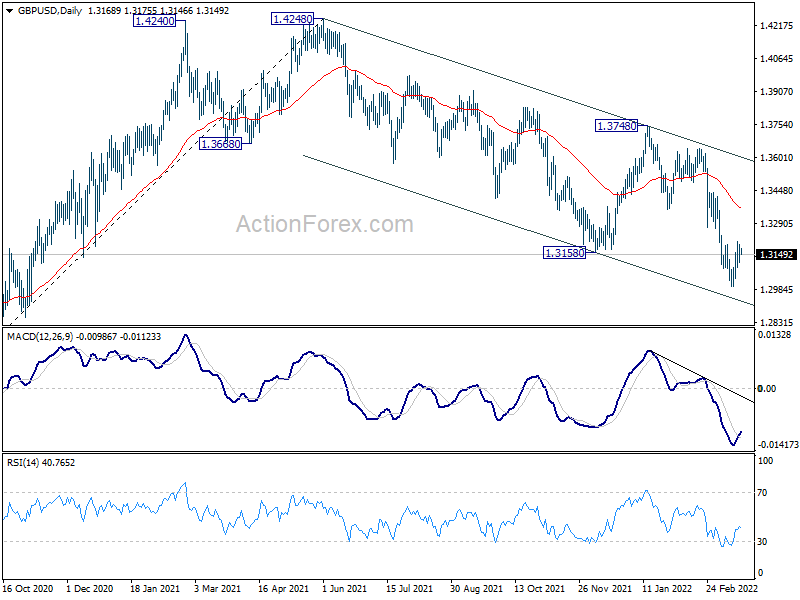
Intraday bias in GBP/USD remains neutral for the moment and some more consolidation could be seen. On the downside, break of 1.2999 will resume larger down trend from 1.4248. However, firm break of 1.3210 should confirm short term bottoming. Stronger rise should be seen back to 55 day EMA (now at 1.3361).
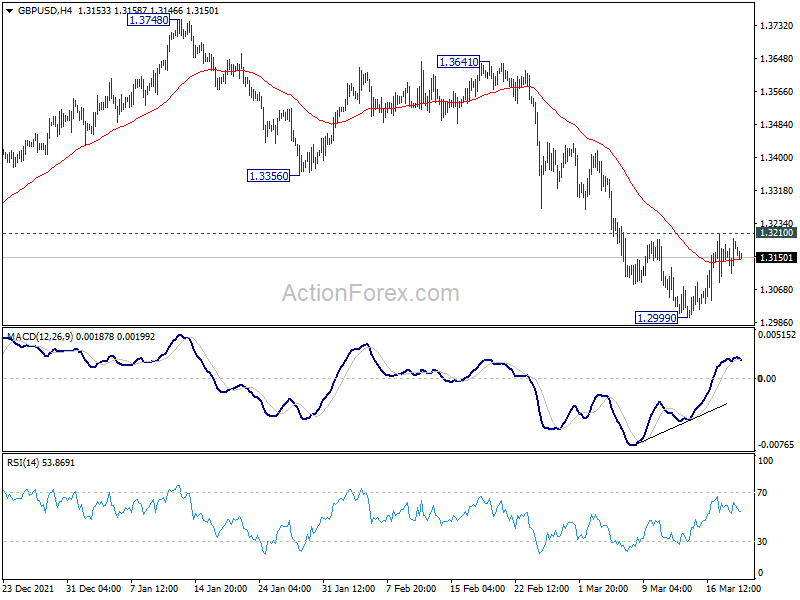
In the bigger picture, current development suggests that the up trend from 1.1409 (2020 low) has completed at 1.4248. Decline from 1.4248 could still be a corrective move, or it could be the start of a long term down trend. In either case, deeper decline would be seen back to 61.8% retracement of 2.1161 to 1.1409 at 1.2493. In any case, break of 1.3748 resistance is needed to indicate medium term bottoming, or outlook will stay bearish.
USD/JPY Daily Outlook
Daily Pivots: (S1) 118.62; (P) 119.01; (R1) 119.55; More...
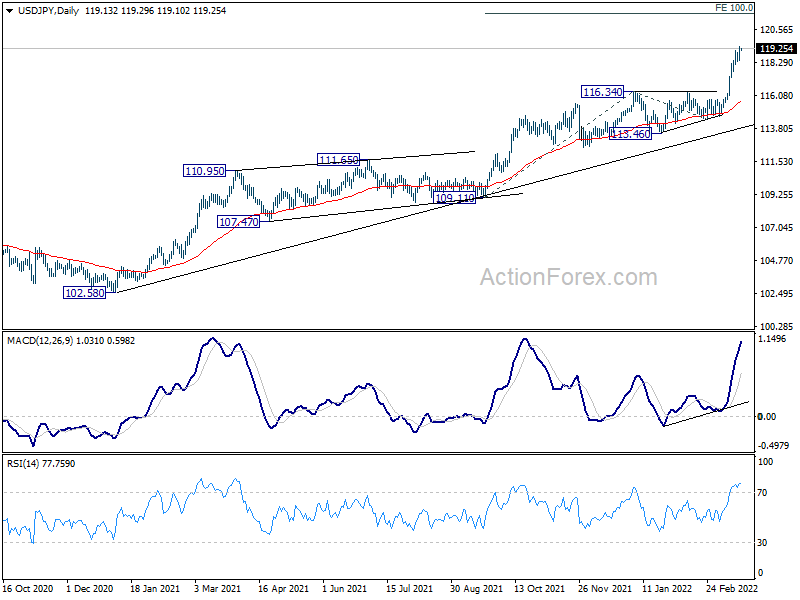
Intraday bias in USD/JPY remains on the upside for the moment. Current up trend should target 100% projection of 109.11 to 116.34 from 114.40 at 121.63 next. On the downside, below 118.35 will turn intraday bias neutral again and bring retreat. But downside should be contained above 116.34 resistance turned support to bring another rally.
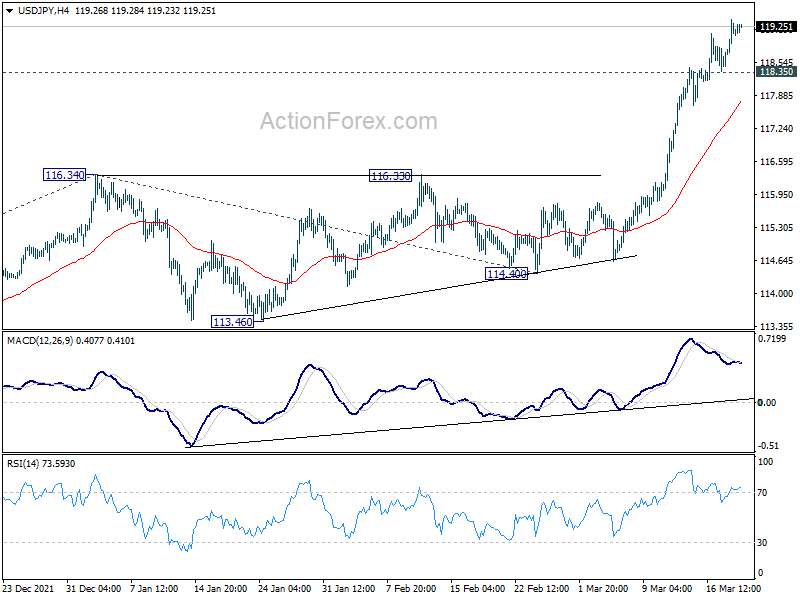
In the bigger picture, the break of 118.65 resistance (2016 high) suggest that up trend from 98.97 (2016 low) is resuming, with rise from 101.18 (2020 low) as the third leg. Medium term outlook will remain bullish as long as 113.46 low. Sustained trading above 118.65 will pave the way to 125.85 (2015 high).
Global Inflation Watch – Inflation Keeps Pushing Higher
Overview: A rise in commodity prices, tight labour markets and high inflation expectations has lifted inflation further. However, risk of recession may soon be dampening pricing power among businesses. Freight rates are elevated but off the highs. We look for US core inflation to rise further and peak at 6.6% in March 2022 before easing to around 4.6% by end-2022. We expect euro core inflation to rise above 3% in the coming months and stay around ECB's 2% target in 2023.
Inflation expectations: Market-based long-term inflation expectations have moved higher. US household long-term inflation expectations are at a 10-year high. Euro household price expectations have stabilized at a high level.
US: CPI inflation rose to 7.9% y/y in February and we expect further increases near-term due to higher energy and food prices. Underlying price increases remain high, as CPI and CPI core rose 0.8% m/m and 0.5% m/m, respectively. Inflation expectations remain high (especially near-term) and nearly 50% of small businesses expect to hike prices in 3M. It puts a lot of pressure on the Fed to tighten policy quickly in order to get inflation back towards 2%. Early signs wage growth is peaking based on surveys.
Euro: Inflation pressures continue to build at an unrelenting pace, as higher input costs are still working their way through the pricing chain. 60% of core inflation items now have inflation rates above 2%. Headline and core inflation rose to new record highs of 5.8% and 2.7%, respectively, in February. Negotiated wage growth remained moderate in Q4 21 at 1.6% (up from 1.3% in Q3), but inflation rates well above target throughout the year raise the risk of higher inflation expectations fuelling wage adjustments down the line. We expect to see further core inflation increases ahead, keeping pressure high on ECB to normalise policy (read more in Big Picture - Headwinds to the global economy from Ukraine war and Fed tightening, 17 March).
China: Chinese PPI inflation dropped to 8.8% y/y in February further down from the peak in October at 13.5% y/y. CPI is running at 0.9% y/y held down by food prices.
USD/CHF Daily Outlook
Daily Pivots: (S1) 0.9295; (P) 0.9338; (R1) 0.9363; More....
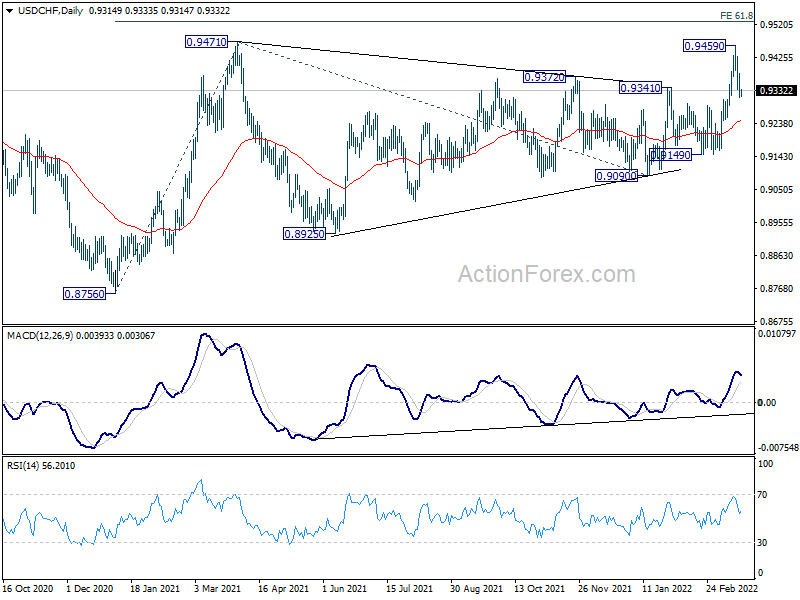
Intraday bias in USD/CHF is mildly on the downside at this point. Pull back from 0.9459 short term top is on track to 55 day EMA (now at 0.9248). On the upside, above 0.9381 minor resistance will flip bias back to the upside. Firm break of 0.9471 will resume the rise from 0.8756 to 61.8% projection of 0.8756 to 0.9471 from 0.9090 at 0.9532.
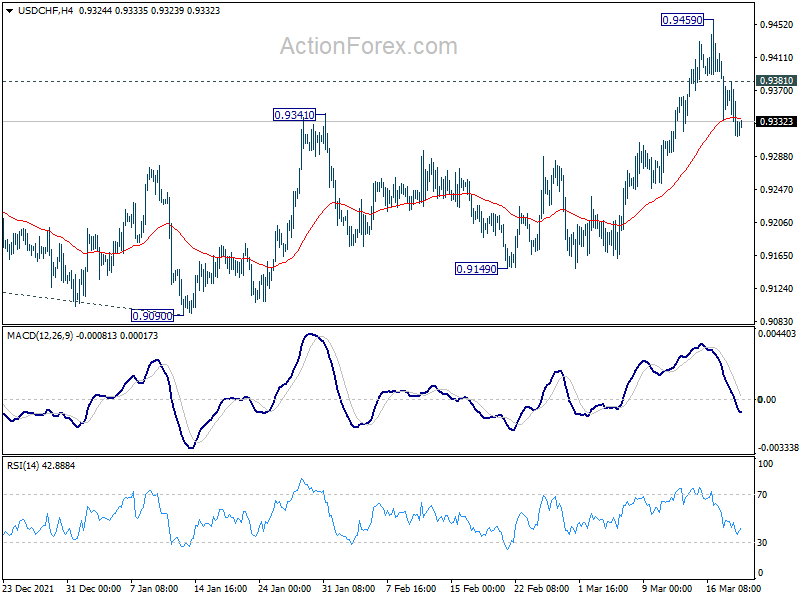
In the bigger picture, medium term outlook will be neutral at best as long as 0.9471 resistance holds. Larger down trend could still extend through 0.8756 (2021 low). However, firm break of 0.9471 will argue that whole down trend form 1.0342 (2016 high), has completed with waves down to 0.8756. A medium term up trend should be set up to target 1.0237/0342 resistance zone.
Markets Start Quiet, But SNB and Some Key Data Lie Ahead
The markets are generally quiet in Asian session today. Dollar is mildly firmer together with Canadian. Sterling and Swiss Franc are soft. But major pairs and crosses are stuck inside Friday's range. Asian stocks are mixed, with Japan on Holiday, while others tread water. Gold is consolidating in tight range too. Crude oil is the more lively one, extending near term rebound. Markets could stay quiet with a very light calendar today. But volatility is expected with some important data featured later in the week.
Technically, Euro has turned weaker late last week against commodity currencies. The question is whether such weakness would spread to other pairs. Attention will be on 1.0899 minor support in EUR/USD, 0.8358 minor support in EUR/GBP, and 1.0184 minor support in EUR/CHF. Break of these levels together will signal return of Euro selloff.
In Asia, at the time of writing, Hong Kong HSI is down -0.08%. China Shanghai SSE is up 0.02%. Singapore Strait Times is up 0.18%. Japan is on holiday.
New Zealand goods export rose 22% yoy in Feb, imports rose 37% yoy
New Zealand goods exports rose 22% yoy to NZD 5.5B in February. Goods imports rose 37% yoy to NZD 5.9B. Trade deficit came in at NZD -385m, smaller than expectation of NZD -808m.
Exports to all top destinations increased, including China (up NZD 80m or 5.4%), Australia (up NZD 119m or 22.0%), US (up NZD 37m or 7.4%), EU (up NZD 62m or 25%), and Japan (up NZD 71m or 34%).
Imports from all top partners also rose, including China (up NZD 490m or 45%), EUR (up NZD 209m or 32%), Australia (up NZD 137m or 26%), US (up NZD 105m or 29%), and Japan (up NZD 167m or 60%).
WTI crude oil extending rebound, pressing 108 fib level
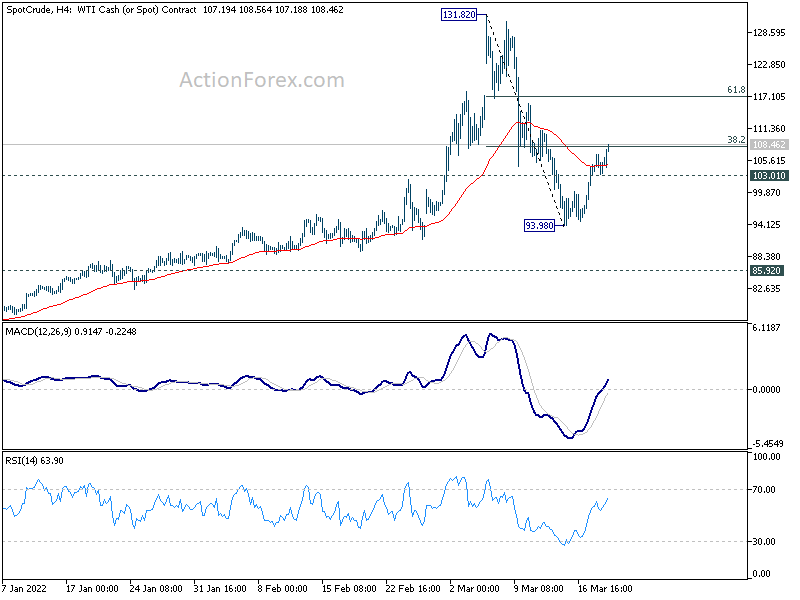
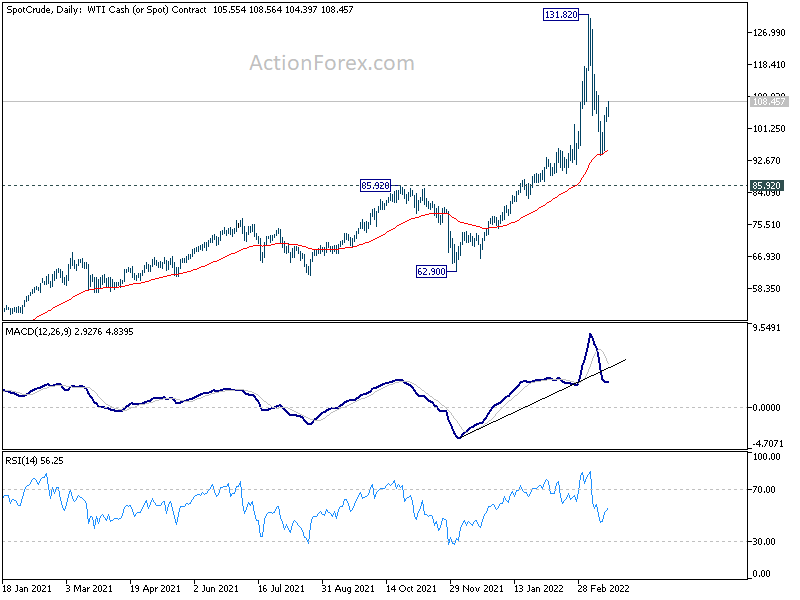
WTI crude oil is extends the near term rebound and is back above 108. It's reported that OPEC+ missed its production target by slightly more than 1m barrels per day in February. At the same time, some Baltic countries are pushing EU for an oil embargo on Russia for its invasion of Ukraine.
WTI is now pressing 38.2% retracement of 131.82 to 93.98 at 108.43. Sustained trading above there will pave the way to 61.8% retracement at 117.36 and above. Such development would also affirm the case that corrective pattern from 131.82 high is a sideway pattern. This is the preferred case given the notable support from 55 day EMA.
Nevertheless, rejection by 108.43, followed by break of 103.01 minor support will likely extend the fall from 131.82 through 93.98, and set up a deep correction instead.
SNB rate decision plus a lot of important data
SNB rate decision is a focus this week. The central will will certainly keep monetary unchanged, and maintain the necessity of negative rate and readiness for intervention. Though, the comment on recent steep appreciation in the Franc, with EUR/CHF breaching parity, will be closely watched. Meanwhile, BoJ will release meeting minutes and ECB will release monthly bulletin.
There are also many important economic data, including PMIs from Japan, Eurozone, UK and US. Inflation data include Germany PPI, UK CPPI and PPI and Japan Tokyo CPI. Sentiment indicator include Germany Ifo, Eurozone and UK consumer confidence. US will also release durable goods orders and UK will release retail sales. Here are some highlights for the week:
- Monday: New Zealand trade balance; Germany PPI, Bundesbank monthly report.
- Tuesday: UK public sector net borrowing; Eurozone current account; Canada IPPI, RMPI;.
- Wednesday: UK CPI, PPI; US new home sales; Eurozone consumer confidence.
- Thursday: Australia PMIs; BoJ minutes, PMI manufacturing; Eurozone PMIs, ECB monthly bulletin; UK PMIs; SNB rate decision; US durable goods orders, jobless claims, current account, PMIs.
- Friday: Japan Tokyo CPI, corporate service prices; UK Gfk consumer confidence, retail sales; Germany Ifo business climate, M3 money supply; US pending home sales.
USD/CHF Daily Outlook
Daily Pivots: (S1) 0.9295; (P) 0.9338; (R1) 0.9363; More....
Intraday bias in USD/CHF is mildly on the downside at this point. Pull back from 0.9459 short term top is on track to 55 day EMA (now at 0.9248). On the upside, above 0.9381 minor resistance will flip bias back to the upside. Firm break of 0.9471 will resume the rise from 0.8756 to 61.8% projection of 0.8756 to 0.9471 from 0.9090 at 0.9532.
In the bigger picture, medium term outlook will be neutral at best as long as 0.9471 resistance holds. Larger down trend could still extend through 0.8756 (2021 low). However, firm break of 0.9471 will argue that whole down trend form 1.0342 (2016 high), has completed with waves down to 0.8756. A medium term up trend should be set up to target 1.0237/0342 resistance zone.
Economic Indicators Update
| GMT | Ccy | Events | Actual | Forecast | Previous | Revised |
|---|---|---|---|---|---|---|
| 21:45 | NZD | Trade Balance (NZD) Feb | -385M | -808M | -1082M | -1126M |
| 14:01 | GBP | Rightmove House Price Index M/M Mar | 1.70% | 2.30% | ||
| 02:00 | EUR | Germany PPI M/M Feb | 1.70% | 2.20% | ||
| 07:00 | EUR | Germany PPI Y/Y Feb | 26.10% | 25.00% |
Technical Outlook and Review
DXY:
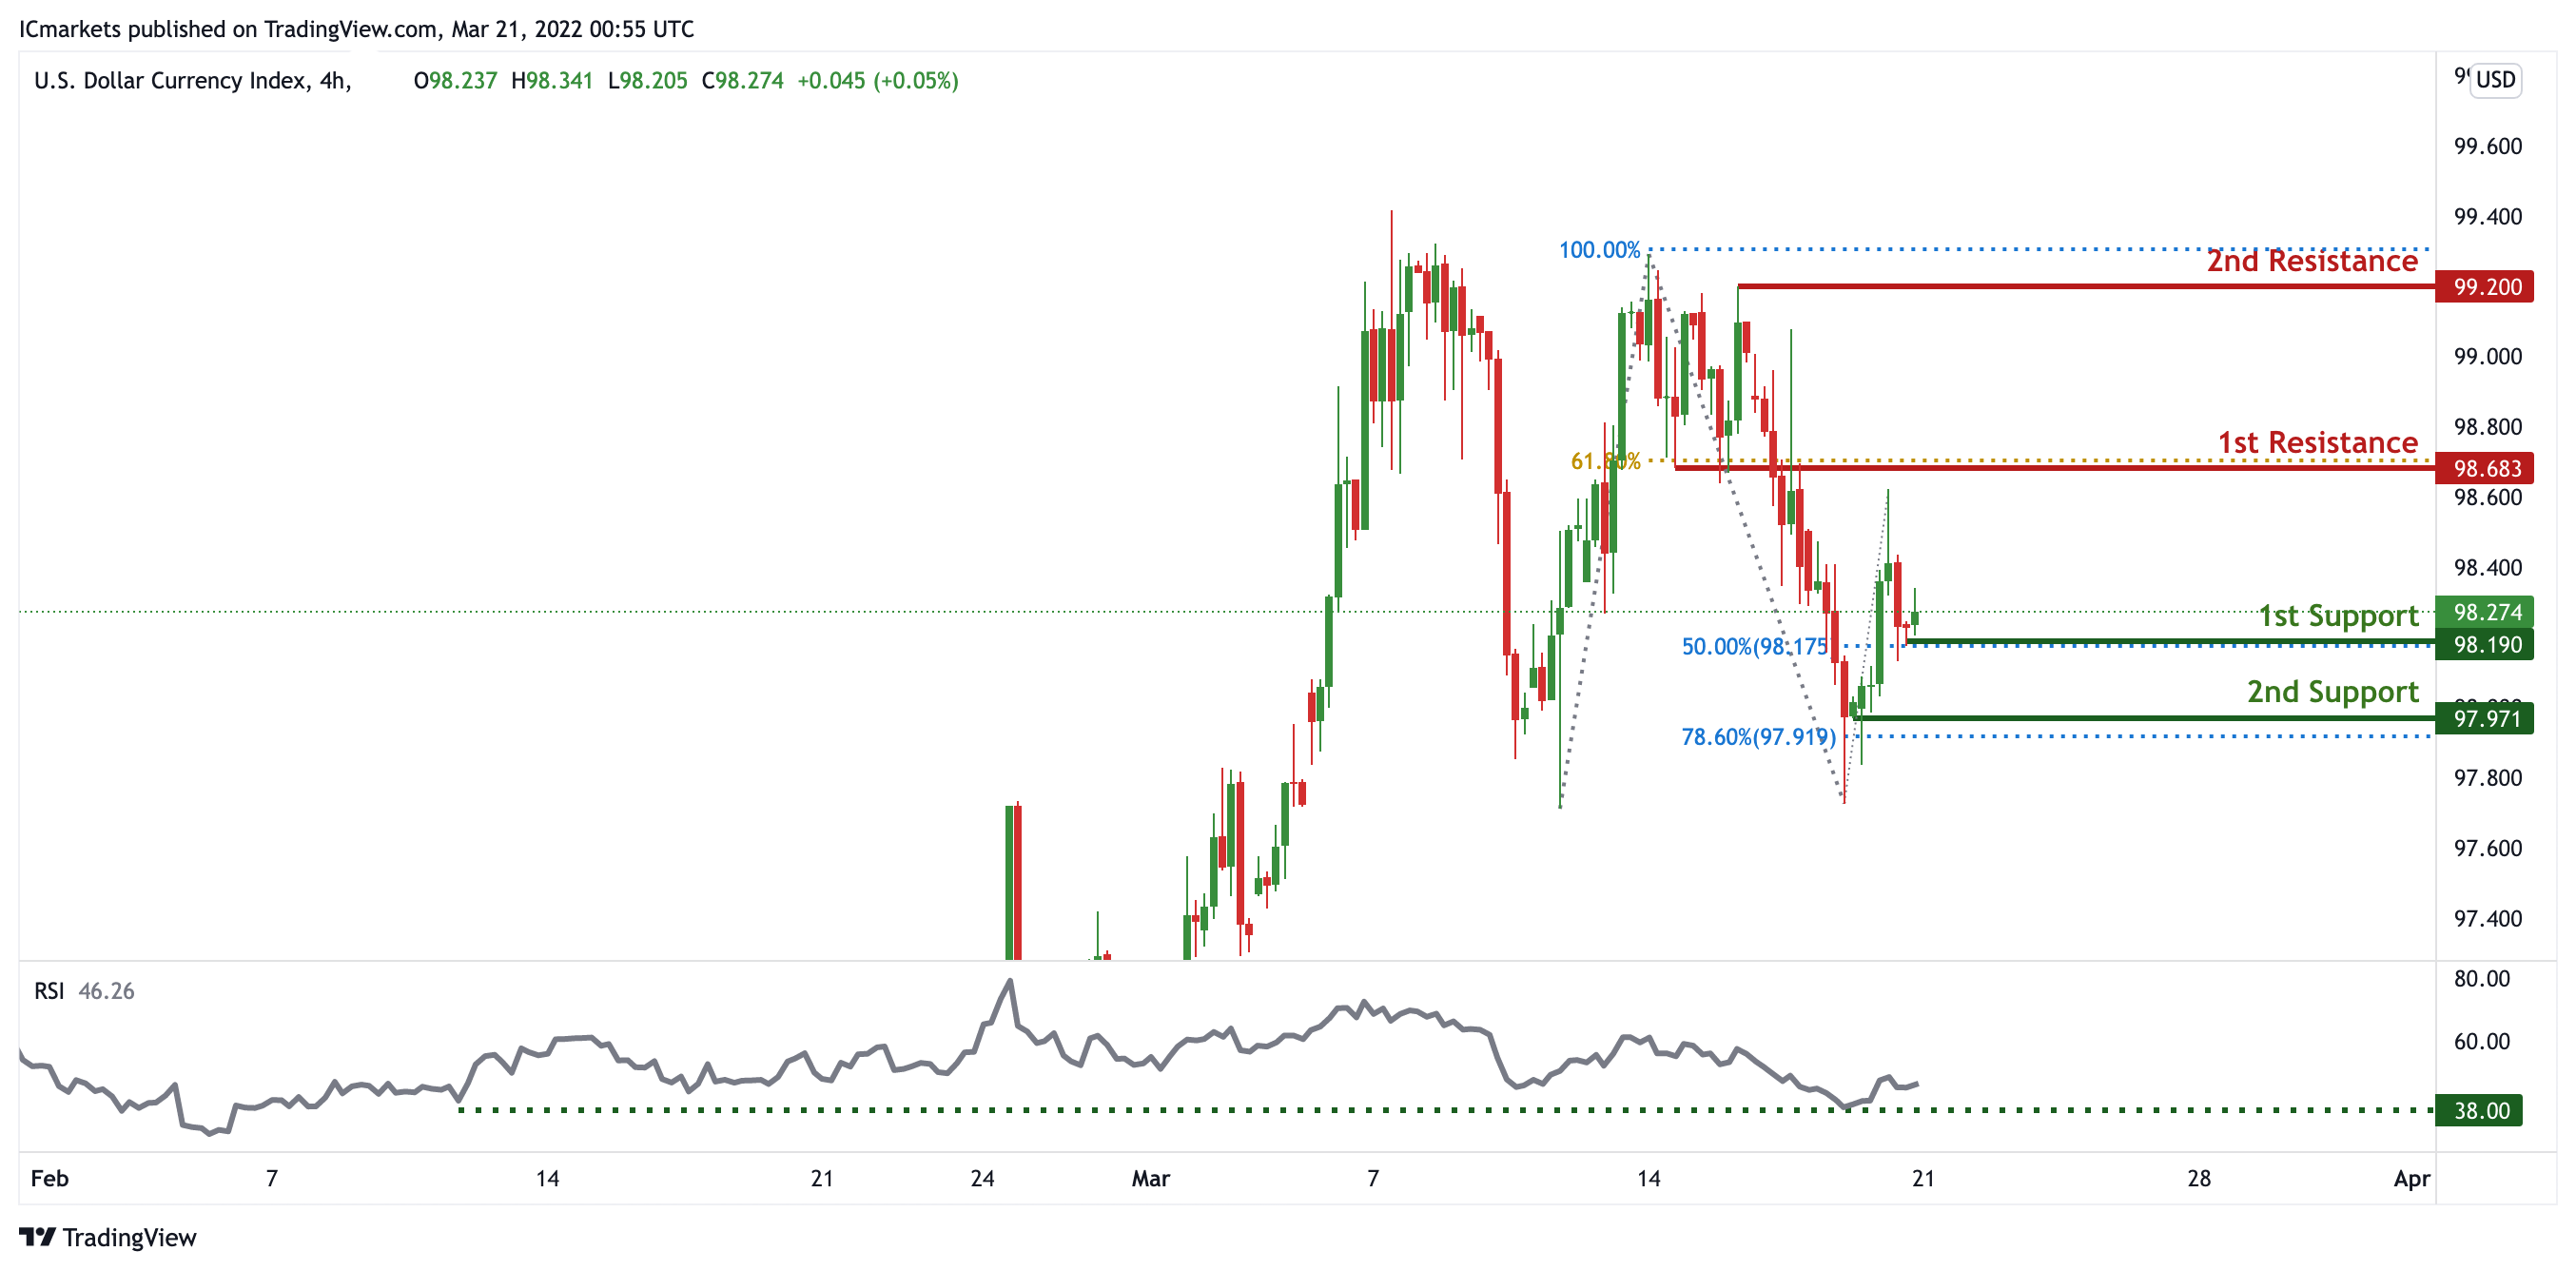
On the H4 timeframe, prices are on bullish momentum. We see the potential for a bounce from our 1st support at 97.808 in line with 38.2% Fibonacci retracement towards our 1st resistance at 98.339 in line with 38.2% Fibonacci retracement. Ichimoku clouds are showing green, further supporting our bullish bias.
Areas of consideration:
- H4 time frame, 1st resistance at 98.339
- H4 time frame, 1st support at 97.808
XAU/USD (GOLD) :
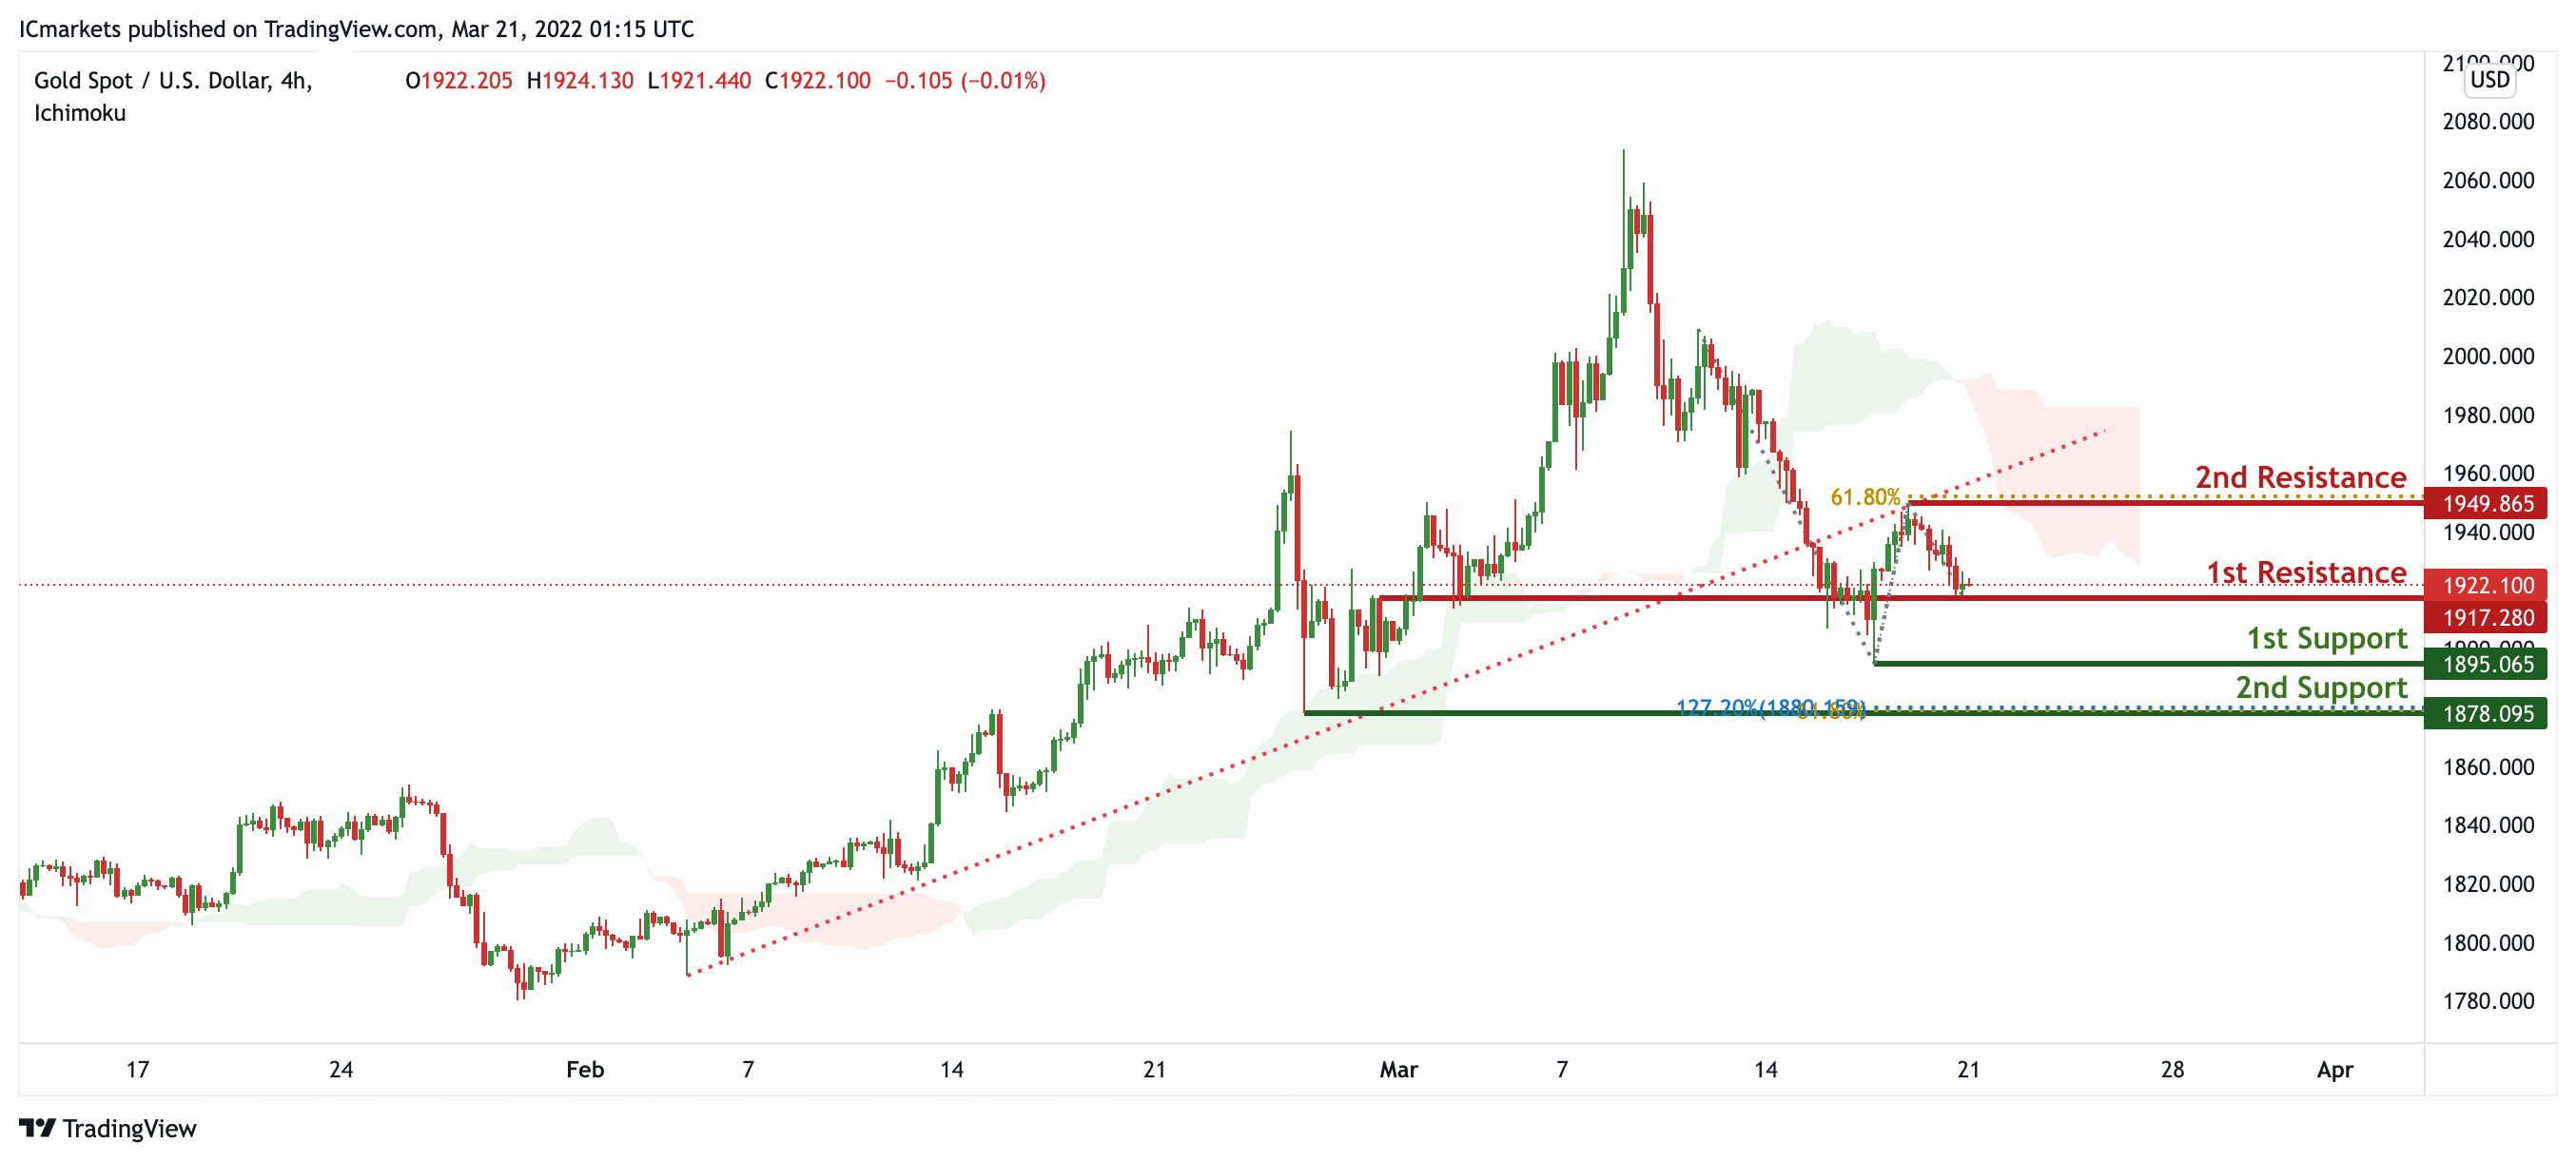
On the H4, prices are on bearish momentum. We see the potential for further bearish continuation from our 1st resistance at 1944.65 in line with 38.2% Fibonacci retracement and 127.2% Fibonacci Projection towards our 1st support at 1909.28 which is a graphical swing low. Ichimoku is on bearish momentum, further supporting our bearish bias.
Areas of consideration:
- 4h 1st support at 1909.28
- 4h 1st resistance at 1944.65
GBP/USD:
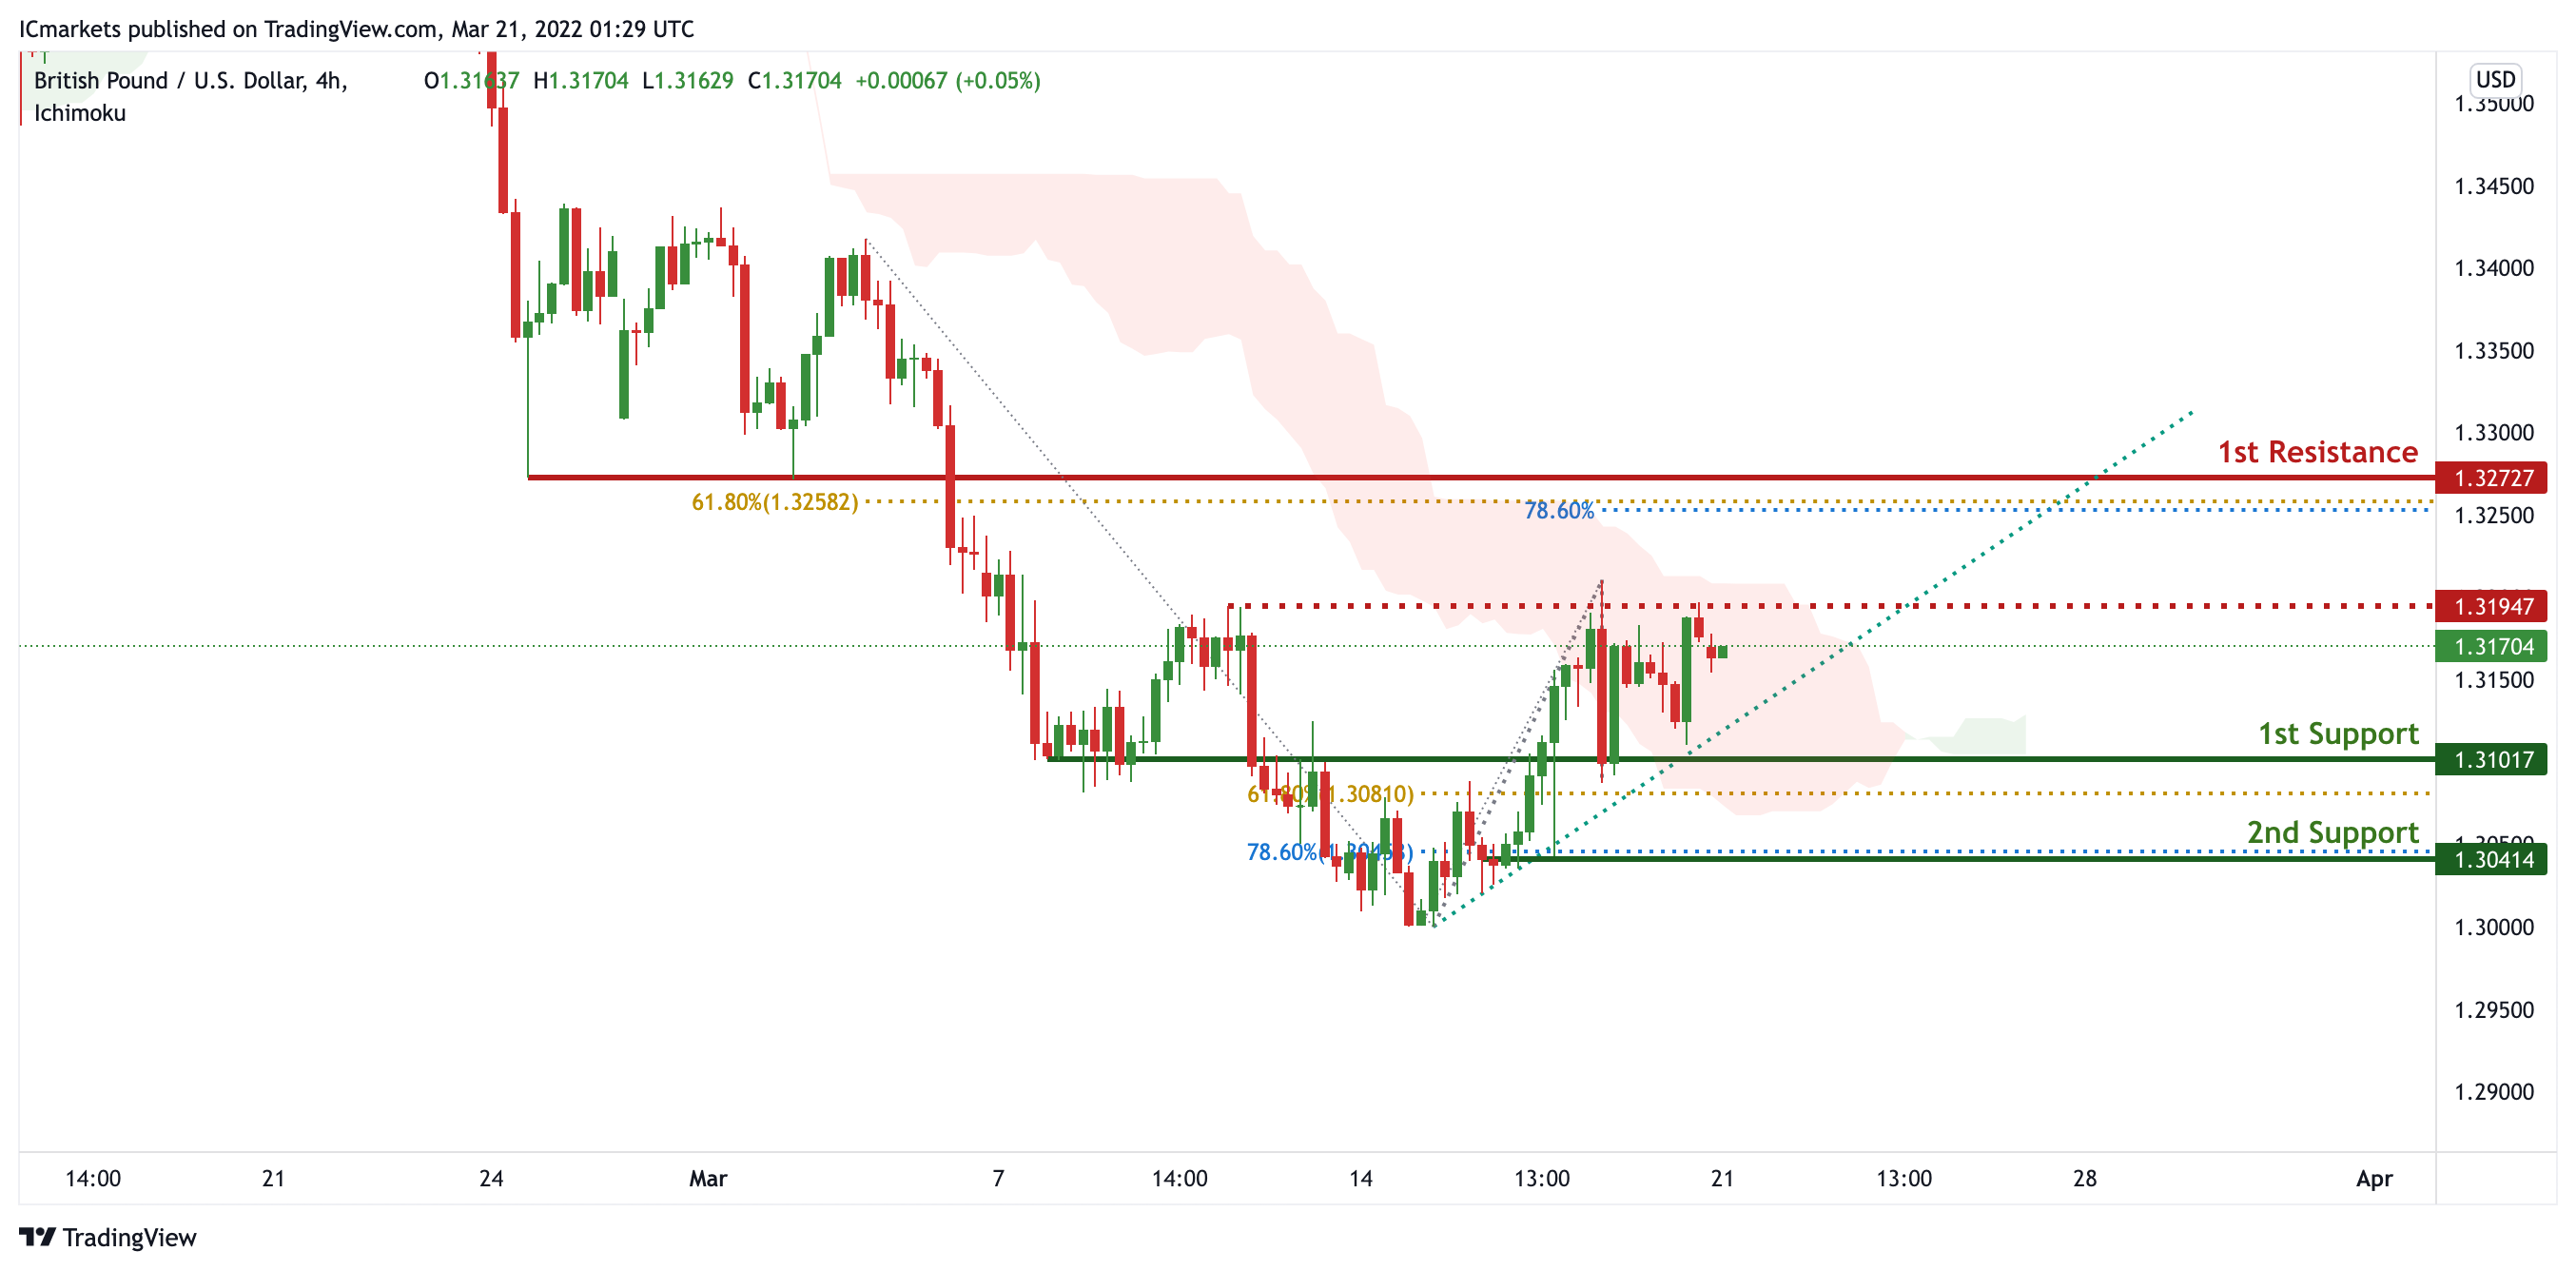
On the H4, prices are on bullish momentum and abiding to our ascending trendline support. We see the potential for further bullish continuation from our 1st support at 1.31017 in line with 61.8% Fibonacci Retracement towards our 1st resistance at 1.32727 in line with 61.8% Fibonacci retracement and 78.6% Fibonacci Projection. Ichimoku clouds is forecasting the bullish clouds, further supporting our bias.
Areas of consideration
- H4 1st resistance at 1.31841
- H4 1st support at 1.30814
USD/CHF:
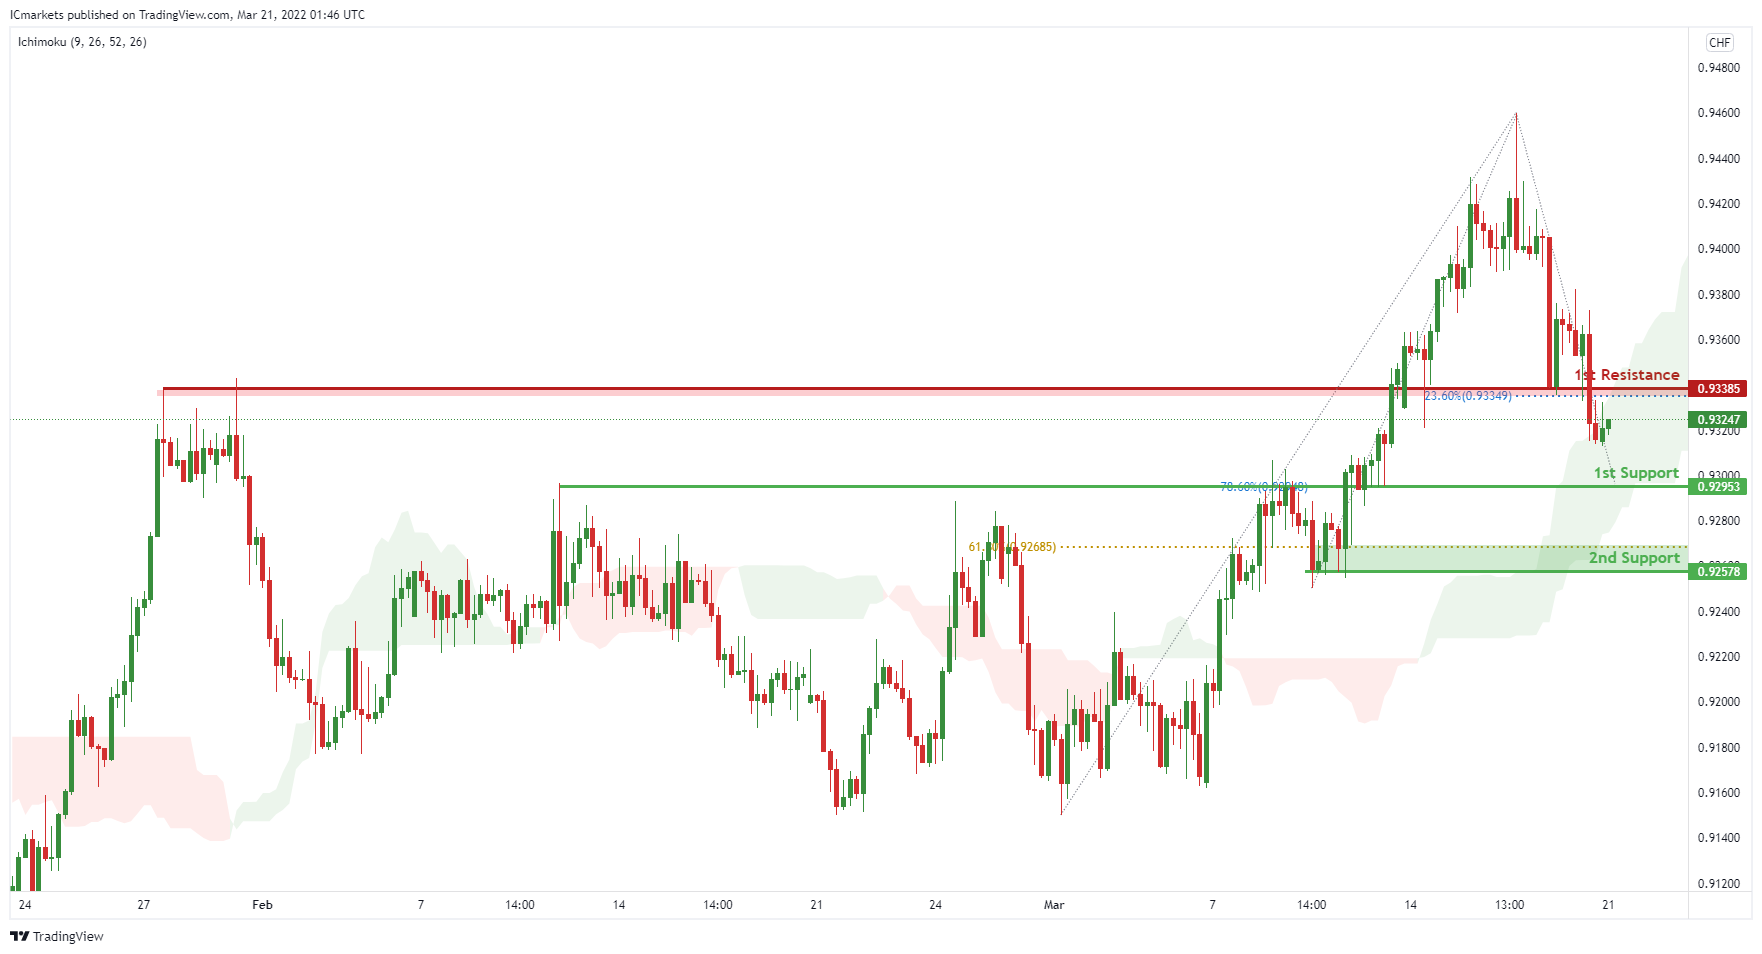
On the H4, with price moving above the ichimoku cloud, we have a bias that price will rise to our 1st resistance at 0.93385 in line with the 23.6% Fibonacci retracement from our 1st support at 0.92953 in line with the horizontal pullback support and 78.6% Fibonacci retracement. Alternatively, price may break 1st support structure and head for 2nd support at 0.92578 in line with the 61.8% Fibonacci retracement
Areas of consideration
- 1st support level 0.92953
- 1st resistance 0.93385
EUR/USD :
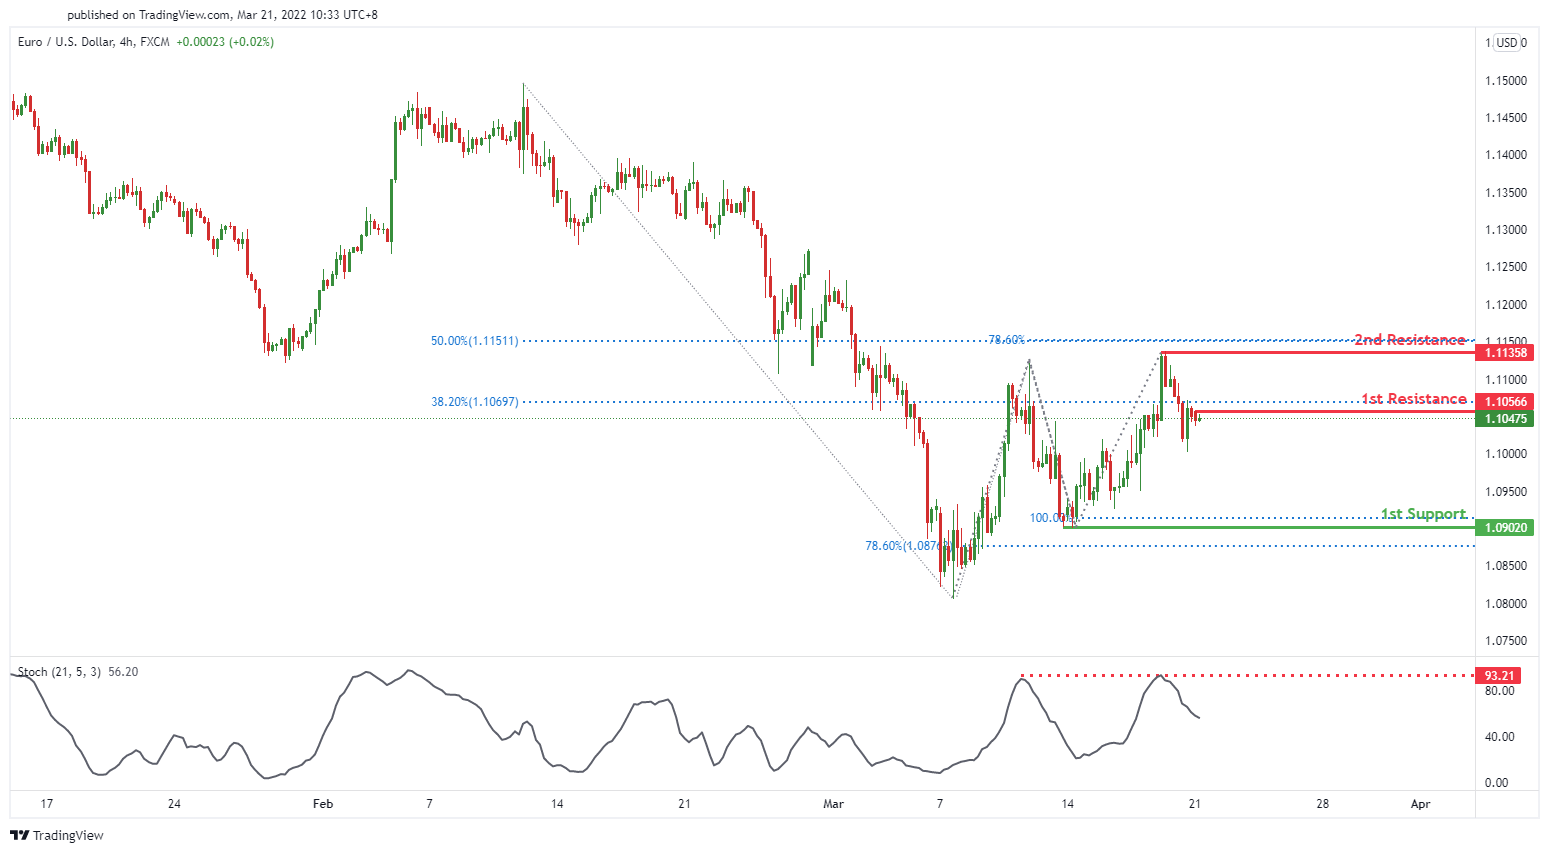
On the H4 price is near 1st resistance level of 1.10566 in line with 38.2% Fibonacci retracement. Price can move towards the 1st support level of 1.09020 which is in line with 78.6% Fibonacci retracement and 100% Fibonacci projection. Our bearish bias is supported by the stochastic indicator as it is near resistance level.
Areas of consideration :
- H4 1st resistance at 1.10566
- H4 1st support at 1.09020
USD/JPY:
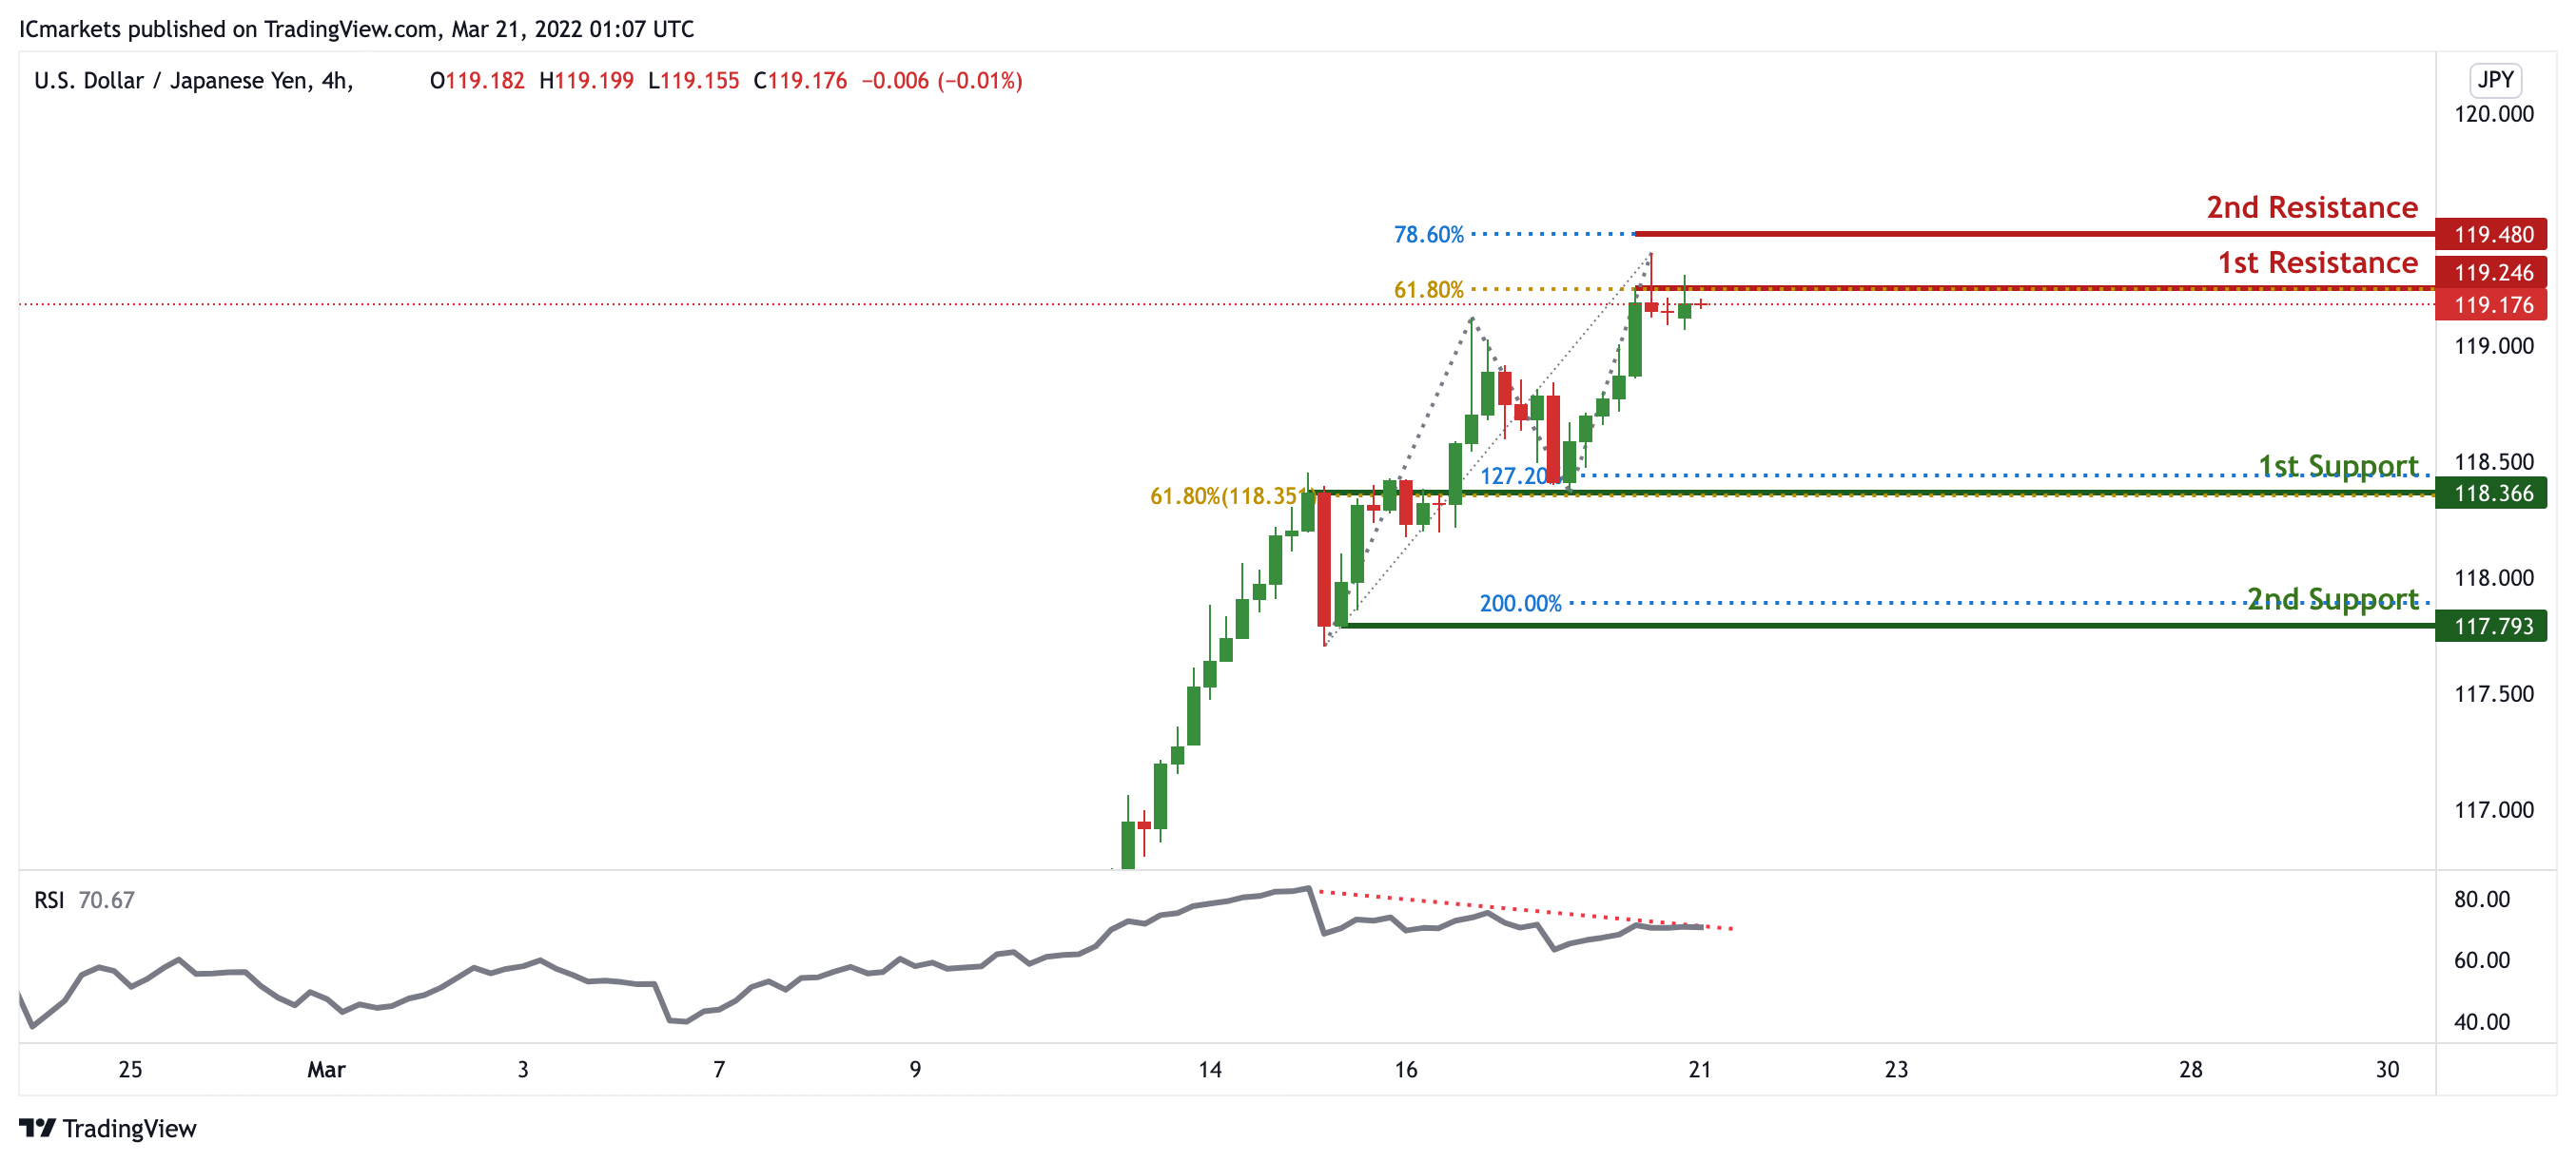
On the H4 timeframe, prices have approached pivot and swing high. We see the potential for a short pullback from our 1st resistance at 119.246 in line with 61.8% Fibonacci projection towards our 1st support at 118.366 in line with 61.8% Fibonacci retracement and 127.2% Fibonacci Projection. Divergence is spotted on RSI, further supporting our bearish bias.
Areas of consideration:
- H4 time frame, 1st resistance at 119.246
- H4 time frame, 1st support at 118.366
AUD/USD:
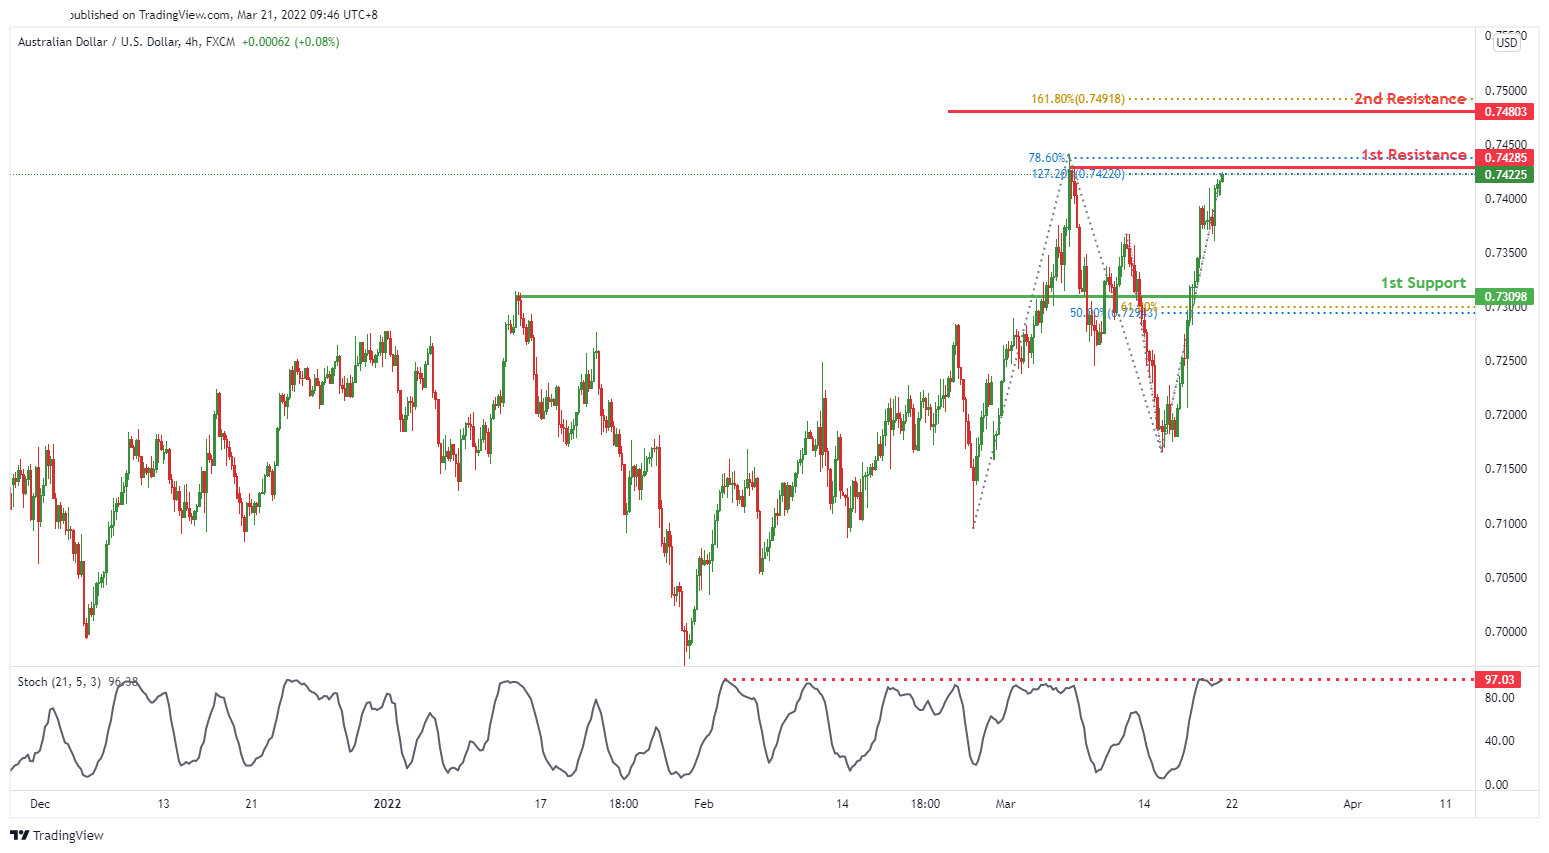
On the H4, price is near 1st resistance level of 0.74285 in line with 78.6% Fibonacci retracement and 161.8% Fibonacci extension. Price can move towards the 1st support level of 0.73098 which is in line with 50% Fibonacci retracement and 61.8% Fibonacci projection. Our bearish bias is supported by stochastic indicator where it is at resistance level.
Areas of consideration
- H4 1st resistance at 0.74285
- H4 1st support at 0.73098
NZD/USD:
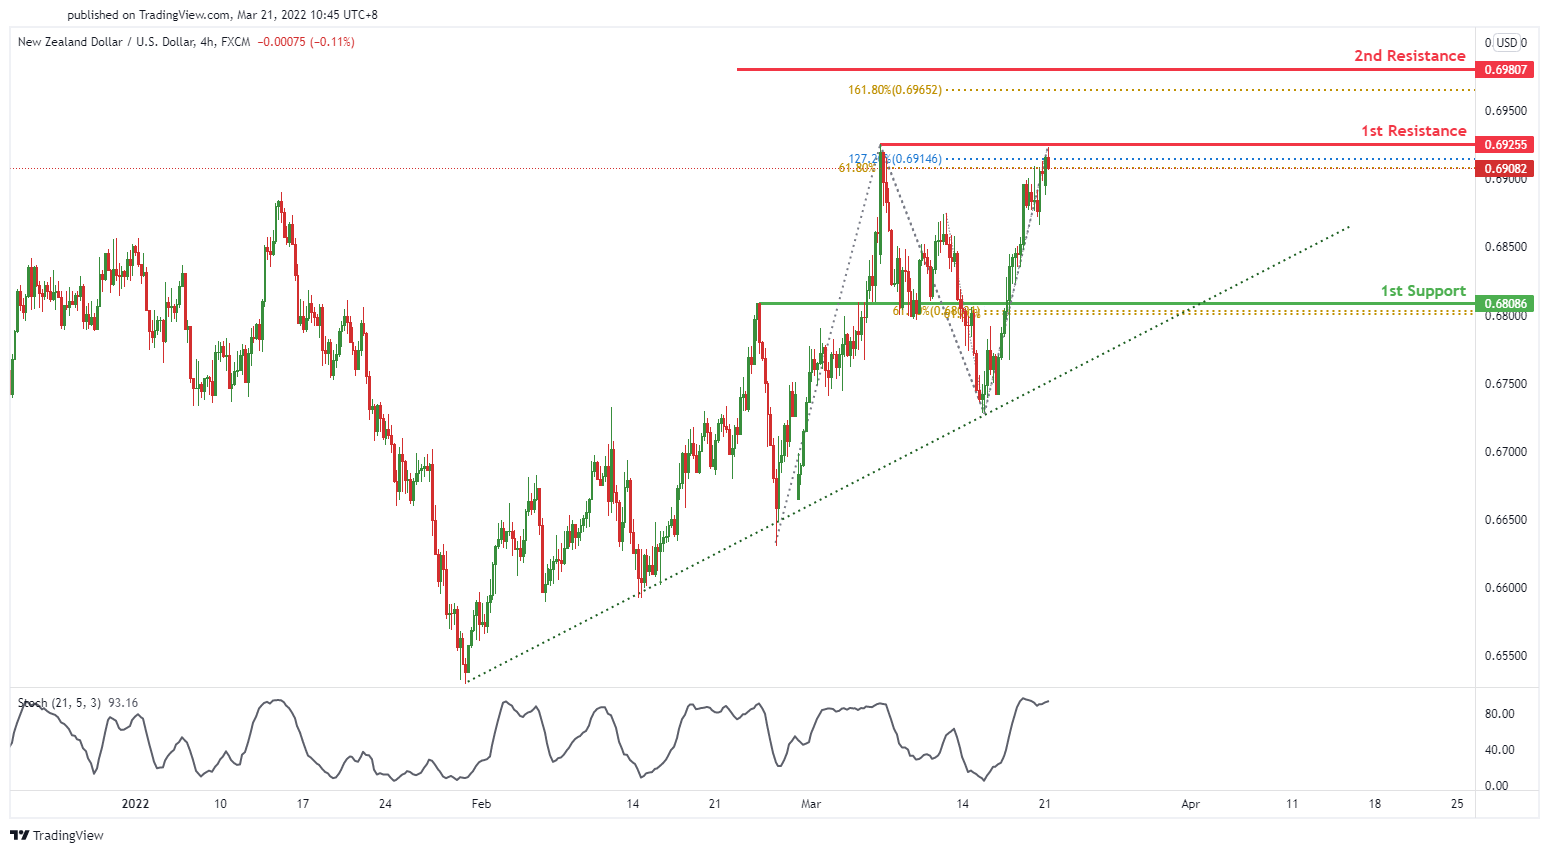
On the H4, price is expected to drop closer to the ascending trendline. Price is near 1st resistance level of 0.69255 in line with 61.8% Fibonacci projection and 127.2% Fibonacci extension. Price can move towards the 1st support level of 0.68086 which is in line with 61.8% Fibonacci retracement and 61.8% Fibonacci projection.Our bearish bias is supported by stochastic indicator where it is at resistance level.
Areas of consideration :
- H4 1st resistance at 0.69255
- H4 1st support at 0.68086
USD/CAD:
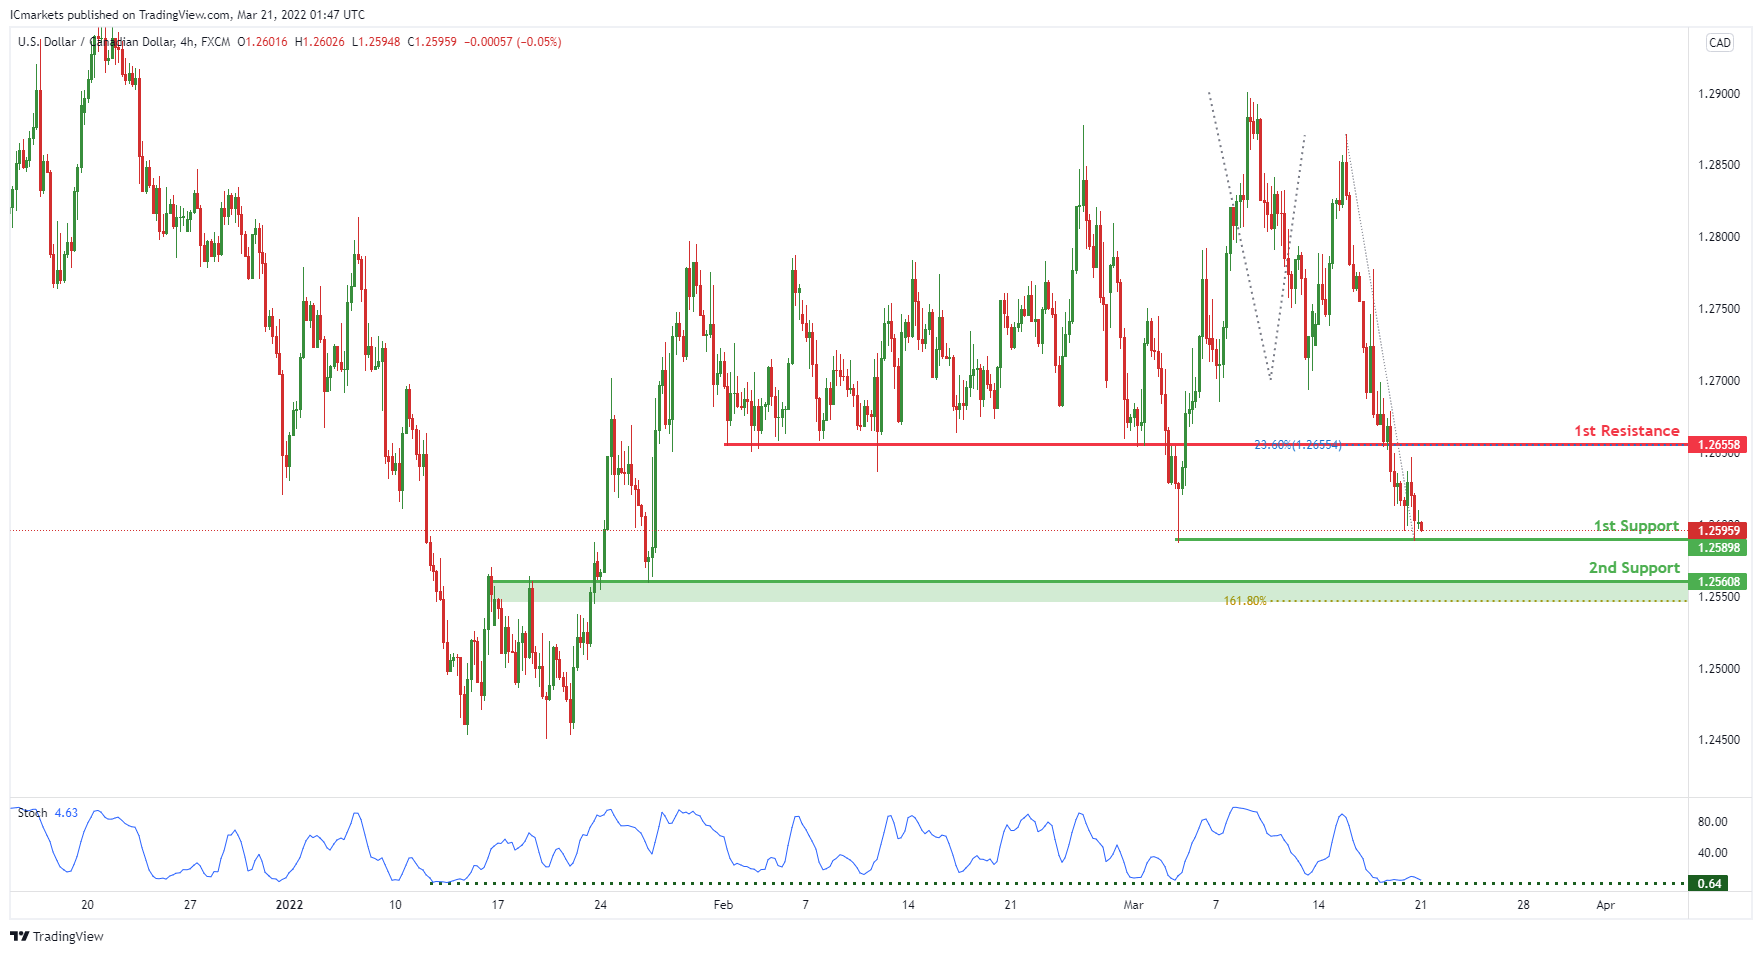
On the H4, with price expected to bounce off the stochastics indicator, we have a bias that price will rise to our 1st resistance at 1.26558 in line with the 23.6% Fibonacci retracement from our 1st support at 1.25898 in line with the horizontal swing low support. Alternatively, price may break 1st support structure and head for 2nd support at 1.25608 in line with the 161.8% Fibonacci projection.
Areas of consideration:
- H4 time frame, 1st support at 1.25898
- H4 time frame, 1st resistance at 1.26558
OIL:
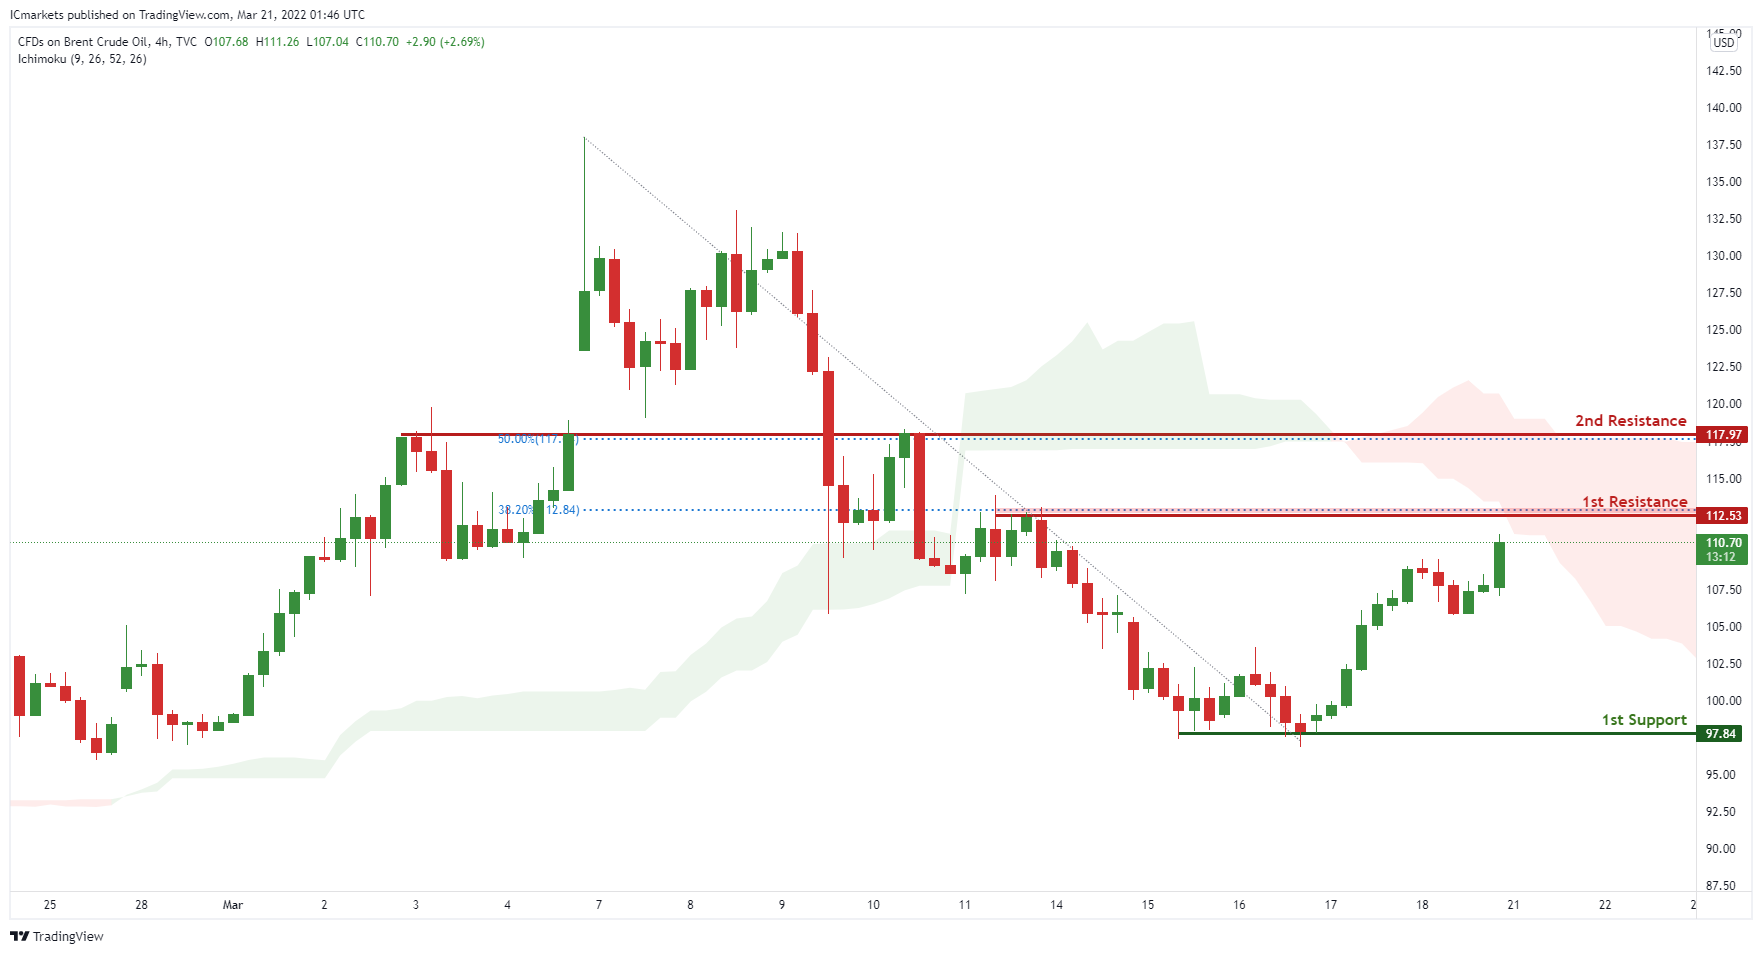
On the H4, with price moving below the ichimoku cloud, we have a bias that price will drop from 1st resistance at 112.53 in line with the horizontal overlap resistance and 38.2% Fibonacci retracement to 1st support at 97.84 in line with the swing low support .Alternatively, price may break 1st resistance and head for 2nd resistance at 117.97.
Areas of consideration:
- H4 time frame, 1st resistance of 112.53
- H4 time frame, 1st support of 97.84
Dow Jones Industrial Average:
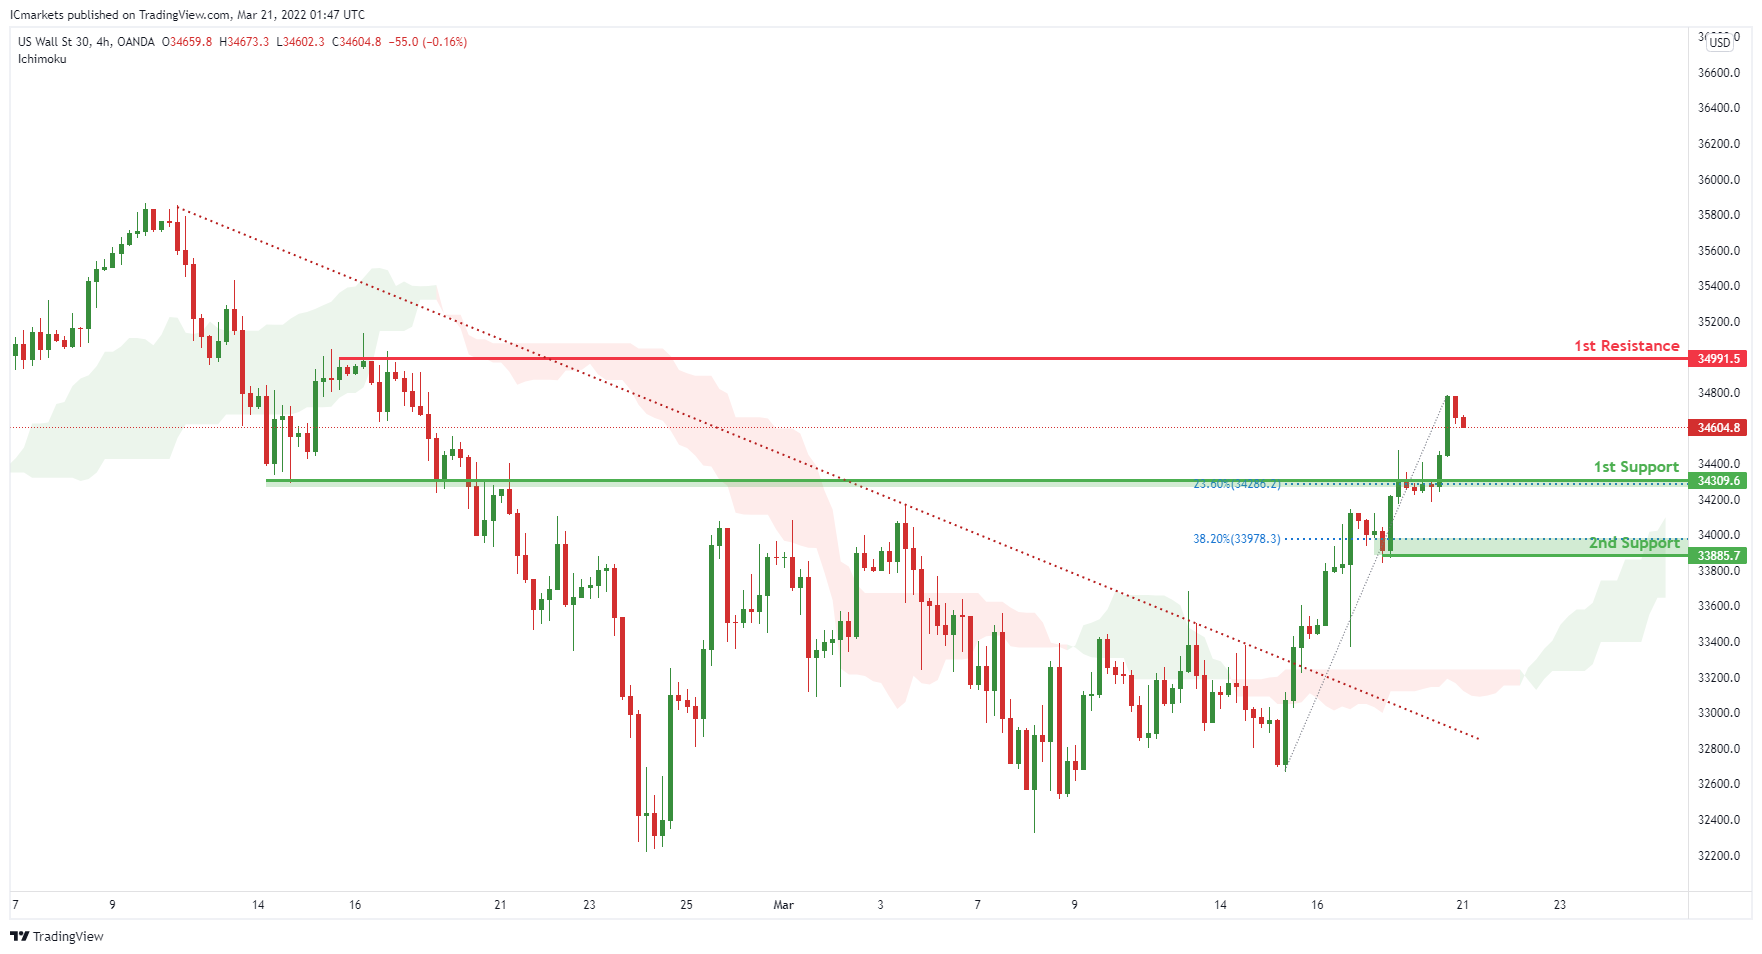
On the H4, with price moving above the ichimoku cloud, we have a bias that price will rise to our 1st resistance at 34991 in line with the horizontal swing high resistance from our 1st support at 34309 in line with the 23.6% Fibonacci retracement. Alternatively, price may break 1st support structure and head for 2nd support at 33885 in line with the 38.2% Fibonacci retracement.
Areas of consideration :
- H4 1st support at 34309
- H4 1st resistance at 34991
WTI crude oil extending rebound, pressing 108 fib level
WTI crude oil is extends the near term rebound and is back above 108. It's reported that OPEC+ missed its production target by slightly more than 1m barrels per day in February. At the same time, some Baltic countries are pushing EU for an oil embargo on Russia for its invasion of Ukraine.
WTI is now pressing 38.2% retracement of 131.82 to 93.98 at 108.43. Sustained trading above there will pave the way to 61.8% retracement at 117.36 and above. Such development would also affirm the case that corrective pattern from 131.82 high is a sideway pattern. This is the preferred case given the notable support from 55 day EMA.
Nevertheless, rejection by 108.43, followed by break of 103.01 minor support will likely extend the fall from 131.82 through 93.98, and set up a deep correction instead.
New Zealand goods export rose 22% yoy in Feb, imports rose 37% yoy
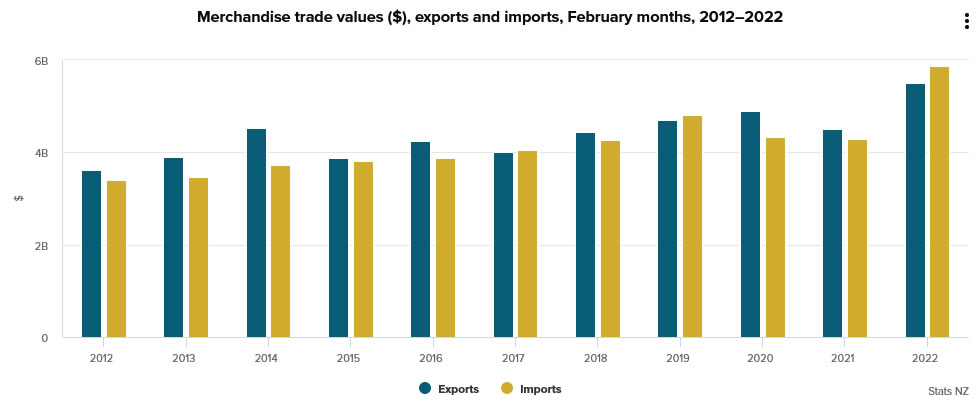
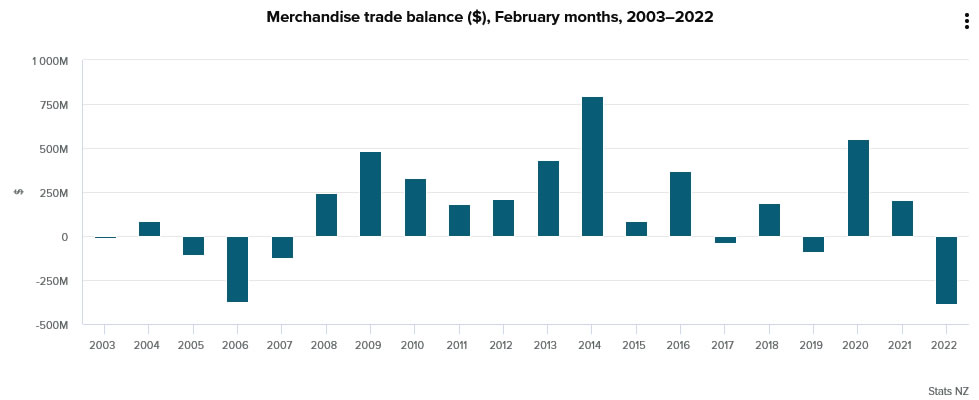
New Zealand goods exports rose 22% yoy to NZD 5.5B in February. Goods imports rose 37% yoy to NZD 5.9B. Trade deficit came in at NZD -385m, smaller than expectation of NZD -808m.
Exports to all top destinations increased, including China (up NZD 80m or 5.4%), Australia (up NZD 119m or 22.0%), US (up NZD 37m or 7.4%), EU (up NZD 62m or 25%), and Japan (up NZD 71m or 34%).
Imports from all top partners also rose, including China (up NZD 490m or 45%), EUR (up NZD 209m or 32%), Australia (up NZD 137m or 26%), US (up NZD 105m or 29%), and Japan (up NZD 167m or 60%).
EUR/USD Recovery Faces Many Challenges
Key Highlights
- EUR/USD started an upside correction from the 1.0800 support zone.
- A key bearish trend line is forming with resistance near 1.1120 on the 4-hours chart.
- GBP/USD could attempt a strong increase above the 1.3200 resistance.
- Gold price is correcting gains and might decline below $1,900.
EUR/USD Technical Analysis
The Euro found support near the 1.0800 zone against the US Dollar. EUR/USD started an upside correction and traded above the 1.0950 resistance zone.
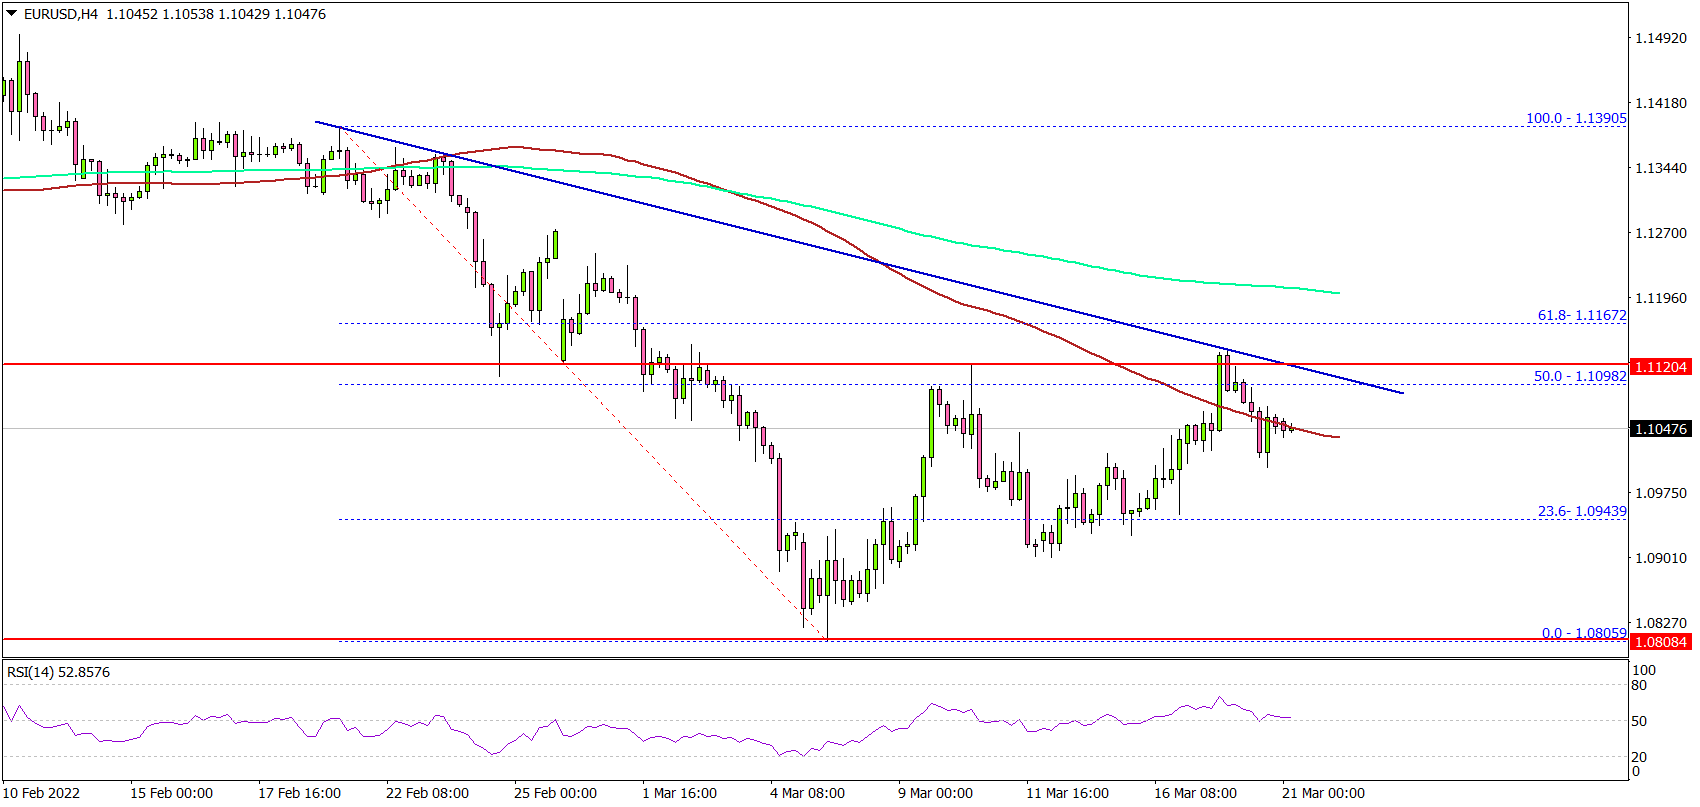
Looking at the 4-hours chart, the pair was able to clear the 1.1000 resistance zone. The bulls were able to push the price above the 1.1050 resistance. There was also a move above the 23.6% Fib retracement level of the key decline from the 1.1390 swing high to 1.0805 swing low.
Finally, there was a spike above the 1.1100 level and the 100 simple moving average (red, 4-hours). However, there was no clear move above the 50% Fib retracement level of the key decline from the 1.1390 swing high to 1.0805 swing low.
There is also a key bearish trend line forming with resistance near 1.1120 on the same chart. The next major resistance is near the 1.1200 level and the 200 simple moving average (green, 4-hours).
A clear move above the 1.1200 resistance zone could open the doors for a move towards the 1.1280 and 1.1320 levels.
Conversely, EUR/USD might start a fresh decline below the 1.1000 support zone. The next major support is near the 1.0920 level.
Looking at GBP/USD, the pair might soon attempt to gain pace above 1.3200 and 1.3220. Besides, gold price is slowly moving lower towards the $1,880 support zone.
Economic Releases
- Chicago Fed National Activity Index for Feb 2022 – Forecast 0.29, versus 0.69 previous.