Sample Category Title
Strong Growth Momentum and Broadening Inflation Keeping the BoC in Hiking Mode
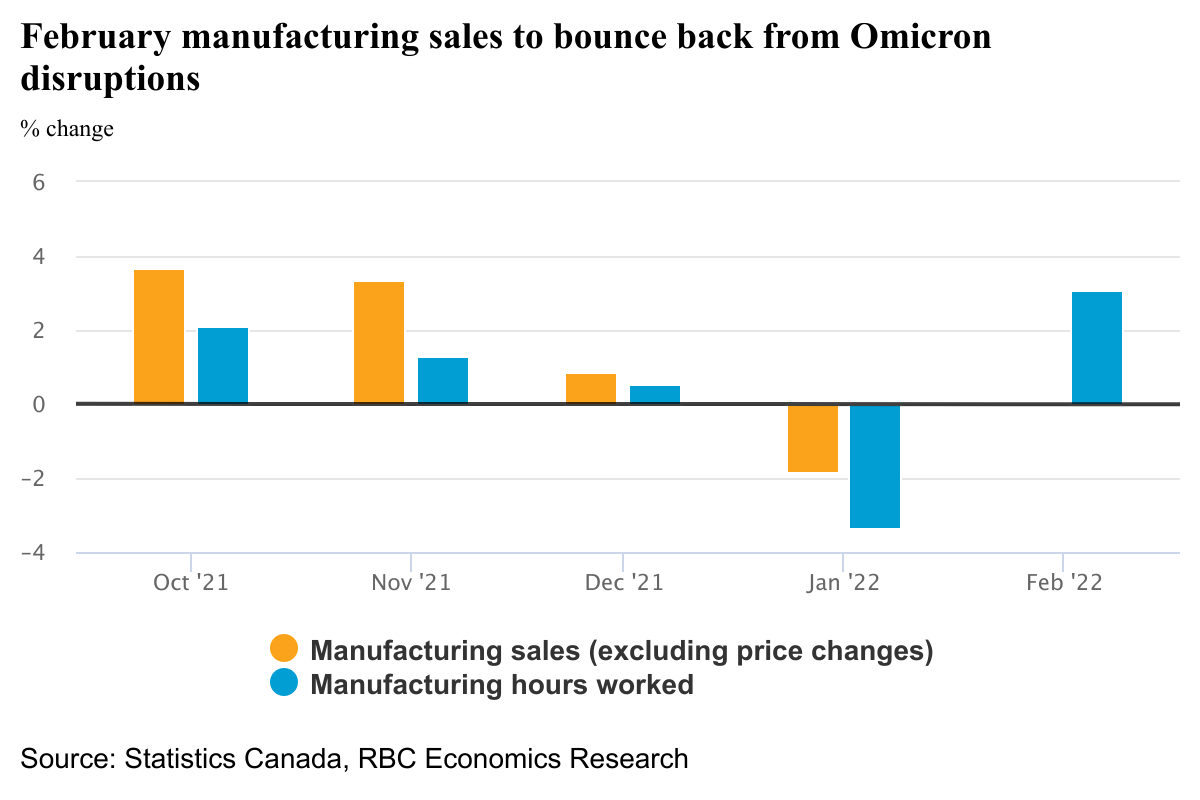
A relatively quiet data week in Canada should show a bounce-back in the flash estimate of manufacturing sales after a soft January. Higher oil prices boosted the nominal value of petroleum sales in January and likely will again in February with crude oil prices up another 10% in February. But sale volumes also likely bounced back after a 1.8% January drop. Manufacturing hours worked surged back (+3.1%) in February after a 3.3% drop in the prior month when rapid Omicron spread (and another round of auto supply chain disruptions) kept workers closer to home.
Data on food services sales also likely looked weak in January with restaurant dining rooms closed in Ontario and Quebec, but our own card spending tracking shows that services spending also rebounded sharply in February as virus spread and restrictions eased. The shrinking economic impact of the pandemic, and broadening inflation pressures are pushing the Bank of Canada to follow through on planned rate hikes despite increased geopolitical risks from the Russian invasion of Ukraine.
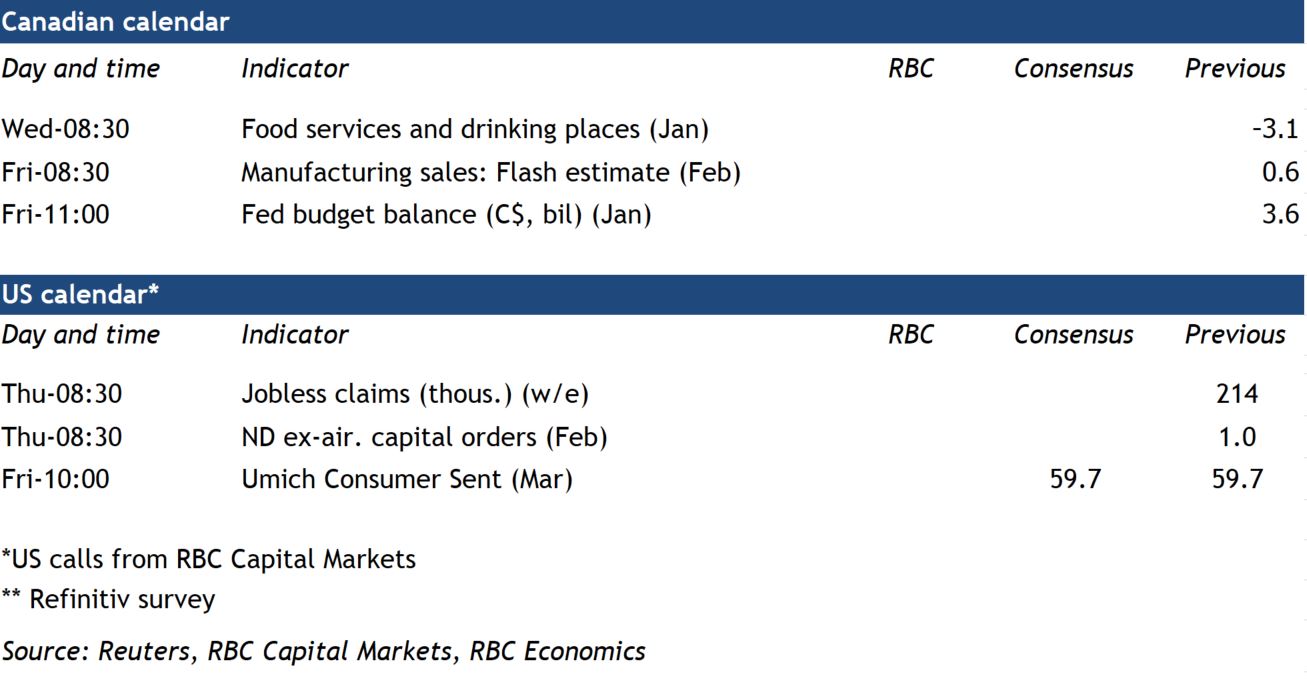
Week ahead data watch:
Canadian manufacturing sales will likely be boosted by higher petroleum prices with crude oil prices jumping higher again in February (a trend that has continued in March with the Russian invasion of Ukraine.) But we expect sale volumes bounced back after a 1.8% drop in January on a 3.1% rebound in February hours worked after a 3.3% drop in the prior month.
Weekly Focus – Hopes for Peace Boost Market Sentiment as Fed Starts Hiking
Positive signals from Russia-Ukraine talks boosted market sentiment this week. Media reports that Ukrainian and Russian negotiators are discussing a 15-point draft peace deal raised early optimism that the two sides could be approaching a diplomatic solution to the ongoing war in Ukraine. In our Research Russia-Ukraine - Updated scenarios and implications for commodity markets, March 9, we argue that the two sides are likely to eventually agree on a ceasefire/truce but that will require some painful concessions from the Ukrainian side. Despite a potential truce, some level of conflict/unrest is likely to remain but on a baseline we do not expect an escalation of the conflict outside Ukraine.
In our base case of a frozen conflict in Ukraine, we think the global economy will see weaker growth but escape a recession (see Big Picture - Headwinds to the global economy from Ukraine and Fed tightening, March 17). In a downside scenario, where there is an escalation of the war beyond the borders of Ukraine, the risk of recession in Europe increases significantly. With rising inflation, euro area consumers will see the biggest real income erosion in decades this year, and we revise down our 2022 euro area GDP forecast to 2.5%. The US economy is more insulated from the Ukraine war repercussions, but strong stagflation dynamics will keep the pressure on Fed to tighten financial conditions. Overall, we now expect US GDP growth of 2.8% this year. We have also postponed our expectation of a recovery in China and now look for GDP growth of only 4.7% this year.
As widely expected, Fed launched its hiking cycle on Wednesday by raising the Fed funds target range by 25 bps to 0.25-0.50%. Despite signalling six further rate hikes for this year, we still think Fed is behind the curve, and keep our call unchanged, expecting a total of 175bp hikes this year (25bp at each meeting but 50bp in June). We still expect an announcement on QT in May.
Risk markets recovered this week on the back of rising optimism around Russia-Ukraine talks. Equity markets gained in Europe and the US, and EUR pared losses against USD breaching 1.10 level. German and US 10y yields increased around 10bp as demand for safe havens took a breather. Commodity prices also backed off with Brent oil briefly visiting below USD 100/barrel and European gas prices hovering around 110€/MWh. Despite optimism around peace talks, we highlight that markets remain highly sensitive to headlines. Also, in the light of ever more aggressive use of force by the Russian army against civilians in Ukraine, we cannot rule out a further step-up of Western sanctions against Russia, and a potential further hit to the global risk sentiment.
In the coming week, focus will remain in Ukraine war developments and the peace talks. European leaders will meet for an EU-summit on Thursday-Friday, discussing the economic fallout from the war and possible fiscal support measures. The data calendar is light but we will keep a close eye on global PMIs on Wednesday. Particularly, we expect the renewed disruptions from the war on supply chains to be reflected in a dip in the euro area manufacturing activity.
Fed Waller: I really favor front-loading our rate hikes
Fed Governor Christopher Waller told CNBC, "I really favor front-loading our rate hikes, that we need to do more withdrawal of accommodation now if we want to have an impact on inflation later this year and next year."
"So in that sense, the way to front-load it is to pull some rate hikes forward, which would imply 50 basis points at one or multiple meetings in the near future," he added.
"The data's basically screaming at us to go 50, but the geopolitical events were telling you to go forward with caution," he said. "So those two factors combined pushed me off of advocating for a 50-basis-point hike and supporting the 25-point hike that we enacted."
Waller also said the quantitative tightening should start "in the next meeting or two." "We're in a different place than we were before," he said. "We have a much bigger balance sheet, the economy's in a much different position. Inflation is raging. So, we're in a position where we could actually draw down a large amount of liquidity out of the system without really doing much damage."
EUR/USD Outlook: Negative Fundamentals Weigh Heavily and May Stall the Recovery
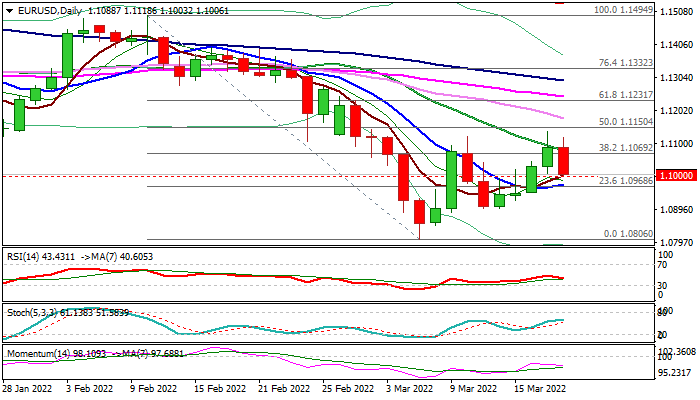
The Euro eases on Friday but is on track for the first bullish weekly close in six weeks that adds to positive signals as Doji reversal pattern is forming on weekly chart.
On the other side, fresh bulls face difficulties at pivotal Fibo barrier at 1.1069 (38.2% of 1.1494/1.0806), although Thursday’s action registered a close above this level, as there is a threat of formation of a bull-trap on weekly chart if the price fails to end week above this level.
Daily studies showed a slight improvement, but remain overall negative, as bearish momentum starting to strengthen after a brief easing, which keeps the downside vulnerable. The risk is also seen on a drop and close below psychological 1.10 level (also near 38.2% retracement of 1.0806/1.1137 recovery).
Fundamentals also do not work in favor of the single currency, as Fed raised interest rates and signaled increased pace of further hikes, diverging from the ECB, which still keeps rates at zero, while growing pessimism over the situation in Ukraine, continues to dampen risk appetite.
Pivotal levels at the downside lay at 1.10 and 1.0973 (10DMA) while 1.1069 (Fibo) and 1.1079 (20DMA) mark upper triggers.
Res: 1.1069; 1.1079; 1.1137; 1.1150.
Sup: 1.1000; 1.0973; 1.0950; 1.0900.
GBPJPY Eyes Nearby Ceiling after Extending above MAs
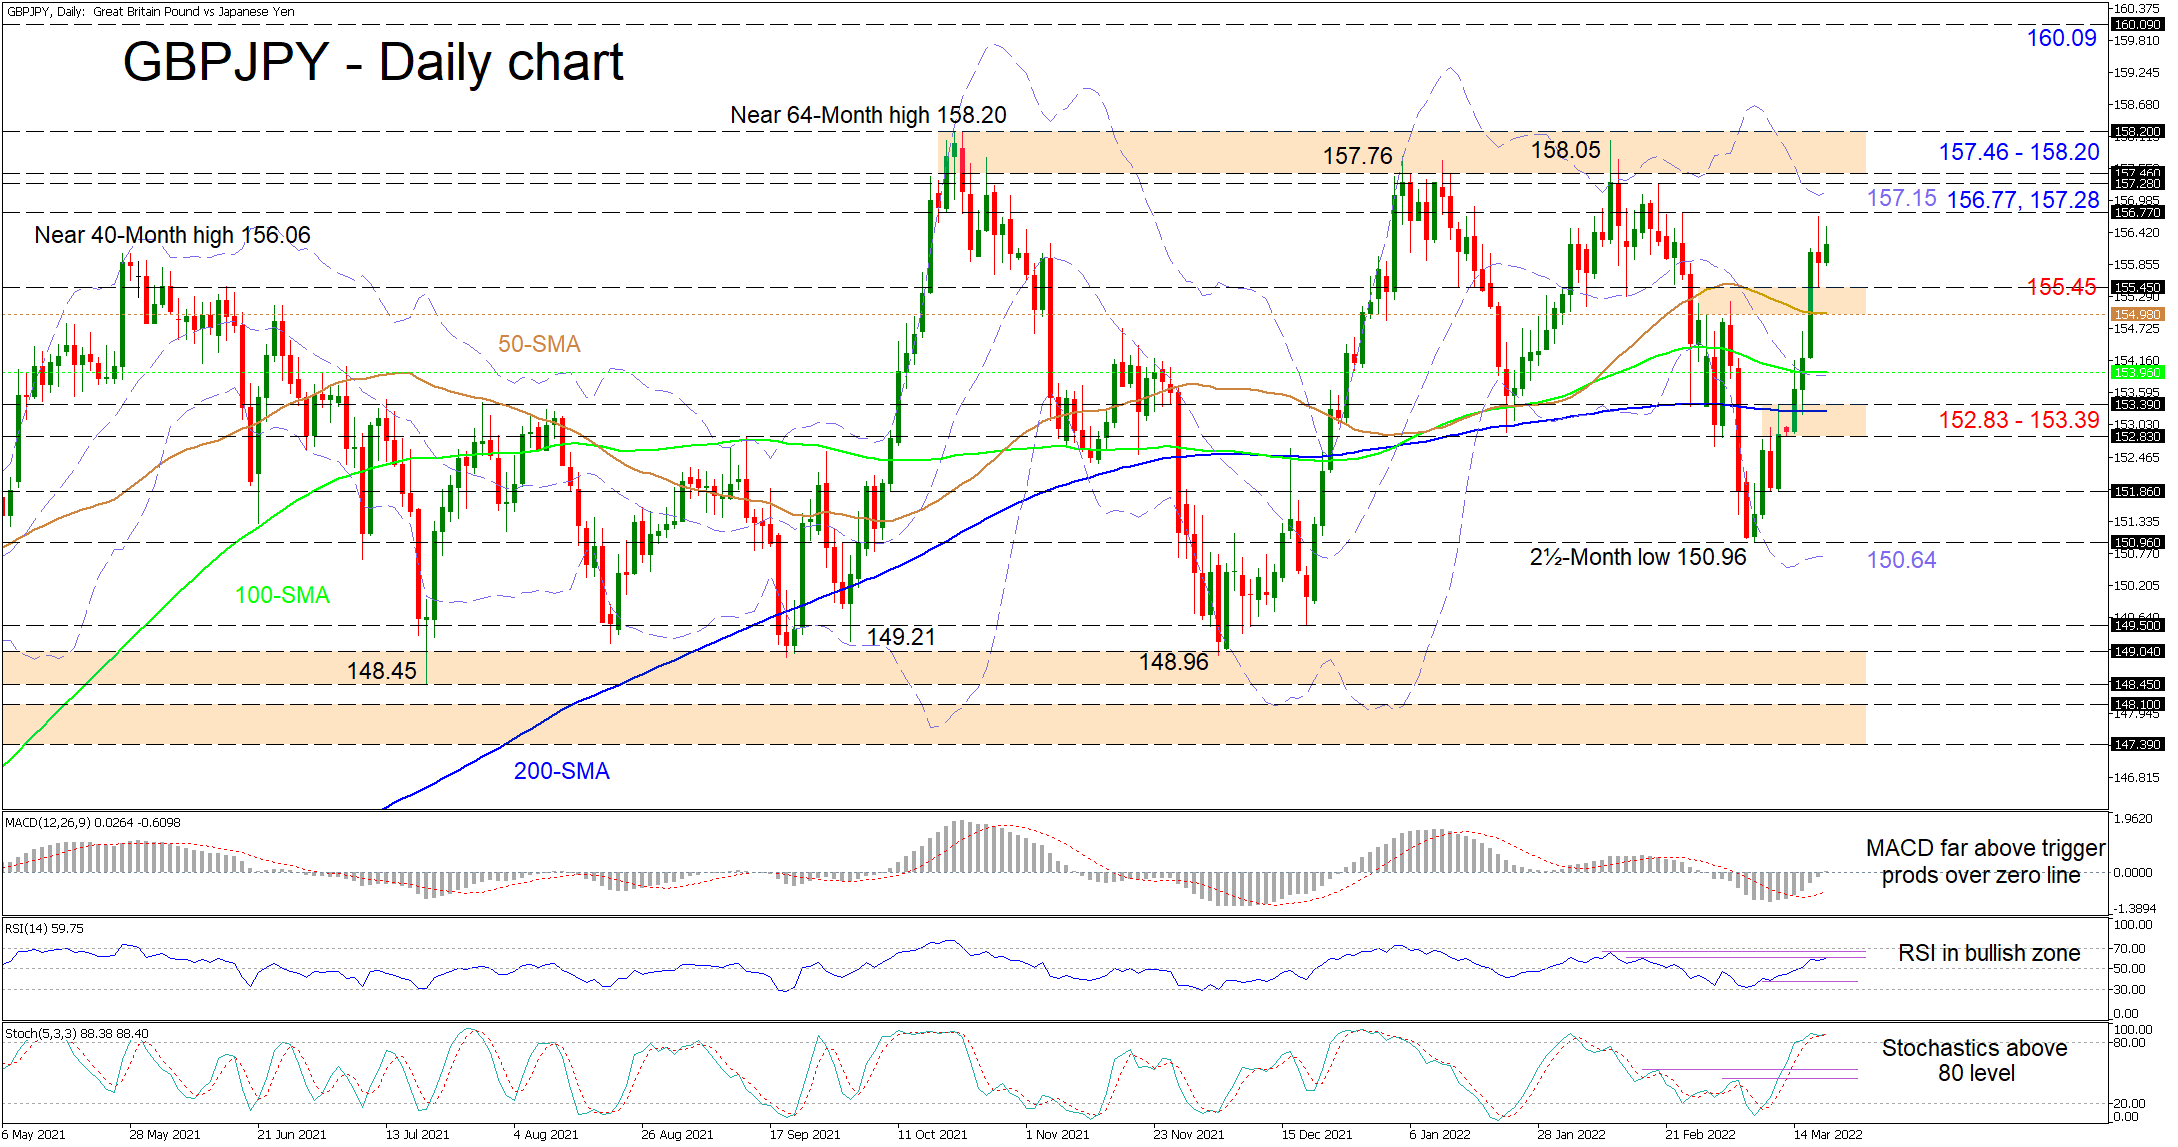
GBPJPY is targeting the 156.77 barrier after maintaining a two-week climb from the 150.96 low, which also managed to overstep the simple moving averages (SMAs). For some time now, the SMAs have been lacking a distinct trend as the pair has mostly been trading between the 148.45 and 158.20 price limits.
The short-term oscillators are revealing a neutral-to-bullish price mood in the pair. The MACD, has deviated away from its red trigger line, which is in the negative zone, and has nudged into the positive region. The RSI is pointing higher in the bullish zone, while the stochastic lines are maintaining a positive charge in the overbought territory.
Preserving the current price trajectory, upside limitations could originate from the 156.77 and 157.28 highs, moulding a buffer zone, which also encapsulates the upper Bollinger band at 157.15. Nonetheless, adjacent to this is the 157.46-158.20 ceiling of a more than five-month range, which is further fortifying the barricade impeding additional advances in the pair. However, if buyers manage to overpower these obstacles, the price may then propel towards the June 2016 high of 160.09, where the pair previously collapsed considerably.
Alternatively, if bullish pressures start to fade, initial support could arise from the 154.98-155.45 support area, the former being the 50-day SMA. A deeper pullback in the pair may then confront support around the 153.96 level, where the 100-day SMA and the mid-Bollinger band are currently located. Should the price sink a little further, buyers could then attempt to find their feet within the 152.83-153.39 support band, which encompasses the 200-day SMA.
Summarizing, GBPJPY is exhibiting a bullish demeanour above the 155.45 low and the SMAs. For the negative bearing to regain the upper hand, the pair would need to sink beneath the 150.96 trough.
Already Not Extreme Fear: A Turning Point in Stocks
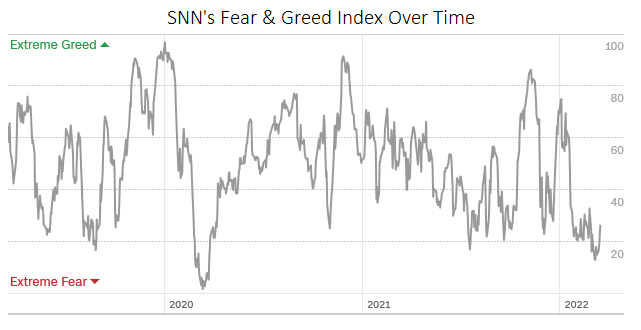
The global equity market also continues to thaw after a pronounced decline since the start of the year. Initial reports of progress on the peace talks were later supported by indications that the US and China are looking to reduce friction between them and avoid new threats against each other.
In addition, reassurances from the world’s major central banks over the past week sounded very encouraging. As a result, the Fear and Greed Index has moved out of the extreme fear territory, having bottomed out last week at levels last seen in March 2020. A return to territory above 20 for the index would typically mean a reversal to growth.
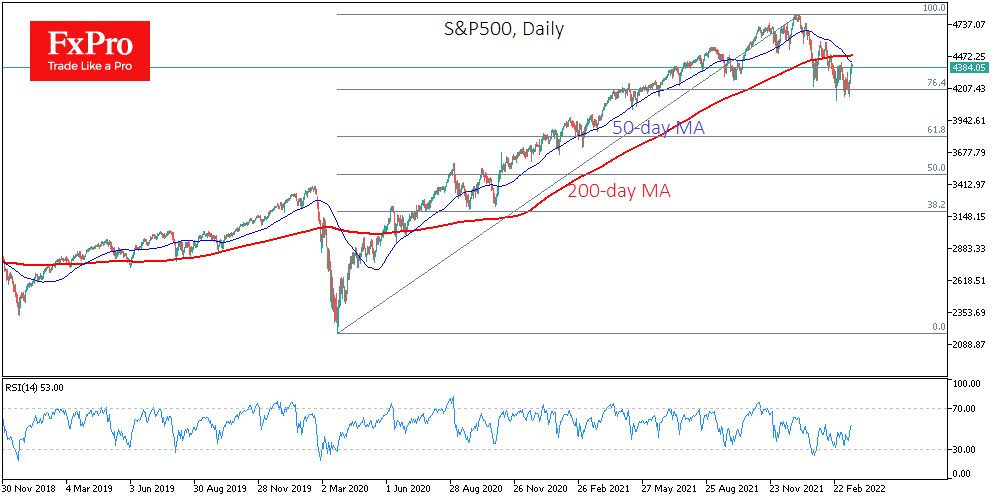
One should note the increasing divergence between the S&P500 price and the Relative Strength Index, where since late January, S&P500’s lower lows has been marked by RSI’s higher low.
The S&P500 has bounced back from its lows by almost 6% and is now testing the 50-day moving average. A consolidation above 4400 would signal the start of a broader, more powerful rally. Now it looks like the bravest already bought when there was “blood on the streets”; now, it is time for a broader range of buyers to step in.
Gold and oil prices remain indicators of the military stand-off between Russia and Ukraine. Signs that progress in talks has stalled have put prices of these assets back on an upward trajectory.
Brent crude oil was trading more than 11% above levels at the end of trading on March 16 at the start of the day on Friday. A glance at the chart suggests that technically quotations remain within the uptrend that began back in December. This is in line with the supposed progress in de-escalation between Russia and Ukraine. In our view, it is already worth noting that fears over energy supplies are no longer panic-driven but more constructive, lengthening the forecast horizon.
Bitcoin Whale Activity Has Fallen to the Lowest
Bitcoin is down 0.4% over the past 24 hours to $40.7K. Ethereum has added 1.5% over the same time, other leading altcoins from the top ten are changing from -2.0% (Terra) to 5% (Avalanche).
The total capitalization of the crypto market, according to CoinMarketCap, grew by 0.3% over the day, to $1.83 trillion. The Bitcoin dominance index decreased by 0.4% to 42.4% due to the better dynamics of altcoins.
The crypto-currency index of fear and greed lost 2 points to 25 in a day and again found itself in a state of “extreme fear”.
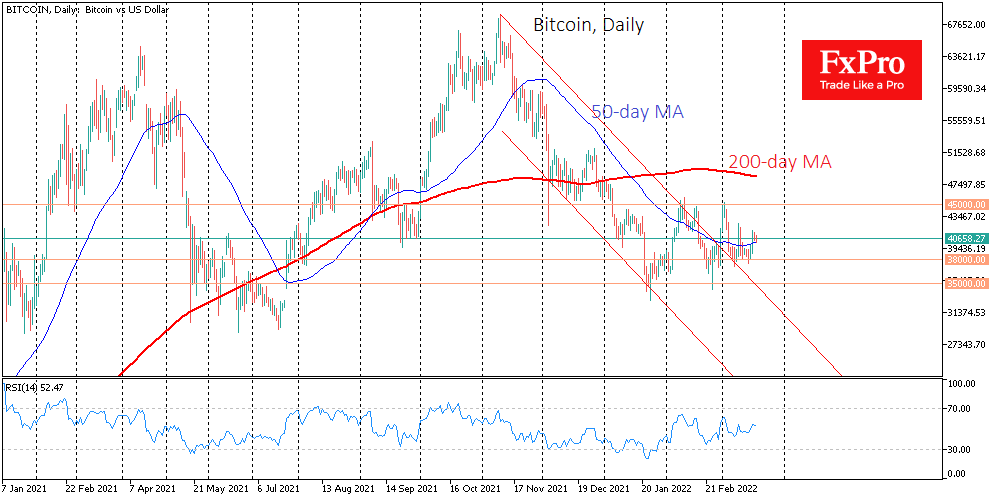
Despite the outstripping dynamics of altcoins, a sequence of lower and lower local highs continues to form in Bitcoin. In early February, the upside lost momentum as it moved above $45.5K. In the first days of March, the bears already dominated on the way to $45K, on the 8th already near $42.5K, and in the last two days, they are trying to form a downward reversal at $41.5K. At the same time, the bulls manage to form strong support near $38K.
In terms of technical analysis, BTCUSD remains close to its 50-day moving average, clearly indicating the absence of any trend now. However, consolidation in a descending triangle is usually a respite before the next decline. We will see the implementation of this scenario if BTCUSD fixes under $38K. An alternative scenario and a new upside momentum should be expected if the bulls manage to push the price above the previous highs of $42.5K, or close the day/week above $42K.
Galaxy Digital CEO Mike Novogratz, known for his bullish predictions, has unveiled a new one that sees BTC hit $500,000 in 2025.
According to the Santiment team, Bitcoin whale activity has fallen to its lowest level in a year in recent days. Therefore, one should not expect sharp movements in the market soon.
EUR/USD Mid-Day Outlook
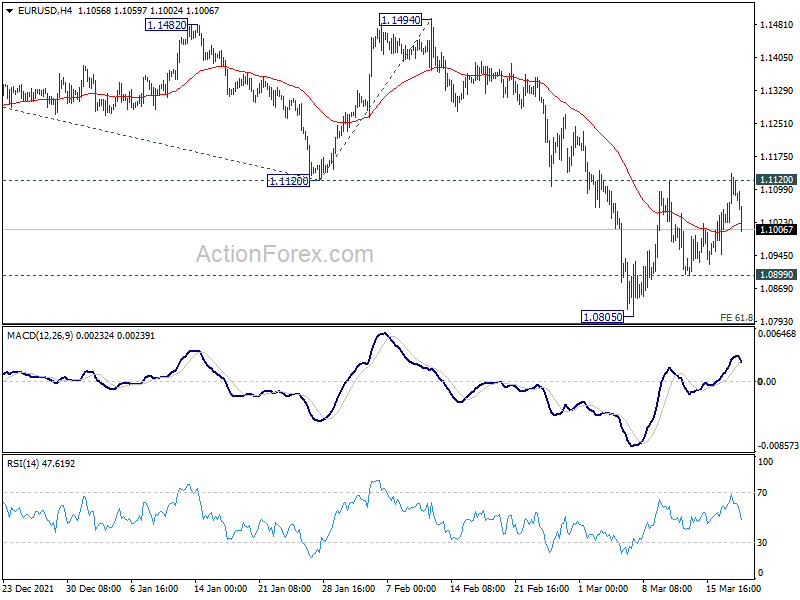
Daily Pivots: (S1) 1.1022; (P) 1.1079; (R1) 1.1150; More...
Despite breaching 1.1120 support turned resistance briefly, EUR/USD quickly retreated. Intraday bias remains neutral first. Rejection by 1.1120 will retain near term bearishness. Break of 1.0899 minor support should resume larger down trend from 1.2348 through 1.0805. However, firm break of 1.1120 will confirm short term bottoming at 1.0805. Bias will be back on the upside for 55 day EMA (now at 1.1206).
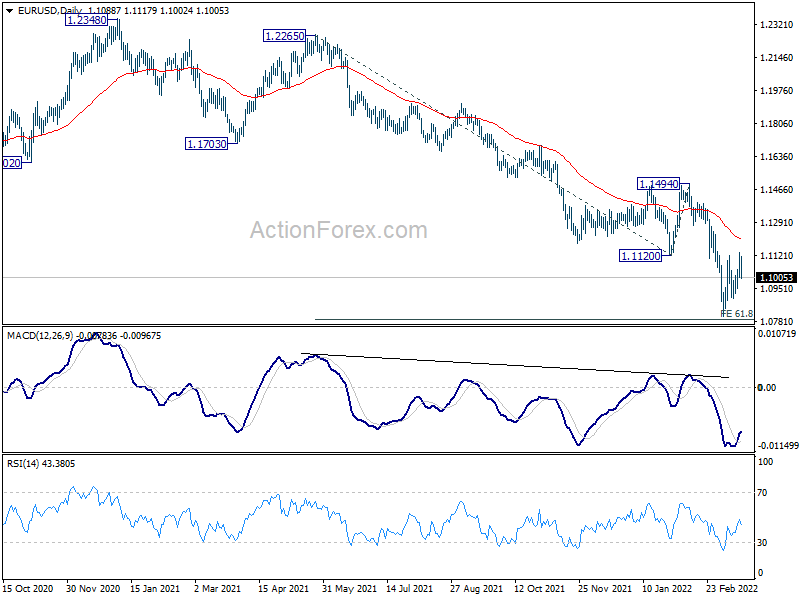
In the bigger picture, the decline from 1.2348 (2021 high) is expected to continue as long as 1.1494 resistance holds. Firm break of 1.0635 (2020 low) will raise the chance of long term down trend resumption and target a retest on 1.0339 (2017 low) next. Nevertheless, break of 1.1494 will maintain medium term neutral outlook, and extend range trading first.
GBP/USD Mid-Day Outlook
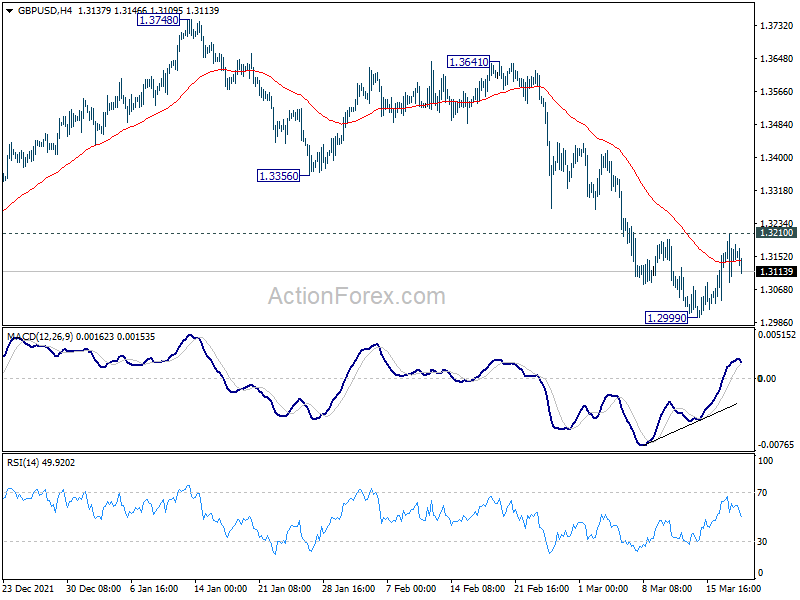
Daily Pivots: (S1) 1.3088; (P) 1.3150; (R1) 1.3211; More...
Intraday bias in GBP/USD remains neutral at this point. With 1.3210 minor resistance intact, further decline is still in favor. On the downside, break of 1.2999 will resume larger down trend from 1.4248. However, on the upside, firm break of 1.3210 minor resistance should confirm short term bottoming at 1.2999. Intraday bias will be back to the upside for 55 day EMA (now at 1.3368).
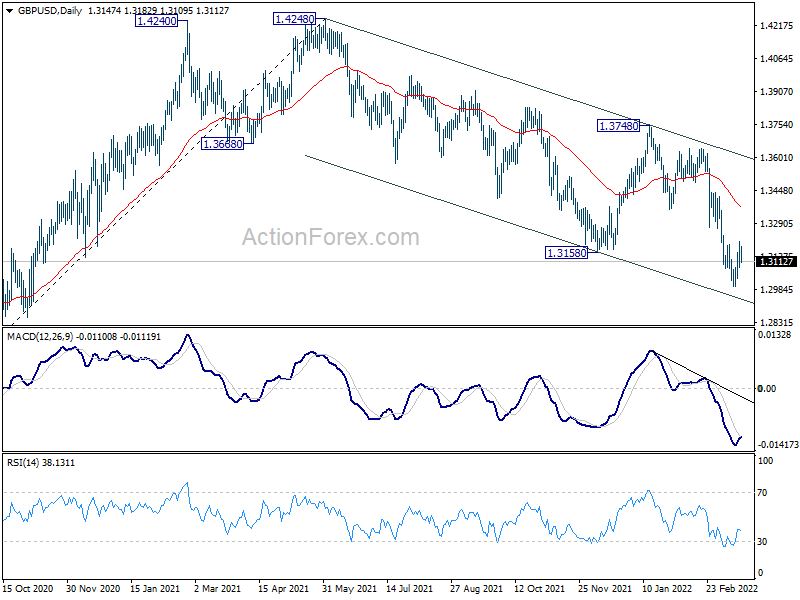
In the bigger picture, current development suggests that the up trend from 1.1409 (2020 low) has completed at 1.4248. Decline from 1.4248 could still be a corrective move, or it could be the start of a long term down trend. In either case, deeper decline would be seen back to 61.8% retracement of 2.1161 to 1.1409 at 1.2493. In any case, break of 1.3748 resistance is needed to indicate medium term bottoming, or outlook will stay bearish.
USD/CHF Daily Outlook
Daily Pivots: (S1) 0.9327; (P) 0.9379; (R1) 0.9422; More....
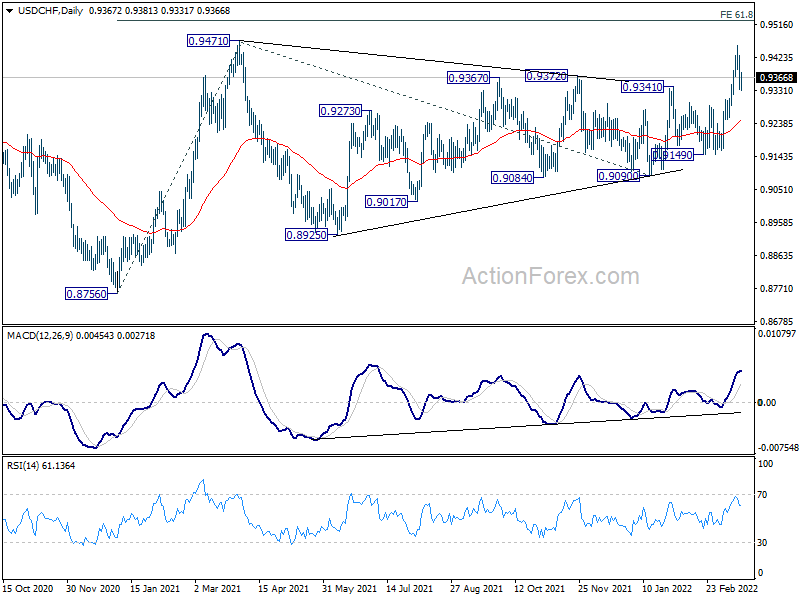
Intraday bias in USD/CHF remains neutral at this point. As long as 0.9318 support holds, further rally is still expected. On the upside, above 0.9459 will target 0.9471 resistance first. Break there will resume whole rally from 0.8756 to 61.8% projection of 0.8756 to 0.9471 from 0.9090 at 0.9532. However, break of 0.9318 will bring deeper pull back to 55 day EMA (now at 0.9242).
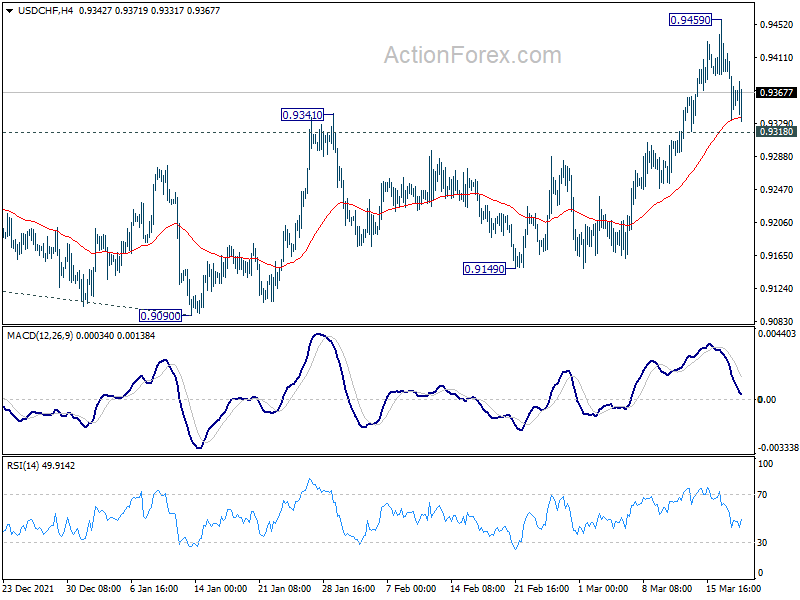
In the bigger picture, medium term outlook will be neutral at best as long as 0.9471 resistance holds. Larger down trend could still extend through 0.8756 (2021 low). However, firm break of 0.9471 will argue that whole down trend form 1.0342 (2016 high), has completed with waves down to 0.8756. A medium term up trend should be set up to target 1.0237/0342 resistance zone.