

Sample Category Title
GBP/USD Attempts to Rebound
The British pound stalled after the BOE failed to secure a unanimous vote for higher rates.
A bullish RSI divergence suggests exhaustion in the sell-off, and combined with the indicator’s oversold condition on the daily chart, may attract buying interest. A tentative break above 1.3190 led some sellers to take profit. The bulls will need to push above the 1.3250 next to the 20-day moving average to get a foothold.
On the downside, the psychological level of 1.3000 is a critical floor to keep the current rebound valid.
EUR/USD Pair Started a Decent Recovery Above $1.0950
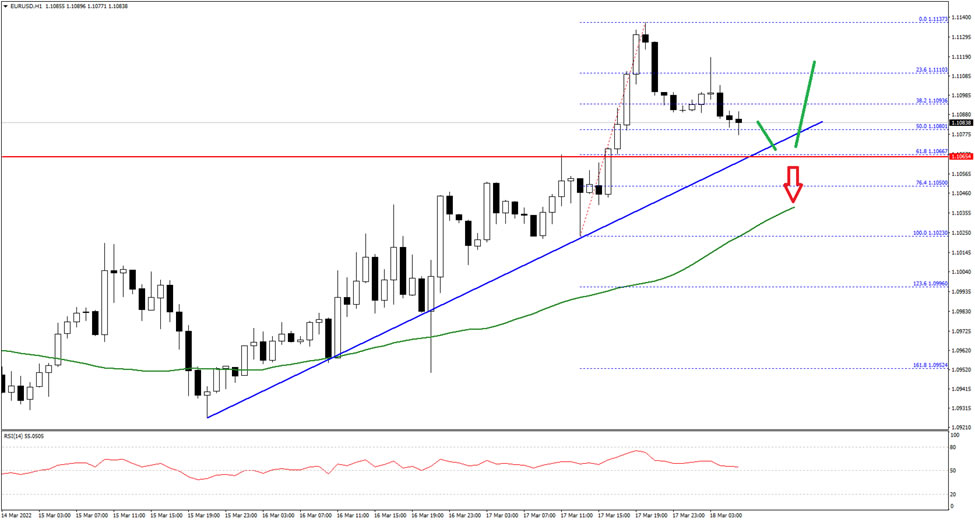
The Euro started a decent recovery wave above 1.0950 against the US Dollar. The EUR/USD pair traded above the 1.1050 resistance level and the 50 hourly simple moving average.
It even moved above the 1.1120 and traded as high as 1.1137. It is now correcting lower and trading below 1.1100. On the downside, there is a key bullish trend line forming with support near 1.1080 on the hourly chart.
The next key support is near 1.1050 on FXOpen, below the pair could decline towards the 1.1020 level in the near term. Any more losses might send the pair towards the 1.0980 level.
On the upside, an immediate resistance near the 1.1095 level. The next major resistance is near the 1.1115 level. A break above the 1.1115 and 1.1120 resistance levels could start a decent increase towards the 1.1160 level in the near term.
USD/CAD Daily Outlook
Daily Pivots: (S1) 1.2595; (P) 1.2647; (R1) 1.2681; More...
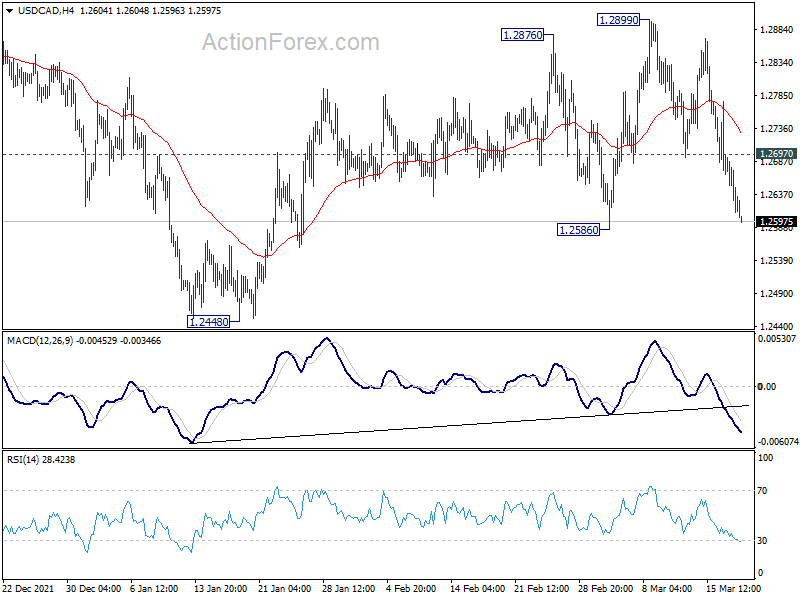
Intraday bias in USD/CAD is now mildly on the downside with focus on 1.2586 support. Break there will suggest that rebound from 1.2448 has completed at 1.2899 already. Deeper decline would then be seen back to 1.2448. On the upside, above 1.2697 minor resistance will turn bias neutral against and extend range trading.
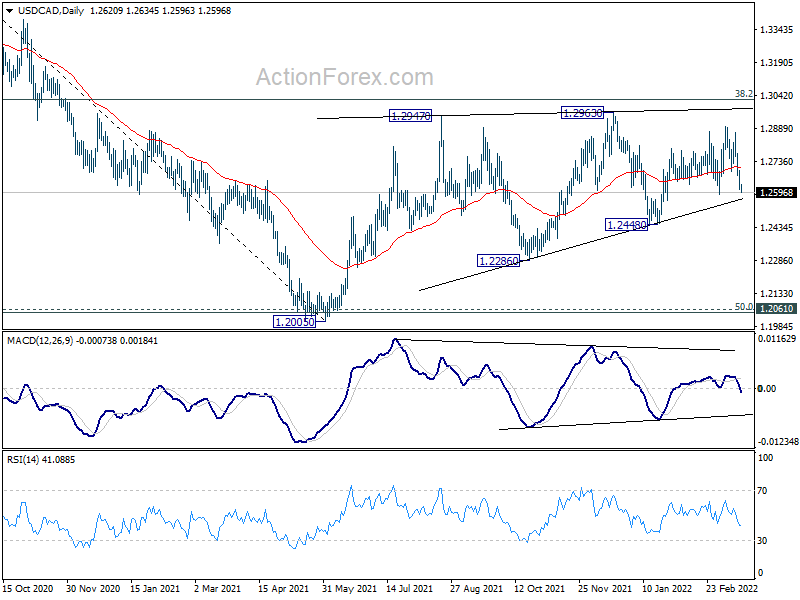
In the bigger picture, focus stays on 38.2% retracement of 1.4667 (2020 high) to 1.2005 (2021 low) at 1.3022. Sustained break there should confirm that the down trend from 1.4667 has completed after defending 1.2061 long term cluster support. Further rise would then be seen towards 61.8% retracement at 1.3650. However, rejection by 1.3022 will maintain medium term bearishness. Break of 1.2005 will resume the down trend from 1.4667 and that carries larger bearish implications too.
AUD/USD Daily Report
Daily Pivots: (S1) 0.7307; (P) 0.7350; (R1) 0.7418; More...
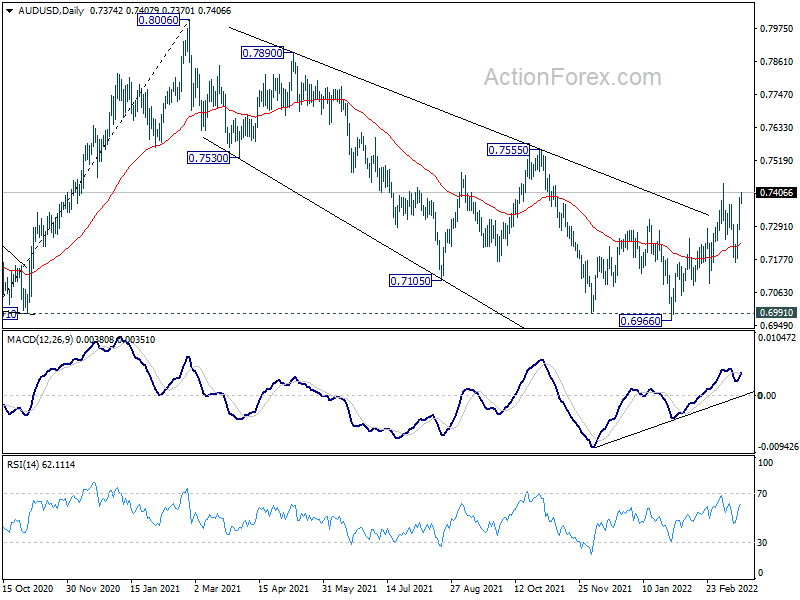
Intraday bias in AUD/USD is now mildly on the upside for 0.7440 resitsance first. Break will resume the rebound from 0.6966 to 0.7555 resistance next. As noted before, larger decline from 0.8006 might have completed at 0.6966 already. Further break of 0.7555 should confirm this bullish case. On the odwnside, below 0.7301 minor support will turn bias neutral first. But further rally will remain in favor as long as 0.7164 support holds.
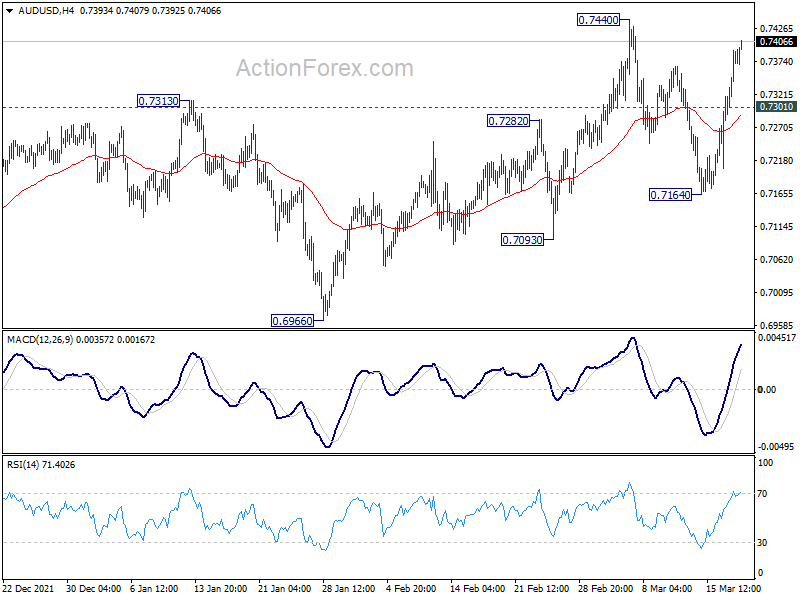
In the bigger picture, focus remains on 0.6991 key structural support. Sustained break there will argue that the whole up trend from 0.5506 might be finished at 0.8006, after rejection by 0.8135 long term resistance. Deeper decline would then be seen back to 61.8% retracement of 0.5506 to 0.8006 at 0.6461. Meanwhile, strong rebound from 0.6991 will retain medium term bullishness. That is, whole up trend from 0.5506 is still in progress for another rise through 0.8006 at a later stage.
USD/JPY Daily Outlook
Daily Pivots: (S1) 118.30; (P) 118.67; (R1) 118.96; More...
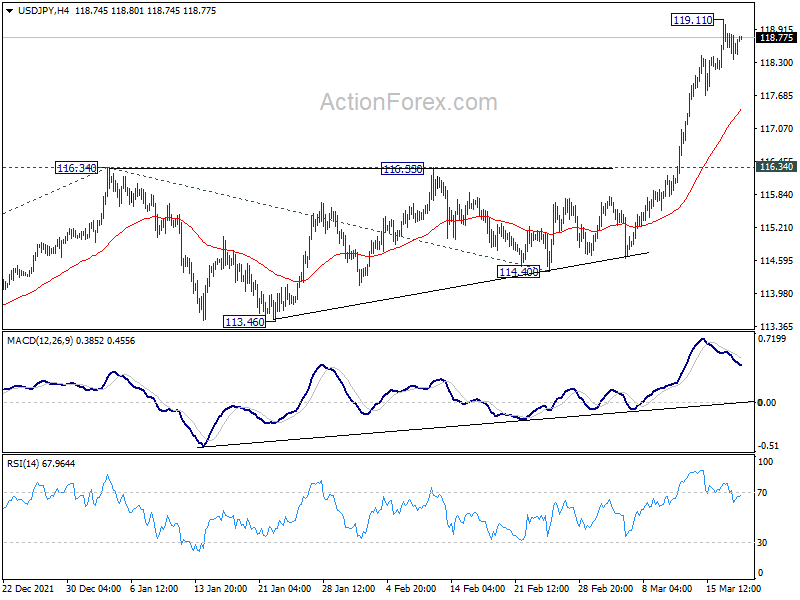
A temporary top should be in place at 119.11 with 4 hour MACD staying below signal line. Intraday bias is turned neutral for some consolidations. But downside should be contained well above 116.34 resistance turned support to bring another rally. On the upside, break of 119.11 will resume larger up trend to 100% projection of 109.11 to 116.34 from 114.40 at 121.63.
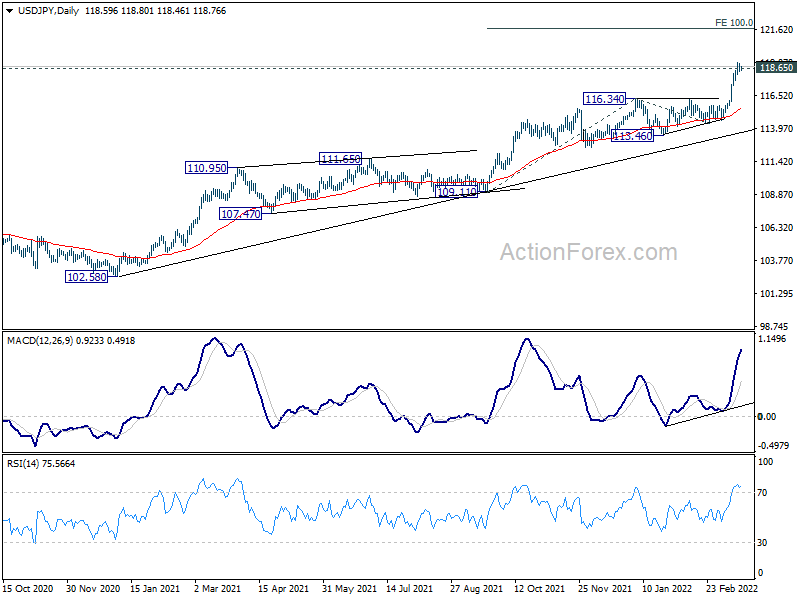
In the bigger picture, no change in the view that rise from 102.58 is the third leg of the up trend from 101.18 (2020 low). Sustained break of 118.65 (2016 high) will pave the way to 125.85 (2015 high) and raise the chance of long term up trend resumption. This will remain the favored case as long as 113.46 support holds, even in case of deep pull back.
USD/CHF Daily Outlook
Daily Pivots: (S1) 0.9327; (P) 0.9379; (R1) 0.9422; More....
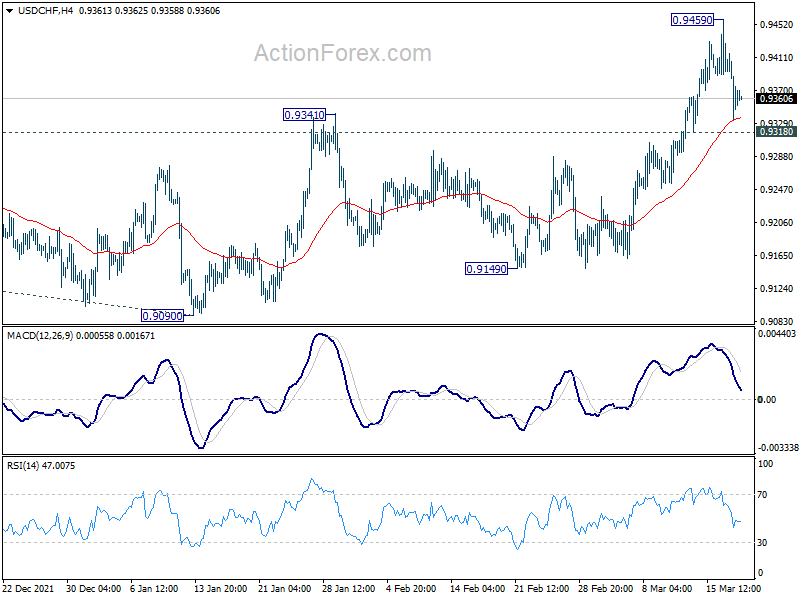
Intraday bias in USD/CHF remains neutral for consolidations first. But further rally should still be seen as long as 0.9318 minor support holds. On the upside, above 0.9459 will target 0.9471 resistance first. Break there will resume whole rally from 0.8756 to 61.8% projection of 0.8756 to 0.9471 from 0.9090 at 0.9532. However, break of 0.9318 will bring deeper pull back to 55 day EMA (now at 0.9242).
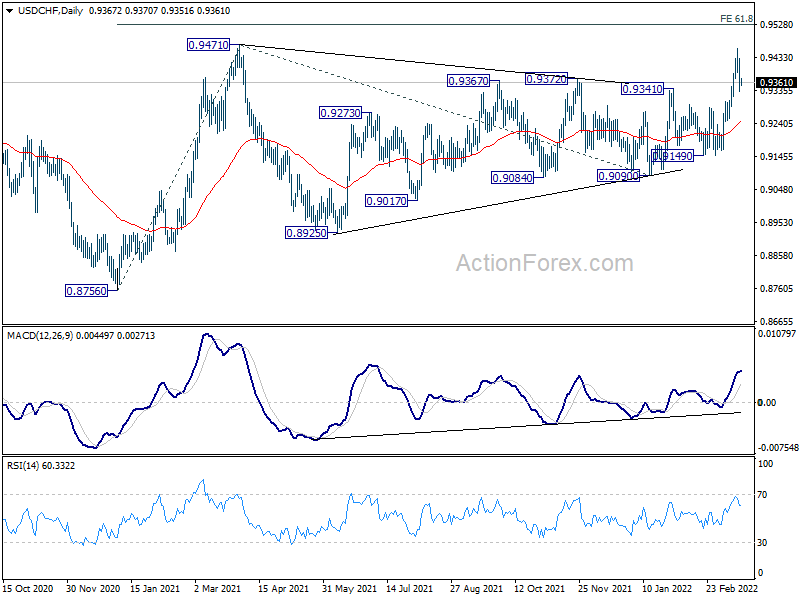
In the bigger picture, medium term outlook will be neutral at best as long as 0.9471 resistance holds. Larger down trend could still extend through 0.8756 (2021 low). However, firm break of 0.9471 will argue that whole down trend form 1.0342 (2016 high), has completed with waves down to 0.8756. A medium term up trend should be set up to target 1.0237/0342 resistance zone.
GBP/USD Daily Outlook
Daily Pivots: (S1) 1.3088; (P) 1.3150; (R1) 1.3211; More...
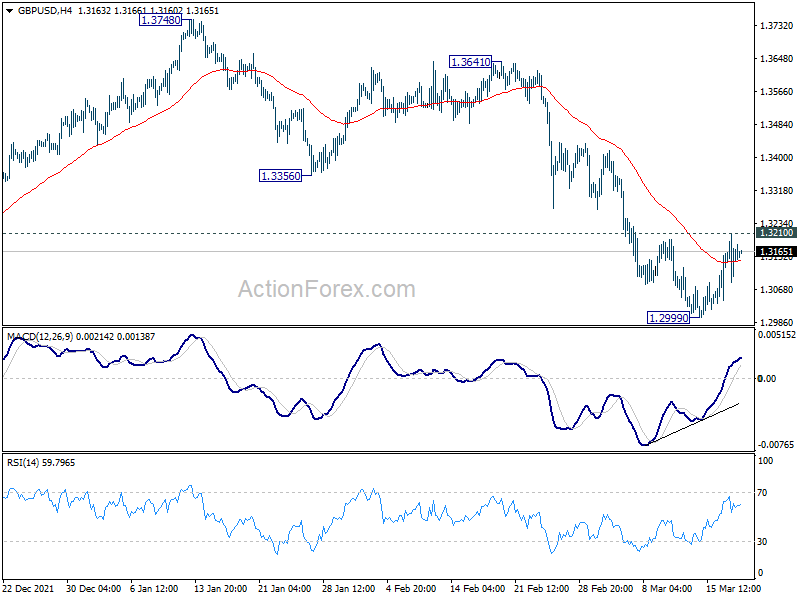
Intraday bias in GBP/USD remains neutral for the moment. On the upside, firm break of 1.3210 minor resistance should confirm short term bottoming at 1.2999. Intraday bias will be back to the upside for 55 day EMA (now at 1.3368). Nevertheless, break of 1.2999 will resume larger down trend from 1.4248.
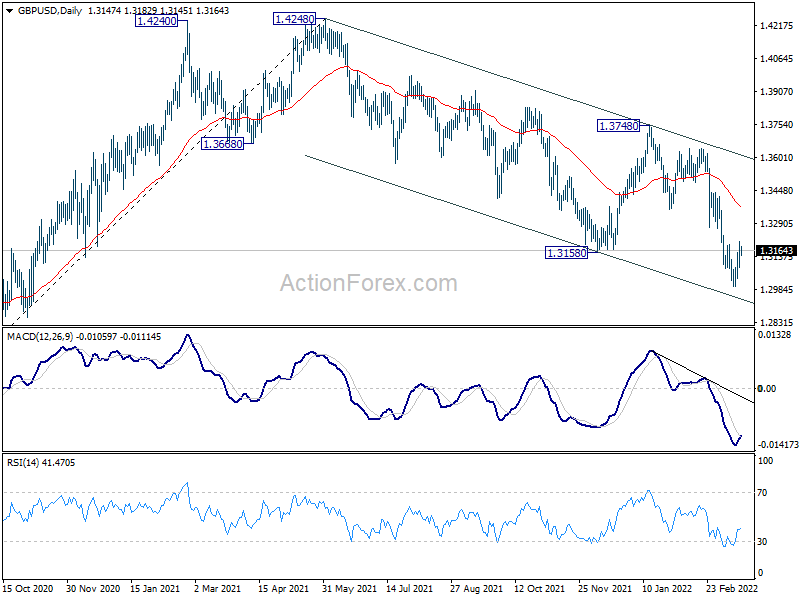
In the bigger picture, current development suggests that the up trend from 1.1409 (2020 low) has completed at 1.4248. Decline from 1.4248 could still be a corrective move, or it could be the start of a long term down trend. In either case, deeper decline would be seen back to 61.8% retracement of 2.1161 to 1.1409 at 1.2493. In any case, break of 1.3748 resistance is needed to indicate medium term bottoming, or outlook will stay bearish.
Elliott Wave View: Gold Rallies Higher After 3 Waves Pullback
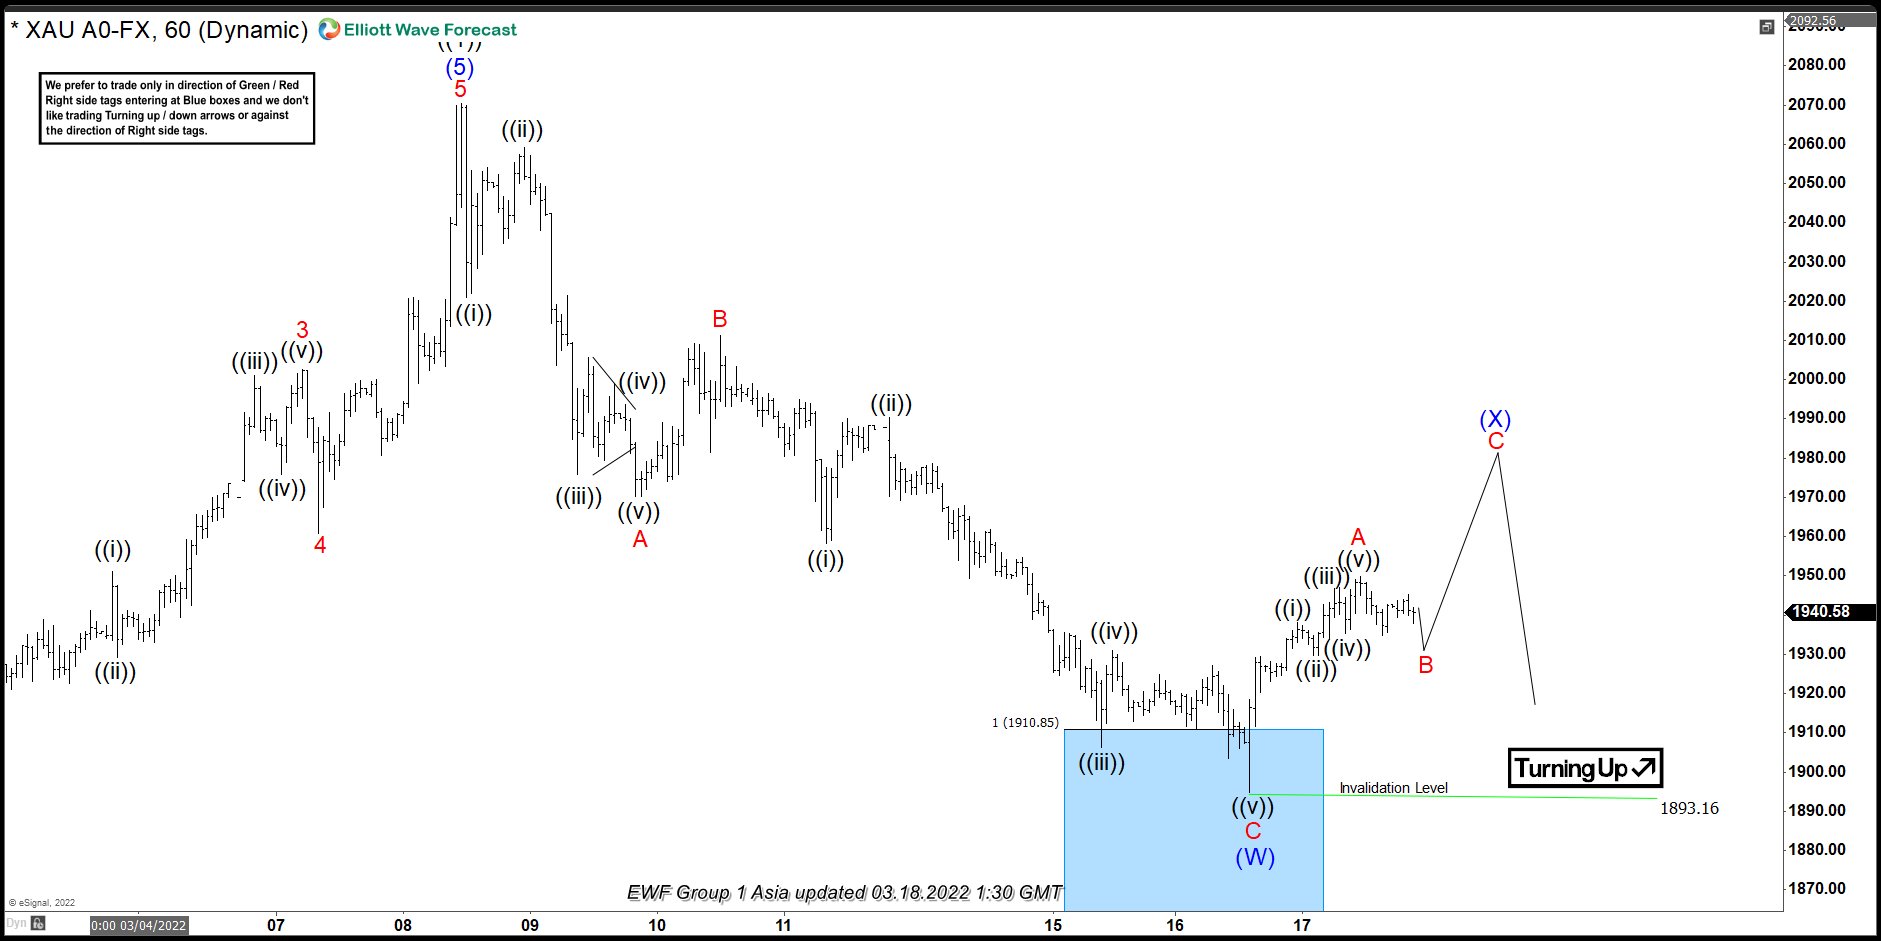
Short Term Elliott Wave View in Gold suggests the decline from March 08, 2022 high completed 3 waves down as a zig zag Elliott Wave structure. Down from March 08 wave ((1)) high, wave A ended at 1970.30 and rally in wave B ended at 2005.87. Then XAUUSD continue lower buiding an impulse to complete wave C at 1893.16. These 3 waves down we are calling as a part of a double correction; therefore, we labeled this structure as wave (W). The drop reached the blue box (1910.85 – 1848.46) and bounce looking for develop wave (X) connector.
The connector wave (X) is now in progress as another zig zag in lesser degree. Up from wave (W), wave ((i)) ended at 1938.20 and pulback in wave ((ii)) ended at 1929.80. Gold then resumes higher in wave ((iii)) towards 1946.98, and wave ((iv)) ended at 1935.20. Final leg higher wave ((v)) ended at 1949.77 which completed wave A in higher degree as a leading diagonal. Near term, wave B correction is ongoing for 3 or 7 swing to complete the pulback. After wave B ends, XAUUSD should continue higher as wave C and finish the connector wave (X) where it could turn down to resume with the downtrend. As far as pivot at 1893.16 low remains intact, expect rally to continue in the sequence of 3, 7, or 11 swing before wave (X) ends and Gold turns lower.
XAUUSD 60 Minutes Elliott Wave Chart
EUR/USD Daily Outlook
Daily Pivots: (S1) 1.1022; (P) 1.1079; (R1) 1.1150; More...
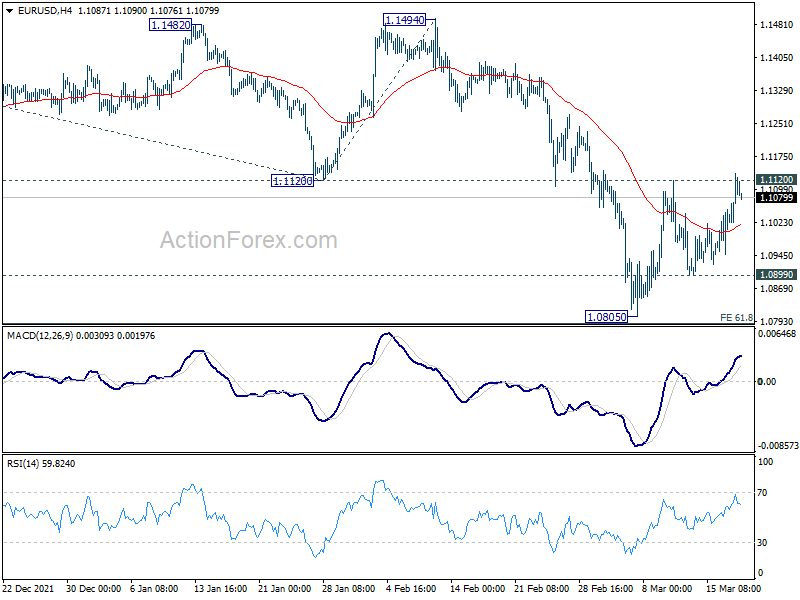
Intraday bias in EUR/USD remains neutral with focus on 1.1120 support turned resistance. Firm break there will confirm short term bottoming at 1.0805. Bias will be back on the upside for 55 day EMA (now at 1.1206). Sustained break there will raise the chance of medium term bottoming and target 1.1494 resistance. However, rejection by 1.1120 will maintain near term bearishness. Break of 1.0899 minor support should resume larger down trend from 1.2348 through 1.0805.
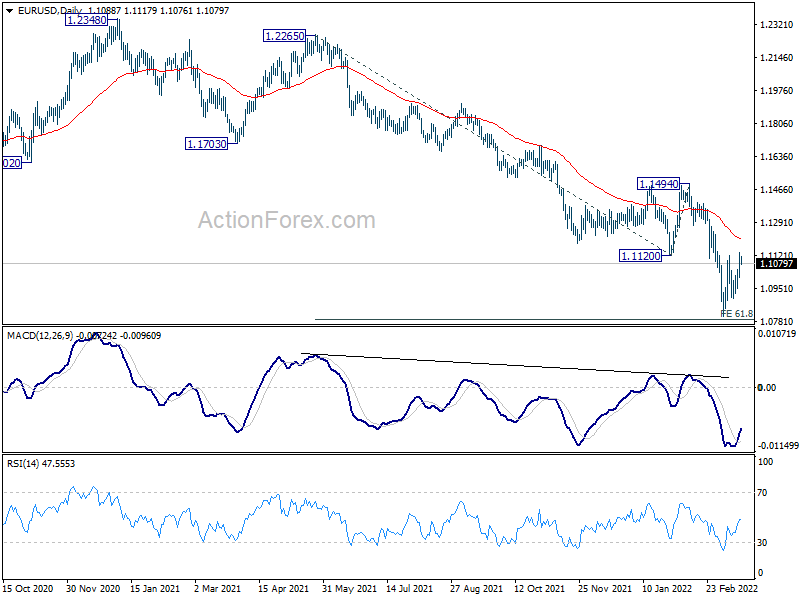
In the bigger picture, the decline from 1.2348 (2021 high) is expected to continue as long as 1.1494 resistance holds. Firm break of 1.0635 (2020 low) will raise the chance of long term down trend resumption and target a retest on 1.0339 (2017 low) next. Nevertheless, break of 1.1494 will maintain medium term neutral outlook, and extend range trading first.
EUR/USD Pressing Resistance, Yen Continues as Biggest Loser after BoJ
Yen remains the weakest one for the week, following the extended rebound in US stocks overnight, and persistent strength in treasury yields. Swiss Franc and Dollar are also soft as distant second and third. Meanwhile, Euro is currently the best week performer, followed by Aussie and then Kiwi. Sterling's rally attempt was capped by the dovish BoE hike and is mixed for now.
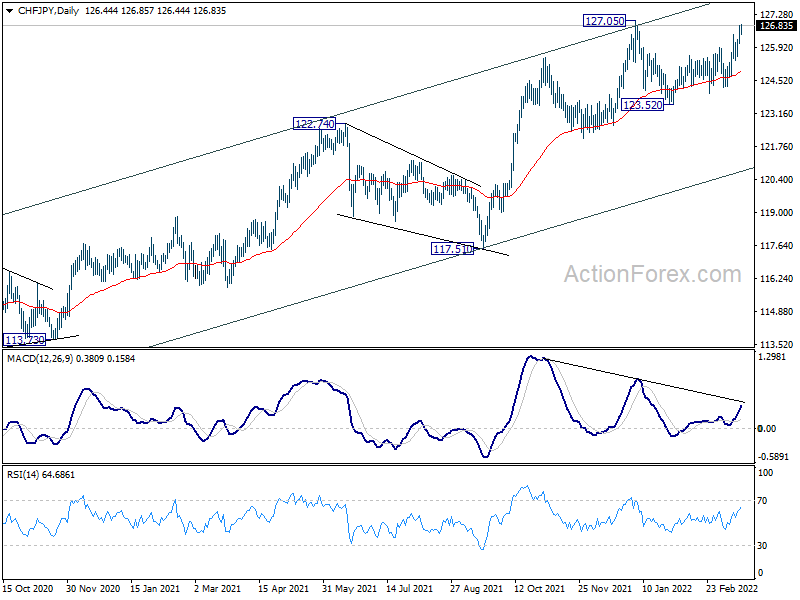
Technically, there are two pairs to watch before the week ends. EUR/USD is back pressing 1.1120 resistance. Strong break there will but a sign of more sustainable rebound in the common currency for the near term. CHF/JPY is now heading back to 127.05 high, after drawing support from 55 day EMA multiple times. Break of 127.05 will resume larger up trend from 106.71, and would give Yen extra pressure ahead.
In Asia, at the time of writing, Nikkei is up 0.33%. Hong Kong HSI is down -2.38%. China Shanghai SSE is down -0.22%. Singapore Strait Times is up 0.13%. Japan 10-year JGB yield is up 0.0074 at 0.211. Overnight, DOW rose 1.23%. S&P 500 rose 1.23%. NASDAQ rose 1.33%. 10-year yield rose 0.004 to 2.192.
BoJ stands pat, extremely high uncertainties surrounding impact from Ukraine
BoJ kept monetary policy unchanged as widely expected today. Under the yield curve control frame work, short-term policy interest rate is held at -0.10%. As for long-term interest rate, BoJ will continue to purchases JGBs, without upper limit, to maintain 10-year JGB yield at around 0%. The decision was made by 8-1 vote, with Goushi Kataoka dissented again, preferring to strength monetary easing.
In the accompany statement, BoJ said the "economy has picked up as a trend, although some weakness has been seen in part". Exports and industrial production "have continued to increase as a trend, despite the remaining effects of supply-side constraints."
Core inflation is "likely to increase clearly in positive territory for the time being due to a significant rise in energy prices, a pass-through of raw material cost increases, and dissipation of the effects of the reduction in mobile phone charges".
BoJ also said, "there are extremely high uncertainties over how the situation surrounding Ukraine will affect Japan's economic activity and prices, mainly through developments in global financial and capital markets, commodity prices, and overseas economies."
DOW breaks near term resistance, correction finished?
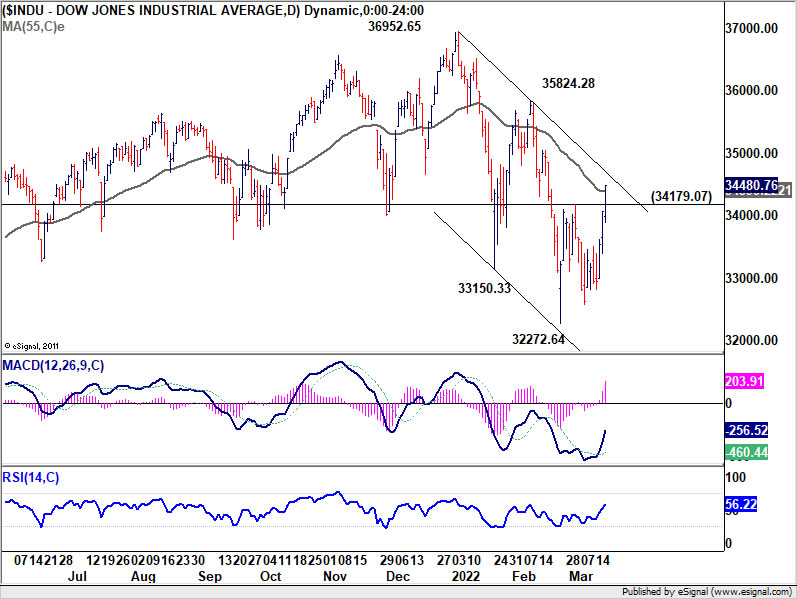
DOW's strong break of 34179.07 resistance overnight was a clear near term bullish signal. The development suggests that correction from 36952.65 has completed with three waves down to 32272.64. A weekly close above near term falling channel resistance (now at around 34700) will solidify this case, and bring further rally to 35824.28 resistance next week.
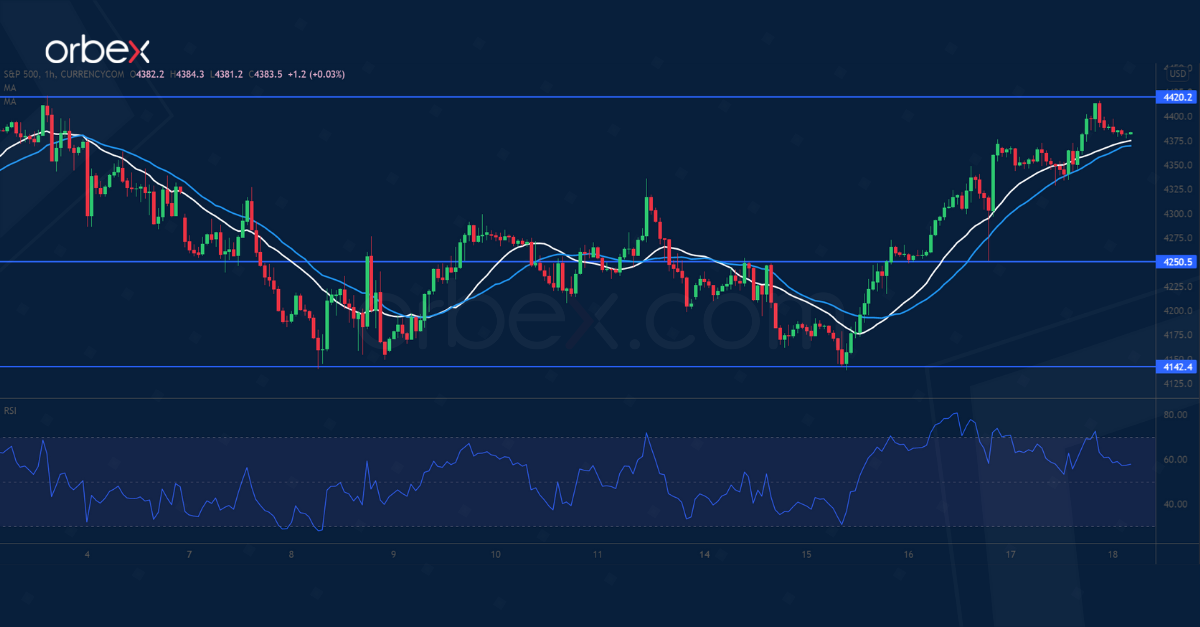
At the same time, break of corresponding resistance of 4416.78 in S&P 500, and 13837.58 resistance in NASDQ, will also solidify overall near term bullish reversal in US stock markets.
WTI crude oil back above 106, first leg of correction finished
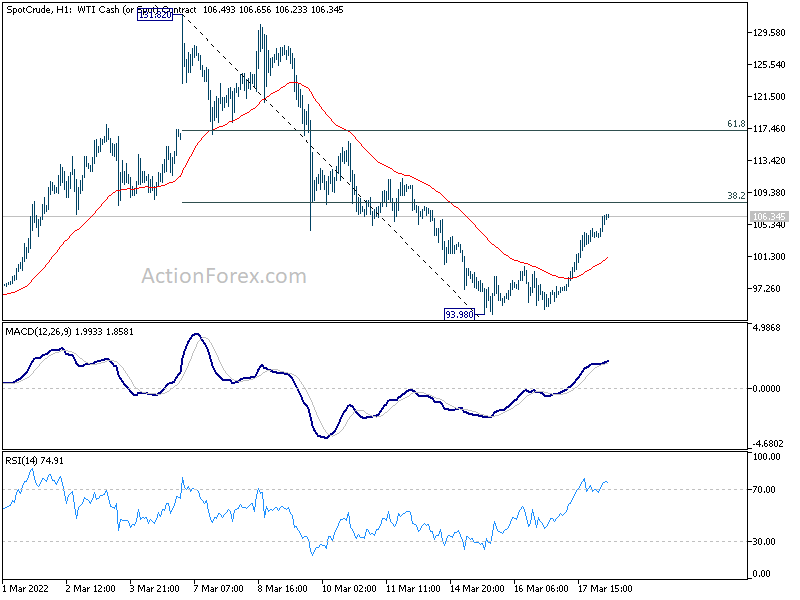
WTI crude oil is back at 106 as rebound from 93.98 extends. Russia is showing no sign of stopping its invasion of Ukraine despite waves of sanctions and rounds of negotiations. Earlier this week, the International Energy Agency warned that 3 million barrels per day of Russia oil and products could be shut in from as early as six months.
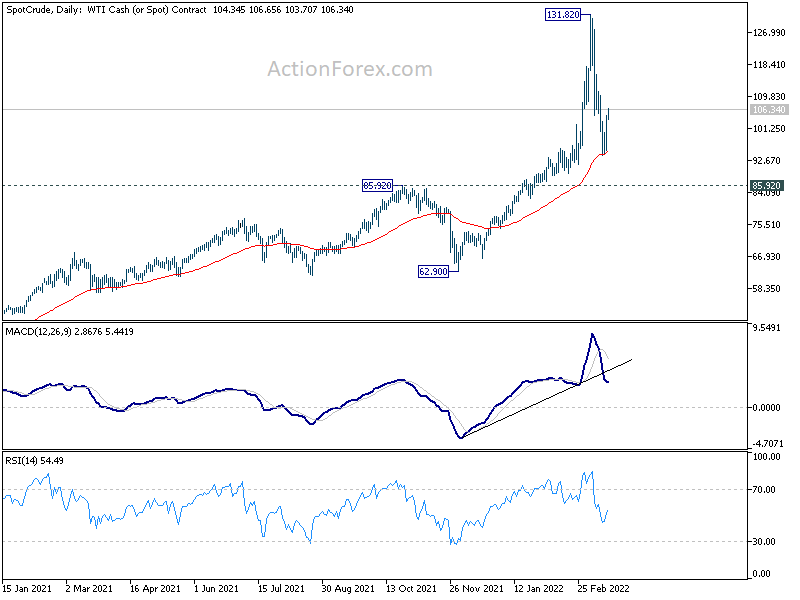
Technically, a short term bottom should be formed at 93.98 in WTI. The fall from 131.82, as the first leg of a corrective pattern should have completed. Further rise should be seen to 38.2% retracement of 131.82 to 93.98 at 108.43 first. Firm break there will target 61.8% retracement at 117.36 and above.
Also, with notable support seen from 55 day EMA, the medium term outlook stays bullish. That is, larger up trend is still in favor to extend through 131.82 high. However, it would take a while, most likely with at least one more falling leg, before the corrective pattern from 131.82 completes.
Looking ahead
Italy and Eurozone trade balance will be released in European session. Later in the day, Canada will release retail sales and new housing price index. US will release existing home sales.
EUR/USD Daily Outlook
Daily Pivots: (S1) 1.1022; (P) 1.1079; (R1) 1.1150; More...
Intraday bias in EUR/USD remains neutral with focus on 1.1120 support turned resistance. Firm break there will confirm short term bottoming at 1.0805. Bias will be back on the upside for 55 day EMA (now at 1.1206). Sustained break there will raise the chance of medium term bottoming and target 1.1494 resistance. However, rejection by 1.1120 will maintain near term bearishness. Break of 1.0899 minor support should resume larger down trend from 1.2348 through 1.0805.
In the bigger picture, the decline from 1.2348 (2021 high) is expected to continue as long as 1.1494 resistance holds. Firm break of 1.0635 (2020 low) will raise the chance of long term down trend resumption and target a retest on 1.0339 (2017 low) next. Nevertheless, break of 1.1494 will maintain medium term neutral outlook, and extend range trading first.
Economic Indicators Update
| GMT | Ccy | Events | Actual | Forecast | Previous | Revised |
|---|---|---|---|---|---|---|
| 23:30 | JPY | National CPI Core Y/Y Feb | 0.60% | 0.60% | 0.20% | |
| 03:00 | JPY | BoJ Interest Rate Decision | -0.10% | -0.10% | -0.10% | |
| 04:30 | JPY | Tertiary Industry Index M/M Jan | -1.00% | 0.40% | ||
| 09:00 | EUR | Italy Trade Balance (EUR) Jan | 3.05B | 1.10B | ||
| 10:00 | EUR | Eurozone Trade Balance(EUR) Jan | -4.6B | -9.7B | ||
| 12:30 | CAD | Retail Sales M/M Jan | 2.40% | -1.80% | ||
| 12:30 | CAD | Retail Sales ex Autos M/M Jan | 2.30% | -2.50% | ||
| 13:30 | CAD | New Housing Price Index M/M Feb | 0.60% | 0.90% | ||
| 15:00 | USD | Existing Home Sales Feb | 6.18M | 6.50M | ||
| 15:00 | USD | Existing Home Sales Change M/M Feb | -1.00% | 6.70% |