Sample Category Title
WTI crude oil back above 106, first leg of correction finished
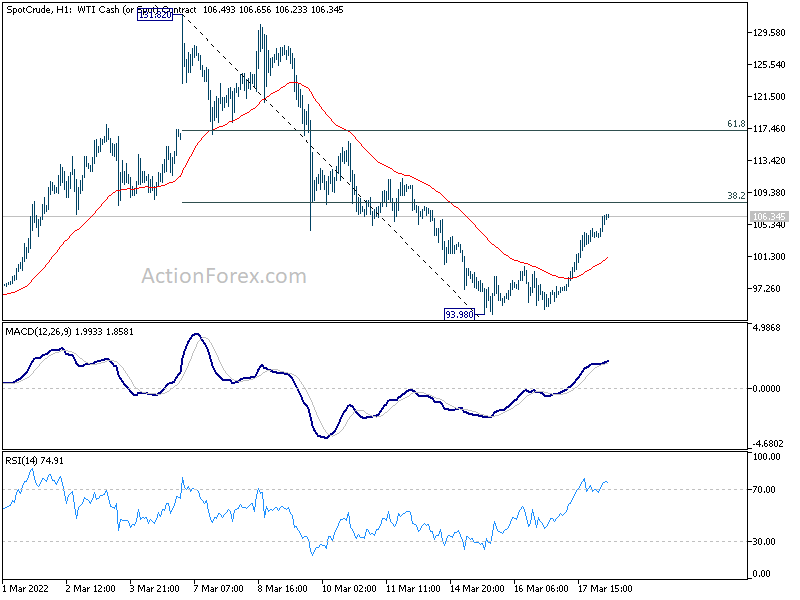
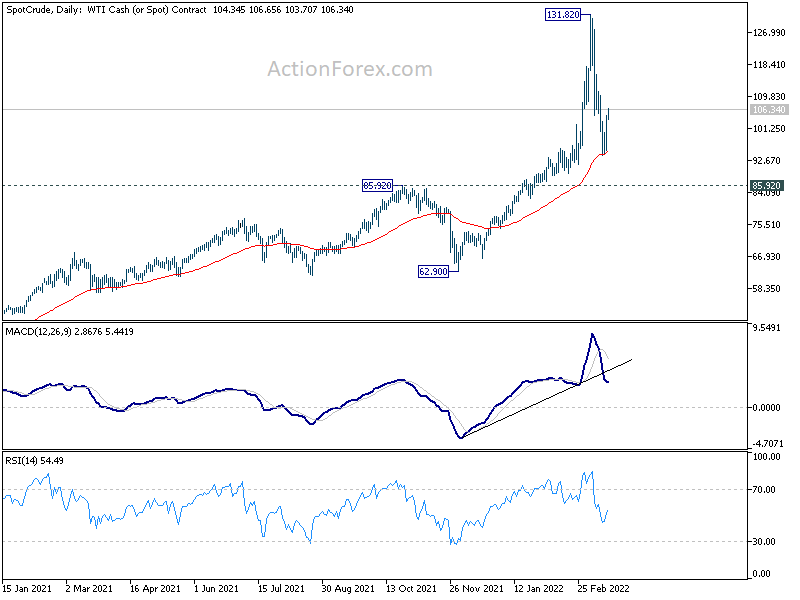
WTI crude oil is back at 106 as rebound from 93.98 extends. Russia is showing no sign of stopping its invasion of Ukraine despite waves of sanctions and rounds of negotiations. Earlier this week, the International Energy Agency warned that 3 million barrels per day of Russia oil and products could be shut in from as early as six months.
Technically, a short term bottom should be formed at 93.98 in WTI. The fall from 131.82, as the first leg of a corrective pattern should have completed. Further rise should be seen to 38.2% retracement of 131.82 to 93.98 at 108.43 first. Firm break there will target 61.8% retracement at 117.36 and above.
Also, with notable support seen from 55 day EMA, the medium term outlook stays bullish. That is, larger up trend is still in favor to extend through 131.82 high. However, it would take a while, most likely with at least one more falling leg, before the corrective pattern from 131.82 completes.
DOW breaks near term resistance, correction finished?
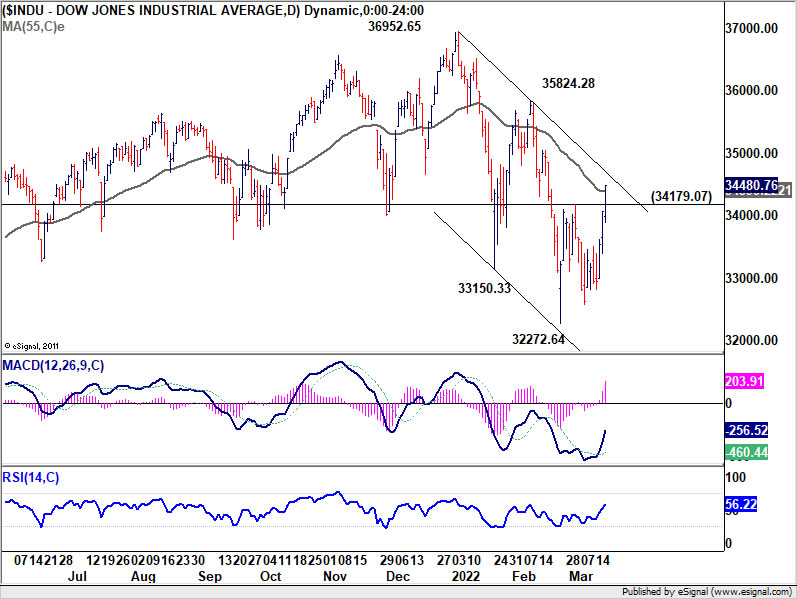
DOW's strong break of 34179.07 resistance overnight was a clear near term bullish signal. The development suggests that correction from 36952.65 has completed with three waves down to 32272.64. A weekly close above near term falling channel resistance (now at around 34700) will solidify this case, and bring further rally to 35824.28 resistance next week.
At the same time, break of corresponding resistance of 4416.78 in S&P 500, and 13837.58 resistance in NASDQ, will also solidify overall near term bullish reversal in US stock markets.
BoJ stands pat, extremely high uncertainties surrounding impact from Ukraine
BoJ kept monetary policy unchanged as widely expected today. Under the yield curve control frame work, short-term policy interest rate is held at -0.10%. As for long-term interest rate, BoJ will continue to purchases JGBs, without upper limit, to maintain 10-year JGB yield at around 0%. The decision was made by 8-1 vote, with Goushi Kataoka dissented again, preferring to strength monetary easing.
In the accompany statement, BoJ said the "economy has picked up as a trend, although some weakness has been seen in part". Exports and industrial production "have continued to increase as a trend, despite the remaining effects of supply-side constraints."
Core inflation is "likely to increase clearly in positive territory for the time being due to a significant rise in energy prices, a pass-through of raw material cost increases, and dissipation of the effects of the reduction in mobile phone charges".
BoJ also said, "there are extremely high uncertainties over how the situation surrounding Ukraine will affect Japan's economic activity and prices, mainly through developments in global financial and capital markets, commodity prices, and overseas economies."
Cliff Notes: Central Banks Take Stand on Inflation While Mindful of Risks
Key insights from the week that was.
The past week has been significant for global central banks. Key data releases have also been received for Australia, New Zealand and China.
Beginning in Australia, most notable this week was the February labour force survey which came in ahead of our top-of-the-range forecast; in the month, 77k jobs were created, taking the unemployment rate down to 4.0% despite a 0.2ppt rise in participation. Notably, this is only the third time in the history of the monthly labour force survey that the unemployment rate has been this low; and, in this instance, it has been achieved with participation at a record high.
Looking ahead, both the NAB business survey and our own Australian Chamber–Westpac Survey of Industrial Trends point to Australian businesses remaining keen to hire and willing to pay higher wages to secure staff. Historically weak population growth also remains a key factor behind our tight labour market.
Speaking of Australia’s re-opening, February’s arrivals and departures were little changed from last month (+7.1k and -9.5k respectively), pointing to a modest pick-up in overseas travel. The vast majority of arrivals are Australian residents returning from short-term trips, but this still remains only 16% of pre-pandemic levels. At 49.4k, students are currently the largest source of visa-component arrivals. With the border reopening to all fully vaccinated individuals in late February and a significant pick-up in travel related expenditure (as shown in the latest Westpac Card Tracker), travel abroad and into Australia should continue to strengthen in coming months.
While thankful and cognisant of the gains being made by the Australian economy, as detailed in this week’s March meeting minutes, the RBA remains acutely aware of the risks to the outlook stemming from Russia’s invasion of Ukraine and other global risks as well as lingering uncertainty around the length of time required to see a broad-based and sustained pick up in wages growth, necessary to achieve inflation at target into the medium term. The latest episode of our Market Outlook in conversation podcast explores the outlook for Australian interest rates and the dollar, amongst other salient themes.
Across in New Zealand, their economy’s 3.0% gain in the December quarter was a little below market expectations but above the RBNZ’s February forecast and large enough to wipe out the majority of the 3.6% decline in the three months prior.
Turning then to China. First off, a much stronger set of activity partials was received for February than was anticipated by the market. Most striking was fixed asset investment which came in at 12.2%ytd against expectations for a 5.0%ytd gain. However, retail sales and industrial production were also nearly twice the market’s expectation, respectively 6.7%ytd and 7.5%ytd.
While we recognise the sharp rise in COVID-19 cases and stringent restrictions put in place to stop the virus’ spread is a concern for consumption and activity into the end of Q1, it must be remembered that authorities continue to act this way so the rest of the country can operate near normal. Also, as occurred in prior instances, this round of restrictions looks to be having quick success, limiting the duration of the shock. From the late-2021 GDP pulse and the February activity prints, it seems fair to conclude that the net economic impact of authorities’ zero COVID-19 approach is declining. We continue to hold an above-consensus view for growth in 2022 of 5.7%.
Over in the UK, the Bank of England’s March meeting delivered a rate hike with dovish undertones – the latter to the market’s surprise. The Monetary Policy Committee was more divided than expected, with 8-to-1 in favour of a 25bp lift in the bank rate to 0.75%, the strength of the labour market and domestic cost pressures being cited as the key justifications for a hike. The Committee did however clearly soften their commitment to tightening policy over coming months, suggesting it “may be appropriate” rather than “likely” depending on the data. The risks associated with Russia’s invasion of Ukraine dominated the domestic and global economic discussion.
The UK’s growth and employment outlook have weakened, the report stressing inflation’s intensifying impact on real incomes. Since the February report, where the Committee outlined their central projection for a peak in inflation of 7.25%, considerable upside risk to energy and commodity prices has materially worsened the inflation outlook. The Committee now sees inflation lifting to 8% in Q2 2022 and possibly peaking higher this year before falling back materially at some time “further out”. The dampened policy outlook raise questions as to whether inflation could be pulled below target by 2025, as per the February projections. Whether the Committee will react to building inflationary pressures in coming months will be highly contingent on global developments and their effect on the UK.
While all these global developments were significant, the most important outcome this week was that of the March FOMC meeting. As expected, a 25bp fed funds hike was delivered and the post-meeting communications guided that balance sheet normalisation was but two to three months away. Unsurprisingly, the Committee also showed a great deal of confidence in the labour market and broader economy, to end-2024 and into the medium term. The surprise however was the aggressive shift in rate expectations amongst Committee members.
We are not particularly surprised that the FOMC has adopted the top of the market range for fed funds rate hikes in 2022. What is of interest is that they see a need to continue raising rates in 2023 even with inflation having been brought back to near target and given the 6-12 month lag in policy’s effect. Against the 6 more hikes in 2022 and 3-4 hikes in 2023 now forecast by the FOMC, we continue to anticipate 4 more hikes in 2022 and 2 in 2023. We remain comfortable with this view as financial conditions have already tightened materially, and will tighten further on rate hikes and balance sheet normalisation, and as real wages continue to decline.
Is the Massacre in Growth Stocks Over?
With the war in Ukraine raging and central banks raising interest rates, equity markets have come under heavy fire. The S&P 500 has lost only 10% this year but that doesn’t tell the whole story. There has been a quiet massacre in the most speculative corners of the market, with several ‘growth’ stocks getting blasted. Has the storm finally passed?
Risks abound
The mood in financial markets has turned bearish lately. Investors have been overwhelmed by an onslaught of negative developments - war in Ukraine, lockdowns in China, spiraling inflation eating into the spending power of consumers, and central banks raising interest rates in the middle of an economic slowdown.
There’s also the risk of an ‘accident’ in credit markets. Many worry that Russia might default on its debt, setting off a domino effect. Even if that doesn’t happen, there is still a very real possibility that businesses with high exposure to the Russian economy might suffer dearly once the draconian sanctions begin to bite.
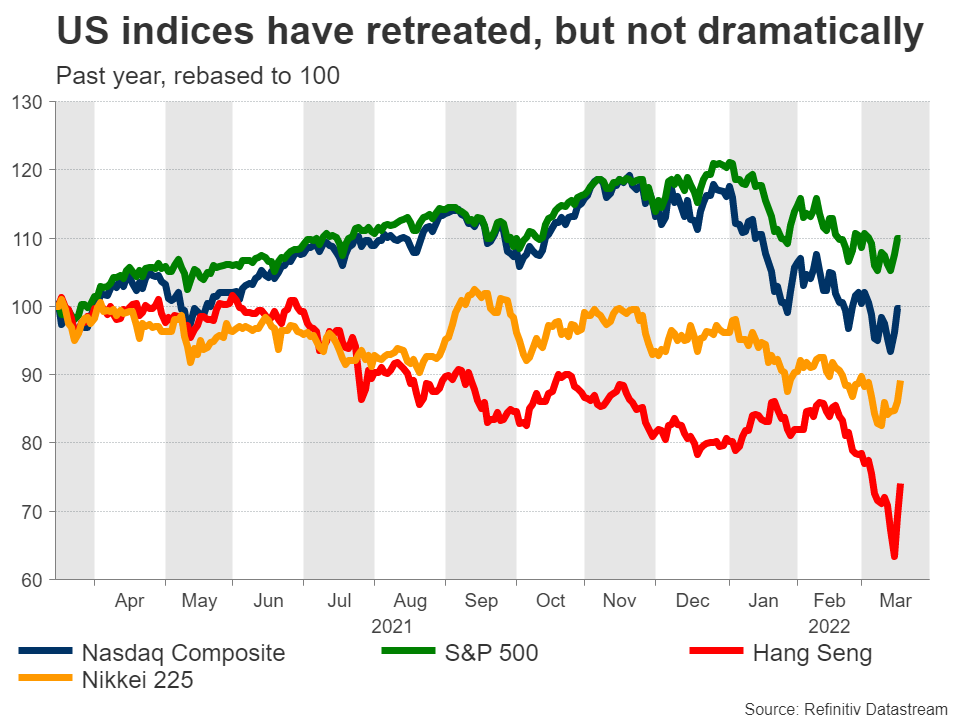
Therefore, the risk of a recession is rising and with inflation so hot already, the central banks cannot bail out the market this time. In such an unstable environment, fund managers are left with no choice but to play defense. This means lowering leverage, raising cash levels, and slashing risk exposure as much as possible.
Growth stocks decimated
When reducing risk, it makes sense to cut the riskiest investments first. This means that shares with higher valuations are prime targets, as they are the most vulnerable to a sharp selloff if the market tanks. Hence, ‘growth’ stocks usually get smoked first.
These so-called growth stocks are shares of companies that are expected to grow faster than the market, hence justifying a higher valuation today. Think about it intuitively - any change in the economic landscape will likely impact a company in its earlier stages much more than a mature multinational that’s generating tremendous profits.
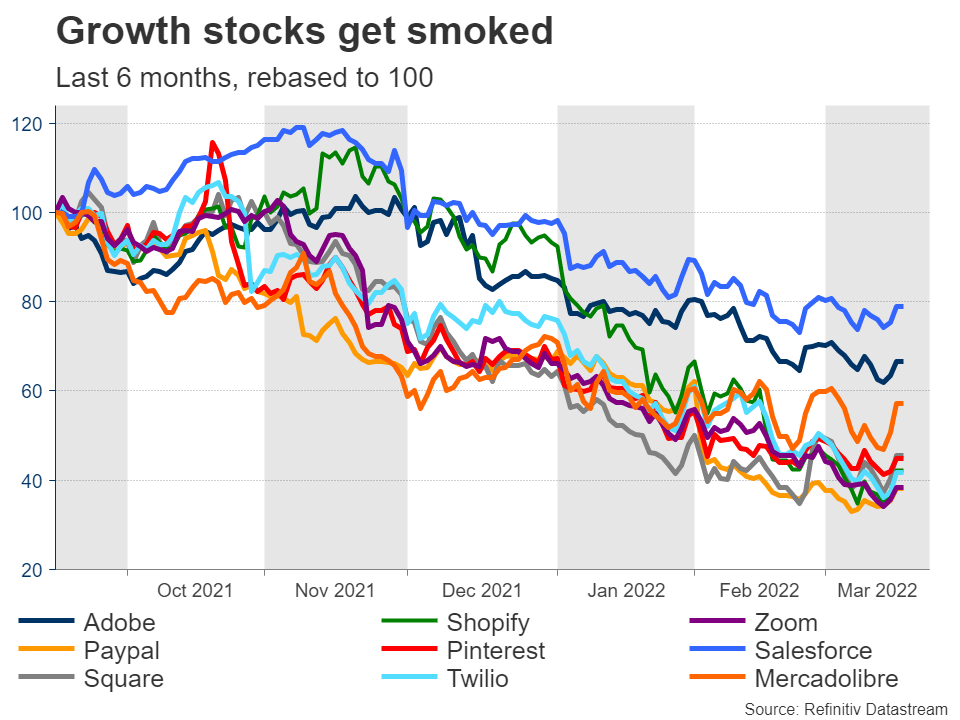
Taking a look across this market segment, there’s been a real purge in recent months. Pandemic winners like Zoom or Shopify have been decimated, and even more established businesses like Pinterest or Paypal have taken a heavy beating.
The amount of pain is usually related to the valuation. The more exorbitant the valuation was, the more vulnerable the stock when interest rates increase or fear takes over global markets. Very high valuations rely on hopes that the company can grow into that valuation over time, and that’s a story that can change quickly.
Is the selloff over?
Admittedly, picking bottoms is almost impossible. It’s just extremely difficult to time when the market might turn around. In the short term, everything will revolve around the conflict in Ukraine. A ceasefire agreement would likely spark a serious relief rally across equity markets.
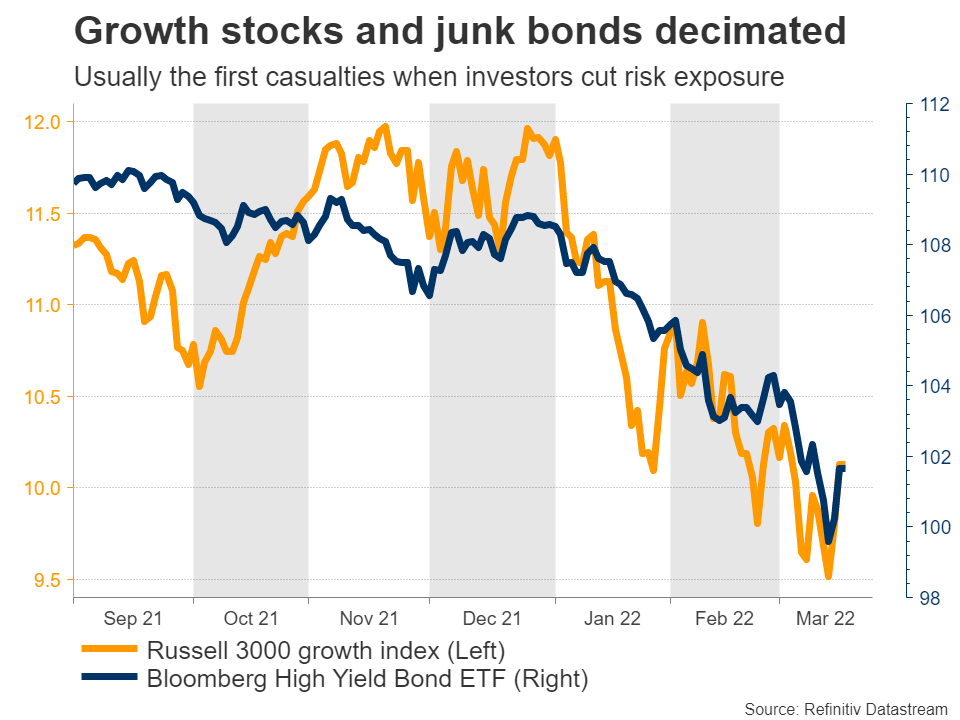
This might be especially true for the most beaten-down growth shares, whose valuation depends heavily on interest rates. A truce would help cool commodity prices and by extension, calm down nerves around inflation. This would argue for fewer rate increases by central banks - music to the ears of growth stocks.
Priced in?
Overall, there’s a sense that most of the ‘bad news’ has already been priced in at this stage. Between war and inflation, most investors have started to turn outright bearish. The latest Bank of America fund manager survey for example showed hedge funds having the least exposure to stocks since April 2020.
In other words, risk has been cut and everyone is hedged. That could be a positive sign for the market - it usually precedes a recovery. It’s a similar story in bond markets. Investors have already priced in a very aggressive pace of Fed tightening to combat inflationary forces.
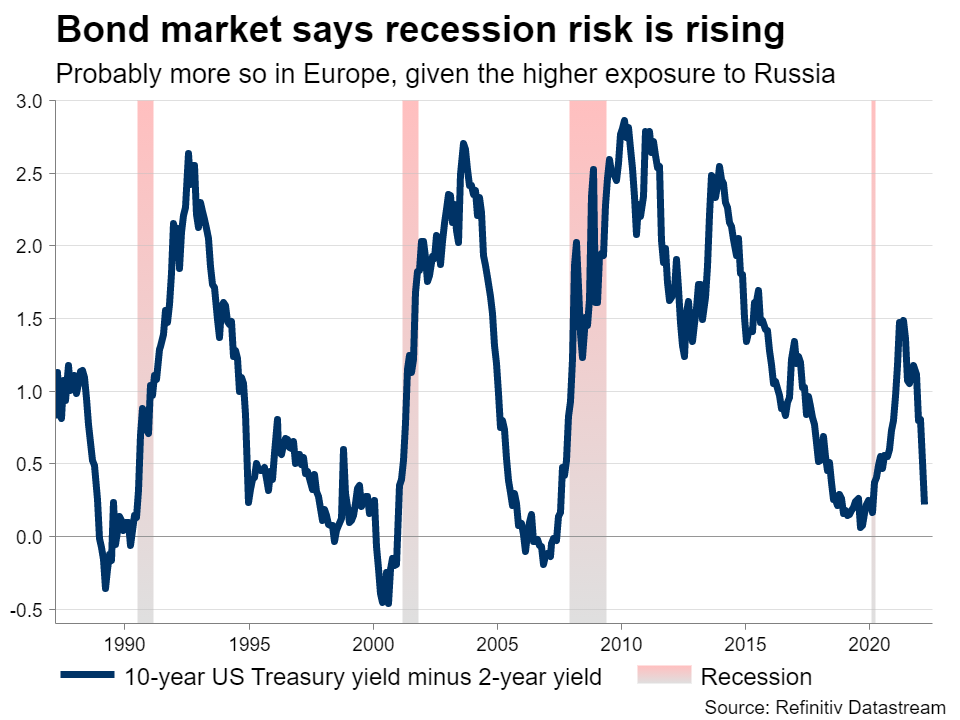
Of course it could still get worse. The probability of a recession is rising, especially in Europe. The sanctions on Russia will inflict collateral damage on the European economy, as the spending power of consumers gets curtailed by soaring energy and food prices.
But unless there is a recession, it’s difficult to see what will keep pushing this market lower. Valuations have fallen significantly and while there might be more pain left, we are likely approaching the final stages of this correction. Let’s not forget that buybacks are still running in full force.
Big picture
All told, this is a very tricky environment. The market has been hit with everything but the kitchen sink in recent weeks and volatility will probably remain elevated as central banks close the liquidity taps.
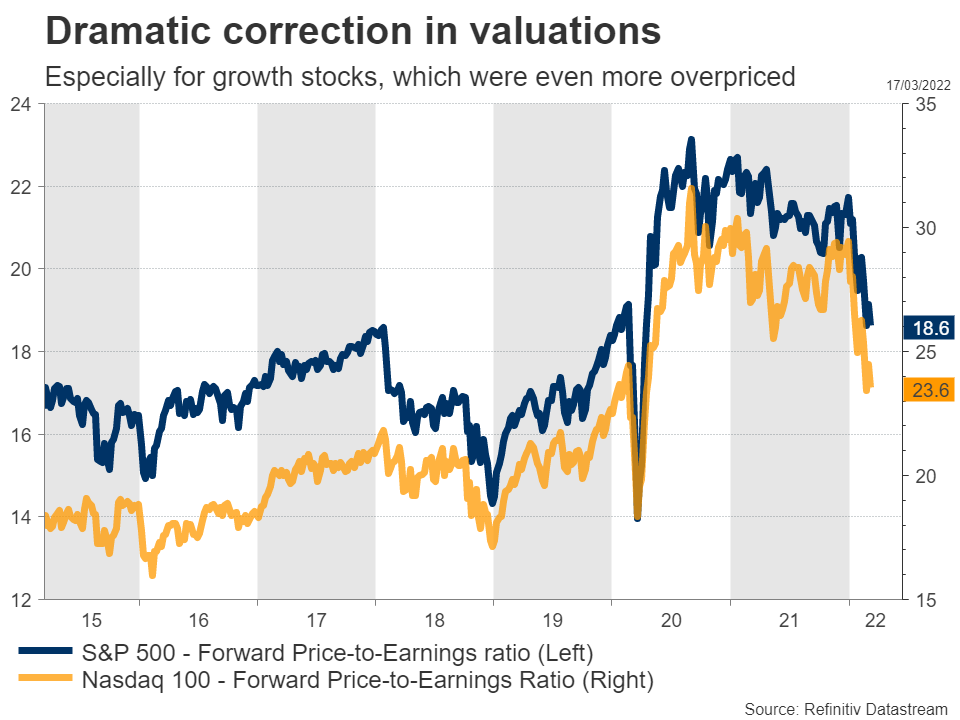
That said, it seems like the worst phase of the storm is over, especially for growth shares that have already suffered so much. Investors are sitting on a lot of cash and with inflation so high, they want to put that to work.
Buying bonds doesn't seem very attractive here unless the investor is willing to hold them until maturity. Commodities have already gone parabolic, and crypto markets are too small. That leaves equities as the only game in town.
USD/JPY Hits New Six-Year High, 120 Presents Resistance
Key Highlights
- USD/JPY started a major increase after it broke the 115.00 resistance.
- A major bullish trend line is forming with support near 118.40 on the 4-hours chart.
- EUR/USD could gain pace if it clears 1.1080, and GBP/USD failed to surpass 1.3200.
- BoE hikes interest rates to 0.75%, following fed’s hike of 0.25%.
USD/JPY Technical Analysis
The US Dollar formed a support base above 114.50 against the Japanese Yen. USD/JPY started a strong increase and broke many hurdles near 116.50.
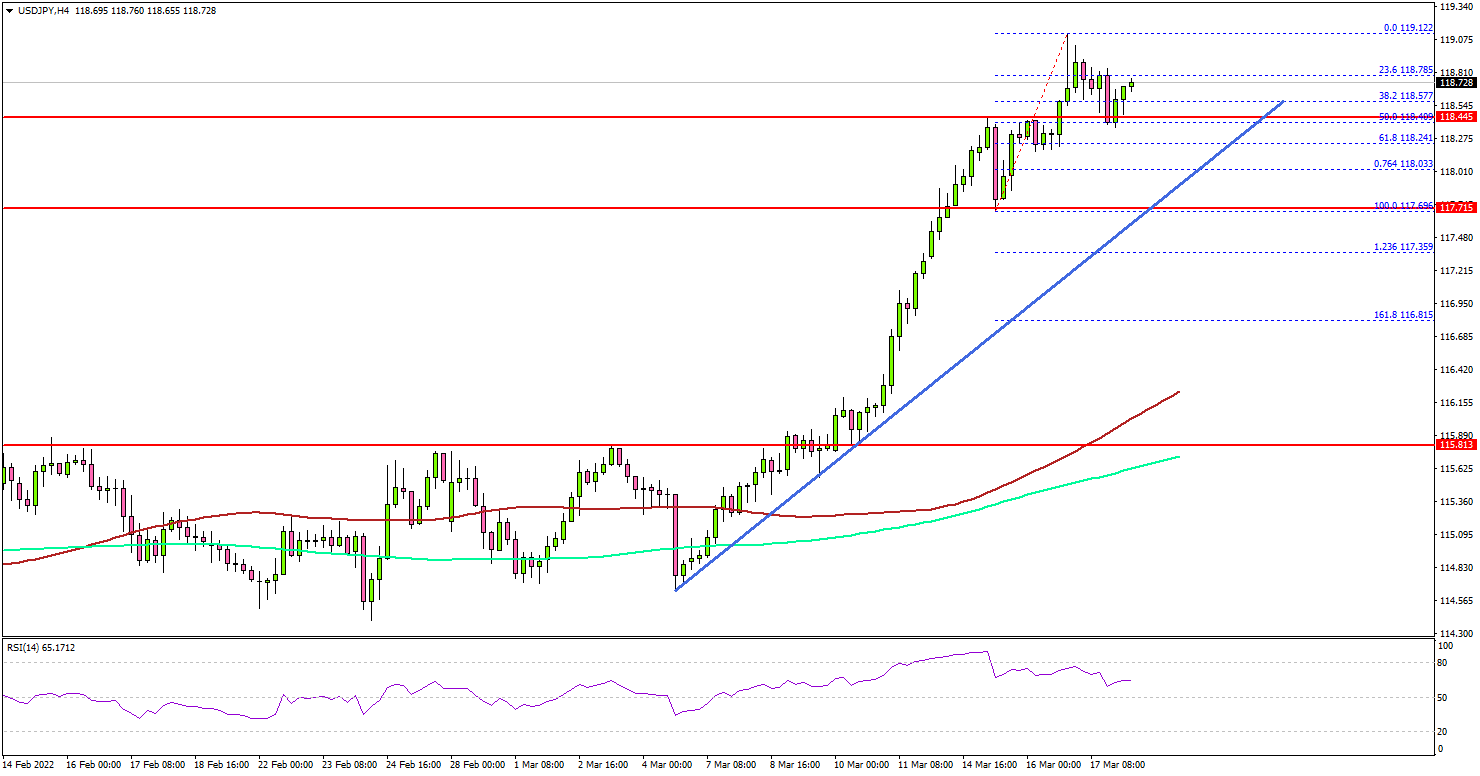
Looking at the 4-hours chart, the pair gained bullish momentum above the 117.00 resistance. The pair even settled above the 118.00 level, the 100 simple moving average (red, 4-hours), and the 200 simple moving average (green, 4-hours).
A new six-year high was formed near 119.12. The pair is now consolidating gains above 118.50. There is also a major bullish trend line forming with support near 118.40 on the same chart. If the pair corrects below the trend line, it could test the 118.00 support.
Conversely, it might continue to rise above the 119.20 level. The next key resistance is near the 119.50 level, above which USD/JPY could test the key 120.00 resistance zone in the near term.
Looking at EUR/USD, the pair might soon attempt to gain pace above 1.1080 and 1.1100. Besides, GBP/USD spiked to test the key 1.3200 resistance zone.
Economic Releases
- US Existing Home Sales for Feb 2022 (MoM) - Forecast -1.0%, versus +6.7% previous.
- Canadian Retail Sales for Jan 2022 (MoM) – Forecast 2.4%, versus -1.8% previous.
- Canadian Retail Sales ex Autos for Jan 2022 (MoM) – Forecast +2.4%, versus -2.5% previous.
USD Hegemony Comes to an End
On March 16 the Federal Reserve hosted the press conference where it announced several disappointing facts for the US economy. FOMC raised the forecast for the US inflation for 2022 to 4.3% from 2.6% despite the key rate upgrade. Moreover, the FED sharply downgraded the forecast for US GDP for 2022 to 2.8% from 4%.
The US politicians and the White House have been blaming the Russia – Ukraine conflict as well as supply chains issues for the inflation growth. However, it looks more like excuses for a failed monetary policy, extreme prices growth, and huge government debt.
What is happening?
The US dollar has been the reserve currency since 1944. Moreover, even today most of the calculations for oil transactions are calculated in dollars, which supports the US currency. However, nowadays, leaders of the world’s largest and most developed countries such as China, Russia, Saudi Arabia, and India work new settlement system, which will exclude the US dollar.
Saudi Arabia considers using the yuan instead of the US dollar to pay for part of the oil that the kingdom supplies to China. China buys more than 25% of the oil exported by Saudi Arabia, and the kingdom is China's largest oil supplier. The authorities of Saudi Arabia and representatives of big business are increasingly dissatisfied with the foreign policy of the administration of the US President.
India and Russia also consider excluding the US dollar from payments and moving to trade settlements in rubles and rupees. Sides want to use the Chinese yuan as the base currency. The new mechanism will allow Indian exporters to be paid for their goods in local currency instead of dollars or euros.
These innovations in the Asian region can significantly reduce the demand for the US dollar and weaken it.
Forecast for USD
The FED got trapped between extremely high inflation and the rising government debt of the US. It might play a bad joke with the USD in the nearest future. The world might lose trust in the White House and turn to other currencies such as the Chinese Yuan.
USD, weekly chart
- Resistance: 99.3
- Support: 97
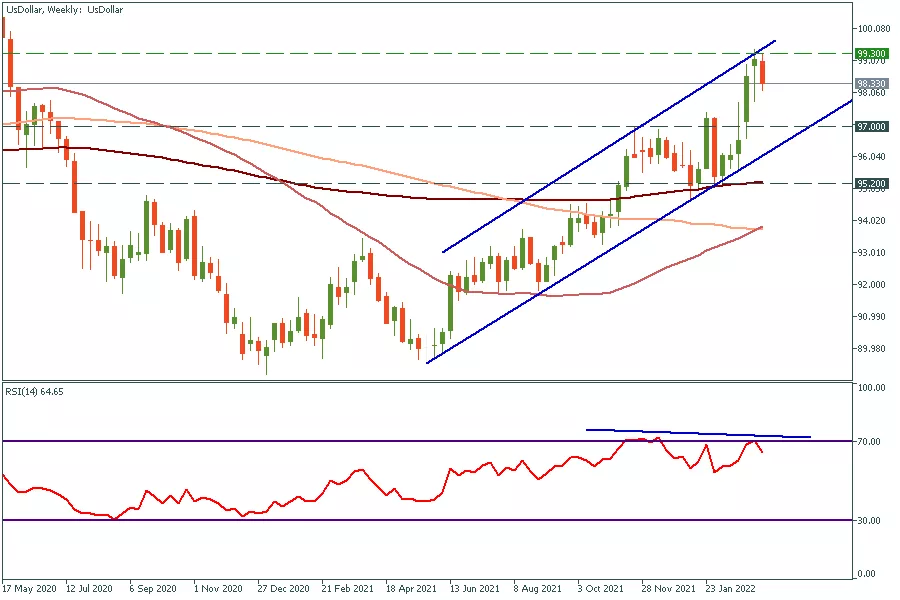
The US dollar index (DXY) has formed a bearish divergence on the weekly timeframe. The price might decline to 97 within a couple of weeks. Moreover, in the case of lower border breakout, we might see a further decline to 95.2.
GBPUSD, weekly chart
- Resistance: 1.3190, 1.3370, 1.3520
- Support: 1.2950, 1.2740
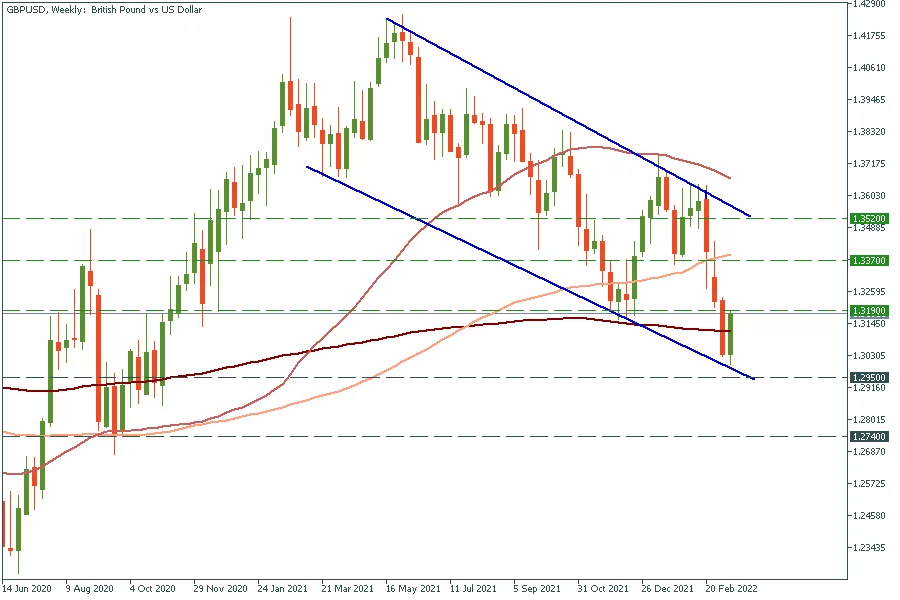
The Bank of England was the first to increase the key rate. On March 17 policymakers might increase the rate for the third time up to 0.75. In long term, such steps might make a significant effect on GBP and push it higher against other currencies.
The chart has formed a bullish flag. Traders might consider purchasing GBPUSD at 1.2950 support or after a breakout of the upper border of the flag.
BTCUSD Sets Up for Next Round of Volatility
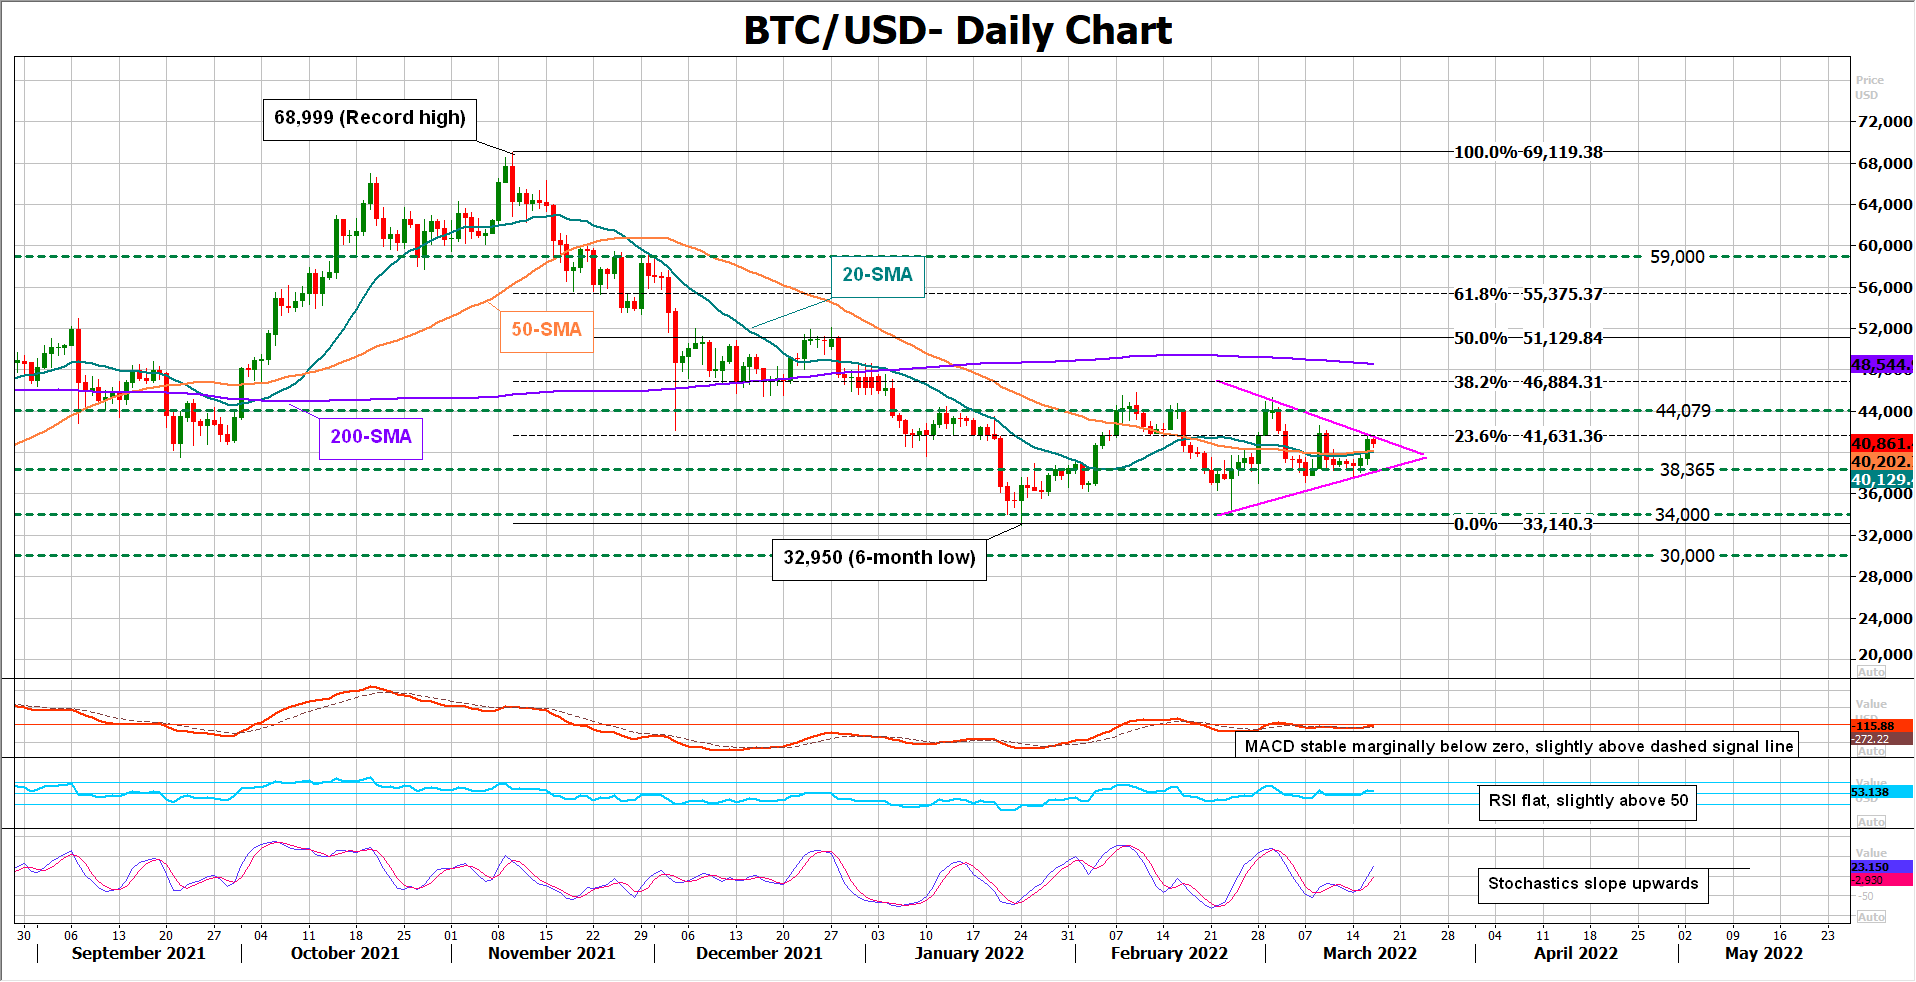
BTCUSD (Bitcoin) has been following a neutral trajectory since the end of January, driving back and forth between the 45,855 and 32,950 boundaries, though a symmetrical triangle started to become evident in March, suggesting that the next round of volatility could soon commence.
The momentum indicators provide little clue about which direction the market will take as the RSI keeps fluctuating around its 50 neutral mark, and the MACD is stable just below zero. Yet as long as the former holds above 50 and the latter hovers above its red signal line, upside movements are more likely than downside ones. The positive slope in the Stochastics is also backing this narrative.
If the popular crypto jumps above the triangle and the 23.6% Fibonacci retracement of the 68,999 – 32,950 down leg at 41,631, the bulls may push for a close above the 44,079 border. If efforts prove successful this time, buying pressures may grow up to the 200-day simple moving average (SMA) at 48,543. Beyond that, the rally may continue towards the 50% Fibonacci of 51,129 and then another battle could take place somewhere between the 61.8% Fibonacci of 55,375 and the 59,000 round level.
Alternatively, a break below the triangle and the 38,365 number could see an extension towards the 34,000 bottom. If sellers breach that base, the next pivot point could emerge around 30,000. Failure to bounce here could bring the 25,000 handle under examination.
In brief, BTCUSD is holding a neutral bias within a symmetrical triangle. A sustainable move above or below that formation could navigate the market accordingly.
Platinum Wave Analysis
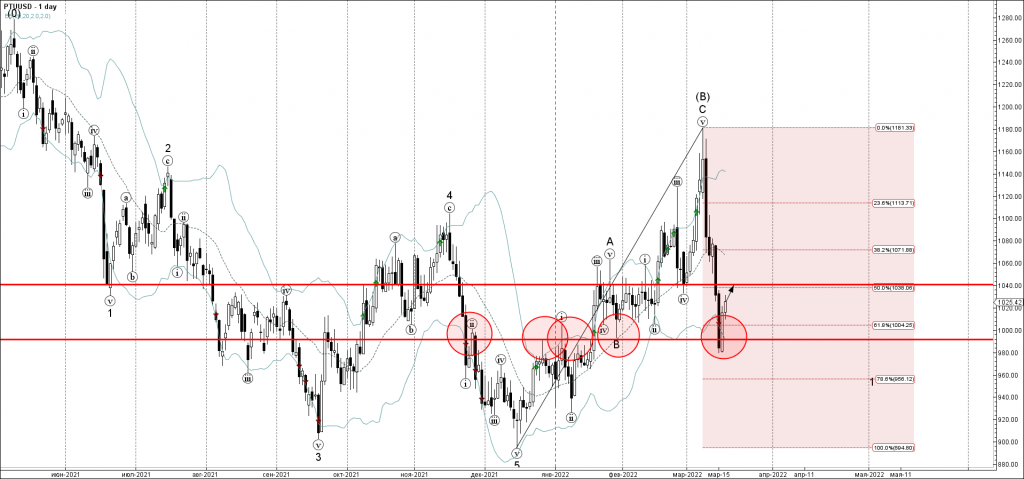
- Platinum reversed from support zone
- Likely to rise to resistance level 1040.
Platinum recently reversed up from the support zone located between the support levels 1000.00 and 990.00 (which have been reversing the price from November), strengthened by the 50% Fibonacci correction of the upward impulse from February .
The upward reversal from this support zone created the daily Japanese candlesticks reversal pattern Piercing Line.
Platinum can be expected to rise further toward the next resistance level 1040.00 (former support from February).
EURJPY Wave Analysis
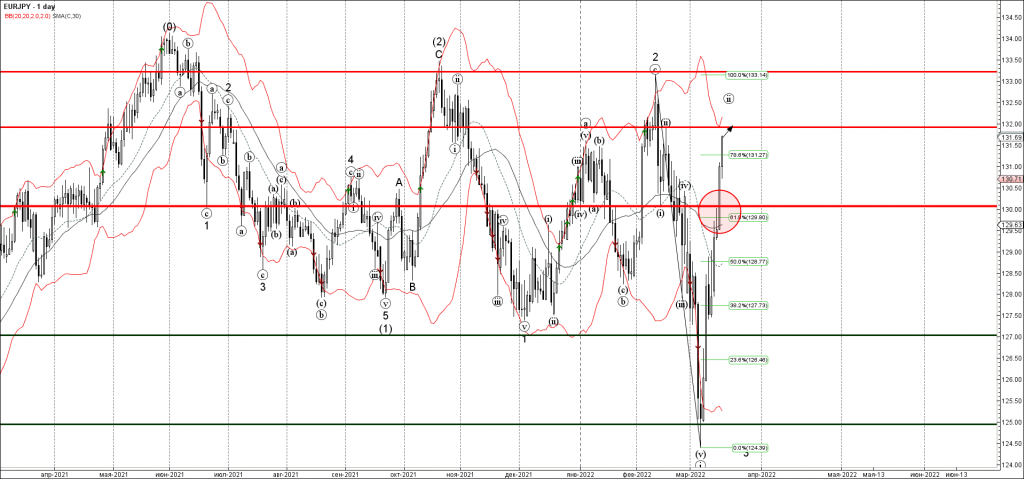
- EURJPY broke key resistnace level 130.00
- Likely to rise to resistnace level 132.00
EURJPY recently broke the key resistnace level 130.00, intersecting with the 61.8% Fibonacci correction of the downward impulse from February .
The breakout of the resistnace level 130.00 accelerated the active short-term correciton (ii).
EURJPY can be expected to rise further toward the next resistnace level 132.00 (top of the previous correciton (ii) from last month).