Sample Category Title
Eurozone CPI finalized at 5.9% yoy in Feb, EU at 6.2% yoy
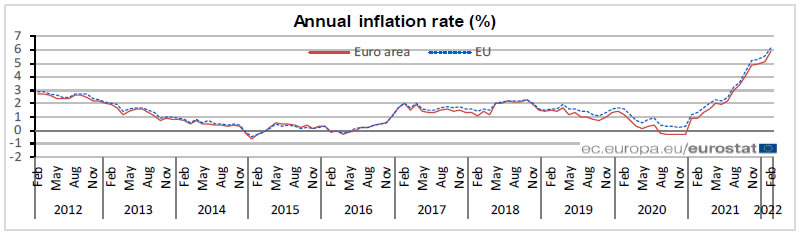
Eurozone CPI was finalized at 5.9% yoy in February, up from January's 5.1% yoy. The highest contribution to the annual euro area inflation rate came from energy (+3.12%), followed by services (+1.04%), food, alcohol & tobacco (+0.90%) and non-energy industrial goods (+0.81%).
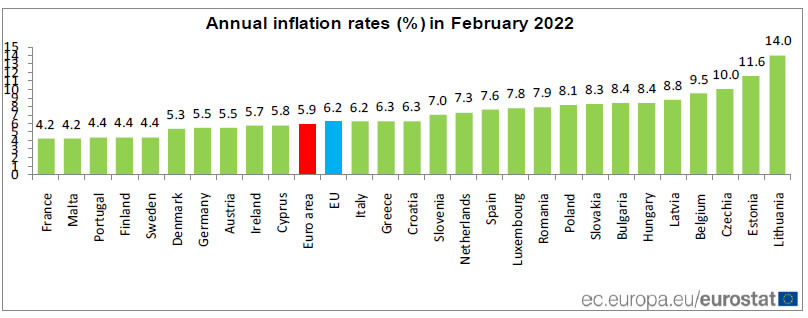
EU CPI was finalized at 6.2% yoy, up from January's 5.6% yoy. The lowest annual rates were registered in Malta, France (both 4.2%), Portugal, Finland and Sweden (all 4.4%). The highest annual rates were recorded in Lithuania (14.0%), Estonia (11.6%) and Czechia (10.0%). Compared with January, annual inflation fell in two Member States and rose in twenty-five.
WTI Oil Futures Set a Floor, But is it Stable?
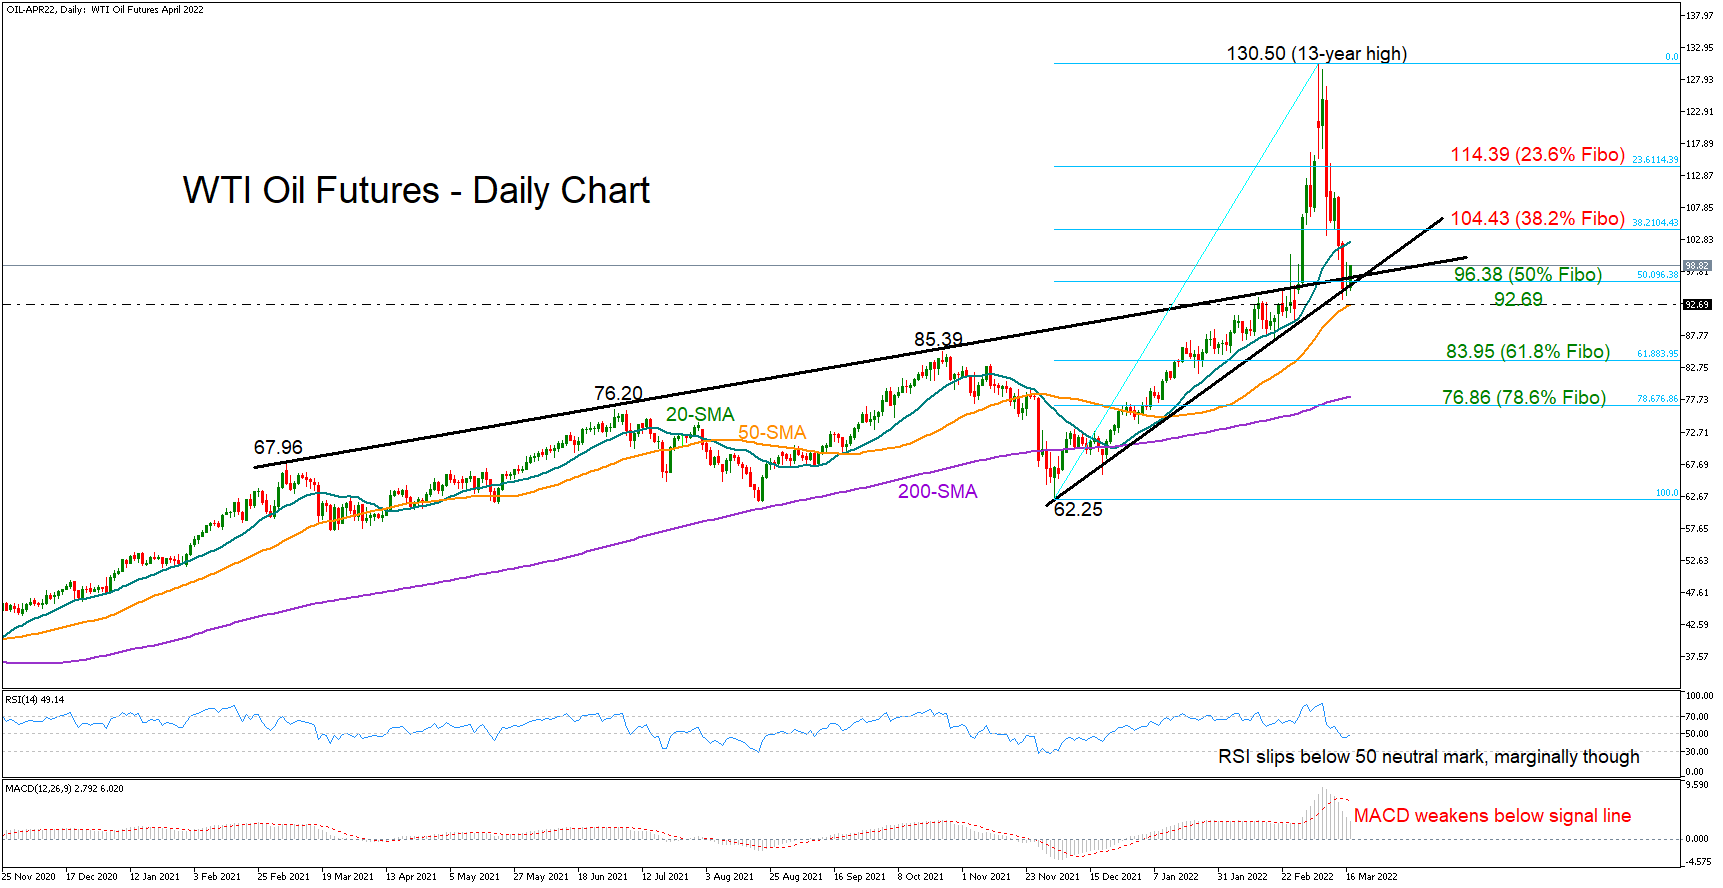
WTI oil futures (April delivery) started the day on a positive note on Thursday after two weeks of harsh selling. The positive momentum in the price is following the formation of a bullish doji around 95.32, which seems to have set the ground for an upside reversal along with the ascending trendline drawn from December’s low of 62.25.
That said, the short-term bias has not switched to the bullish side yet, according to the momentum indicators. The RSI has slipped below its 50 neutral mark, though marginally, while the MACD continues to lose steam below its red signal line, reflecting cautious trading in the market.
The broken resistance line, which connects all the highs from March 2021, will be closely watched in the near term at 97.11. Should the price successfully return above it, sustaining strength above the 50% Fibonacci retracement of the 62.25 – 130.50 upleg at 96.38 as well, the next barricade could emerge around the 20-day simple moving average (SMA) and the 38.2% Fibonacci of 104.43. Crawling higher, the price could challenge the 23.6% Fibonacci of 114.39 before accelerating towards the 13-year high of 130.50.
Alternatively, a pullback below the supportive trendline and the 50-day SMA at 92.69 could forcefully press the price towards the 61.8% Fibonacci of 83.95, where October’s high is also placed. Hence, a step lower from here would downgrade the market’s outlook to neutral, bringing the 200-day SMA and the 78.6% Fibonacci of 76.86 next into view.
In summary, despite today’s positive price action in WTI oil futures, negative risks are still lingering in the background. A clear deviation above the 97.00 level could bolster buying appetite in the short term, while a slide below 92.69 is expected to produce additional bearish corrections.
US Dollar Falls on China, Ukraine
In behaviour reminiscent of equity markets overnight, the US dollar staged a full retreat as stimulus hopes out of China, and an apparent Ukraine agreement inching closer to reality saw a mass exodus out of haven positioning and into full risk-seeking mode. The dollar index fell 0.62% to 98.40 where it remains this morning. This region is also technical support, and a sustained break lower will signal a deeper correction towards 97.50.
EUR/USD rallied powerfully for much the same reasons, climbing 0.75% to 1.1035, while GBP/USD rose 0.80% to 1.3160. A hawkish BOE today could extend sterling gains above 1.3200, and if more progress is made on a Ukraine agreement, EUR/USD could well be on its way to 1.1200. I believe the single currency will struggle to maintain its gains above that level, though, as post-Ukraine, the inflation shock will continue to persist and the divergence with US monetary policy will eventually stop any structural rally.
USD/JPY continues to trade around 118.75 as markets price in a soaring energy import bill, and a widening US/Japan rate differential. With the BOJ expected to remain as dovish as they have been for the last 25 years tomorrow, upside pressure on USD/JPY should resume. AUD/USD rallied 1.35% overnight to 0.7290, rising to 0.7310 in Asia after strong labour market data. NZD/USD is 1.0% higher to 0.6835 over the past 24 hours. Both antipodeans have surfed the resurgent wave in optimism from China and Ukraine higher. The rallies only leave them in the middle of their March ranges though. Although further sentient gains are possible, both are acutely vulnerable to negative headlines hitting the news tickers as well.
China was back adding countercyclical factors today, setting a much higher than expected PBOC USD/CNY fixing at 6.3406, while also adding cash via the repo. That stopped the overnight sentiment rally by CNY and CNH in its tracks and is also going to limit gains in the Asian FX space in general. The Korean won, Indian rupee, Thai baht, Singapore dollar, and Malaysian ringgit rallied sharply overnight and have booked more gains today, riding China euphoria. As massive net importers of energy, and with little or no willingness to materially tighter monetary policy, all will struggle to maintain material gains, especially if China is guiding the yuan lower. The rally could continue for a few sessions yet, but I expect Asian currencies especially, to face serious challenges this year.
EUR/USD May Test New Lows: Elliott Wave Analysis
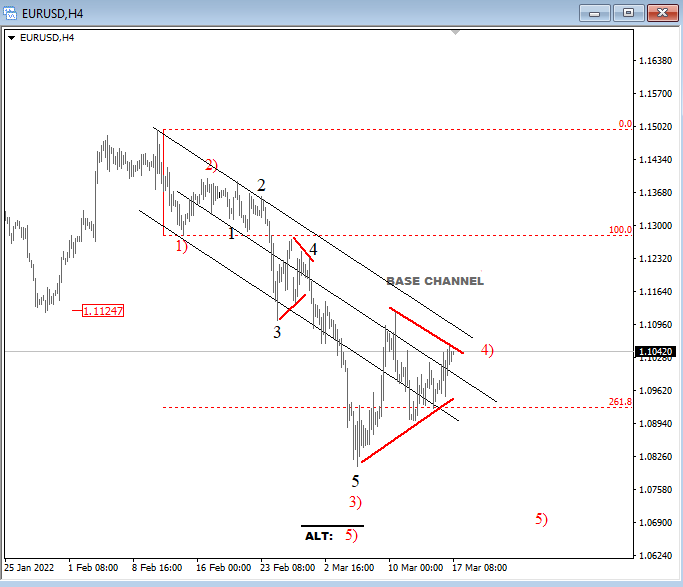
EURUSD found some support recently, but move from the low is not in five waves for now, so we are still tracking a higher degree downtrend, currently with a pause that appears like a wave 4), possibly it's a triangle. So ideally, the pair is going to print new lows into wave 5) to complete a higher degree downtrend near 1.07.
EUR/USD 4h Elliott Wave analysis
US30 Index Uptick Not Enough to Alter Bearish Outlook
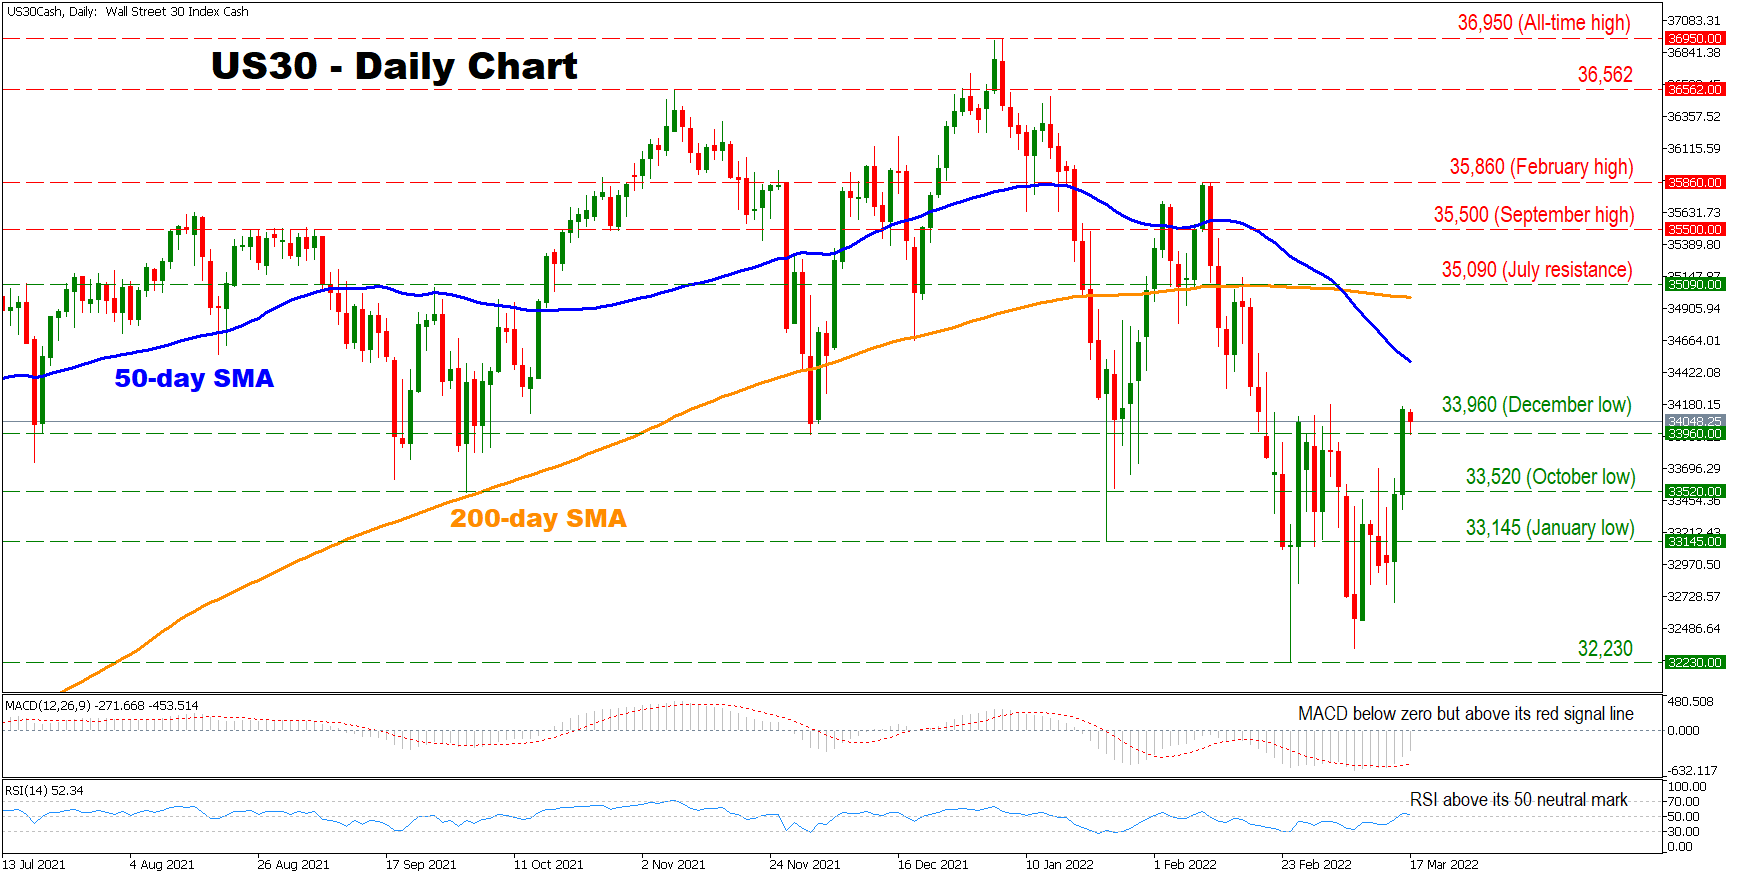
The US 30 index has witnessed an uptick over the last few trading sessions as the negativity in the price seems to be waning. However, the index continues to record a series of successive lower highs and lower lows, supporting an overall bearish outlook.
Despite the bearish outlook, short-term momentum oscillators are reflecting a slightly positive bias as the RSI has recently crossed above its 50 neutral mark. Moreover, the MACD is found above its red signal line, although still below zero, which indicates that the negative momentum in the price might be fading.
The bulls seem to have resurfaced over the last few trading sessions. Should they manage to push the price above the 50-day simple moving average (SMA) currently at 34,500, buyers could then target the region which includes the 200-day SMA and the 35,090 level. Crossing above this area could turn the fortunes around for the pair, opening the door towards the September high at f 35,500.
However, if the bears seize back control, the first line of defense could be found at the December low of 33,960. A break below this point could pave the way towards the consecutive hurdles of 33,520 and 33,145. Crossing below the latter could intensify selling pressures, sending the price to test the 32,230 obstacle.
In brief, despite the fact that the index’s bias seems to be improving, the overall outlook remains bearish amid successive lower highs. For sentiment to change, buyers would need to break above the 200-day SMA currently at 34,990.
AUDUSD Tests 200-Day SMA and 0.7300 Mark
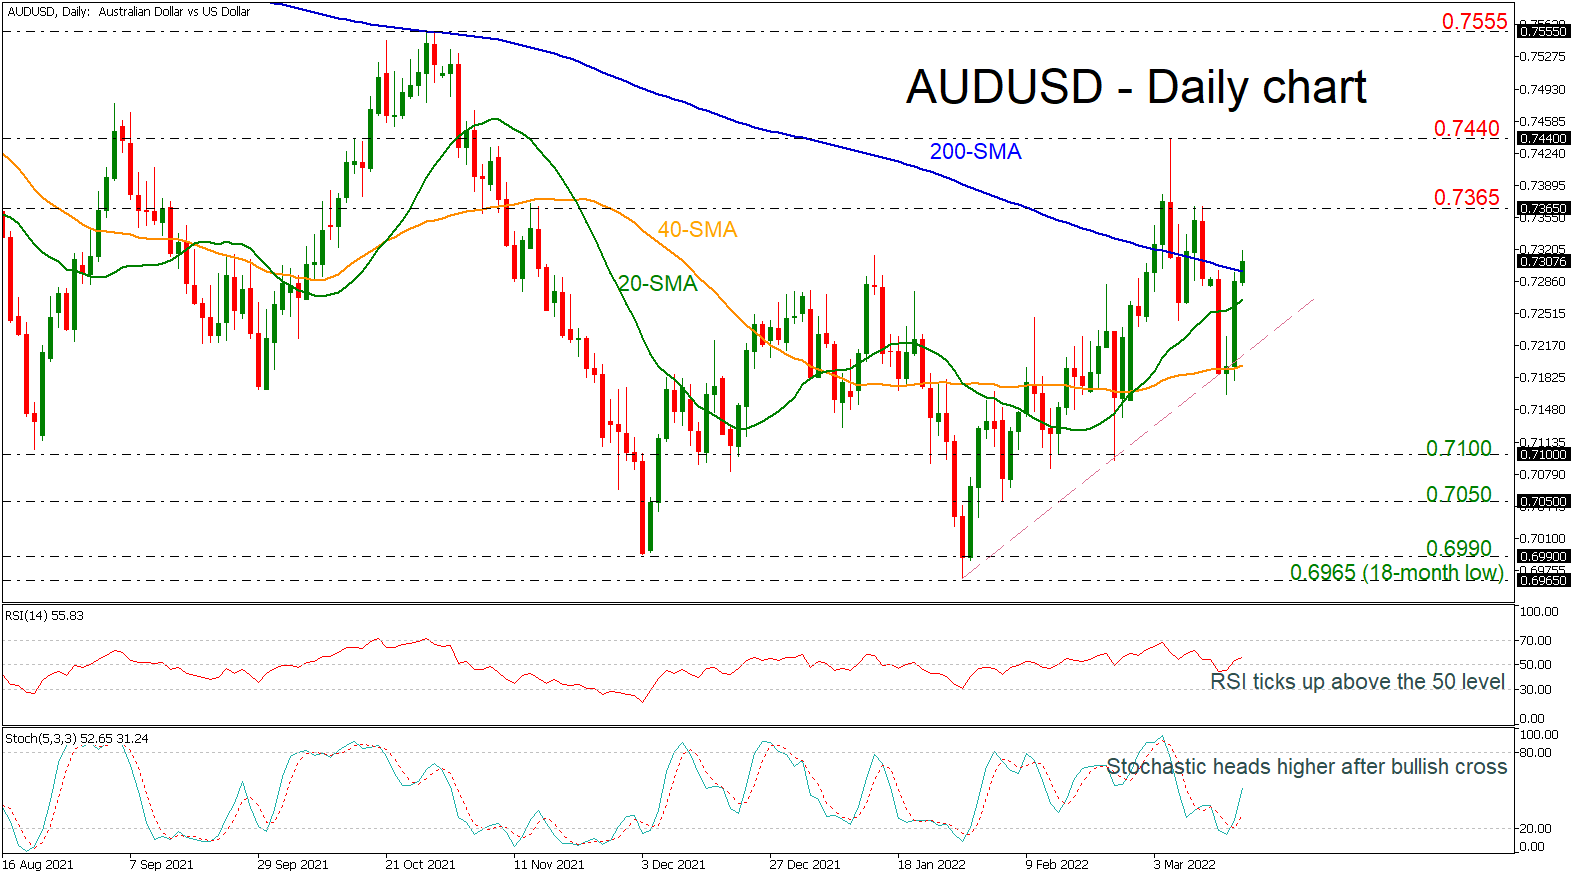
AUDUSD rebounded off the short-term ascending trend line, currently flirting with the 200-day simple moving average (SMA) around the 0.7300 psychological mark.
As regards the technical indicators, the RSI is strengthening its bullish move above the neutral threshold of 50, while the stochastic is extending its upside move higher, after the bullish crossover within its %K and %D lines.
Immediate resistance could come from the 0.7365 barrier before the focus turns to the 0.7440 level. If buying interest persists, the price could rally towards the 0.7555 hurdle, shifting the outlook to strongly positive.
In the negative scenario, a return beneath the 200-day SMA could drive the pair until the supportive 20-day SMA at 0.7300. Stepping lower, the near-term uptrend line, which overlaps with the 40-day SMA, may halt the bearish actions at 0.7195. Below that, a close below the 0.7100 and 0.7050 levels would switch the bias to neutral.
In brief, AUDUSD has been in an ascending move since January 28. A successful break above the 200-day SMA, it could endorse the current bullish outlook.
Daily Technical Analysis
EUR/USD
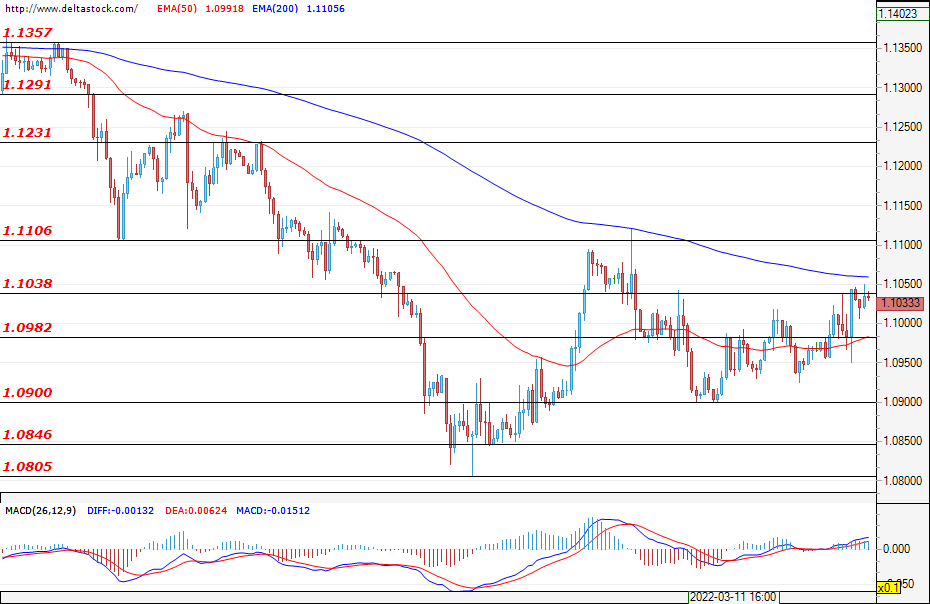
A rate hike by the Fedis already a fact – the first of its kind since 2018. At the time of writing the analysis, the pair is just about to test the resistance zone at 1.1038, and a successful breach here could boost the bullish sentiment towards the next significant level at 1.1106. Today, the important economic news that would be of interest to the market participants, is the data on the consumer price index for Europe (10:00 GMT), as well as the initial jobless claims data for the U.S. (12:30 GMT).
USD/JPY
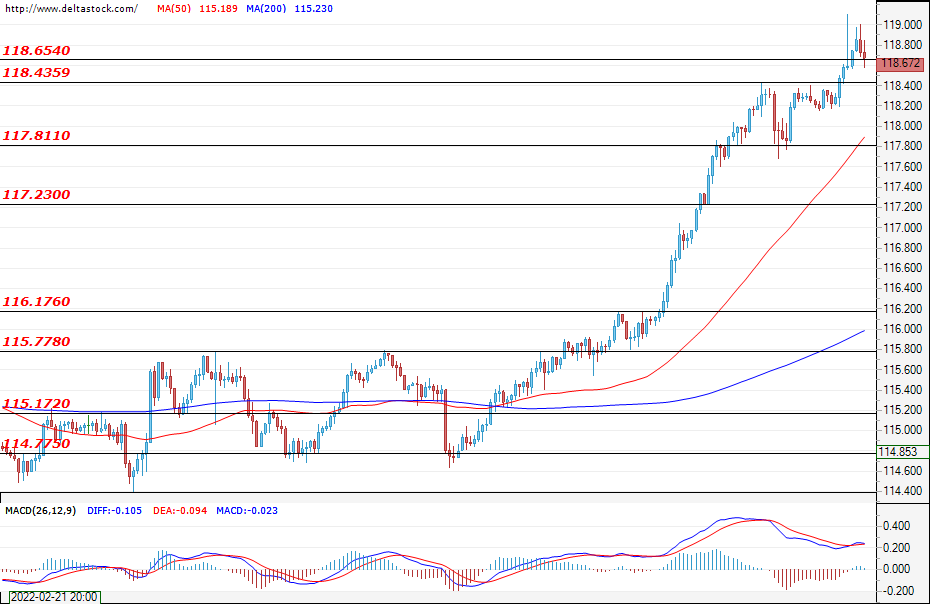
The bulls were limited to the 119.00 level, and at the moment, the subsequent withdrawal cannot yet be considered as a sentiment reversal. It is quite possible that the appreciation of the U.S. dollar against the Japanese yen will continue, reaching levels of around 120.00, and for the current depreciation to be considered as a corrective phase, which could possibly deepen the market towards the support level at 117.80 in order to find better market entry levels.
GBP/USD
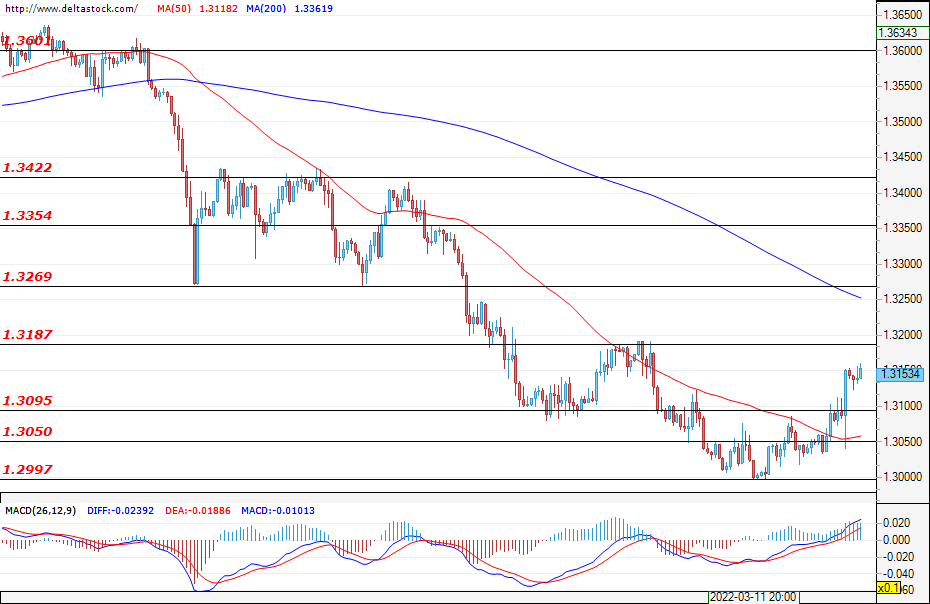
The cable managed to gain momentum, and at the time of writing, it is trading just below the resistance zone at 1.3187. The interest rate decision of the Bank of England (today; 12:00 GMT) will be crucial for the future of the currency pair. In the event of a continuation of the positive sentiment, the currency pair would experience more serious difficulties only in overcoming the main resistance at 1.3270.
EUGERMANY40
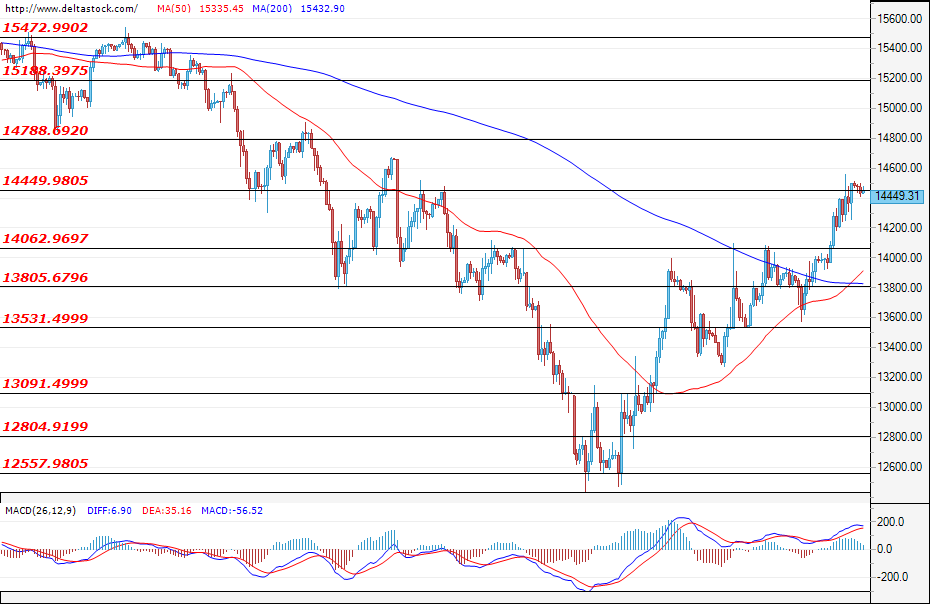
The recovery of the German index continued since the previous session after we witnessed a successful breach of the resistance zone at 14062, and at the time of writing, the EUGERMANY40 is currently testing the 14450 level. A successful breach here could lead the index towards the next important area for the market participants =at 14800. The inflation data for Europe (today; 10:00 GMT) would likely influence the market participants’ sentiment, possibly leading to an increase in the overall volatility.
US30
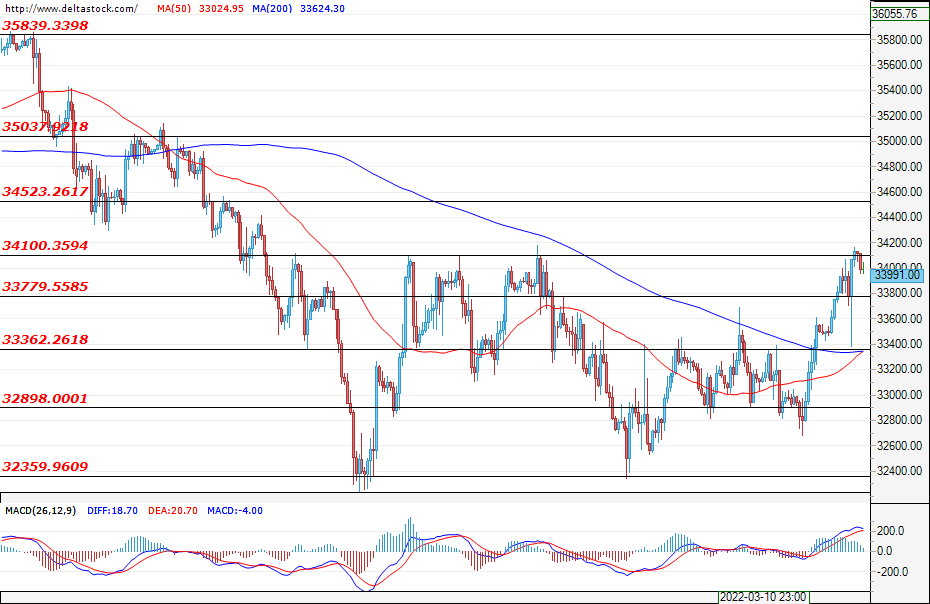
We witnessed a very action-packed session for the American blue-chip stock index, which for a moment was even trading in the red after the announcement of the interest rate decision by the U.S. Federal Reserve. In the last hours of trading, however, the index entered green territory, reaching the resistance at 34100 after investors priced in the aggressive U.S. monetary policy, expressed in several consecutive interest rate hikes this year in order to stifle inflation and thus support the economy in the long run. Today, the economic news that could affect the market is the initial jobless claims data for the U.S. (12:30 GMT), during which event we could once again expect increased volatility.
Dollar Retreats as Fed Hikes for the First Time Since 2018
American stocks rose on Wednesday after signs emerged that Russia and Ukraine were making progress. According to the Financial Times, the two sides have made progress on a tentative 15-point peace plan that includes an immediate ceasefire and withdrawal of Russian troops in the country. In exchange, Ukraine will declare neutrality and accept limits on its armed forces. Ukraine will agree not to host foreign military bases in exchange for protection from countries like the US, UK, and Turkey.
The US dollar retreated after the Federal Reserve delivered its first interest rate hike since 2018. The bank decided to increase its main interest rate by 0.25%, which was in line with expectations. In a statement, Jerome Powell said that the US continues to face substantial inflation pressure. He also warned that the situation will continue in the coming months. Besides, prices of key commodities like crude oil and copper have risen substantially recently. The bank expects to deliver six more rate hikes this year.
The economic calendar will have several important events today. In the UK, the Bank of England will conclude its two-day meeting. Analysts expect that the bank will deliver another 25 basis point rate hike. This will be the first time in years that the bank has raised rates in three straight meetings. In the Eurozone, Eurostat will publish the latest consumer price index. Economists expect the data to show that the CPI rose to 5.8% in February. The other important event will be the latest interest rate decision by the Turkish central bank.
EURGBP
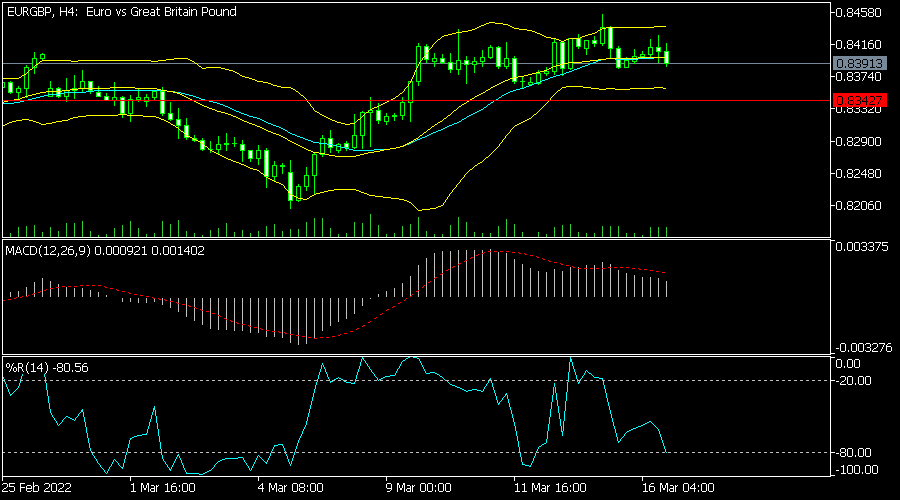
The EURGBP pair declined to 0.8390, which is lower than the weekly high of 0.8456. On the four-hour chart, the pair is slightly below the middle line of the Bollinger Bands. It has also moved slightly below the 25-day moving average while the Relative Strength Index is pointing downwards. The MACD is above the neutral level. Therefore, the pair will likely continue falling ahead and after the BOE decision.
XBRUSD
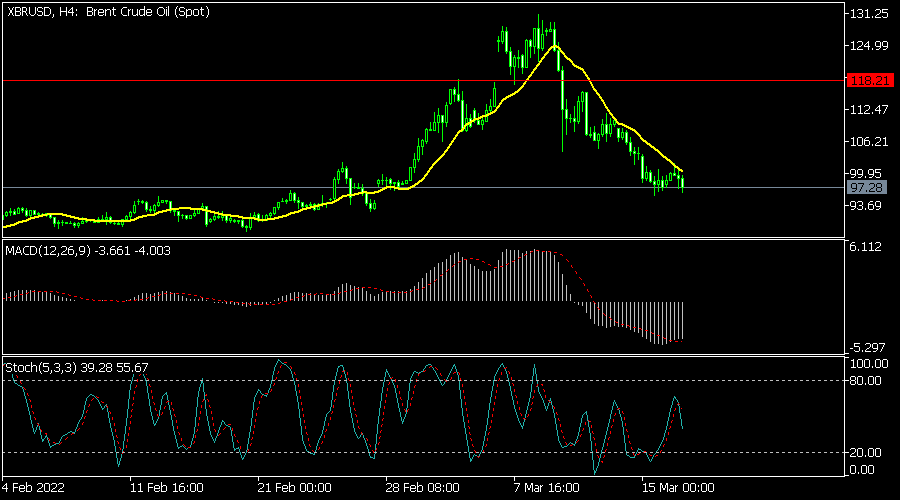
The XBRUSD pair declined after signs of peace emerged and after the relatively weak US inventories numbers. It is trading at 97.13, which is the lowest it has been since February 28. The pair has moved below the 25-day and 50-day moving averages. The MACD has moved below the neutral level while the Stochastic oscillator is at the neutral level. Therefore, the pair will likely rebound as investors buy the dip.
EURUSD
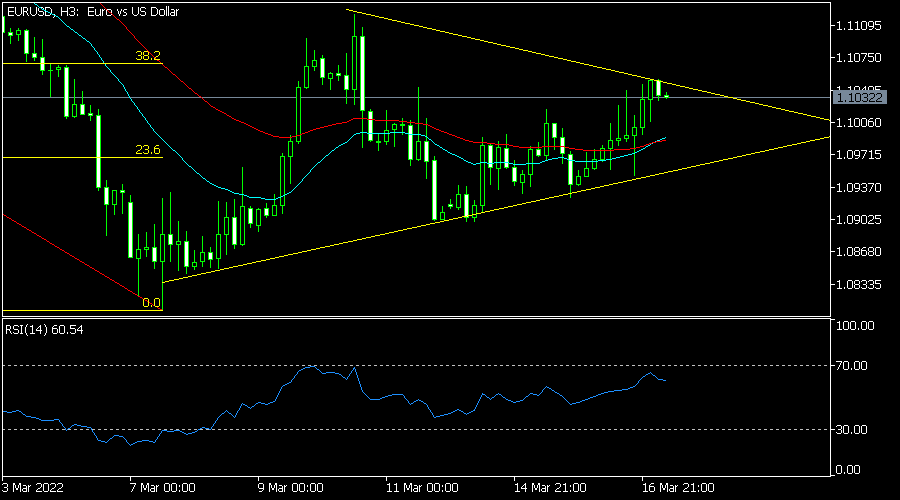
The EURUSD pair held steady after the Fed decision and after signs of a deal between Russia and Ukraine emerged. It is trading at 1.1032, where it has been in the past few days. The pair has moved above the upper side of the ascending trendline. It has also formed a symmetrical triangle and moved slightly above the 23.6% Fibonacci retracement level. Therefore, the pair will likely keep rising ahead of EU inflation data.
GBP/JPY Daily Outlook
Daily Pivots: (S1) 154.84; (P) 155.50; (R1) 156.78; More...
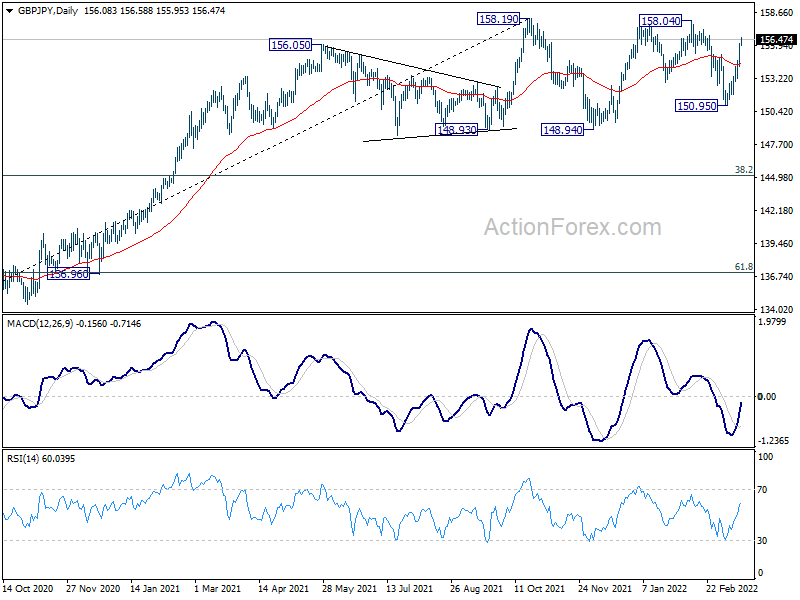
GBP/JPY's rise from 150.95 accelerates to as high as 156.58 so far. Break of 155.20 resistance argues that pull back from 158.04 has completed. Also, the corrective pattern from 158.19 might have finished too. Intraday bias is now on the upside for 158.04/19 resistance. Firm break there will resume larger up trend. On the downside, below 154.23 minor support will turn bias neutral again.
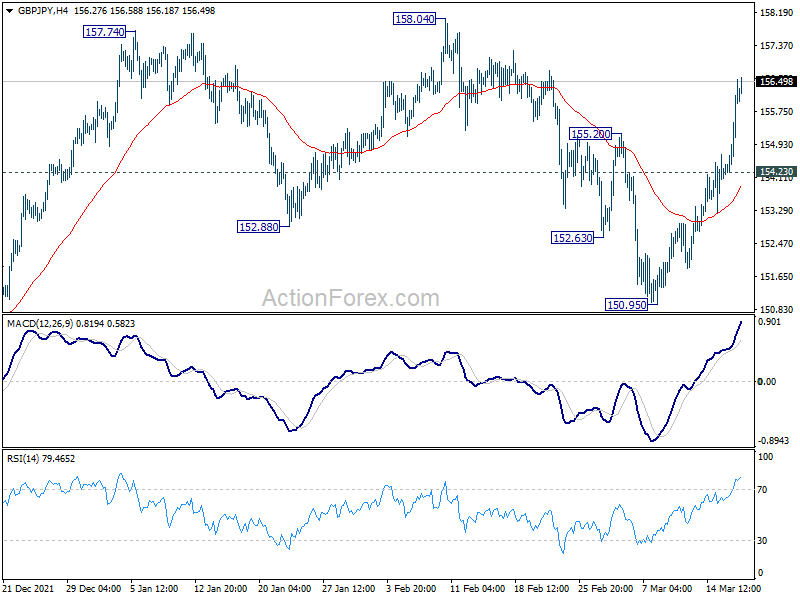
In the bigger picture, price actions from 158.19 are seen as developing into a consolidation pattern to up trend from 123.94 (2020 low). Downside should be contained by 38.2% retracement of 123.94 to 158.19 at 145.10 to bring rebound. Firm break of 158.19 will resume the up trend to long term fibonacci level at 167.93. However, sustained break of 145.10 will raise the chance of trend reversal and target 61.8% retracement at 137.02.
EUR/JPY Daily Outlook
Daily Pivots: (S1) 129.16; (P) 129.60; (R1) 129.91; More....
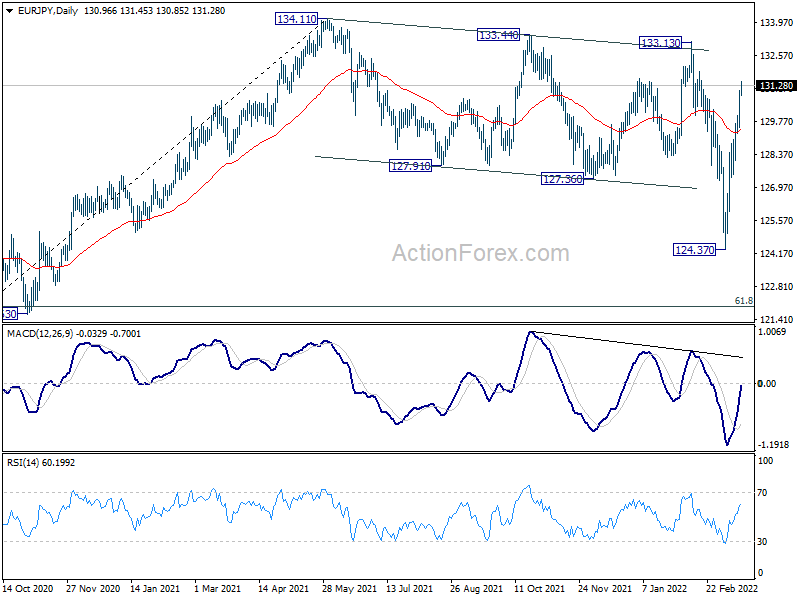
EUR/JPY's rise from 124.37 continues today and intraday bias stays on the upside. The corrective pattern from 134.11 could have completed at 124.37 already. Further rise should be seen to 133.13/134.11 resistance zone next. On the downside, break of 129.30 minor support will mix up the outlook and turn intraday bias neutral first.
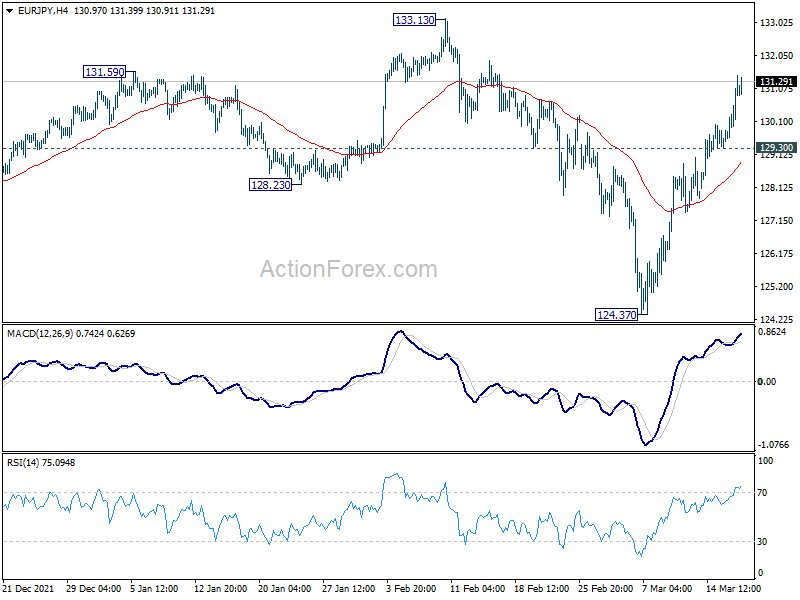
In the bigger picture, medium term outlook remains neutral for now. Price actions from 134.11 are so far still seen as a corrective pattern. That is, rise from 114.42 (2020 low) is in favor to resume at a later stage. But before that, the corrective pattern from 134.11 could still extend further, sideway or downward. In the latter case, break of of 124.37 will target 61.8% retracement of 114.42 to 134.11 at 121.94.