Sample Category Title
S&P 500 eyes 34179 resistance after post FOMC rebound
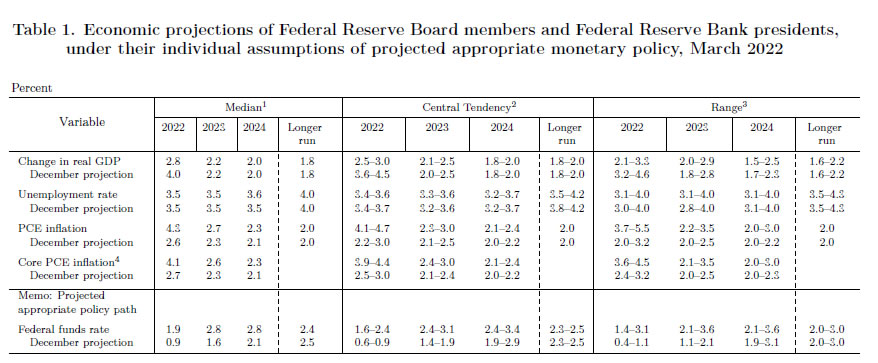
Markets responded rather well to Fed's rate hike, statement and new economic projections. In short, Fed raised federal funds rate target by 25bps to 0.25-0.50%. In the updated dot plot, 12 of the FOMC participants expected federal funds rate to reach 1.75-2.00% by then end of 2022, that is, 1.50% above the current level. The end point of current tightening cycle was also raised from 2.1% to 2.8%, and pulled ahead to 2023. Balance sheet runoff could start at a "coming meeting", that is, May.
Suggested readings on Fed
- Fed Still Behind the Curve Despite Signalling Six Further Rate Hikes
- FOMC Hikes Rates 25bps as Expected, But Statement Says More Hikes to Come!
- Fed Chair Powell press conference live stream
- Fed hike 25bps, sees rate at 1.9% by end of 2022, 2.8% by end of 2023
- (FED) Federal Reserve Issues FOMC Statement
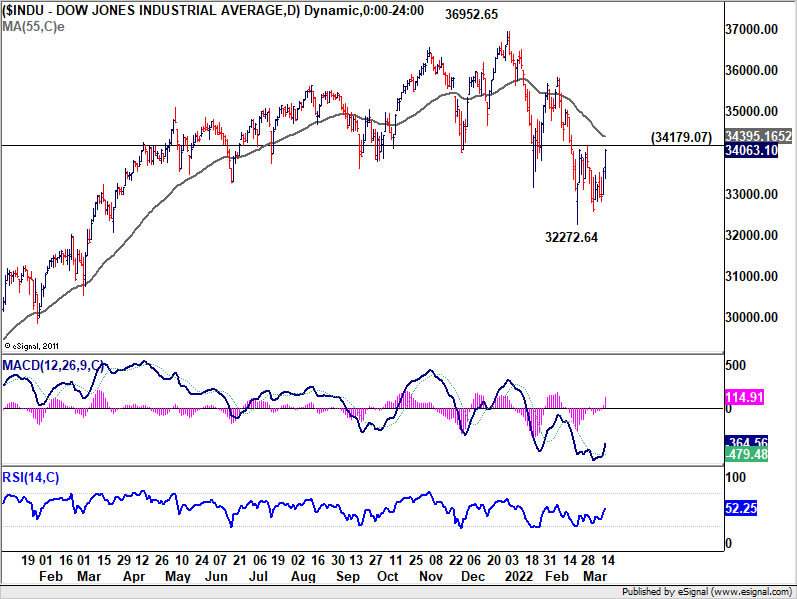
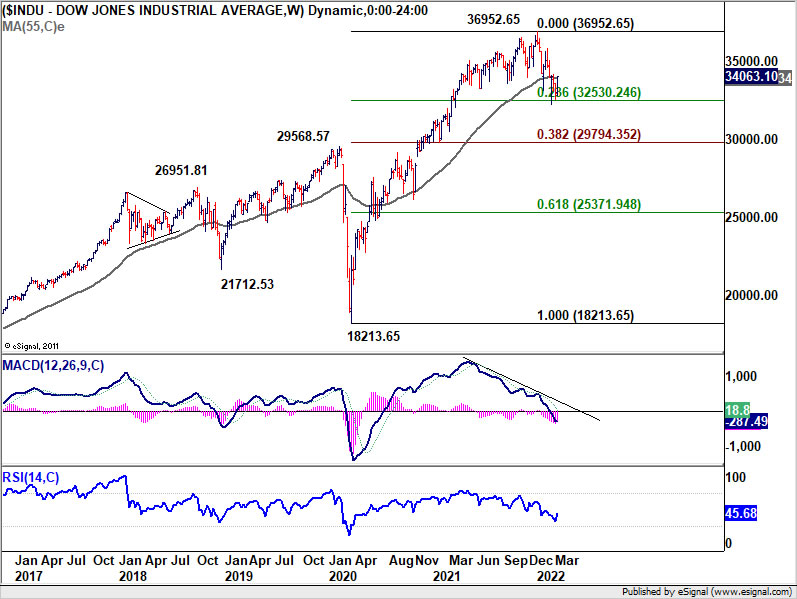
Major stock indexes closed sharply higher overnight. S&P 500 is now having 34179.07 near term resistance in radar. Firm break there will argue that the pull back from 36952.65 has completed with three waves down to 32272.64 already. Stronger rally would then be seen be seen back to retest 36952.65 high.
The strong support from 23.6% retracement of 18213.65 to 36952.65 at 32530.24, which is a rather bullish sign from long term perspective. Even though break of 36952.65 high is not expected at the first attempt. The range for consolidation could have been set already.
Australia Labour Supply Dependent on Rising Female Participation
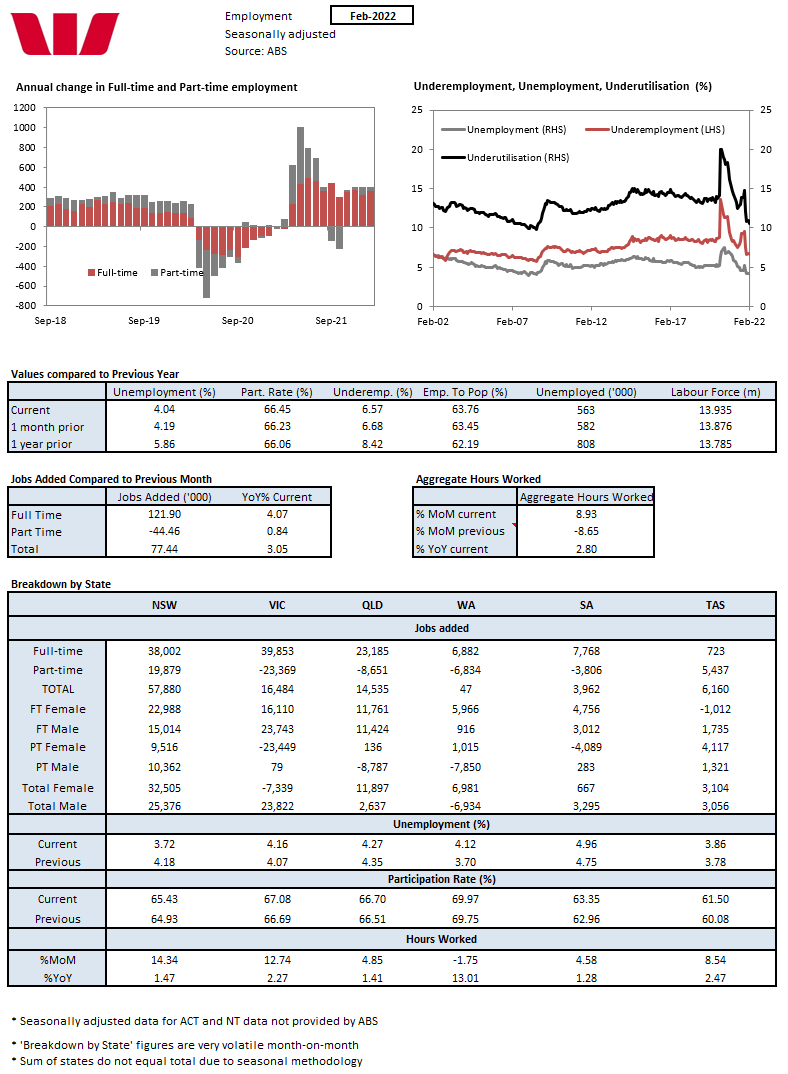
Fourth consecutive upward surprise on employment. However, rising labour supply has become dependent on rising female participation. Total employment: 77.4k from 28.3k (revised from 12.9k); unemployment rate: 4% from 4.2% (unrevised 4.2%); participation rate: 66.4% from 66.2% (unrevised 66.2%).
January was the fourth consecutive upside surprise for employment. Employment rose 77.4k, much stronger than the market forecast of +37k and even stronger than Westpac’s top of the range forecast for +60k. This followed on from the 28.3k in January (revised from 12.9k), 70.8k in December and 372.5k in December. There was also the expected strong reversal in hours worked which lifted 8.9% following the Omicron hit of -8.6% in January when an unseasonally high number of people were sick or on leave.
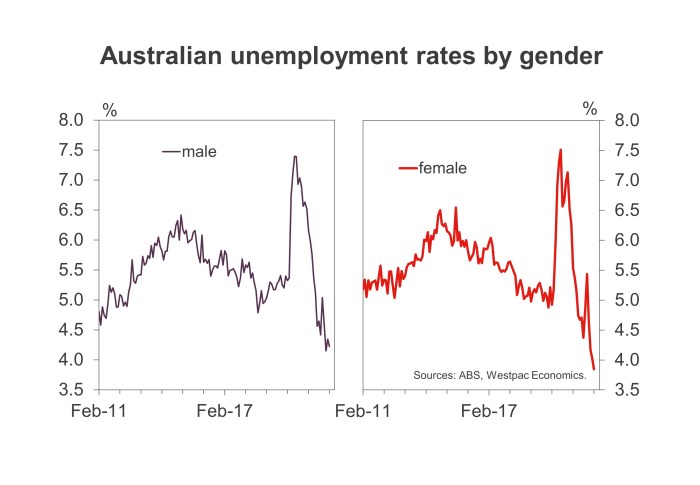
There was even Westpac expected robust rise in participation of 0.2ppt to 66.4% (market was looking for a softer 0.1ppt rise) which drove a 58.9k rise in the labour force. As such, there was a larger than expected fall in the unemployment rate to 4.0% from 4.2% - both the market and Westpac were forecasting an unemployment rate of 4.1%.
February saw the lowest unemployment rate since August 2008 and only the third time in the history of the monthly survey when unemployment was as low as 4.0% per cent (February 2008, August 2008, February 2022). There were lower unemployment rates back in November 1974 but this was when the survey was conducted quarterly.
This is a very robust update on the labour market, not just in terms of robust labour demand but also the strong gains in labour supply with the participation rate hitting a record high of 66.45% at two decimal places.
With the labour demand indictors continuing to paint a very robust picture for the growth in employment, particularly in the near term, with limited growth in the working age population due to the closed borders (up just 0.5% in the year but it is improving with a 0.2.% lift in the last three months) rising 0.8% three months annualised rising participation to new record highs will be critical to providing the required labour to match the demand.
If participation does not rise as expect and the projected employment growth is achieved then we will see a much lower unemployment rate that the 3.8% forecast. It is also possible that if participation does not rise as expected, firms may not be able to attract workers that are suitable to their needs and hence the lack of supply could be brake on stronger employment growth. If this was to happen we could still see the expected 3.8% low in unemployment even with softer than expected growth in employment.
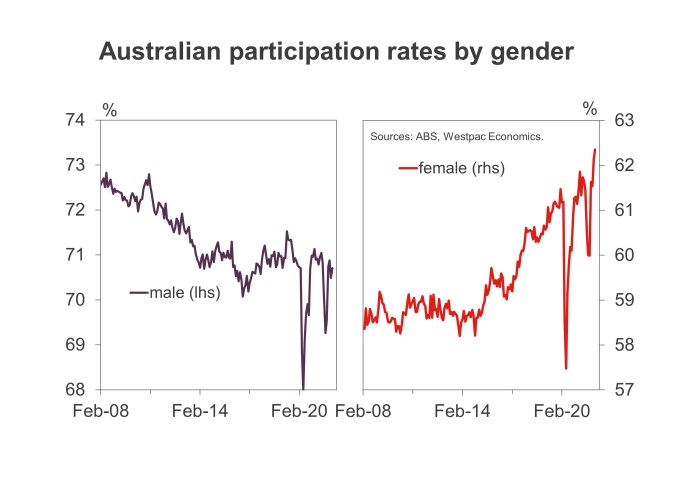
Females have been driving the growth in employment (3.9%yr vs 2.3%yr for males) and the labour force (2.1%yr vs 0.2%yr for males). So even though male unemployment has declined more than females in the year (-1.8ppt to -1.7ppt respectively) it has due to a 0.2ppt decline in male participation in the year. By contrast female participation has lifted 0.95ppt in the year to a new record high of 62.35% - male participation is still higher at 70.71% but it is well off its record high of 79.49% way back in 1978.
It does appear that the recent robust demand for labour has been able to halt the trend decline in male participation but it has not been enough to lift it. Given that, if we are to get the supply of labour needed this year than female participation is going to have to continue to rise to new record highs; our estimate is that it is likely to have to rise to more than 65.50% sometime around mid-year.
It is also worth noting that female unemployment, at 3.8%, is lower than male unemployment at 4.2%. For females, 3.8% is the lowest since May 1974. Meanwhile, 4.2% for males is the second lowest level since November 2008 and just above the 4.1% print in December 2021 of 4.1%.
The underemployment rate fell 0.1ppt in February to 6.6%, 2.2ppt lower than March 2020 (8.8%) and the lowest it had been since November 2008.
The underutilisation rate, which combines the unemployment and underemployment, dropped 0.3ppts to 10.6%, 3.4ppts lower than March 2020 (14.1%) and the lowest since October 2008.
Technical Outlook and Review
DXY:
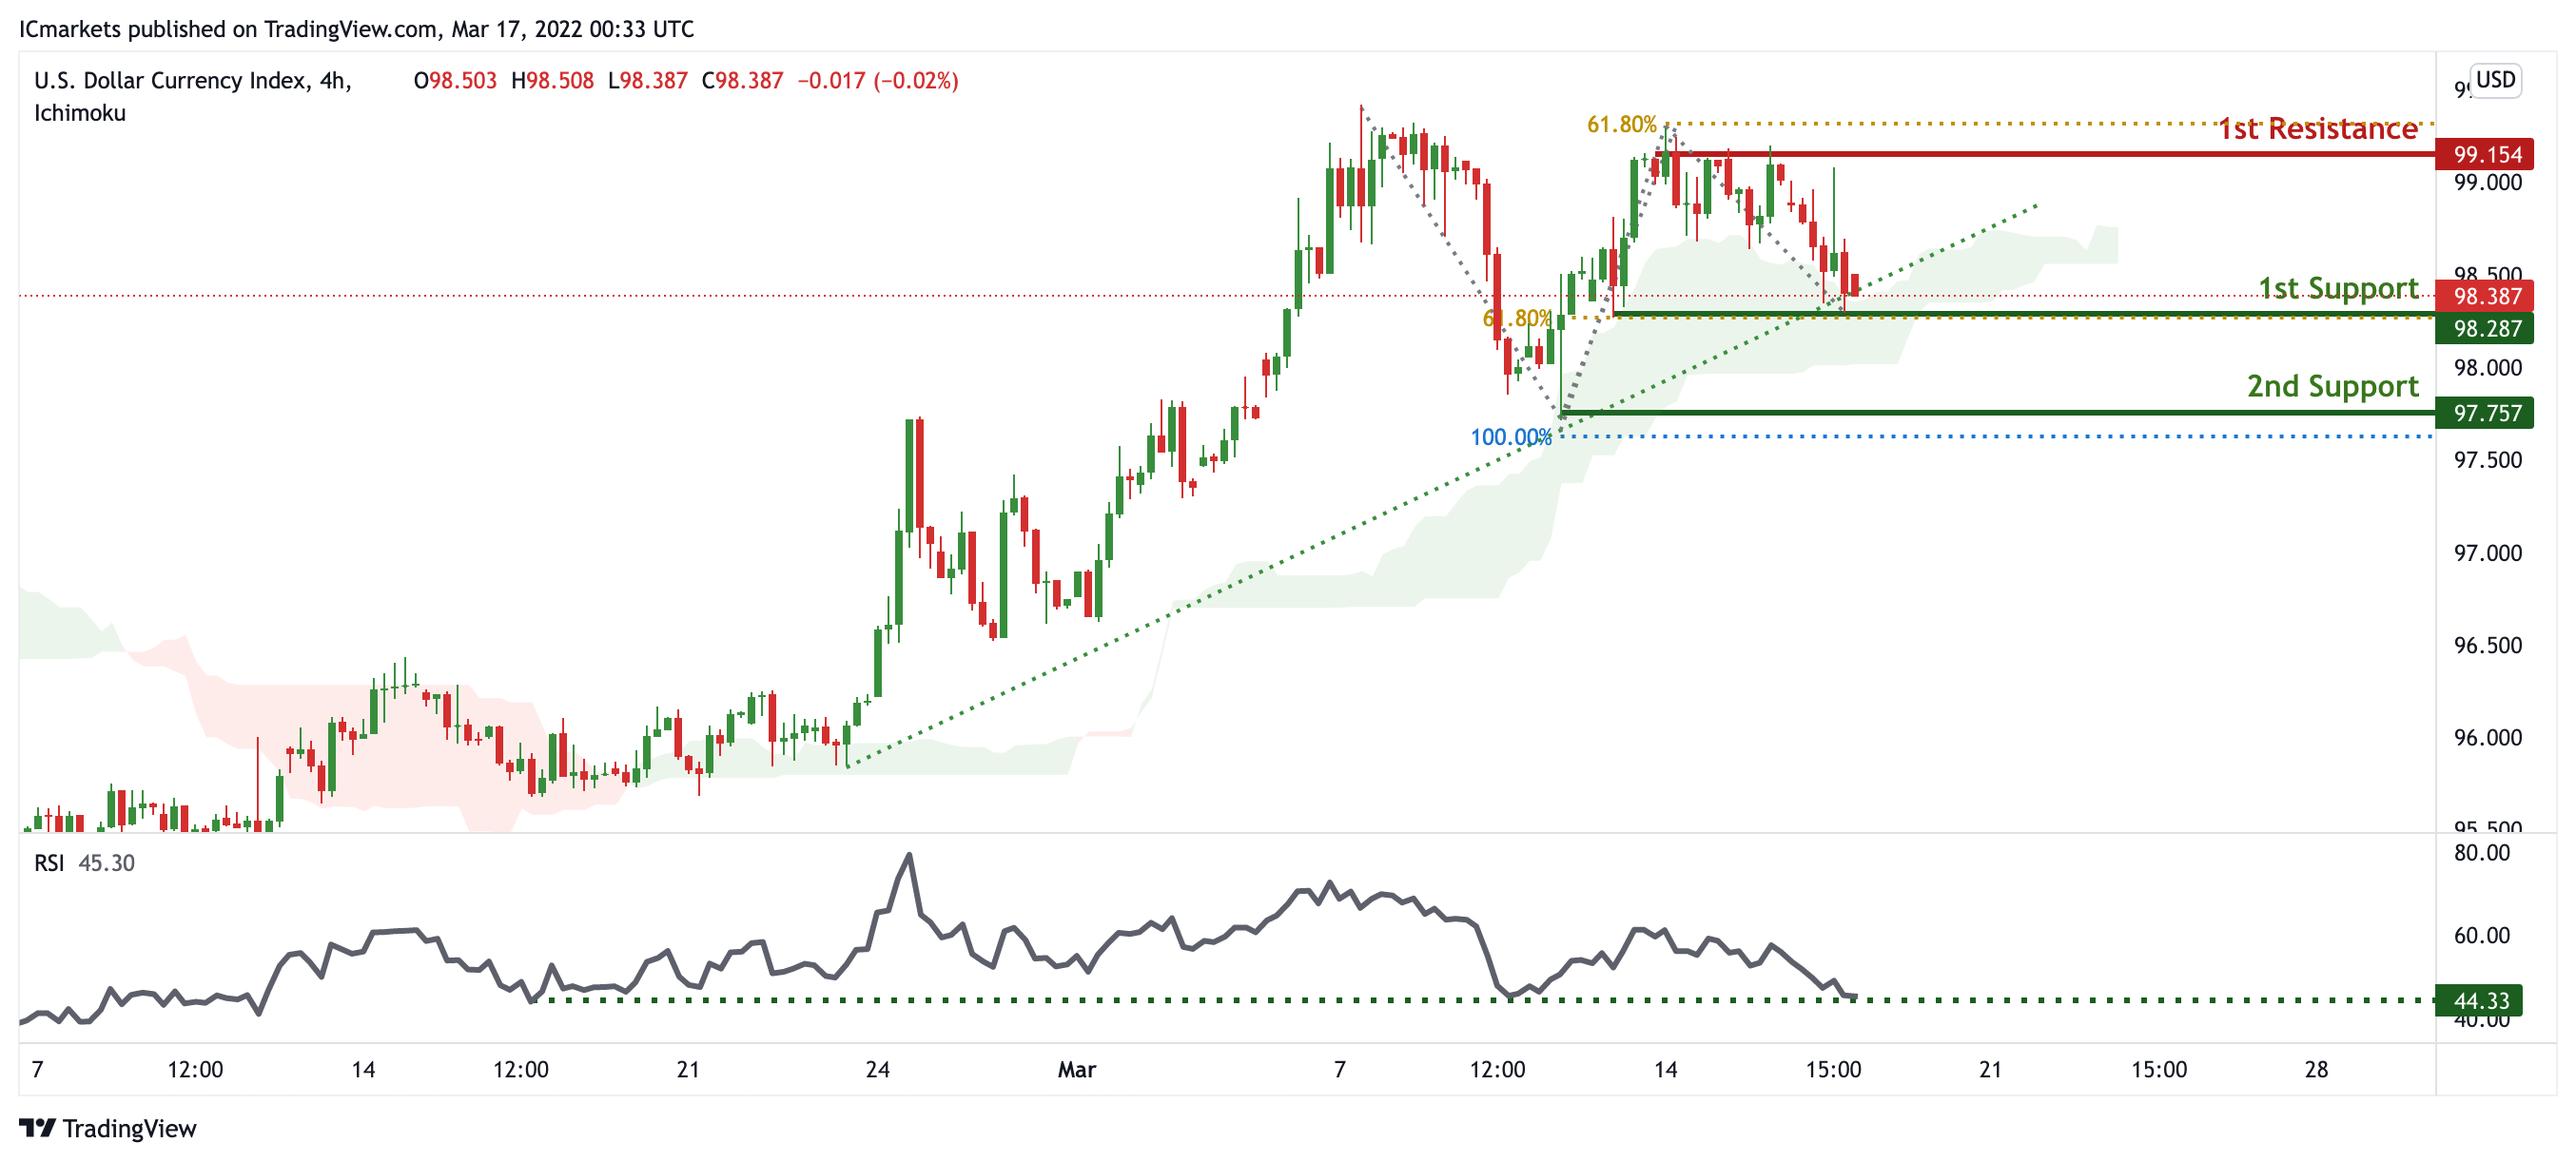
On the H4 timeframe, prices are on bullish momentum and abiding to our ascending trendline support. We see the potential for a bounce from our 1st support at 98.287 in line with 61.8% Fibonacci projection towards our 1st resistance at 99.154 in line with 61.8% Fibonacci retracement. Prices are trading above our ichimoku cloud support and RSI are at levels where bounces previously occurred, further supporting our bullish bias.
Areas of consideration:
- H4 time frame, 1st resistance at 99.154
- H4 time frame, 1st support at 98.287
XAU/USD (GOLD):
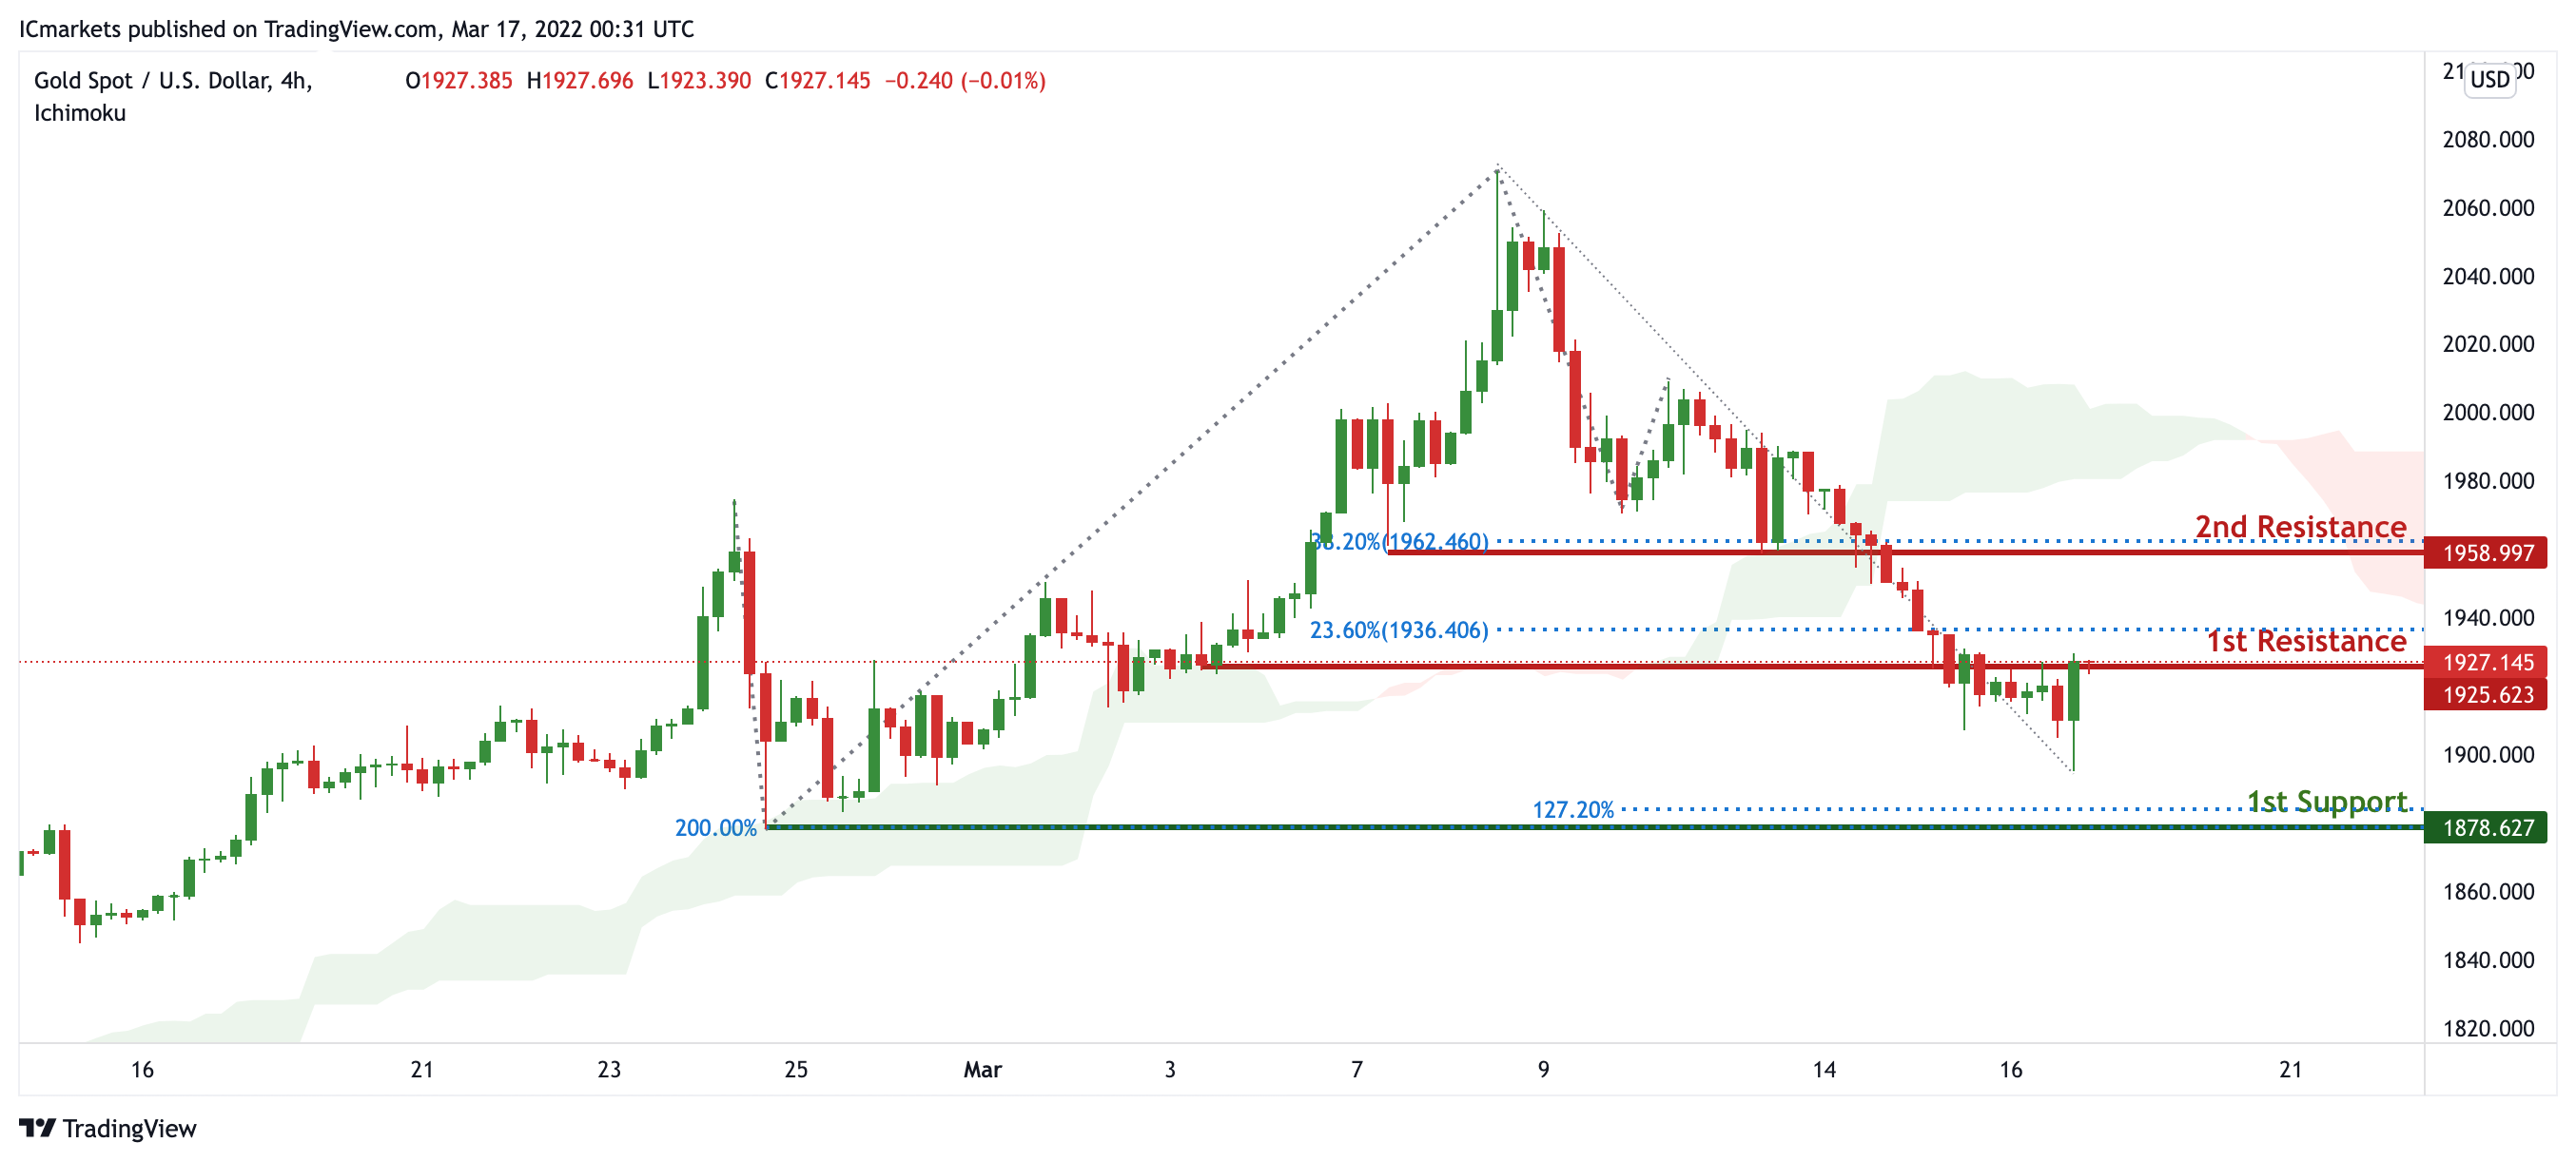
On the H4, prices are on bearish momentum. We see the potential for further bearish continuation from our 1st resistance at 1927.14 in line with 23.6% Fibonacci retracement towards our 1st support at 1878.627 in line with 200% Fibonacci projection and 127.2% Fibonacci Projection. Ichimoku is on bearish momentum, further supporting our bias.
Areas of consideration:
- 4h 1st support at 1878.627
- 4h 1st resistance at 1927.14
GBP/USD:
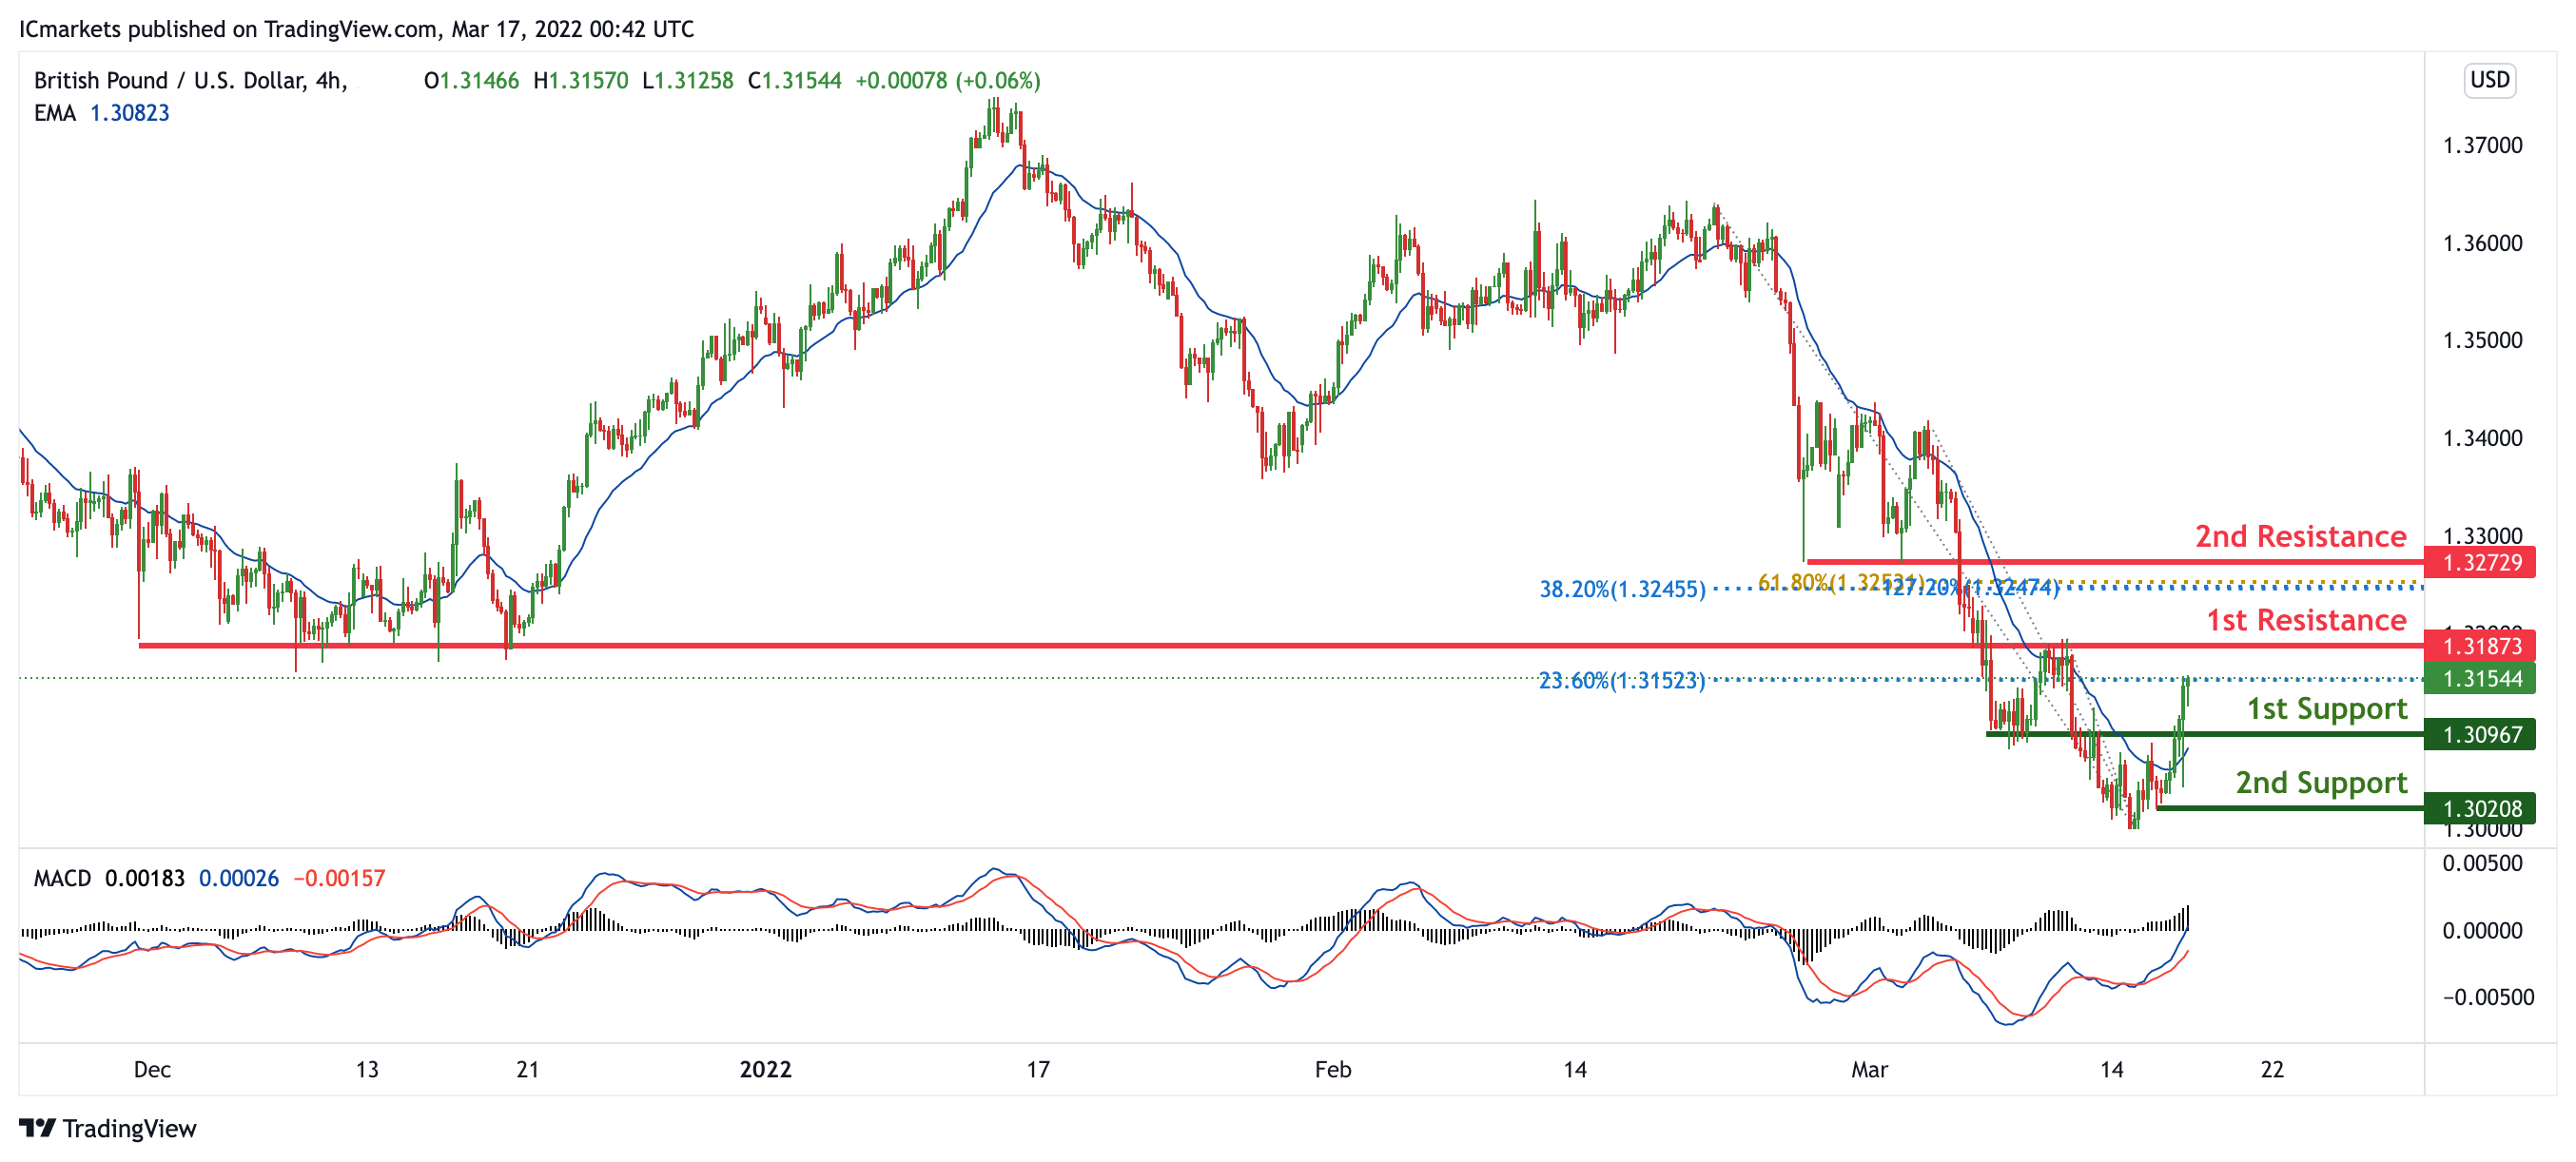
On the H4, prices are on bullish momentum. We see the potential for further bullish continuation from our 1st support at 1.30967 in line with 23.6% Fibonacci Retracement towards our 1st resistance at 1.32729 which is an area of Fibonacci confluences. Our bullish bias is supported by the MacD cross and also prices trading above our MA.
Areas of consideration
- H4 1st resistance at 1.32729
- H4 1st support at 1.30967
USD/CHF:
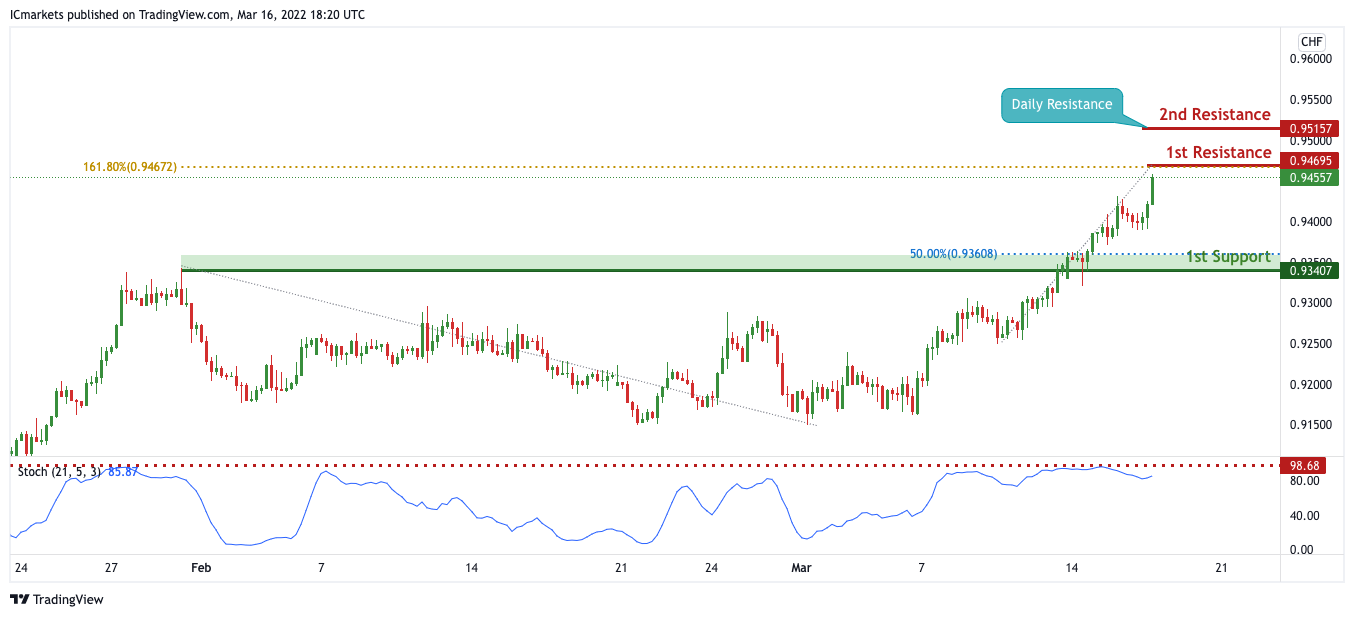
On the H4, with price expected to reverse off the stochastics indicator, we have a bias that price will drop from 1st resistance at 0.94695 in line with the 161.8% Fibonacci extension to 1st support at 0.93407 in line with the horizontal pullback support and 50% Fibonacci retracement .Alternatively, price may break 1st resistance structure and head for 2nd resistance at 0.95157 in line with the daily horizontal overlap resistance .
Areas of consideration
- 1st support level 0.93407
- 1st resistance 0.94695
EUR/USD :
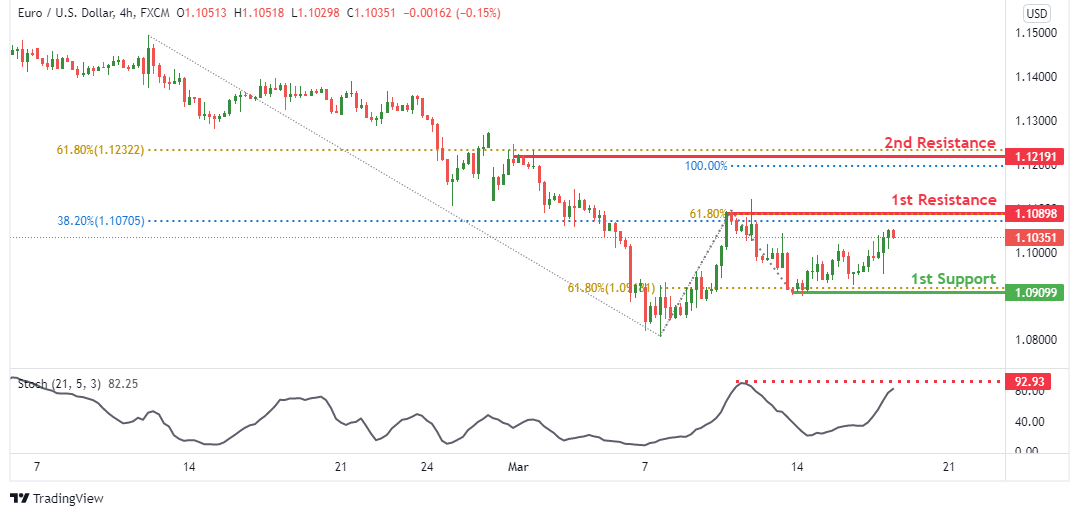
On the H4 price is near 1st resistance level of 1.10898 in line with 38.2% Fibonacci retracement and 61.8% Fibonacci projection. Price can potentially dip to the 1st support level of 1.09099 which is in line with 61.8% Fibonacci retracement. Our bearish bias is supported by the stochastic indicator as it is near resistance level.
Areas of consideration :
- H4 1st resistance at 1.10898
- H4 1st support at 1.09099
USD/JPY:
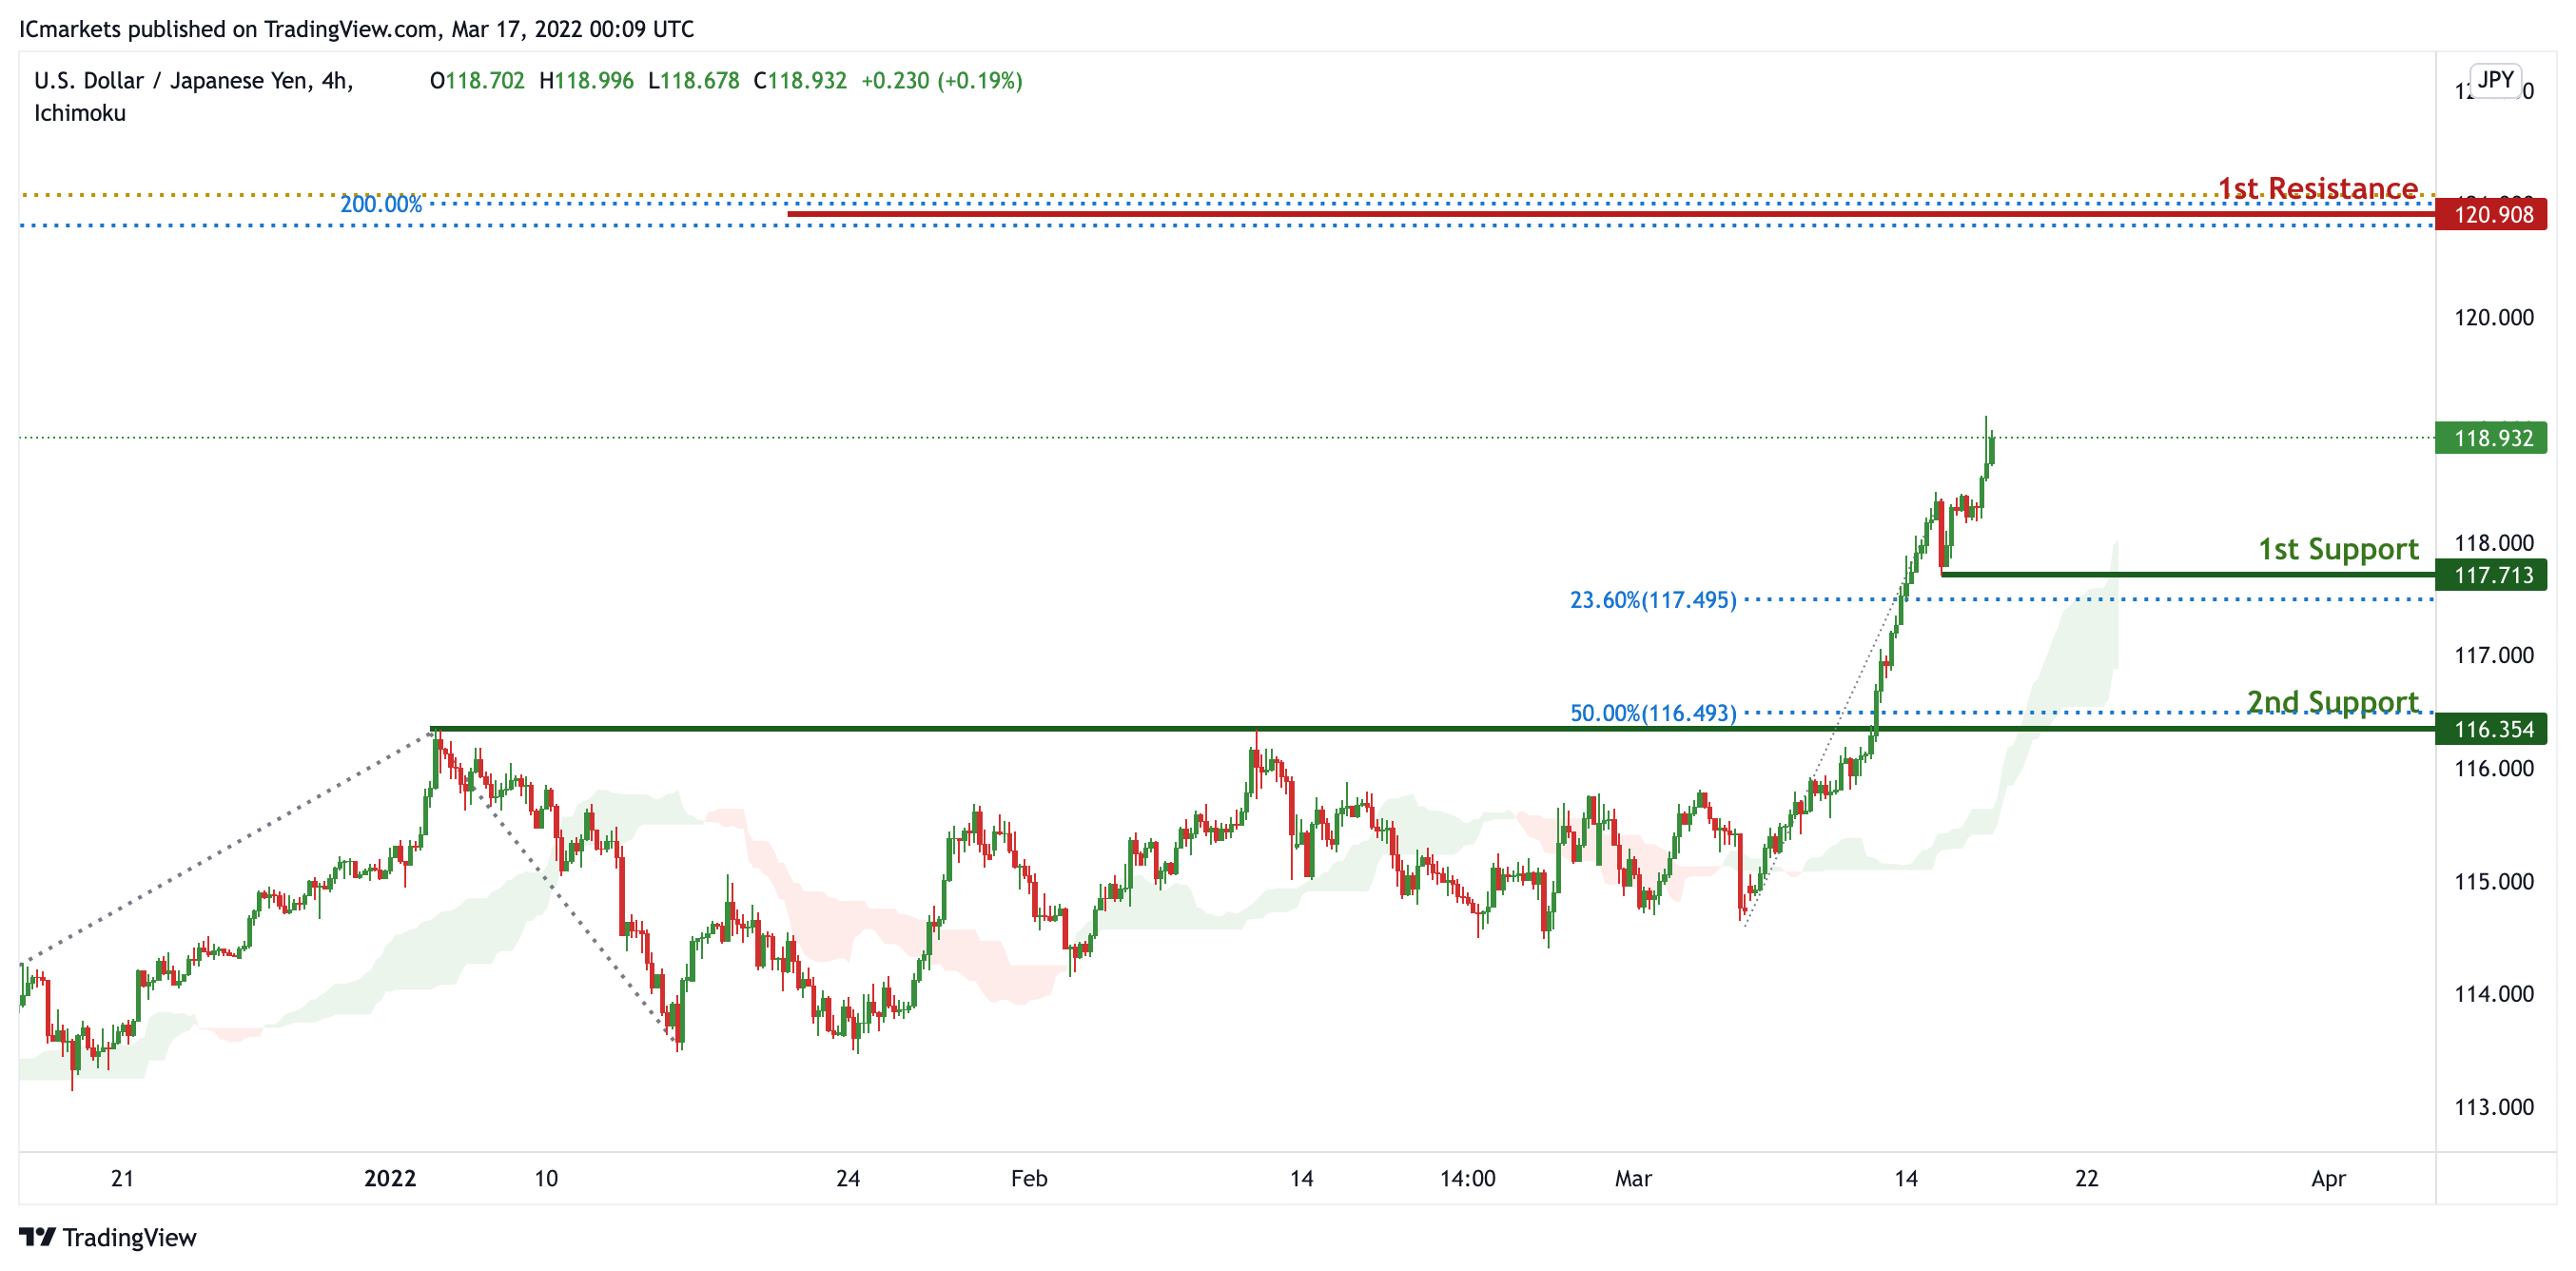
On the H4 timeframe prices are on bullish momentum. We see the potential for a further bullish continuation from our 1st support at 117.713 in line with 23.6% Fibonacci retracement towards our 1st resistance at 120.908 which is an area of Fibonacci confluences. Prices are trading above our ichimoku cloud support, further supporting our bullish bias.
Areas of consideration:
- H4 time frame, 1st resistance at 120.908
- H4 time frame, 1st support at 117.713
AUD/USD:
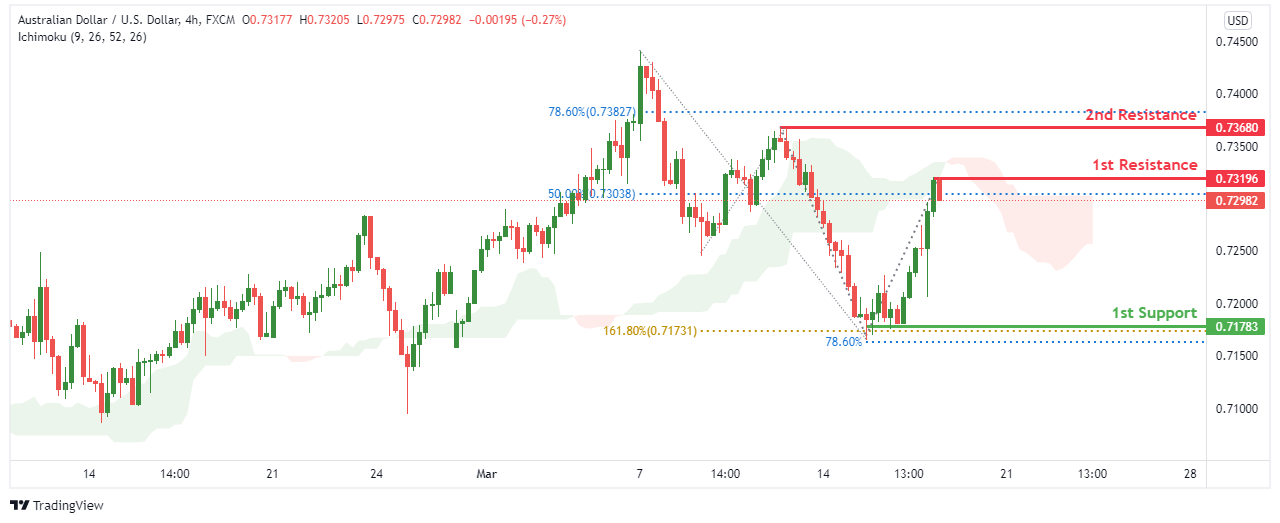
On the H4 chart, price is near the 1st resistance level of 0.73196 in line with 50% Fibonacci retracement. Price can potentially dip to the 1st support level of 0.71783 in line with 161.8% Fibonacci extension and 76.8% Fibonacci projection. Our bullish bias is further supported by price trading under the Ichimoku cloud indicator.
Areas of consideration
- H4 1st resistance at 0.73196
- H4 1st support at 0.71783
NZD/USD:
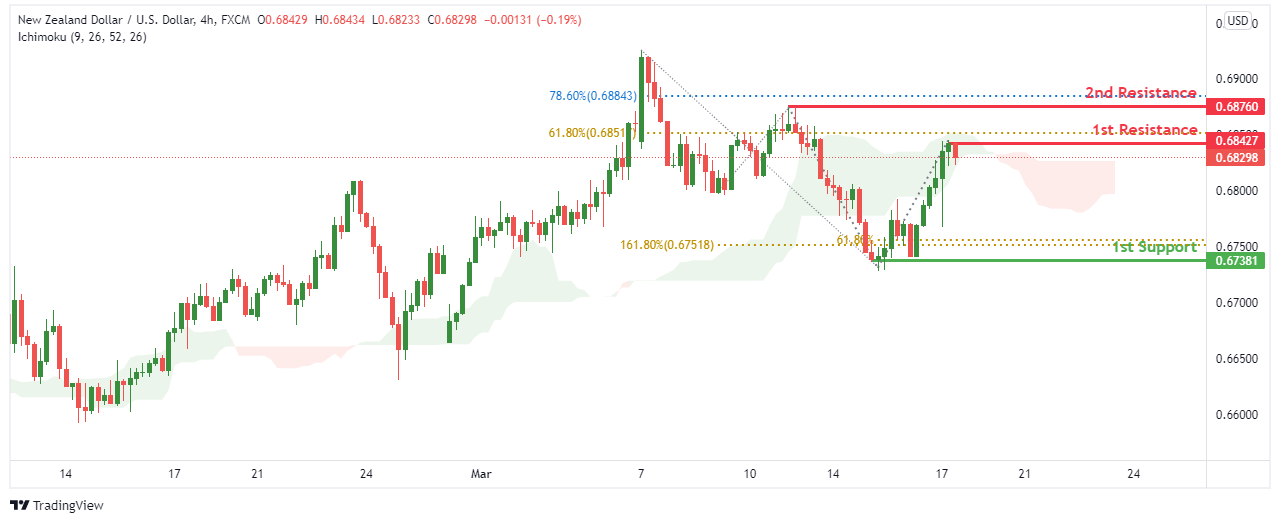
On the H4 chart, price is near the 1st resistance level of 0.68427 in line with 61.8% Fibonacci retracement. Price can potentially dip to the 1st support level of 0.67381 in line with 161.8% Fibonacci extension and 61.8% Fibonacci projection. Our bullish bias is further supported by price trading under the Ichimoku cloud indicator.
Areas of consideration :
- H4 1st resistance at 0.68427
- H4 1st support at 0.67381
USD/CAD:
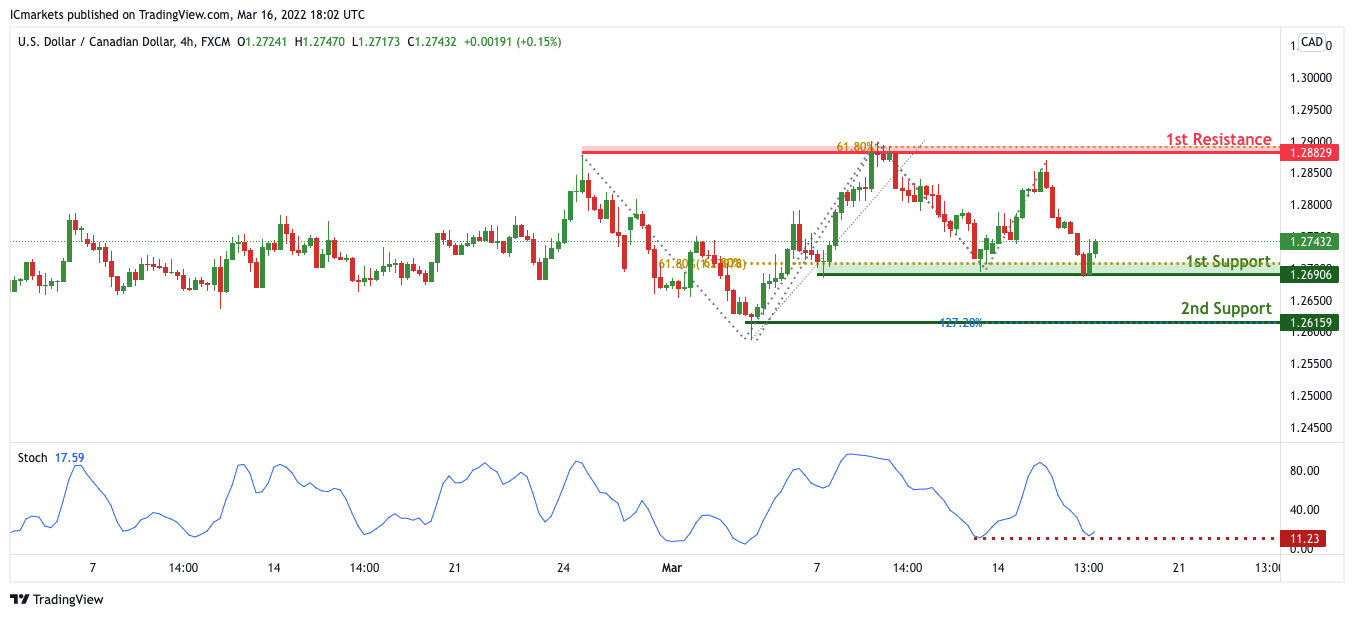
On the H4, with price expected to reverse off the stochastics indicator, we have a bias that price will rise to our 1st resistance at 1.28829 in line with the 61.8% Fibonacci projection from our 1st support at 1.26909 in line with the horizontal swing low support and 61.8% Fibonacci projection.Alternatively, price may break 1st support structure and head for 2nd support at 1.26159 in line with the 127.2% Fibonacci extension.
Areas of consideration:
- H4 time frame, 1st support at 1.26909
- H4 time frame, 1st resistance at 1.28829
OIL:
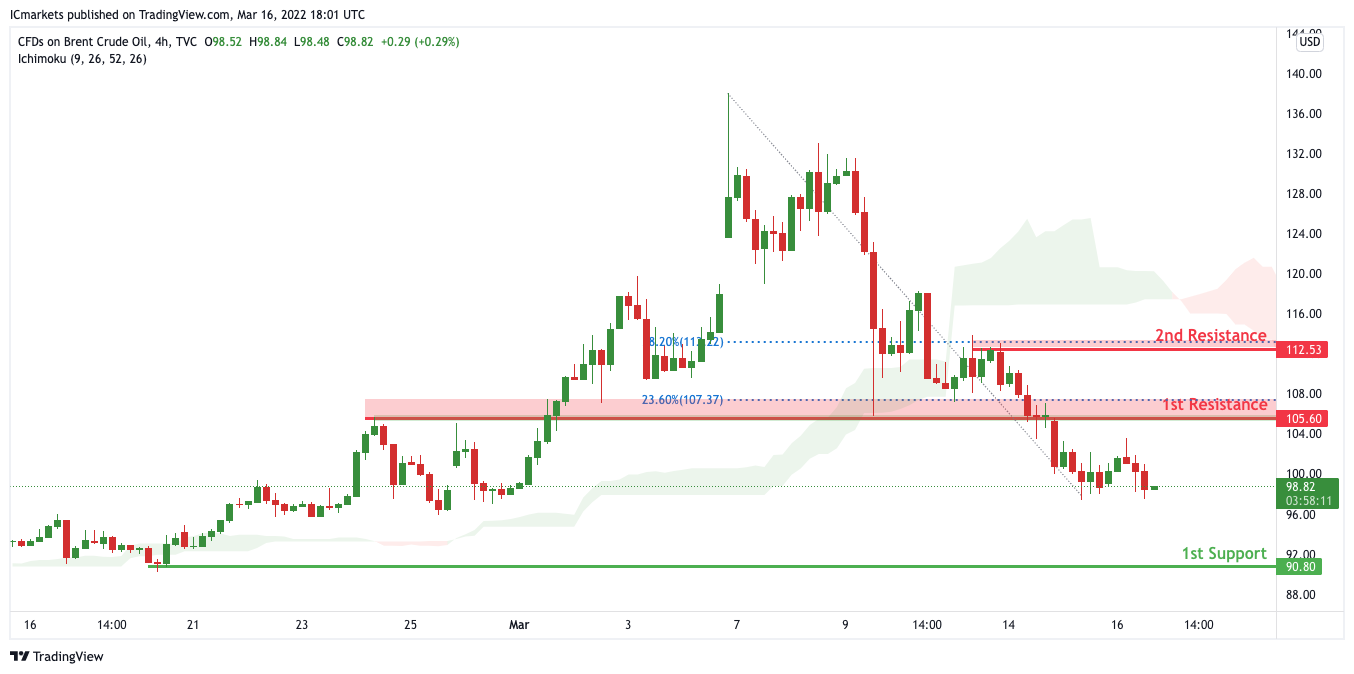
On the H4, with price moving below the ichimoku cloud, we have a bias that price will drop from 1st resistance at 105.6 in line with the horizontal overlap resistance to 1st support at 90.8 in line with the swing low support .Alternatively, price may break 1st resistance and head for 2nd resistance at 112.53 in line with the swing high resistance.
Areas of consideration:
- H4 time frame, 1st resistance of 90.8
- H4 time frame, 1st support of 90.8
Dow Jones Industrial Average:
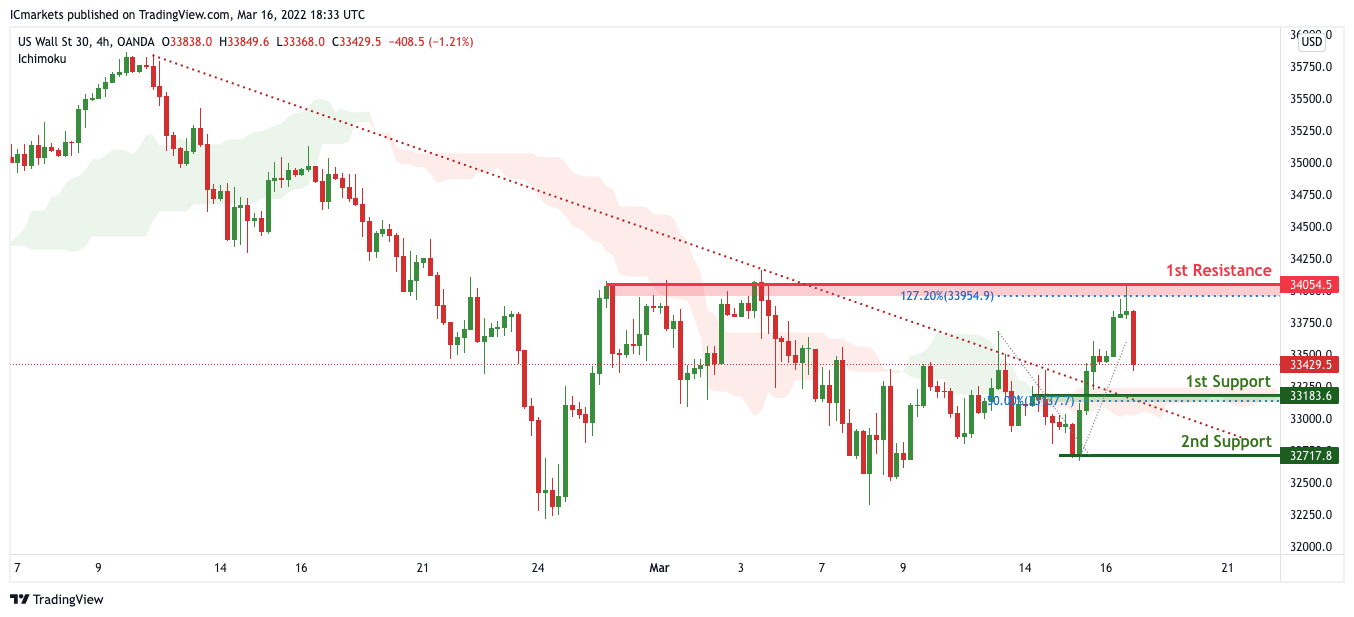
On the H4, with price moving above the ichimoku cloud, we have a bias that price will rise to 1st resistance at 34054 in line with the swing high resistance from 1st support at 33183 in line with the swing low support and 50% Fibonacci retracement. Alternatively, price may break 1st support and head for 2nd support at 32717 in line with the horizontal swing low support. Our bullish bias is further supported by how price broke the descending trendline and is expected to retest the trendline.
Areas of consideration :
- H4 1st support at 33183
- H4 1st resistance at 34054
Gold Price Trim Gains, $1,880 Is The Key
Key Highlights
- Gold price started a downside correction from the $2,070 high.
- It traded below a major bullish trend line with support near $1,950 on the 4-hours chart.
- EUR/USD must clear 1.1080 for a fresh increase, and GBP/USD is facing hurdle at 1.3150.
- The BoE Interest Rate Decision is scheduled today (forecast 0.75%, versus 0.50% previous).
Gold Price Technical Analysis
Gold price rallied to $2,070 before it faced sellers against the US Dollar. The price started a downside correction and traded below the $2,000 support.
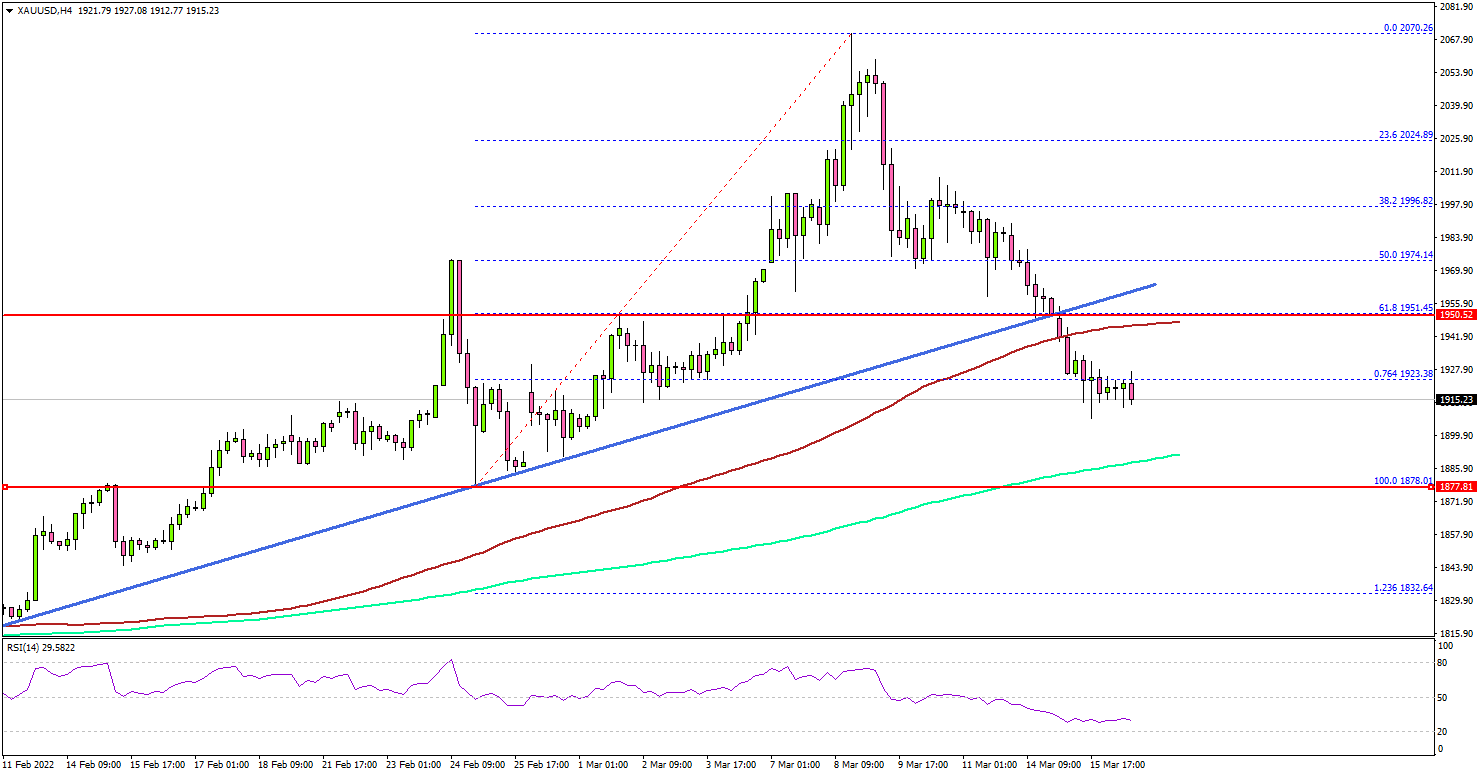
The 4-hours chart of XAU/USD indicates that the price failed to stay above the $1,980 and $1,950 support levels. There was also a break below a major bullish trend line with support near $1,950.
The price gained bearish momentum below the 50% Fib retracement level of the key upward move from the $1,878 swing low to $2,070 high. The price even traded below the $1,932 support level and the 100 simple moving average (red, 4-hours).
It struggled below the 76.4% Fib retracement level of the key upward move from the $1,878 swing low to $2,070 high. The next major support is near the $1,880 level and the 200 simple moving average (green, 4-hours).
If there is a downside break and close below $1,880, the price might decline towards the $1,835 support. On the upside, the price might face resistance near $1,940.
The next key resistance could be $1,950, above which the bulls might aim a test of the $1,980 resistance zone or even $2,000.
Looking at EUR/USD, the pair could attempt to clear the 1.1050 and 1.1080 resistance levels. Besides, GBP/USD could face a strong resistance near 1.3150.
Economic Releases to Watch Today
- BoE Interest Rate Decision - Forecast 0.75%, versus 0.50% previous.
- US Initial Jobless Claims - Forecast 220K, versus 227K previous.
- US Industrial Production March 2022 (MoM) – Forecast 0.5%, versus 1.4% previous.
Elliott Wave View: USDJPY Ending Wave 5 Soon
Short Term Elliott Wave View in USDJPY suggests the rally from March 05, 2022 low is unfolding as a 5 waves impulse. Up from March 05 low, wave 1 ended at 115.95 and pullback in wave 2 ended at 115.53. The 60 minutes chart below shows pair has turned higher again in wave 3. Internal subdivision of wave 3 is unfolding as another 5 waves in lesser degree. Up from wave 2, wave ((i)) ended at 116.196 and dips in wave ((ii)) ended at 115.78. Pair then resumes higher in wave ((iii)) towards 118.062 and pullback in wave ((iv)) ended at 117.800. Wave ((v)) higher ended at 118.451 which also completed wave 3.
Pair then did a pullback in wave 4 ending at 117.68 and bounce look to complete wave 5 and also wave (1). Near term, expect to complete wave (1) soon. Possible target for wave (1) can end at 119.34 – 11948 area and pullback should then find support in the sequence of 3, 7, or 11 swing as wave (2) for further upside in wave (3). The view is valid as far as pivot at 114.595 low stays intact,
USDJPY 60 Minutes Elliott Wave Char
t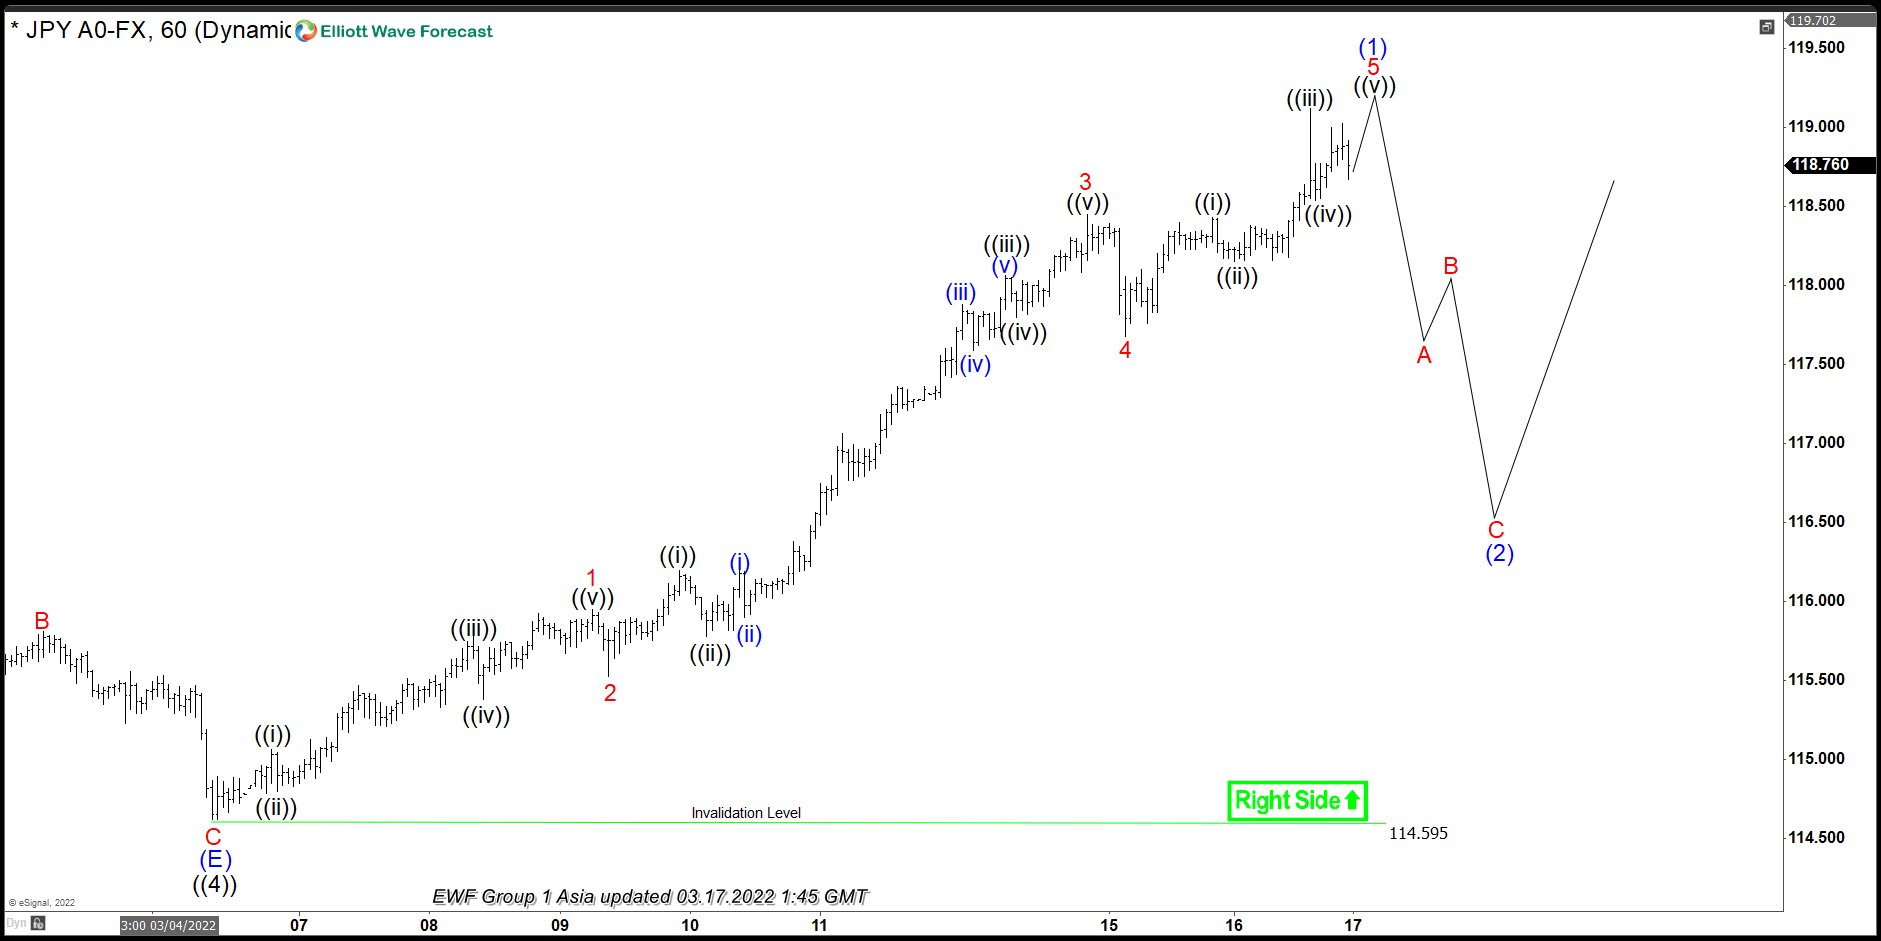
Gold Wave Analysis
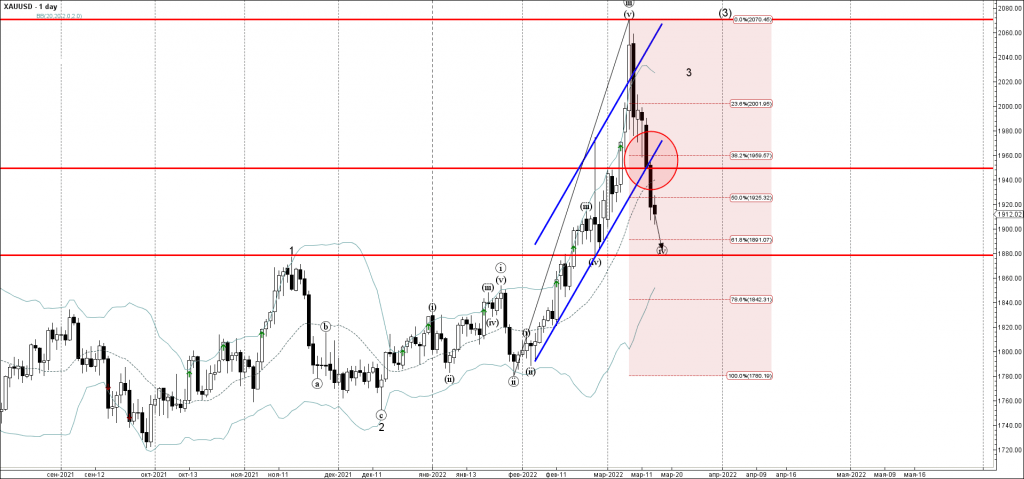
- Gold broke key support level 1950.00
- Likely to fall to support level 1880.00
Gold recently broke the key support level 1950.00, intersecting with the 38.2% Fibonacci correction of the upward impulse from January.
The breakout of the support level 1950.00 coincided with the breakout of the support trendline of the daily up channel from February – which accelerated the active correciton (iv).
Gold can be expected to fall further toward the next support level 1880.00 (target price for the active correciton (iv)).
Fed Still Behind the Curve Despite Signalling Six Further Rate Hikes
Key takeaways
- As expected, the Fed hiked the Fed funds target range by 25bp to 0.25-0.50%.
- The Fed says that it "anticipates ongoing increases in the target range will be appropriate". The median dots signal an additional six 25bp rate hikes this year (1.75-2.00% by year-end).
- Fed says the economic implications of the Russian invasion and Western sanctions are "highly uncertain" but "are likely to create additional upward pressure on inflation".
- Powell says that the US economy is strong enough to handle tighter monetary and financial conditions and more or less admitted that the Fed cannot take several factors into account when conducting monetary policy, as inflation is simply too high.
- Despite the rate hike, we are still of the view that the Fed is behind the curve and six additional 25bp rate hikes this year are probably not enough to curb inflation.
- We keep our Fed call unchanged, still expecting a total of 175bp rate hikes this year (25bp at each meeting but 50bp in June). We still expect an announcement on QT in May.
- FX: At present, we forecast EUR/USD in 1.08 in 12M and we see downside risks to this estimate, as the hiking cycle evolves further amid an economic slowdown which is set to hit European manufacturing relatively more negative.
Eco Data 3/17/22
[php_everywhere instance="1"]
Fed Chair Powell press conference live stream
https://www.youtube.com/watch?v=0y4j2hBuK9E
Fed hike 25bps, sees rate at 1.9% by end of 2022, 2.8% by end of 2023
Fed raised federal funds rate target by 25bps to 0.25-0.50% s widely expected. James Bullard dissented, and voted for a 50bps hike. Additionally, Fed expects to start reducing asset holdings "at a coming meeting".
In the updated dot plot, 12 of the FOMC participants expected federal funds rate to reach 1.75-2.00% by then end of 2022, that is, 1.50% above the current level.
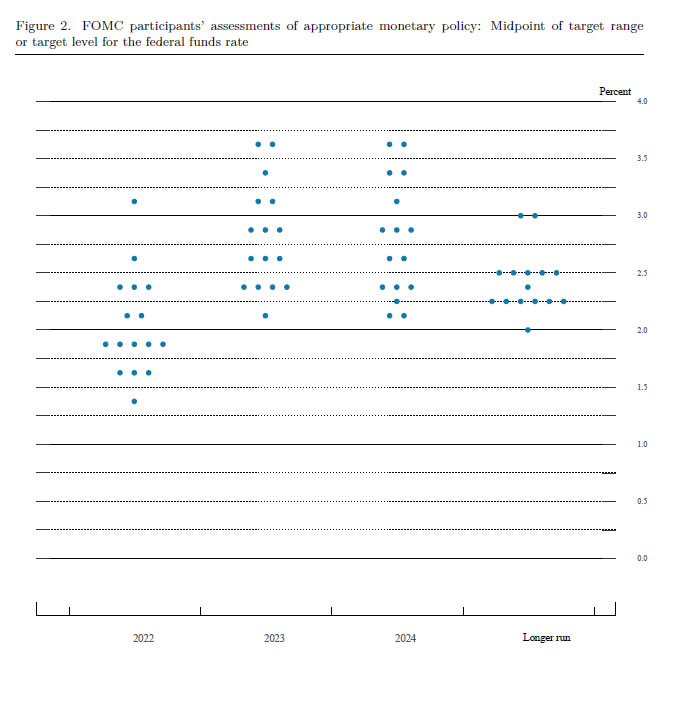
Fed has also significantly lowered 2022 GDP growth forecast, raised 2022 core inflation forecasts and federal funds rate forecasts. The end point of current tightening cycle was also raised from 2.1% to 2.8%, and pulled ahead to 2023.
New median projections - GDP growth
- 2022 real GDP growth was lowered from 4.0% to 2.8%.
- 2023 real GDP growth unchanged at 2.2%.
- 2024 real GDP growth unchanged at 2.0%.
- Longer run GDP growth unchanged at 1.8%.
Unemployment rate:
- 2022 unemployment rate unchanged at 3.5%.
- 2023 unemployment rate unchanged at 3.5%.
- 2024 unemployment rate raised from 3.5% to 3.6%.
- Longer run unemployment rate unchanged at 4.0%.
Core PCE:
- 2022 core PCE inflation raised from 2.7% to 4.1%.
- 2023 core PCE inflation raised from 2.3% to 2.7%.
- 2024 core PCE inflation raised from 2.1% to 2.3%.
Federal funds rate
- 2022 federal funds rate raised from 0.9% to 1.9%.
- 2023 federal funds rate raised from 1.6% to 2.8%.
- 2024 federal funds rate raised from 2.1% to 2.8%.
- Longer run federal funds rate lowered from 2.5% to 2.4%