

Sample Category Title
Gold Struggles above 1,900; Bearish-to-Neutral Bias in Short-Term
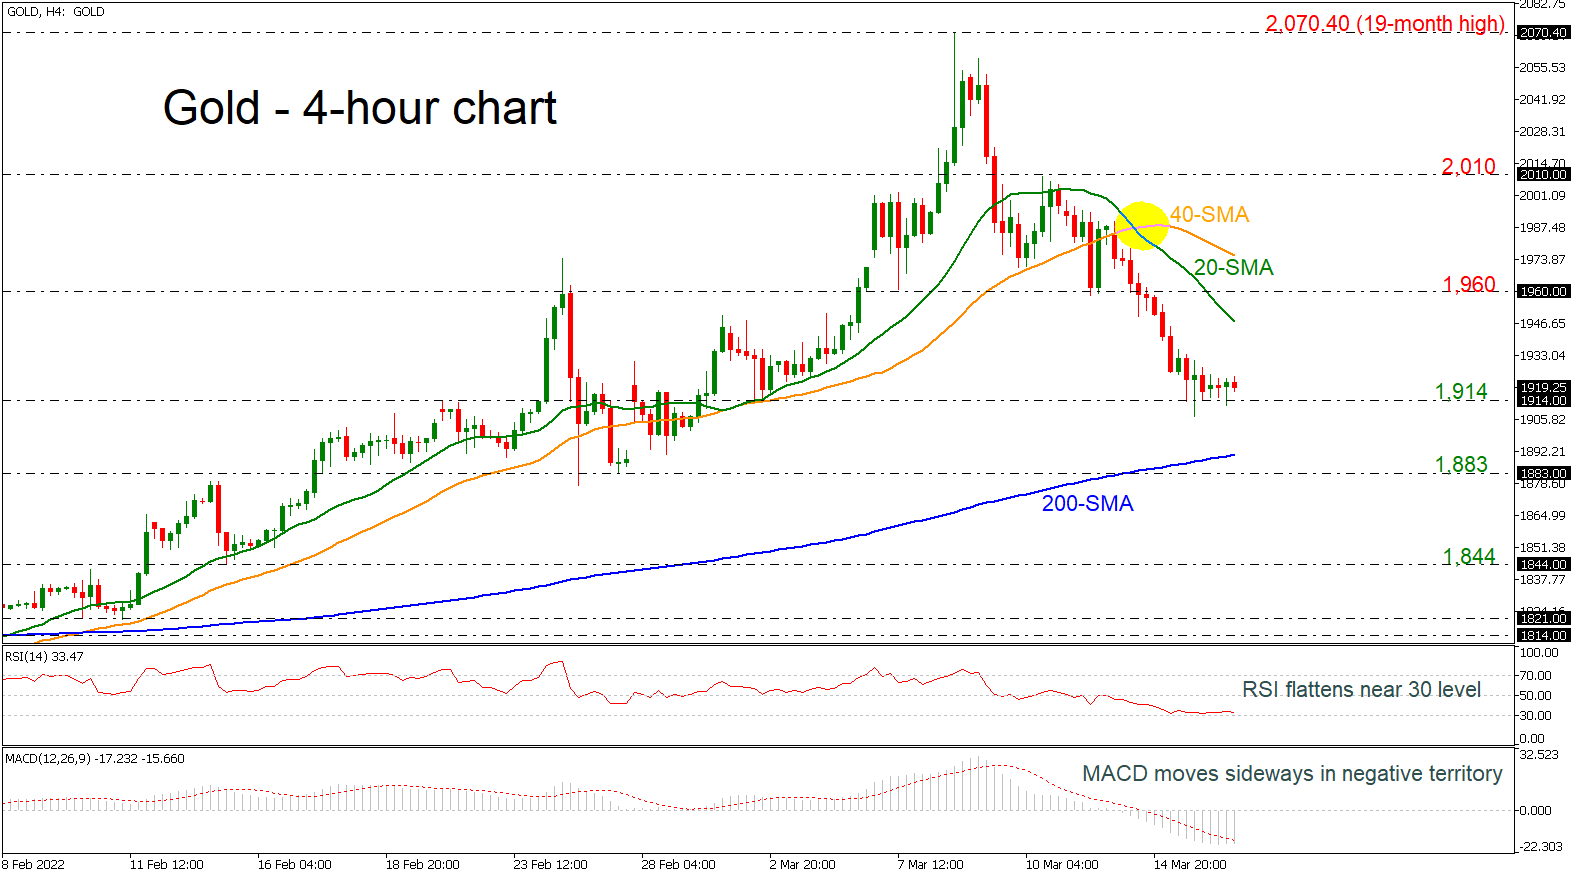
Gold prices are moving sideways after the aggressive selling interest from the 19-month peak of 2,070.40, returning back near the 1,900 mark. The RSI indicator is flattening around the oversold region, while the MACD is still developing with weak momentum in the negative area. In trend indicators, the 20- and 40-period simple moving averages (SMAs) posted a bearish crossover in the near-term.
Should the market extend losses, support could be met between the 200-period SMA at 1,890 and the 1,883 barrier. A significant leg below this area could sent prices towards the 1,844 hurdle.
On the flip side, if the pair bounces up, immediate resistance could be met at the 20-period SMA currently at 1,947 ahead of the 1,960 level. Above these lines, the 40-period SMA at 1,975 and the 2,010 key level may act as tuning points.
In the bigger picture, the price is bullish as long as it holds above the 200-period SMA. In case it violates this line, bears could take the upper hand.
USD/JPY Outlook: Bulls Slow on Approach to Key Barrier, Awaiting Fed’s Decision
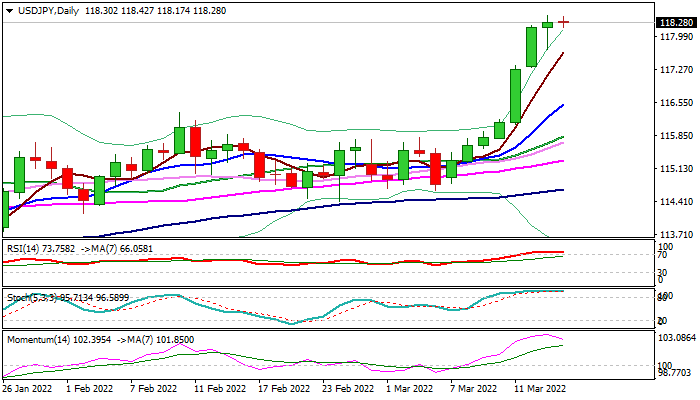
The USDJPY holds firm tone on approach to target at 118.66 (Dec 2016) although bulls slowed after strong rally last Fri/Mon, but Tuesday’s long-tailed daily candle suggests that strong bullish stance remains intact.
The dollar was lifted by expectations for Fed rate hike at today’s end of two-day policy meeting and also by safe-haven buying on uncertainty over the war in Ukraine..
Overbought daily studies warn of consolidation/correction before larger bulls resume, though the action will directly depend on Fed’s verdict.
Hawkish stance with 0.25% (possibly 0.5%) hike and signals of steady rate increases in coming months, would lift the dollar further.
Break of 118.66 pivot would expose Fibo barrier at 119.50 (76.4% of 125.84/98.99) and psychological 120.00 resistance.
Caution on more dovish comments from the US policymakers, as the central bank now faces strong concerns about the impact of the war in addition to the soaring inflation, that would deflate the greenback, in possible ‘buy the rumor – sell the fact’ scenario.
Initial supports lay at 117.70/50, while extension below 117 would harm bulls and signal deeper pullback.
Res: 118.45; 118.66; 119.00; 119.50.
Sup: 118.17; 117.70; 117.50; 116.90.
Buying Gold: Ugly Short-Term Deal, Promising for Long-Term
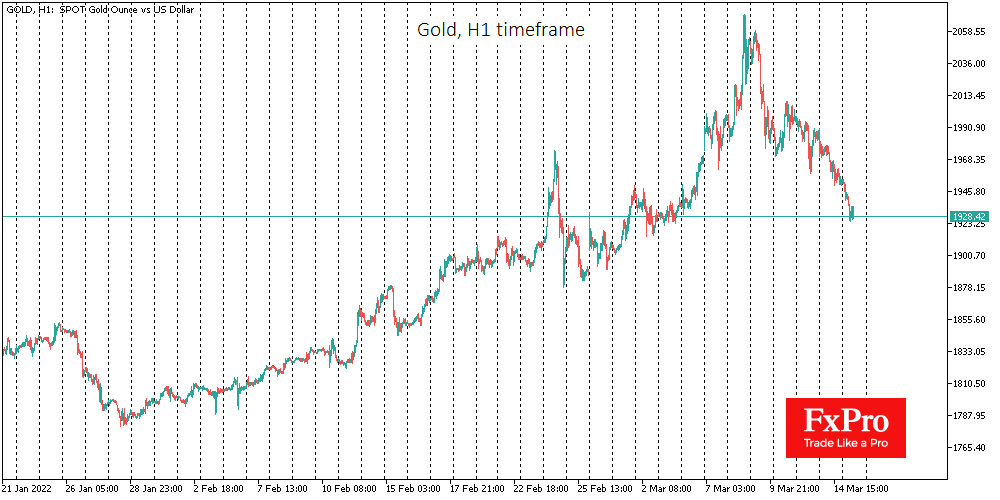
Gold loses another 1% on Tuesday, pulling back to $1933 and settling around $1920 on Wednesday morning. About one week ago, quotes were soaring towards $2070, but they have been in a steady downward trend since then. The short-term charts clearly show the even pressure crystallising since March 10th.
It may seem illogical that the gold price is down, pending reliable signs of military de-escalation. Rampant inflation should also contribute to the demand for Gold as protection against capital depreciation.
The answer to this question seems to be sought in the altered gold supply balance. Likely, the Bank of Russia is now actively selling Gold from its reserves, both domestically and using the remaining means to do so abroad.
In the short term, this creates an impressive market overhang, despite data confirming that exchange-traded funds have built up their holdings in the metal to a record.
If the current trend develops, the price of Gold could deflate into the $1850-1870 area, where it was before Russian troops entered Ukraine.
That said, buying Gold remains a prudent long-term strategy. Geopolitical instability forms the risks of a slowdown in the economy, which will deter the Fed and other major central banks from tightening policy. A 25-point rate hike is expected from the Fed this week, although the markets gave more than a 60% chance of a 50-point hike at once in the first weeks of the year. In the meantime, the current and expected price situation has only worsened, accelerating the actual depreciation of assets.
Looking ahead to the next few months, a very supportive environment remains for gold prices up to around $2,500. The marginal forecasts of a new round of gold growth are also becoming more evident, echoing the dynamic of the 1970s, as the energy and food markets are now in a very similar position. If this holds true, the price could soar several times in the next several years.
NZDUSD’s Minor Uptrend Prevails after Deflection Off 200-MA
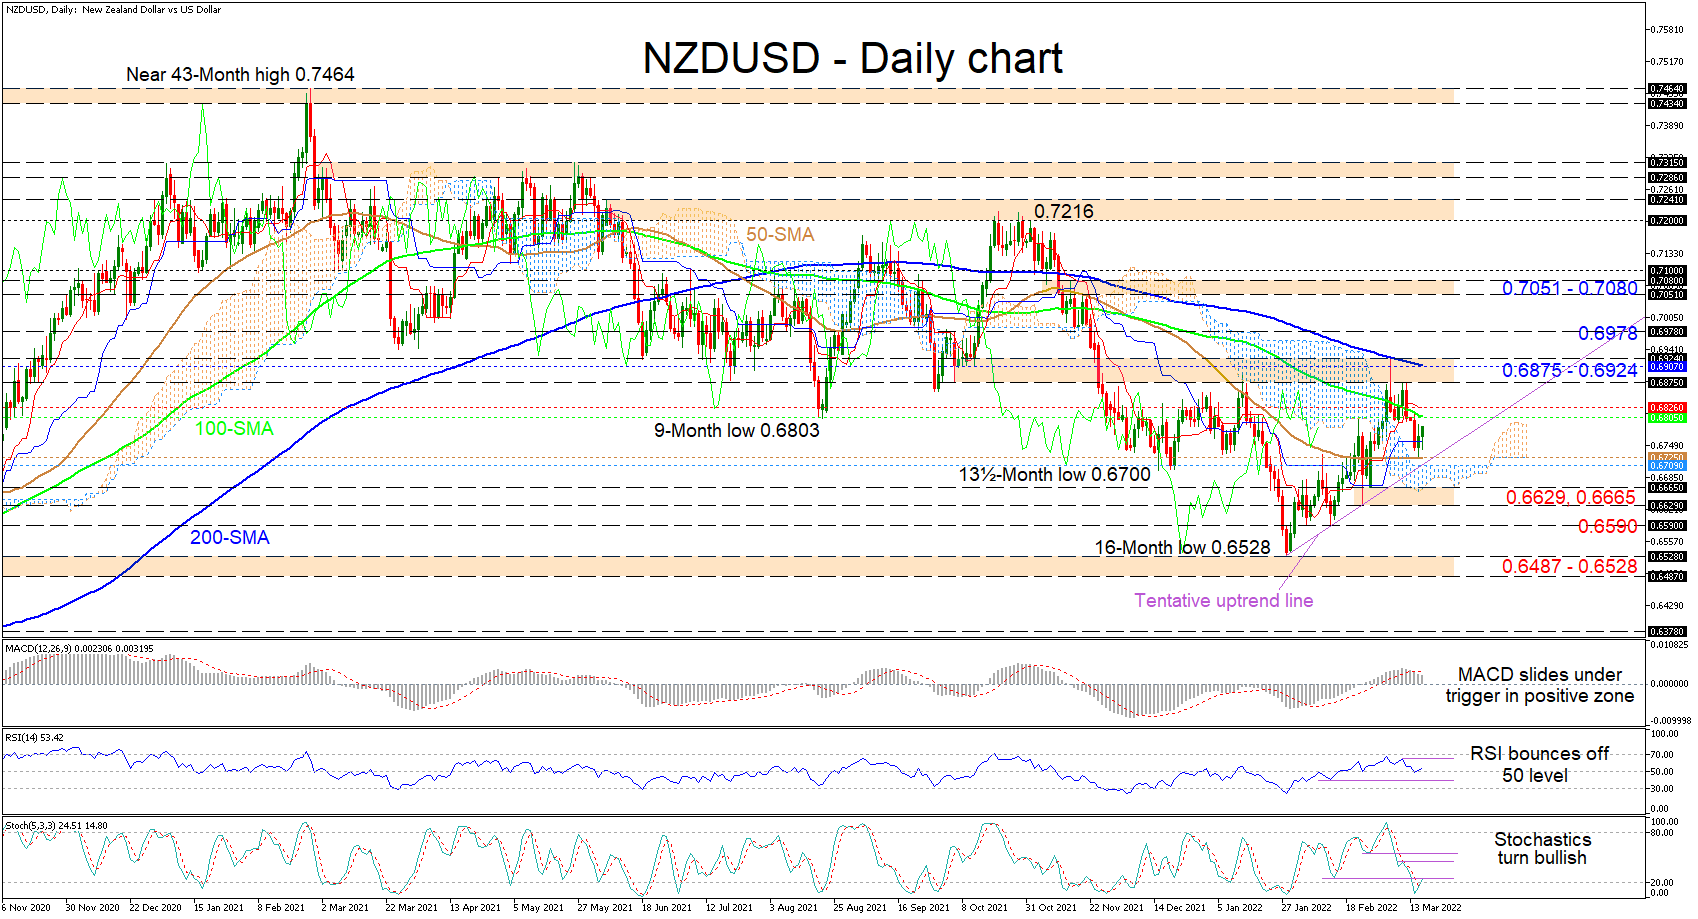
NZDUSD has generated positive traction off the 50-day simple moving average (SMA), which is bordering the tentative uptrend line pulled from the 16-month low of 0.6528. The longer-term 100- and 200-day SMAs are defending the broader bearish trend in the pair, while the flattened slope of the 50-day SMA, is hinting that the latest up wave remains active.
The Ichimoku lines are indicating a pause in bullish forces, while the short-term oscillators are transmitting mixed signals in directional momentum. The MACD is implying some easing in positive drive as it glides slightly beneath its red trigger line. Meanwhile, both the upward pointing RSI and the fresh bullish charge of the stochastic oscillator are promoting additional hikes in the pair.
If renewed positive impetus off the supporting 50-day SMA intensifies, preliminary resistance could emanate from the falling 100-day SMA at 0.6805 and the adjacent red Tenkan-sen line at 0.6826. Moving higher, the bulls may struggle to overpower the fortified 0.6875-0.6924 resistance section. However, if this boundary fails to keep buyers at bay, the 0.6978 inside swing low could come under fire before the bulls pursue the 0.7051-0.7080 resistance border and the 0.7100 handle overhead.
On the other hand, if the 100-day SMA at 0.6805 curbs additional gains in the pair, sellers could encounter a tough support zone existing between the 50-day SMA at 0.6725 and the Ichimoku cloud’s upper surface at 0.6709, which is overlapped by a tentative uptrend line drawn from the 0.6528 trough. The price journey downwards is a congested one and even if the bears successfully dive below the cloud, they will need to also breach the adjoining support area between the 0.6665 and 0.6629 lows for negative developments to gain an advantage. A deeper price retracement that overruns the 0.6590 barrier too could shift traders’ focus towards the 0.6487-0.6528 support base that extends back to mid-July 2020.
Summarizing, NZDUSD may preserve its positive tone should the price persist above the 50-day SMA, the diagonal support and the Ichimoku cloud. Piloting above the 0.6875-0.6924 resistance obstacle could reinforce the bullish bearing of the pair, while a retreat below the 0.6629 low could hint that negative pressures are ramping up again.
EUR/USD Outlook: Euro Remains Constructive and Re-tests 1.10 Barrier ahead of Fed Policy Decision
The Euro remains bid in European trading on Wednesday and cracks 1.10 barrier, where the action faced strong headwinds past two days.
Hopes for a breakthrough in peace talks between Russia and Ukraine keep slight risk mode in play, however, all eyes are on today’s Fed policy decision, with markets fully pricing for a first interest rate raise in three years.
The central bank is widely expected to increase interest rates by 0.25%, but there are chances for 0.5% hike, in attempt to tackle soaring inflation.
The dollar is expected to benefit from rate hike, however, traders will be focusing on signals about Fed’s next steps and strength of that message would give more hints about greenback’s short-term direction.
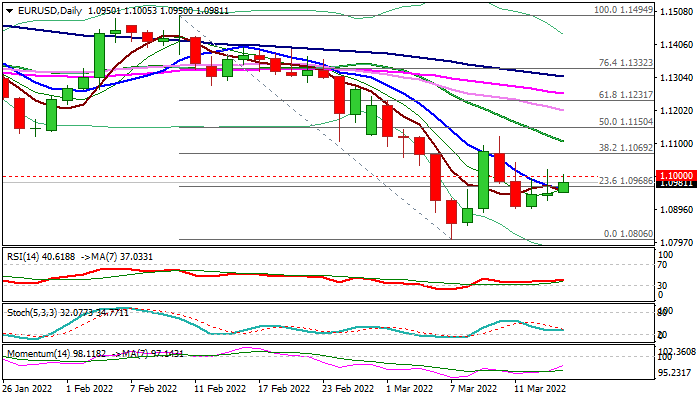
Daily studies are in bearish setup and warn about limited recovery before larger bears resume, with failure to clear 1.10 pivot to keep the downside under pressure and risk test of first pivot at 1.0900 (Mar 14 trough) and expose key level at 1.0803 (Mar 7 low), loss of which would signal bearish continuation.
Conversely, break of 1.10 would ease immediate downside risk, but bulls need to register a clear break of cracked Fibo barrier at 1.1069 (38.2% of 1.1494/1.0806) and extension above recovery top at 1.1121 (Mar 10 spike high) to signal reversal.
Res: 1.1000; 1.1020; 1.1043; 1.1069.
Sup: 1.0950; 1.0900; 1.0848; 1.0806.
Gold Report: Market Braces for FOMC Interest Rate Decision
A notable correction to the downside has captured Gold’s price in the most recent daily sessions. At the moment, Gold is trading below the $2000 round level, after performing a swift run to the new 2022 high price in the past week. The large swing for Gold’s price seems to imply a drastic change in economic developments around the world and this report aims at bringing these factors to light. Leaving aside the fundamental updates presented in this outlook, our Gold report can also be used as a guidance to trading through our technical analysis, which will point out important levels and possible trends.
The fact that Gold has made a substantial correction to lower grounds, can be attributed to several reasons. First Gold’s price rushed to a new 2022 high on the 8th of March as sanctions against Russia where announced. In this case the risk on sentiment which sometimes fuels Gold’s price may have been removed. It is also possible that Gold may have been undertaken by a technical correction, as traders that joined the bullish side of Gold early in March, may have booked significant profits allowing them to lock in the gains. Furthermore, in the past sessions the U.S. 10-year Treasury yields rose above 2.10% a sign which maybe considered bearish for Gold prices. Another bearish sign for Gold could be its adverse relationship to the US dollar. In the previous report we noted the correlation between Gold and the USD may have been positive but as the greenback stabilized higher in the past days, Gold prices dropped confirming the competitive nature is back on track. In addition, Gold could be in a positive correlation with Oil prices at this time, as Oil is trading notably lower compared to last week.
In the current week, Gold traders are in the favorable position to have an exciting economic calendar to work with. The events are spread throughout the next days and may create substantial volatility for Gold’s price. Starting on the 16th of March, during the early US session, we get the US February Retail Sales rate while later the same day, we expect the key economic event of the week which is the FOMC meeting. This event is of great importance for the Gold market as the central bank is expected to announce a rate hike of 25 basis points. On a side note, FFF currently imply a probability of 91% for a 25-basis points rate hike, while the remaining 9% is in favor of a 50-basis points rate hike. In this case the actual outcome of the meeting could create different price reaction. Even though a 25-basis points rate hike may have already been priced in by the market, in our view, a 50-basis points rate hike could create an extraordinary volatile session for the markets. This will be the first time the Fed will hike rates since December 2018. The event will take place during the mid US session and will consist of the Economic Projections, the FOMC Statement and the FOMC Interest Rate decision. 30 minutes after the release we will also get the FOMC press conference with Chairman Jerome Powell’s speech where he will also be replying to questions. This event has the potential of moving Gold prices abruptly and traders may have to approach the market with caution as risks could be elevated. On the 17th of March we get from the US the weekly Initial Jobless Claims, the February Housing Starts Number the February Industrial Production rate and the March Philly Fed Business Index. Finally, on the 18th of March, we get the US Existing Home Sales for February.
Moreover, traders are also considering action carried out by other major central banks in the world. At this point it could be useful to note the fact that BOE is expected to impose a rate hike on the 17th of March. Additionally, during the past week the ECB announced a faster than expected reduction of its Asset purchase programme (APP). These actions could be signaling a post pandemic economic transitioning period for some of the major economies of the world and some of Gold’s recent price action may have been a result of these changes.
On a separate note, Gold traders continue to monitor developments of Russia’s war in Ukraine. Even though no signs of progress to cease fire have been made, Gold’s price has returned to lower grounds and may not reflect the fact that Russia’s military operations seem to have intensified recently.
Technical Analysis
XAU/USD H4
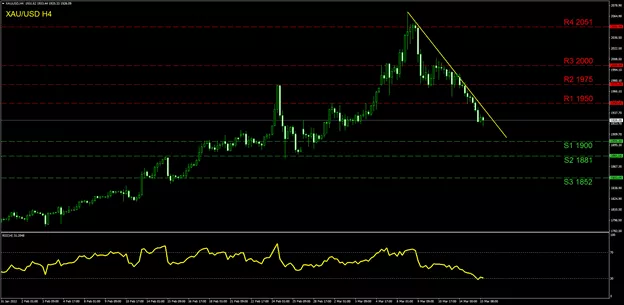
Gold’s downward trendline has intensified in the most recent four-hour sessions and the trend is highlighted with the yellow descending line on our chart. At the moment Gold is trading at 1925 which is exactly in the middle of our range between the (R1) 1950 resistance and the (S1) 1900 support. Yet if the downward movement persists, the (S1) 1900 could be engaged and tested. In this scenario, traders may turn their attention to even lower ground picturing the (S2) 1881 line which was approached briefly in the last days of February. At the end the (S3) 1852 is noted as our final support. In the opposite scenario if Gold regains upward momentum, we may see the (R1) 1950 line being targeted. Higher the (R2) 1975 level which has been the February high level is imminent while even higher the (R3) 2000 line may act as a barometer for the bullish trend. For this analysis we have selected to insert also the (R4) 2051 which is also the 2022 high reached in the past week. Currently, Gold remains in a downward trendline yet if the price action continues to move withing the (R2) and (S1) range we may see a sideways motion forming. The RSI indicator is currently testing the 30 level giving the notion for a bearish sentiment.
Crude Oil Price Retreats as China Concerns Remain
The price of crude oil continued its downward trend as investors focused on the sweeping lockdowns announced in China. In the past few days, the number of Covid-19 cases in some Chinese cases has been in a strong upward trend. They have risen to the highest level in about two years. In response, the government has announced a major lockdown that is affecting over 50 million people. Therefore, analysts believe that this lockdown will lead to slower recovery of demand. Brent dropped below $100 for the first time in two weeks while West Texas Intermediate (WTI) moved below $95. Other commodities like gold and silver also plummeted.
The US dollar index retreated in the overnight session as investors refocused on the upcoming interest rate decision by the Federal Reserve. It comes at a time when the US is facing significant inflationary pressure. For example, the headline consumer inflation has jumped to a 40 year high of 7.9% while the producer price index rose to 10%. The unemployment rate has dropped to 3.8%. Therefore, the Fed’s challenge is on how quickly to raise interest rates without affecting the economic recovery. In a recent statement, Jerome Powell hinted that the bank would start with a 0.25% hike.
The economic calendar will have several important events. The US will publish the latest retail sales numbers which will provide more details about the financial health of the American consumer. Analysts expect the data to show that the country’s retail sales rose by 0.4% from the previous 4.8%. They also expect that the core retail sales fell from 3.3% to 0.9%. Meanwhile, the Energy Information Administration (EIA) will publish the latest inventories data. Statistics Canada will release February’s inflation data.
XBRUSD
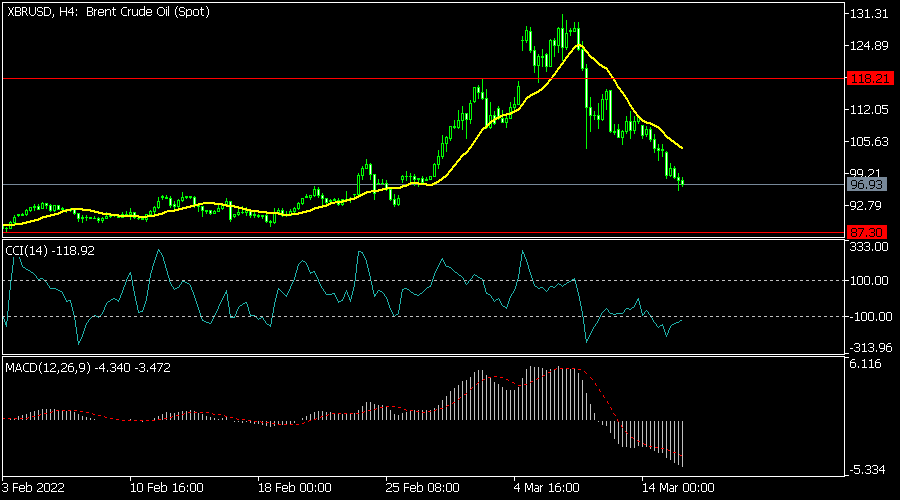
The XBRUSD pair declined sharply as concerns about demand rose. It dropped to a low of 96.75, which was the lowest level since February 28th. It is also significantly lower than this month’s high of 131.35. On the four-hour chart, the pair moved below the 25-day and 50-day moving averages while the Commodity Channel Index (CCI) and MACD have kept falling. Therefore, the pair will likely have a relief rally on Wednesday.
EURUSD
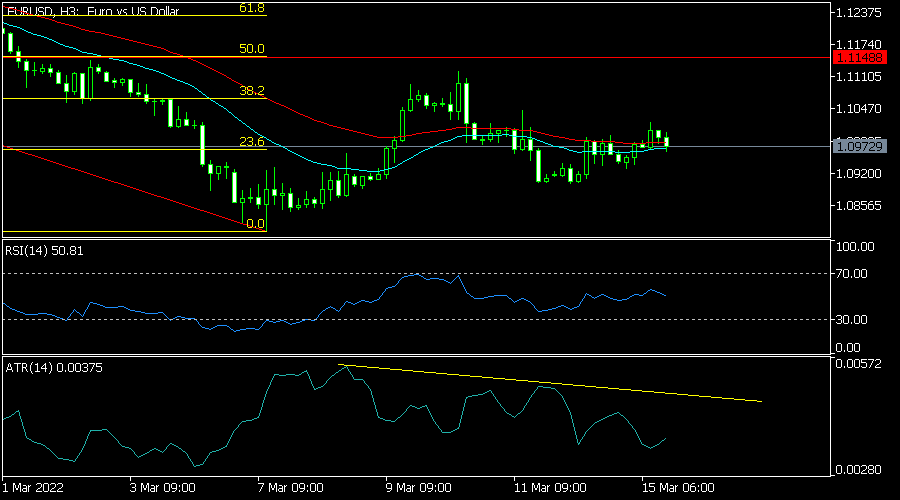
The EURUSD pair moved sideways ahead of the Fed decision. It is trading at 1.0970, which is along the 23.6% Fibonacci retracement level on the three-hour chart. The pair has moved to the 25-day moving average while the Relative Strength Index (RSI) has moved to the neutral level of 50. The Average True Range (ATR) has also been in a downward trend. Therefore, the pair will likely remain in this range ahead of the FOMC decision.
XAGUSD
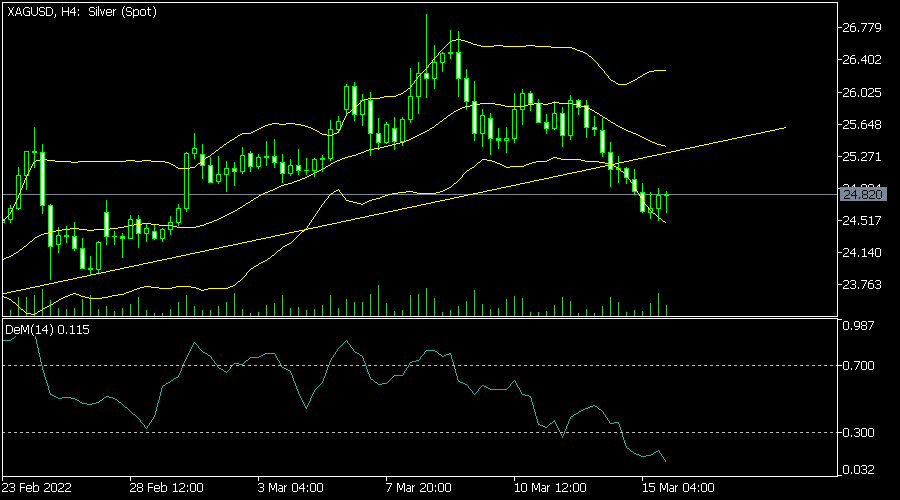
The XAGUSD pair has been in a bearish trend in the past few days. It is trading at 24.81, which is slightly above this week’s low of 24.50. On the four-hour chart, it has moved below the ascending trendline that is shown in yellow. It has also moved between the lower and middle lines of the Bollinger Bands while the DeMarker indicator has moved below the oversold level. Therefore, the pair will likely keep falling ahead of the Fed decision.
USDJPY Challenges the More than 5-Year Peak Again
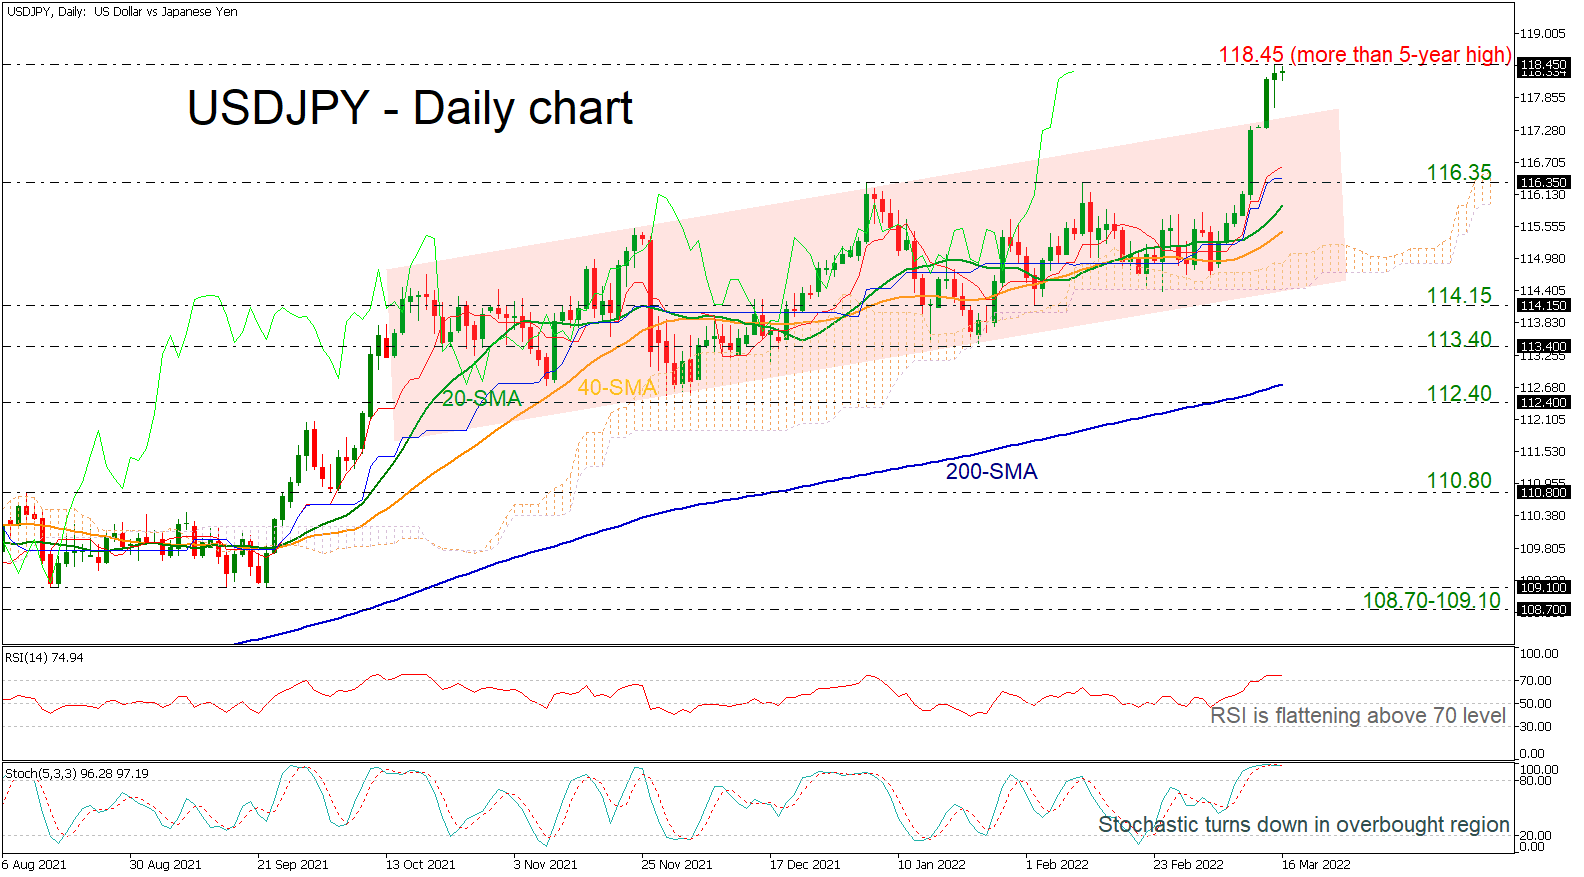
USDJPY is heading north towards the more-than-five-year high of 118.45 and any advances beyond this top would endorse the long-term bullish outlook. The pair penetrated the ascending channel to the upside; however, the technical indicators are suggesting an overbought market. The RSI is flattening above the 70 region, while the stochastic is turning lower in the overstretched region.
Should the pair manage to strengthen its positive momentum, the next resistance could come around the 124.00 psychological mark, taken from the high in November 2015. A break above it would shift the bias to a more bullish one and open the way towards the 125.40 resistance, registered in August 2015.
However, if prices are unable to break the multi-year high the risk would shift to the downside, with the 116.35 support coming into focus. A drop below the short-term simple moving averages (SMAs) would signal a bearish correction towards 114.15 and 113.40.
All in all, USDJPY has been in a strong upside rally over the last few days and only a decline below the 20- and 40-day SMAs may change the short-term bias to neutral.
Daily Technical Analysis
EUR/USD
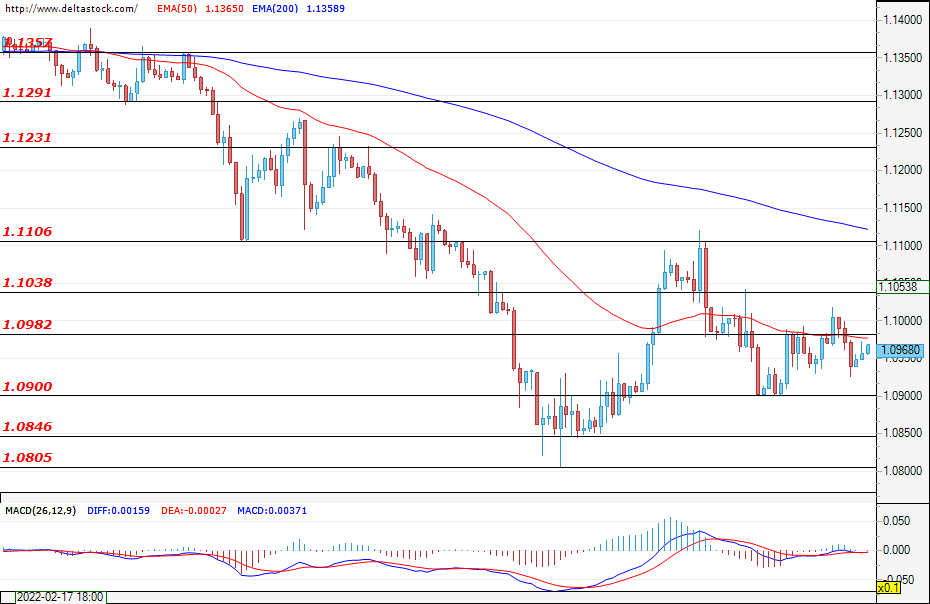
The bulls did not manage to gain enough momentum to confirm the breach of the resistance at 1.0982 and the EUR/USD continued to trade under the mentioned zone. A new successful attack, followed by a violation of the target at 1.1038, could continue the recovery and easily pave the way for a test of the important resistance at 1.1106. The first support for the bears can be found at the level of 1.0900. A breach of the lower zone at 1.0846 could lead to some losses for the euro against the dollar and strengthen the negative expectations for the future path of the pair. The most important news for investors is the expected Fed Interest Rate decision (today; 18:00 GMT) and the following press-conference at 18:30 GMT.
USD/JPY
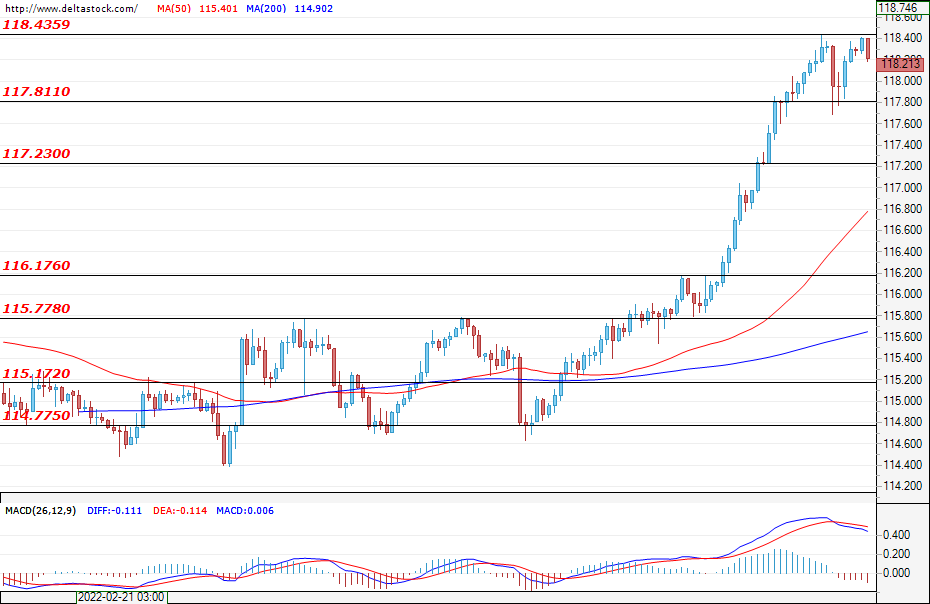
The correction was limited to the zone at 117.80, and during the early hours of today`s trading, the currency pair is heading for a new test of the resistance at 118.43. A successful breach for the bulls could lead to future gains for the Ninja and could further fuel the rally towards the levels at around 118.60. If the bullish momentum fades and the bears enter the market and violate the zone at 117.81, then the decline could deepen towards the support level at 117.23.
GBP/USD
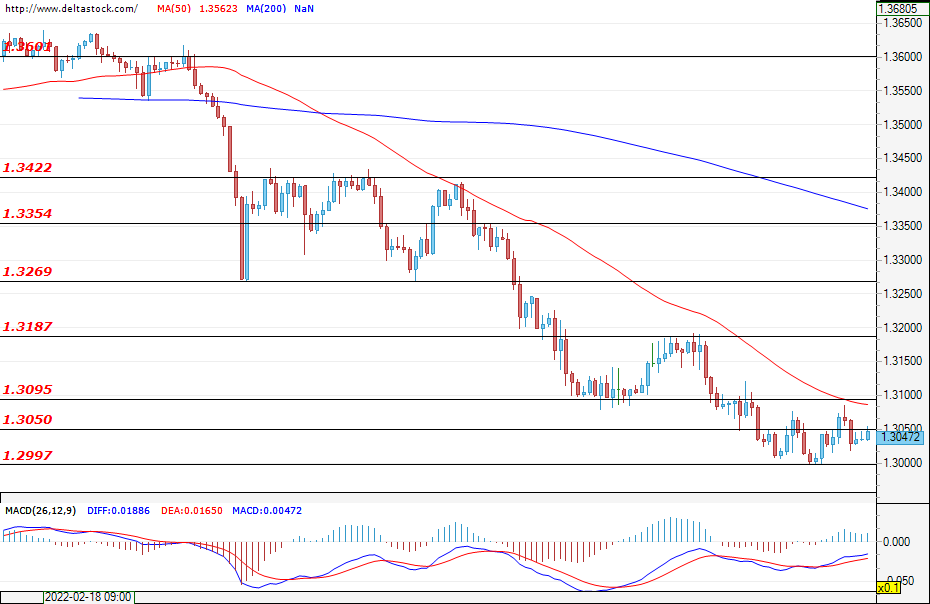
Neither the bears, nor the bulls managed to gain enough momentum and trading for the Cable remained locked in the zone between 1.2997 and 1.3050. A breach of the upper border, followed by a violation of the next target at 1.3095, could lead to a recovery and a move towards the major resistance at 1.3187. If the bears take control, then a breach of the support zone at 1.2997 could deepen the sell-off and could easily lead to new future losses for the sterling against the greenback.
EUGERMANY40
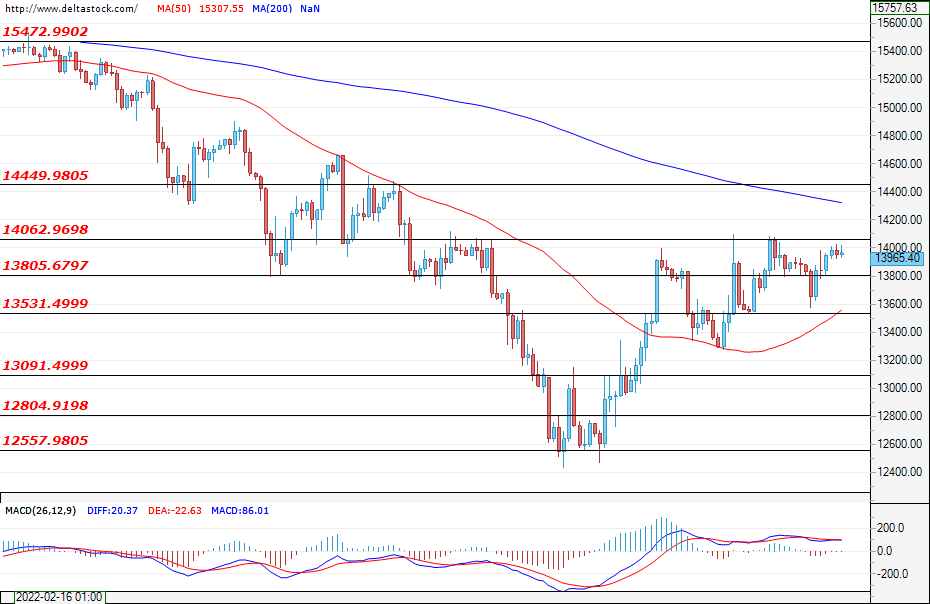
The German index recovered its recent losses from the beginning of the week, and at the time of writing, the price is hovering just below the resistance at 14062. A successful attack on the aforementioned resistance could easily lead to a test of the zone at 14449 and strengthen the positive expectations for the future path of the EUGERMANY40. The first support is the level at 13805. During today's session, the correlation with the U.S. indices will be quite high as all eyes will be on Jerome Powell and the future of the Fed’s monetary policy.
US30
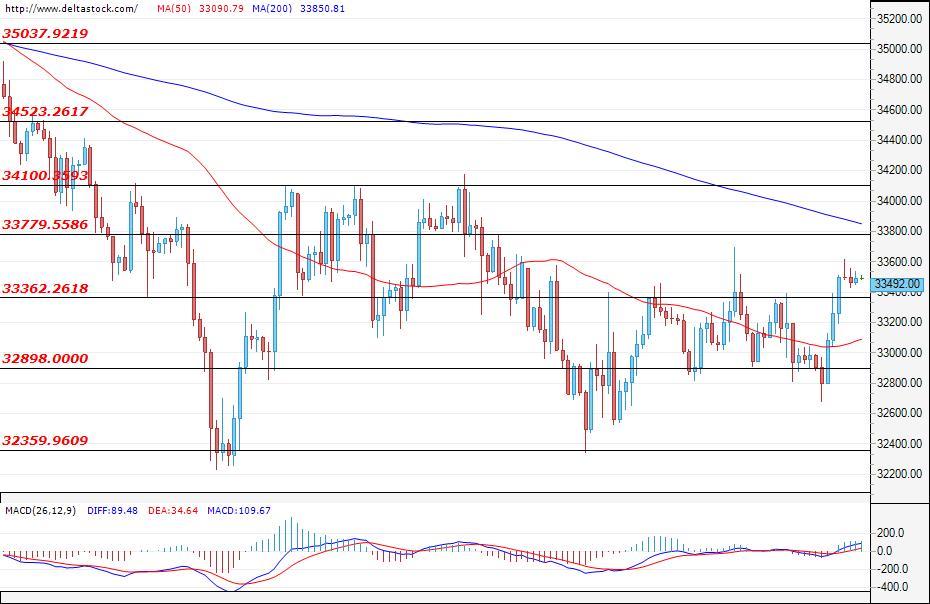
The bulls managed to prevail and breach the resistance zone at 33362. During the early hours of today`s trading, the price is holding positions above the mentioned level, and if the bullish attack continues, then the expectations would be for a test of the next target at 33379. If the mentioned level does not hold, then the recovery will most likely continue towards the resistance zone at 34100. If the bears re-enter the market, then their first target would be the zone at 33362, which is now acting as a support, followed by the lower level at 32898. Today, an increase in market volatility can be expected around the announcement of the Fed Interest Rate Decision (18:00 GMT), as well as during the following FOMC Press conference (18:30 GMT).
Dollar Can Take the Upper Hand Short Term
Markets
US stock markets had a better run yesterday with main indices closing up to 3% higher. Support in the Nasdaq at 12552 (38% retracement on 2020-2021 post-Covid-rally) held for a second time, but the technical picture obviously doesn’t improve yet. We hold our view that 2022 will be tough year for riskier assets as they’ll have to stomach a hawkish Fed in reaction to/on top of surging costs. Core bonds stabilized/recovered somewhat after this month’s heavy beating with some investors locking in profits ahead of tonight’s verdict. Daily changes on the US yield curve range between -1.1 bp (2-yr) and +1.1 bp (10-yr). The German yield curve bull flattened with yields sliding 7.2 bps (2-yr) to 1.9 bps (30-yr). The euro didn’t really mind the relative loss of interest rate support with EUR/USD and EUR/GBP closing broadly flat at respectively 1.0956 and 0.8399.
The Fed will start its interest rate tightening cycle tonight by delivering a 25 bps rate hike. Some Fed governors suggested a 50 bps inaugural move, but Fed Chair Powell earlier this month told lawmakers that uncertainty and market volatility related to the Russian invasion in Ukraine meant that the US central bank shouldn’t become a source of additional market stress. He nevertheless suggested that >25 bps steps could be a possibility later in the cycle if warranted by inflation (expectations) and/or the tight US labour market.
The new Summary of Economic Projections is expected to show yet another upgrade to inflation forecasts but focus will turn to governors thoughts on the future interest rate path (dot plot). Markets currently discount the equivalent of 25 bps rate hikes at every remaining Fed meeting this year (7 including today). We think that the Fed will show readiness to more or less walk that line.
Apart from this year’s projections, the key question will be on where Fed governors see the terminal rate. The market currently discount a neutral top just under 2.5% at the end of 2023. Will the Fed be more hawkish in this respect by signaling readiness to apply a restrictive monetary policy stance (exceeding the 2.5% neutral rate)?
Apart from the guidance on interest rates, there’s the second important pillar of the Fed’s normalization plans: running down the balance sheet. The US central bank indicated that this process would start shortly after raising interest rates, but provided little intel on the pace and target of the current $9tn balance sheet. We think the Fed could delay any such detailed plans for its May or June meeting, in line with Powell’s guidance not to become a source of additional market stress.
From a market point of view, we don’t expect any significant correction yet in core bond sell-off. If the focus turns to interest rates rather than the BS run-off, this implies a further bear flattening of the curve.
While the European central bank last week finally gave some backing for the euro medium term, we think the dollar can take the upper hand short term. Because of a hawkish Fed, fragile risk sentiment and ongoing tensions in Ukraine. The YTD low at EUR/USD 1.0806 is the final reference ahead of the March 2020 low (1.0636).
News Headlines
Sarah Bloom Raskin withdrew as President Biden’s nominee to be the Fed’s vice chair of supervision yesterday. She faced stiff Republican opposition ever since her nomination in January. But Raskin’s chances for what is seen as the most powerful banking regulator post really diminished significantly after Senator Manchin from the Democratic Party announced he wouldn’t support her in the 50-50 split Senate. Biden hasn’t come up with an alternative candidate yet. The post may even remain open heading into the US midterm elections in November.
Australian house prices rose 4.7% q/q in the last quarter of 2021. That’s slightly down from the 5% the quarter before but more than the 3.5% expected. The year-on-year rise hit a new record with 23.70% (up from 21.70% in Q3) since recording began in 2003. From the eight capital cities, Brisbane (9.6% q/q) and Adelaide (6.8%) registered the biggest increases. “Days on market fell and sales transaction volumes increased”, the statistics bureau said, referring to record low interest rates and ongoing strong demand to have supported growth in property prices.