Sample Category Title
EURUSD is Consolidating
On Monday, 21 March, the major currency pair is trading at 1.1055. Investors couldn’t “save” the previous rising wave and the short-term prospects are looking rather uncertain.
Later today, market players should pay attention to the speech to be delivered by the US Fed Chairman Jerome Powell. He is rather unlikely to announce something investors don’t know. However, if he confirms the regulator’s plans to raise the rate several times this year and to cut its own portfolio, it will calm down financial markets.
This week, Powell is scheduled to speak several times. Apart from him, other FOMC members are also expected to address the audience.
Fundamentally, the “greenback” is now supported by a restrained risk attitude – these days, investors require “safe haven” assets.
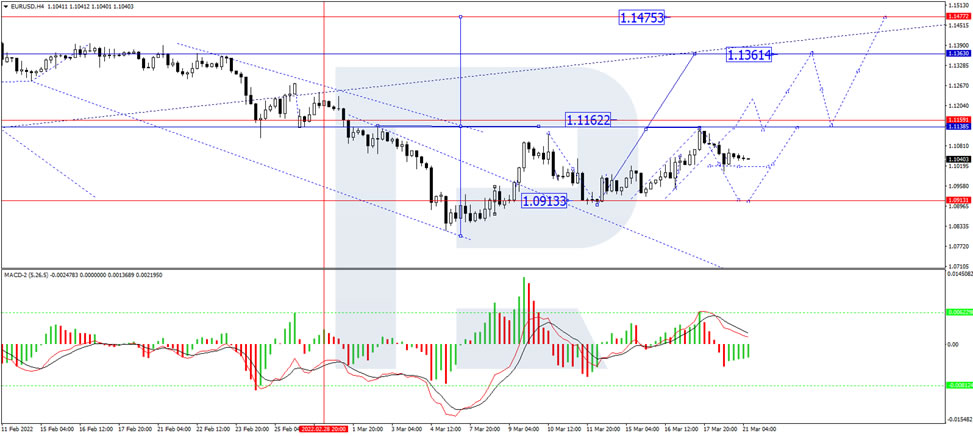
In the H4 chart, EUR/USD has finished the ascending wave at 1.1138; right now, it is correcting towards 1.0948 and may later form one more ascending wave the target at 1.1361. From the technical point of view, this scenario is confirmed by MACD Oscillator: its signal line is falling and may later break 0. After that, it is expected to continue moving towards new lows.
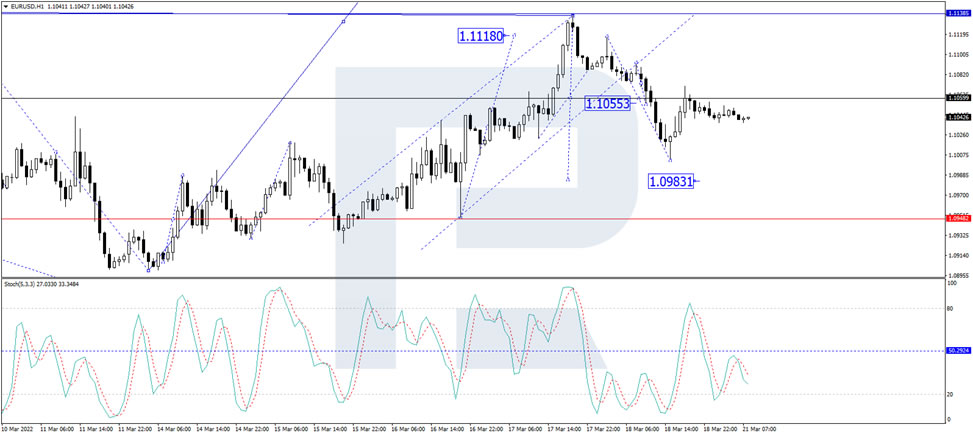
As we can see in the H1 chart, after reaching the short-term correctional target at 1.1000 and then forming a new ascending structure towards 1.1060, EUR/USD has rebounded from the latter level; right now, it is trading downwards again with the target at 1.0983 (at least). From the technical point of view, this idea is confirmed by the Stochastic Oscillator: its signal line is moving below 50 and may continue falling to reach 20. Later, the line may rebound from 20 and start a new growth towards 80.
ECB Lagarde: Even in the bleakest scenario, there is no stagflation
ECB President Christine Lagarde said that Russia invasion of Ukraine will have "consequences" for growth. However, "even in the bleakest scenario, with second-round effects, with a boycott of gas and petrol and a worsening of the war that goes on for a long time -- even in those scenarios we have 2.3% growth." Hence, "we are not seeing elements of stagflation now," she said.
Lagarde also reiterated that the US and Eurozone are in "difference universes", at a "different stage" in the economic cycle, with "different starting points". "We in the euro area are at negative rates, while the U.S. never went below zero."
Fed Raising Rates But Stocks Rallying… What is Going On?
The era of COVID-19 cheap money is over. Who is afraid of the Fed's tightening cycle? Apparently not the stock market!
In a move aimed to fight the worst inflation in the US in 40 years, the Federal Reserve announced on March 16 a 0.25% increase in interest rates. It's the first time in more than three years that the Fed raises the benchmark interest rate. The last increase was in December 2018. The 25 basis point hike brings the current interest rate to the range of 0.25%-0.5%. All of this was expected because markets have priced in this increase for a long time. However, the strange thing was the US stock markets' reaction after the rate hike. Markets didn't behave the way they are supposed to.
In theory, higher rates should make stocks less attractive, because higher rates mean higher borrowing costs for businesses and consumers, which lowers the overall spending. In turn, profits are affected, which is reflected in stock market prices. However, this time, investors have rebelled against this traditional wisdom, and have pounced on the stock markets. US markets jumped after the Fed announced its long-awaited rate hike and indicated the possibility of six more hikes this year. The S&P 500 closed that day 2.2% higher.
Why did US stocks rise after Fed's rate hike?
- The US stocks have rallied because stocks usually reflect what’s best for the economy. And, raising rates now is the best solution for the economy. Investors are finally relieved that the Fed is taking action to fight the highest level of inflation in decades.
- The Fed surprised the market by indicating the possibility of raising rates in all the remaining six meetings, indicating that the US economy is strong and can withstand the tightening cycle.
- Signs that the conflict between Russia and Ukraine is beginning to enter the stage of resolution and settlement.
- Signs from China that it will ease its broad regulatory crackdown.
What does history say about raising rates and US stocks?
Over the past two years, the stock market has soared and stayed strong in the face of the worst global pandemic in a century, one of the most divisive presidential elections in US history, and the Capitol building under attack. Now stocks are facing Europe's biggest ground war since World War II, and the fastest inflation since the 1980s. History indicates that US stocks are poised to face more volatility after a rate hike. This, however, does not mean that the bull market is over. In fact, in the previous eight tightening cycles, S&P 500 was higher a year after the first increase each time, according to LPL Financial.
Here's a look at what history has to say about the US stock market when the Fed starts raising rates:
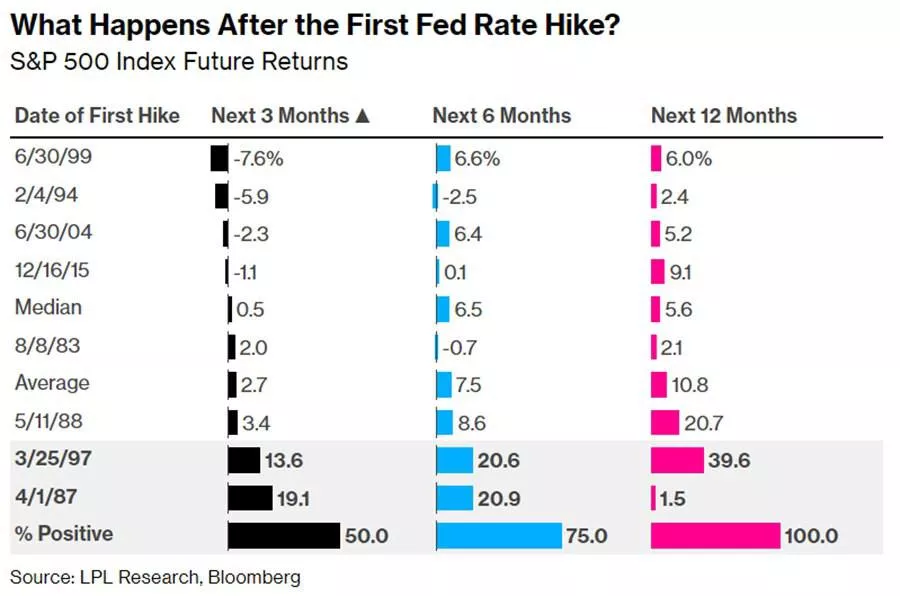
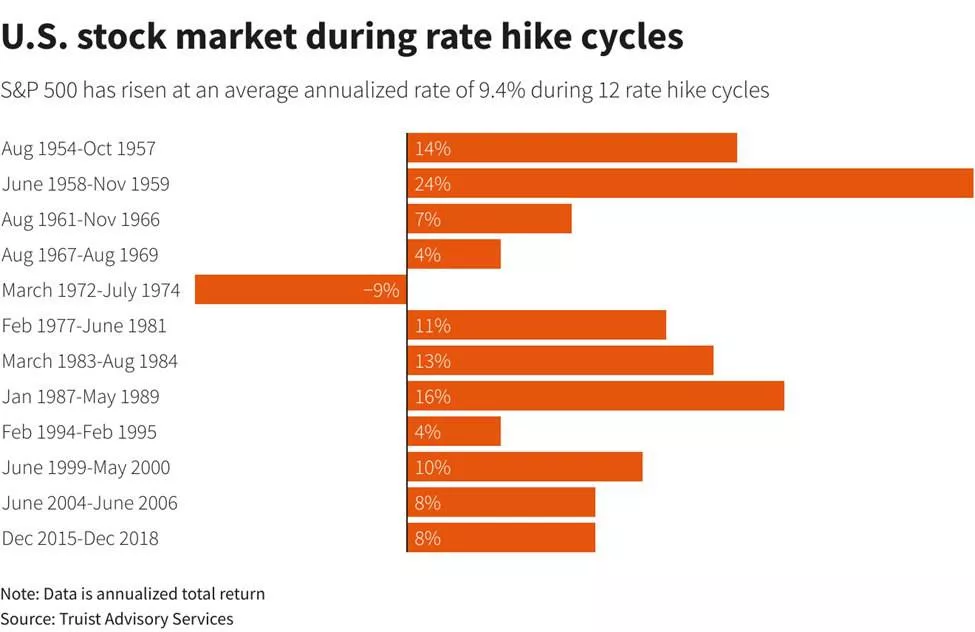
Finally, the free money from the Federal Reserve was such a wonderful gift to the stock market during the pandemic that they became addicted to it. Therefore, although the high rates may pose a challenge to the US stock market, it may be able to overcome it by the end of the year. Traders must manage this volatility carefully to profit from it.
EURUSD Faces Fading Bearish Bias, But Confirmation Required
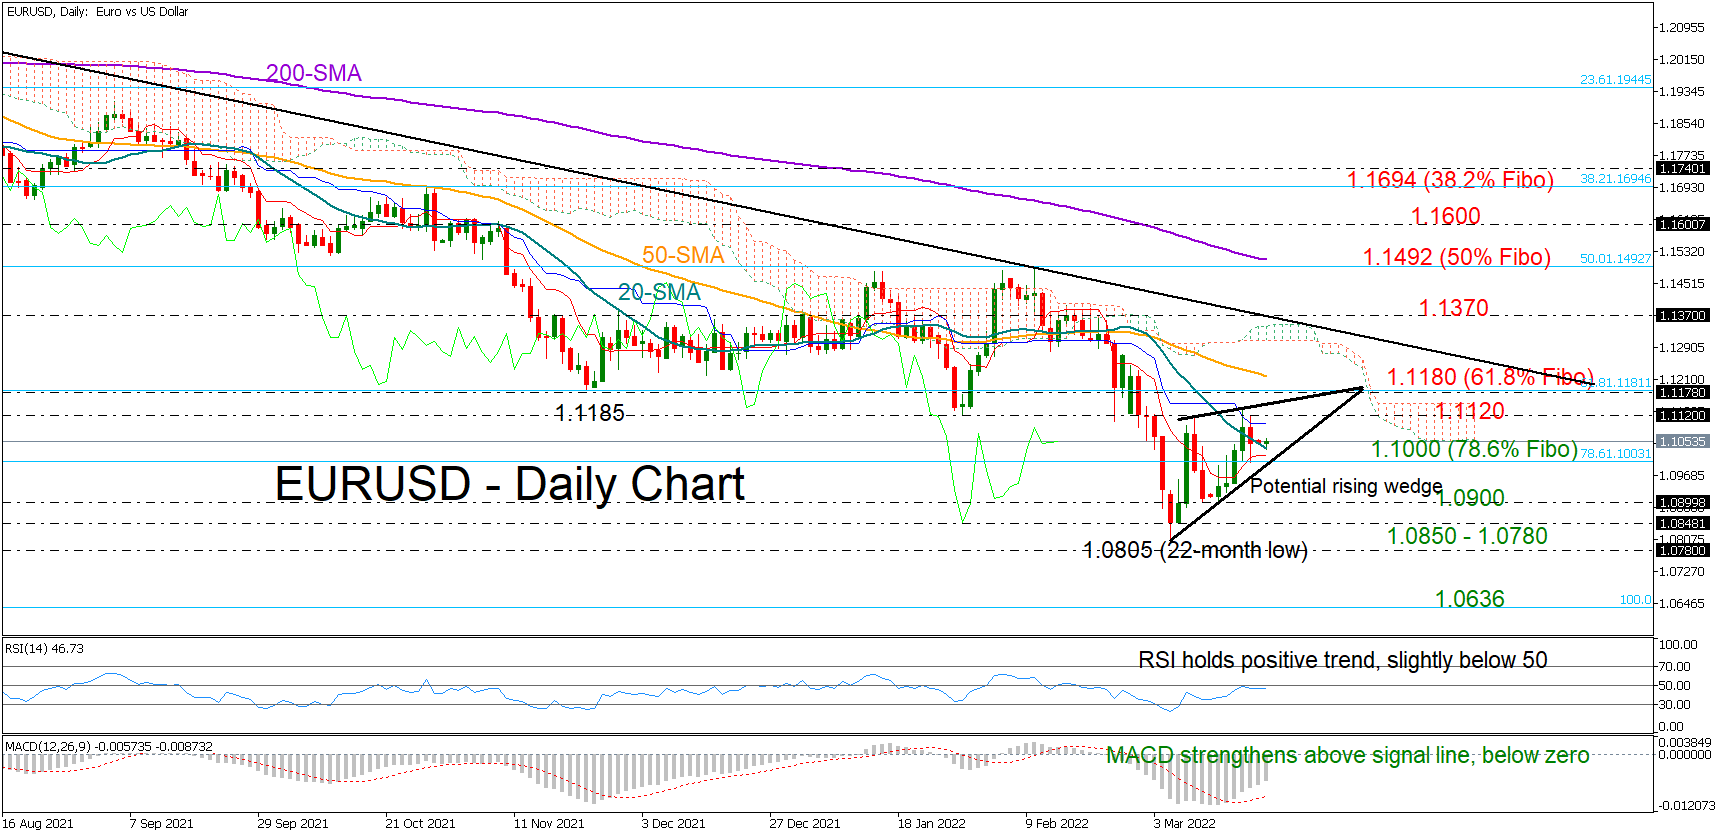
EURUSD opened the week silently, hovering near Friday’s closing price and around the 20-day simple moving average (SMA) at 1.1046.
The 1.1120 – 1.1180 territory, which has been a key constraint to upside and downside movements since the end of November, remains the main target following the bounce off 1.0805. Interestingly, the 61.8% Fibonacci retracement of the 1.0636 – 1.2348 upleg is placed within this zone, while the 50-day SMA is approaching that area too, making any violation here important to watch. Should the bulls successfully knock down that wall, the price could accelerate towards the tentative descending trendline at 1.1350 drawn from the peak of 1.2265. Another victory at this point, and particularly a decisive close above the former resistance of 1.1370, could see an extension towards the 50% Fibonacci of 1.1492 and the 200-day SMA.
From a technical perspective, downside risks have faded but they have not been eliminated in the short-term picture as the MACD keeps distancing itself above its red signal line and within the negative area, while the RSI, although below its 50 neutral mark, is maintaining a positive trend. On the other hand, up until now, the market structure in March has taken the shape of a rising wedge at the bottom of a downtrend, which is usually dissolved on the downside. Nevertheless, if the price manages to set a foothold above the 20-day SMA in the coming sessions, that could be an encouraging sign that buying appetite has started to grow in the market.
Otherwise, if the pair dives below the 1.1000 mark, where the 78.6% Fibonacci retracement is intersecting the short-term supportive trendline, the 1.0900 level could come first to the rescue. If not, the bears may attempt to breach the 1.0850 – 1.0780 floor with scope to reach the pandemic low of 1.0636.
Summarizing, although the medium-term outlook for EURUSD remains blurry below 1.1492, some recovery cannot be ruled out in the short-term. However, traders may wisely wait for a break above 1.1120 – 1.1180 to become more confident that the latest rebound in the pair will continue.
Crude Oil Supply and Demand Imbalances Remain
Crude oil prices remained at elevated levels on Monday morning as investors reacted to the rising fears of supply and demand imbalances. Brent is trading at $107 while WTI is at $103. These prices are significantly below their highest levels this year. In a report published last week, the International Energy Agency (IEA) said that supply will drop sharply in April as oil traders swerve Russian crude to avoid sanctions. It estimates that over 3 million barrels will be cut from the market per day. The price action has been complicated by ongoing negotiations in Iran and Venezuela.
American and European futures held steady as investors bought the dips. The Dow Jones rose by over 270 points while the Nasdaq 100 rose by 280 points. Still, there are significant concerns among investors. For example, there are margin concerns considering that the price of most commodities has been in an upward trend. Also, the cost of shipping rose as companies navigate longer routes. Another concern is that the number of Covid-19 cases has reportedly been rising sharply in China. As a result, the government has announced several lockdowns affecting over 50 million people.
The economic calendar will be muted on Monday. As such, investors will continue focusing on new developments on the war in Ukraine. Russia is expected to continue bombarding cities now that its military offensive has stalled. Investors will also reflect on the interest rates decision by the Federal Reserve. The bank decided to hike interest rates on Wednesday last week. Therefore, a speech by Jerome Powell will likely have an impact on stocks and currencies.
EURJPY
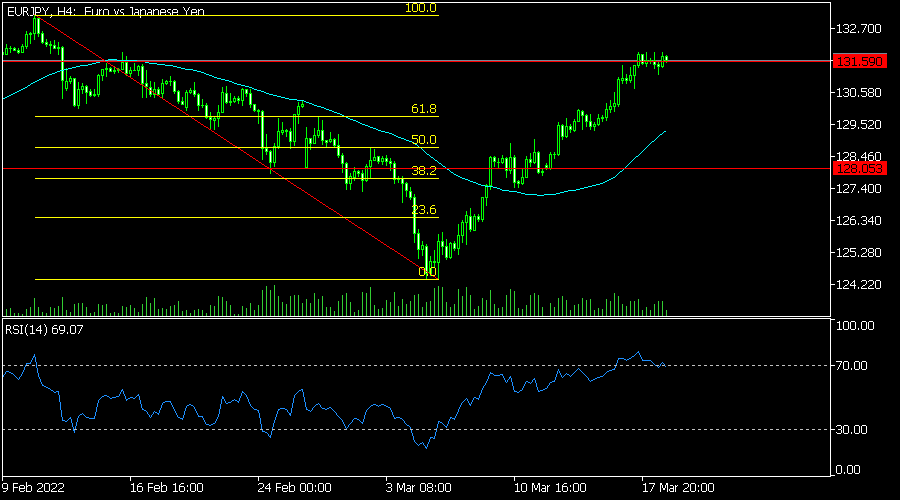
The EURJPY pair has been in a strong bullish trend in the past few days as investors react to the latest decisions by the Bank of Japan and European Central Bank. The pair rose to a high of 131.60, which is significantly above this month’s low at 124.40. On the four-hour chart, the pair moved above the 25-day and 50-day moving averages. It has also risen above the 78.6% retracement level. Therefore, the pair will likely keep rising in the near term.
EURUSD
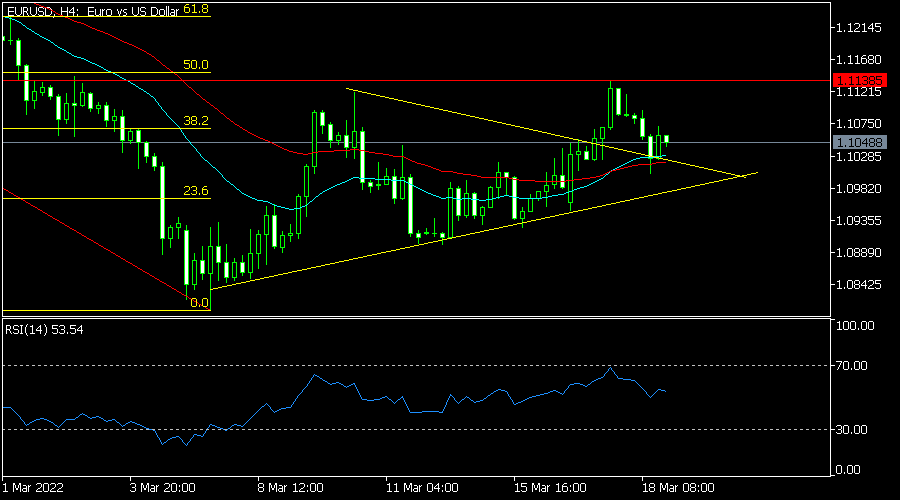
The EURUSD pair was little changed on Monday morning. It is trading at 1.1050, which was slightly lower than last week’s high of 1.1140. It is slightly above the upper side of the yellow symmetrical triangle pattern. It is slightly above the 25-day moving average and slightly below the 38.6% Fibonacci retracement level. The pair will likely keep falling as bears target the lower side of the triangle pattern.
NZDUSD
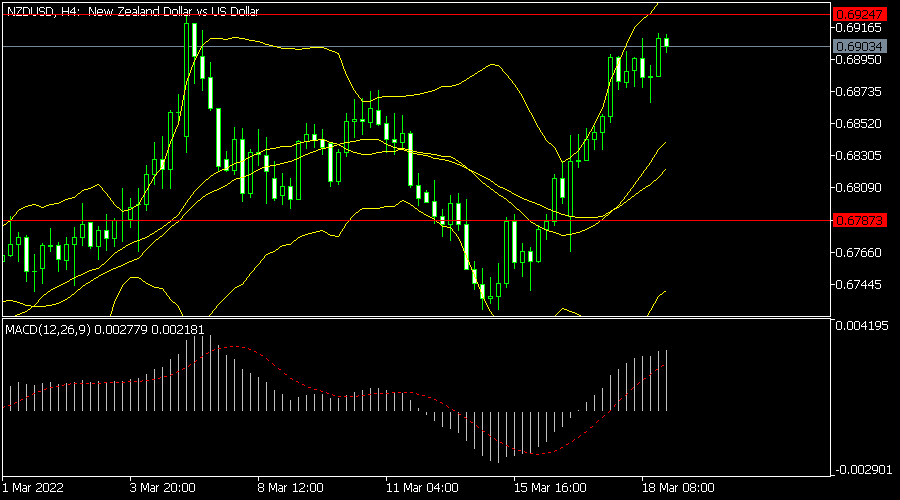
The NZDUSD maintained a bullish trend after the latest New Zealand trade numbers. It rose to a high of 0.6900, which is slightly below the key resistance at 0.6925. On the four-hour chart, it has formed a V-shaped recovery and moved above the 25-day and 50-day moving averages. The pair has also moved between the middle and upper lines of the Bollinger Bands. Therefore, the pair will likely keep rising in the near term.
Currency Markets are Ranging
Currency markets had another choppy session on Friday, but ultimately, remained content to continue range trading. The US dollar rallied somewhat, despite US yields falling. I suspect that pre-weekend caution was the driver of moves in both asset classes. The dollar index rose 0.22% to 98.22, edging higher to 98.26 in Asia. A Japanese holiday today is muting volumes and volatility in the region.
EUR/USD gave back some of its gains above 1.1100, falling 0.36% to 1.1050, where it remains in Asia. A European oil embargo on Russia would be another headwind for the single currency, although a Ukraine agreement or progress will likely spark a sharp relief rally. Levels to watch for now are 1.1000 and 1.1200. Sterling edged higher to 1.3175 before falling to 1.3160 this morning. It looks to have traced out a major low at 1.3000 and its medium-term technical outlook is now constructive above that level. 1.3200 is initial resistance. USD/JPY rose sharply on Friday by 0.46% to 119.15 as oil prices continued to rally. Today’s rises will keep the pressure on the yen which seems to be tracking oil more closely than US yields for now. It remains on track to test 120.00.
AUD/USD and NZD/USD booked gains on Friday, rising 0.50% and 0.40% respectively to 0.7415 and 0.6905. The antipodeans continue to ride the rebound in risk sentiment in US markets and until that changes, the technical picture suggests more gains lie ahead. The next technical resistances are at 0.7440 and 0.6925.
Asian currencies are steady after the PBOC left its Loan Prime Rates unchanged and set a neutral USD/CNY fixing. The rise in oil prices this morning had seen Asian currencies retreat modestly and imported inflation, particularly energy, remain their Achilles heel. Regional central banks have little to no interest in tightening monetary policy in response to the Fed, concentrating on maintaining growth. With commodity prices to remain elevated even if the Ukraine war ended tomorrow, any material gains by Asian currencies are likely to be temporary in H1 2022. If China is indeed weakening the yuan in response to a slowing economy, that will be another headwind for regional currencies.
Bitcoin: Local Positive, But Potentially Sideways for the Year
Bitcoin gained 6.3% over the past week, finishing near $41.3K. The price retreated slightly to $41.0K on Monday morning, losing 2.1% over the last 24 hours. Ethereum has corrected by 2% over the same period but still added 11.6% to the price seven days ago. Other leading altcoins in the top 10 have gained between 7.3% (Polkadot) and 24.8% (Avalanche) over the past week.
Total cryptocurrency market capitalisation, according to CoinMarketCap, rose 7.5% for the week to $1.86 trillion. The Bitcoin Dominance Index fell 0.6 points to 41.9% due to outperforming altcoins.
The Cryptocurrency Fear and Greed Index rose 7 points for the week to 30 and moved into “fear” from “extreme fear”.
Last week turned out to be a good one for the crypto market, with bitcoin rising the most in six weeks. Last Wednesday, the US Federal Reserve meeting weakened the dollar and boosted stocks, which benefited all risky assets, including cryptocurrencies.
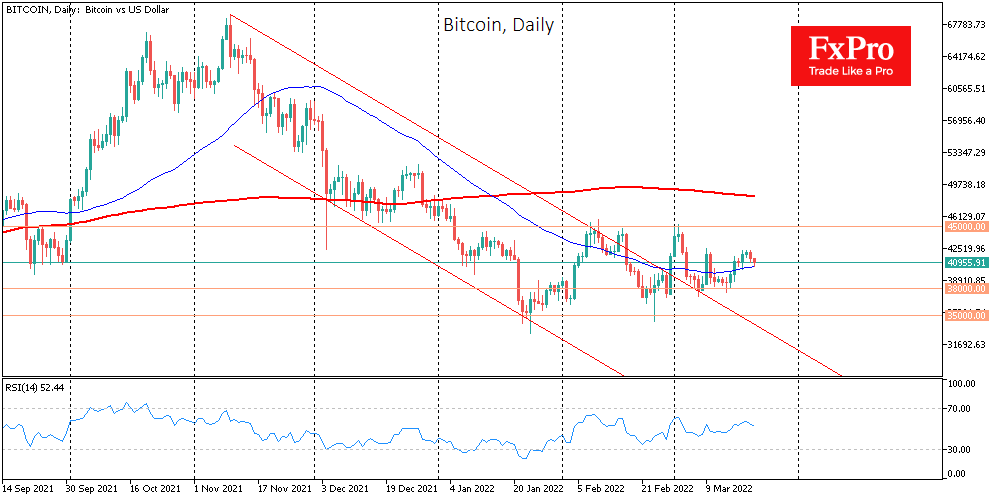
Meanwhile, bitcoin has continued to trade in a sideways range of $38-45K for the second month, with a closer look marked by a sequence of declining local highs with bullish momentum fading near 42 in the last two weeks. The positive sentiment is supported by the 50-day moving average reversing upwards. BTCUSD broke it in a relatively strong move on March 16th, and it has been acting as local support ever since.
The external environment in the financial markets remains mixed. Traders have tighter financial conditions due to higher rates and waning economic growth on one side of the scale. On the other side is the demand for purchasing power insurance for capital due to the highest inflation in two generations. Weighing these factors, Galaxy Digital head Mike Novogratz said bitcoin would continue to trade in a sideways range this year. He said BTC will resume growth and reach $500K by 2025 as inflation curbing measures are too weak.
Piyush Gupta, chief executive of Singapore’s largest bank, DBS, said cryptocurrencies could be an alternative to gold but would not be able to fit into the traditional financial system due to excessive volatility.
ECB de Guindos: No stagflation but inflation to remain higher for longer
In an interview with Handelsblatt, ECB Vice President Luis de Guindos said Eurozone is not heading towards stagflatoin. "In the most recent projections, even in our most adverse scenario for the current year, we still foresee growth of more than 2%, so no stagflation," he said. "Inflation, however, is likely to remain higher for a longer period than expected before the war."
De Guindos also said what matters for the central bank now is the extent to which wages respond. "If wage increases are too high, they can push prices up even more and contribute to persistently higher inflation." But he added, "We have not seen any signs of that yet".
He added last week's statement "delink the potential interest rate hikes from the asset purchase programme". The timing of rate hike "all depends on the data". "The price shock in energy and commodities that we're currently experiencing is making many firms and workers worse off. Fiscal policy should provide temporary, targeted support to help reduce the burden. This would also reduce the danger of a wage-price spiral," he said.
AUD/USD Pair Moved into a Positive Zone Above $0.7300
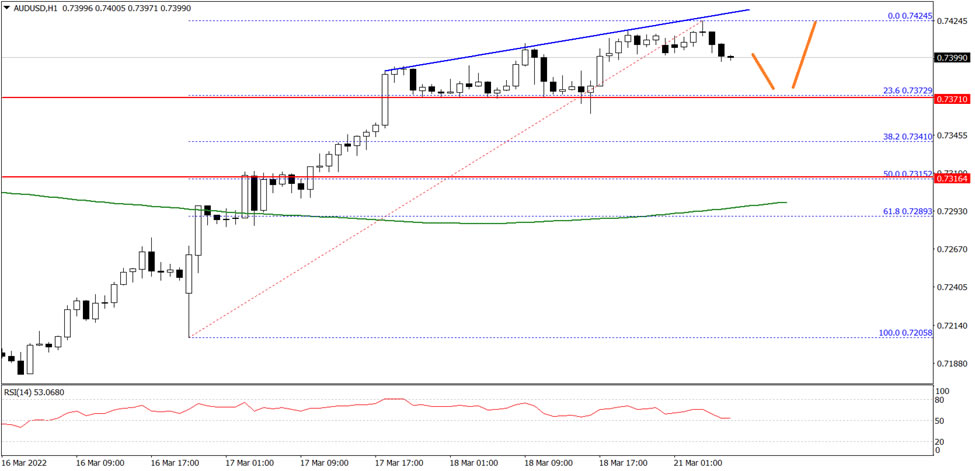
The Aussie Dollar started a fresh increase from the 0.7200 support zone against the US Dollar. The AUD/USD pair traded above the 0.7300 level to move into a positive zone.
The pair even traded above the 0.7350 level and the 50 hourly simple moving average. It is now facing hurdle near a connecting trend line at 0.7425 on the hourly chart. The next key resistance on the upside is near the 0.7430 level.
If there is an upside break above the 0.7430 level, the pair could rise steadily towards the 0.7450 level in the near term. Any more gains could send the pair towards 0.7480 on FXOpen.
An immediate support on the downside is near the 0.7380 level. The next key support is near the 0.7350 level. A clear break below the 0.7350 support could lead the pair towards the 0.7300 support.
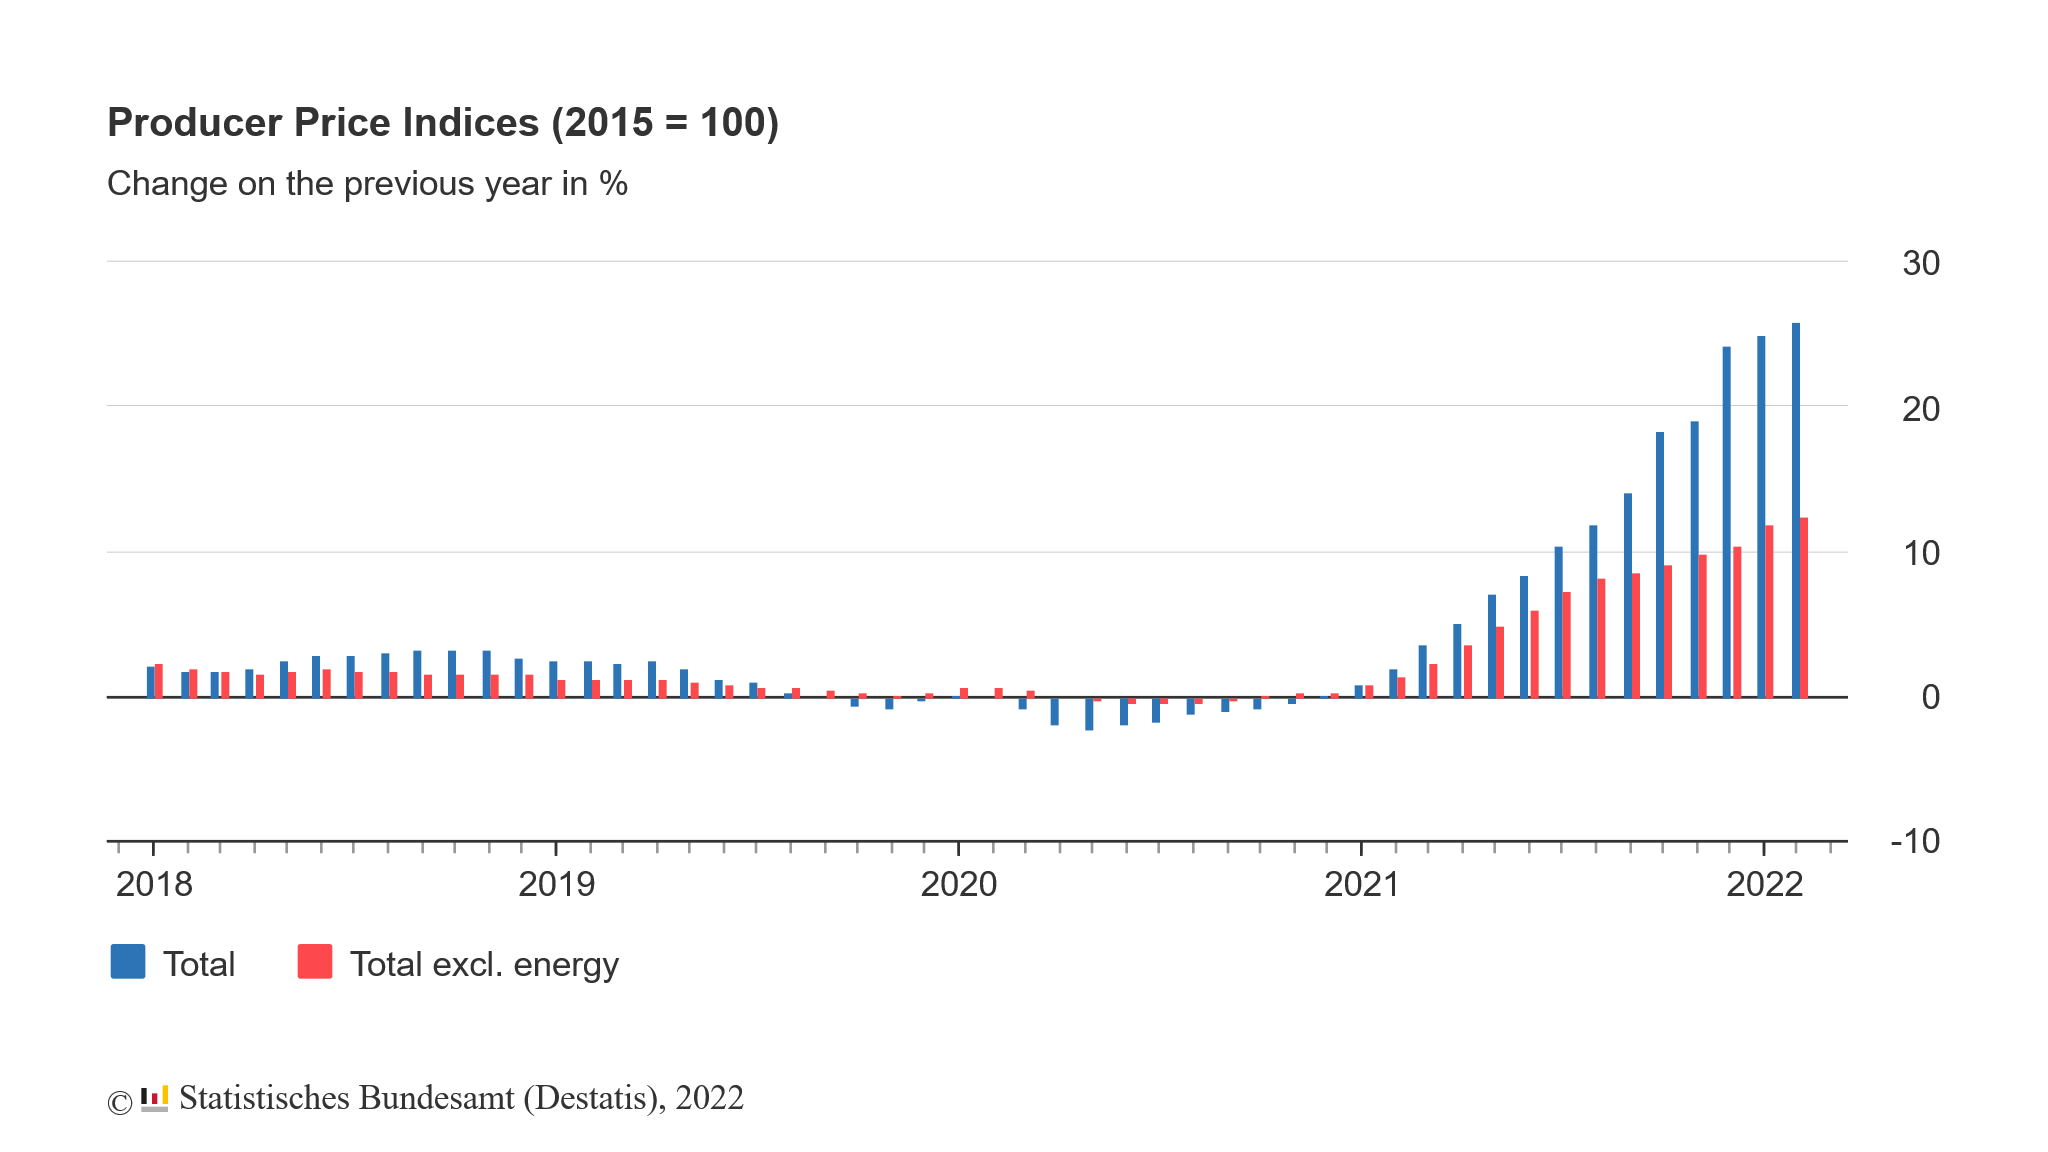
Germany PPI up 1.4% mom, 25.9% yoy in Feb, Russia invasion impact not yet included
Germany PPI rose 1.4% mom, 25.9% yoy in February, below expectation of 1.7% mom, 26.1% yoy, comparing to January's 2.2% mom, 25.0% yoy.
Destatis said, "the recent price development in the context of Russia's attack on Ukraine are not yet included in the results... Mainly responsible for the increase of producer prices compared to February 2021 still was the price increase of energy."
Energy prices as a whole rose 68.0% yoy. Price of intermediate goods rose 21.0% yoy. Prices of non-durable consumer goods rose 7.4% yoy. Prices of durable consumer goods rose 6.7% yoy. Capital goods prices rose 5.5% yoy.