Sample Category Title
NZ Dollar Climbs on Sharp Maufacturing Data
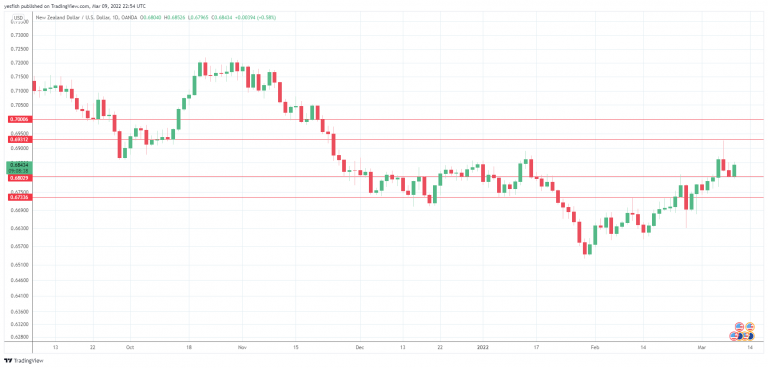
The New Zealand dollar has posted strong gains on Wednesday. NZD/USD is trading at 0.6841 in the European session, up 0.55% on the day.
Manufacturing Sales surge in Q4
Manufacturing Sales were outstanding in the fourth quarter, with a gain of 12.0%. This marked an impressive rebound from the -2.3% reading in Q3. Construction sales also soared by 16%. The strong numbers were a result of the easing of Covid lockdowns in the fourth quarter, as pent-up demand led to an upsurge in economic activity. We’ll get a look at another barometer of the manufacturing sector on Thursday, with the release of BusinessNZ Manufacturing Index. A strong reading would be another indication that the manufacturing sector is gaining strength.
The New Zealand dollar continues to show volatility, and as a risk currency it is vulnerable to haven flows to the US dollar. The war in Ukraine has raised risk aversion, as the West continues to slap sanctions on Moscow. On Tuesday, US President Biden announced a total ban on Russian energy imports, but EU members are unlikely to join, as Europe is much more dependent on Russian energy supplies than the US. At the same time, the kiwi is also a commodity-based currency and the surge in commodity prices has provided some support, as NZD/USD is up 1.0% in the month of March.
The Federal Reserve will almost certainly raise rates next week, likely by 25 basis points. With the turbulent economic landscape due to the Ukraine crisis and the staggering rise in oil prices, Fed policy makers have to also worry about stagflation. The Fed will have to be cautious about raising rates and not choking off economic activity, which means that we could see a slower timeline for raising rates than what the markets had anticipated only a few weeks ago.
NZD/USD Technical
- NZD/USD has support at 0.6802 and 0.6733
- There is resistance at 0.6931 and 0.7000
Markets Calm, But Inside Eye of Storm
There was a sense of calm in the markets this morning, evidently on the back of remarks made by Russian Foreign Minister. But we are still inside the eye of the storm. Don’t let this apparent calmness fool you.
European stock indices and US futures roared back to life this morning, while gold slid 2% amid calmer risk tones as it backed away from August 2020 highs. There was no stopping Nickel though, as it continued its historic surge. The markets moved after Russia’s foreign minister, Sergei Lavrov, struck a conciliatory tone. He said:
- Operation's Aims Do Not Include Overthrowing Ukrainian Government
- It Would Be Better If Our Goals in Ukraine Are Achieved Through Talks
Talks are indeed always better than going to war, especially if there are no intentions of overthrowing the government. This might be a sign that Russia is blinking. But actions speak louder than words and Russia will have to do more than this. There is also the issue of trust, as this is the same people who told us that the troops on the Ukrainian border returned to base, only to then invade Ukraine shortly after.
Don’t forget that the US just yesterday decided to launch an all-out economic war against Russia, banning imports of oil and gas from the country. The UK has also announced it will phase out the import of Russian oil and oil products by the end of the year. There will be consequences: high gas prices, even more inflation and retaliation from Russia.
So, gold might be edging away from its record highs and stocks firmer, sentiment can turn negative very quickly. Volatile market conditions are not going anywhere until Putin ends the invasion of Ukraine.
For now, markets are relieved by the fact we haven’t had any fresh bearish news since yesterday’s announcement of a ban in oil imports from Russia. The markets were severely oversold, and any piece of good news would have always been amplified in terms of market reaction, which is what we have seen so far today. Also, let’s not forget that this is typical of a bear market when you sometimes see multiple percentage point gains in a short period of time as the shorts are squeezed, before the rally runs out of steam and the downward trend resumes.
Will it be another such scenario this time around? Time will tell. But for now, the markets are happy to buy downbeat stocks, especially as the ECB is seen dialling back its hawkish rhetoric tomorrow:
- Germany's Dax Up 5%, Set for Best Day Since May 2020
- Euro Zone Banks Extend Gains, Up Nearly 8%
- Nasdaq 100 Futures Extend Rally, up 2%, S&P Futures Up 1.6%
Crude Oil Targets New Highs: Elliott Wave Analysis
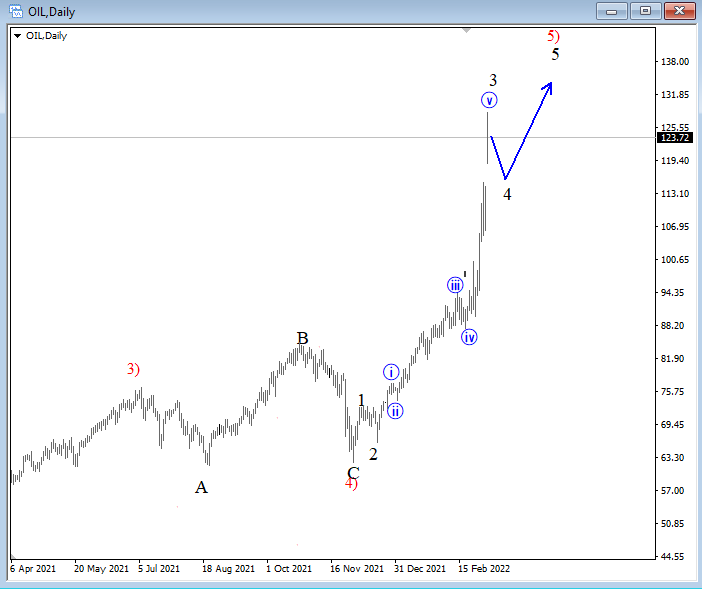
The USD is seen in a bullish structure vs other major currencies, so we should be aware of more risk-off in the near term. Also, one of the most important markets these days, crude oil can stay in a bullish trend after the White House failed to arrange talks between Biden, Saudi Arabia and the UAE.
Crude oil keeps rising in strong and impulsive fashion and with the current GAP up, there can be room for more upside to complete a five-wave cycle within extended 5th wave, but probably after a pullback in sub-wave 4, where ideal support would be around that 115 GAP area.
Crude oil 4h Elliott Wave analysis
EUR/USD outlook: Fresh risk mode lifts euro further
The Euro stands at the front foot for the second consecutive day, boosted by improved sentiment on growing expectations for a de-escalation of the conflict in Ukraine that revived risk appetite.
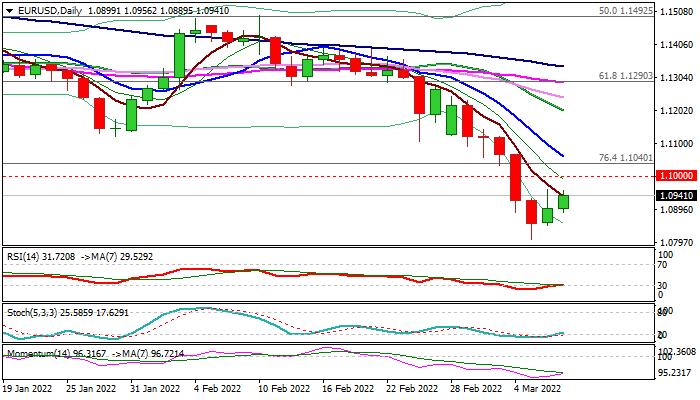
Tuesday’s first bullish close after five straight days in red was an initial positive signal, although fresh risk mode is still tentative and needs more evidence on lift above initial pivots at 1.0958/68 (Tuesday’s high / Fibo 23.6% of 1.1494/1.0806) to expose key barriers at 1.1000/1.1040 (psychological/broken Fibo 76.4% of 1.0635/1.2349 rally).
Only break here would sideline larger bears for stronger correction. Caution on signs of recovery stall under 1.10 zone as larger picture is bearish and limited recovery would offer better selling opportunities for fresh acceleration lower, with violation of new multi-month low (1.0806) to open way towards key target at 1.0635 (pandemic low, posted in March 2020).
Res: 1.0968; 1.1000; 1.1040; 1.1069.
Sup: 1.0900; 1.0889; 1.0848; 1.0806.
USDJPY Nears 116 Mark as Bullish Pressures Increase
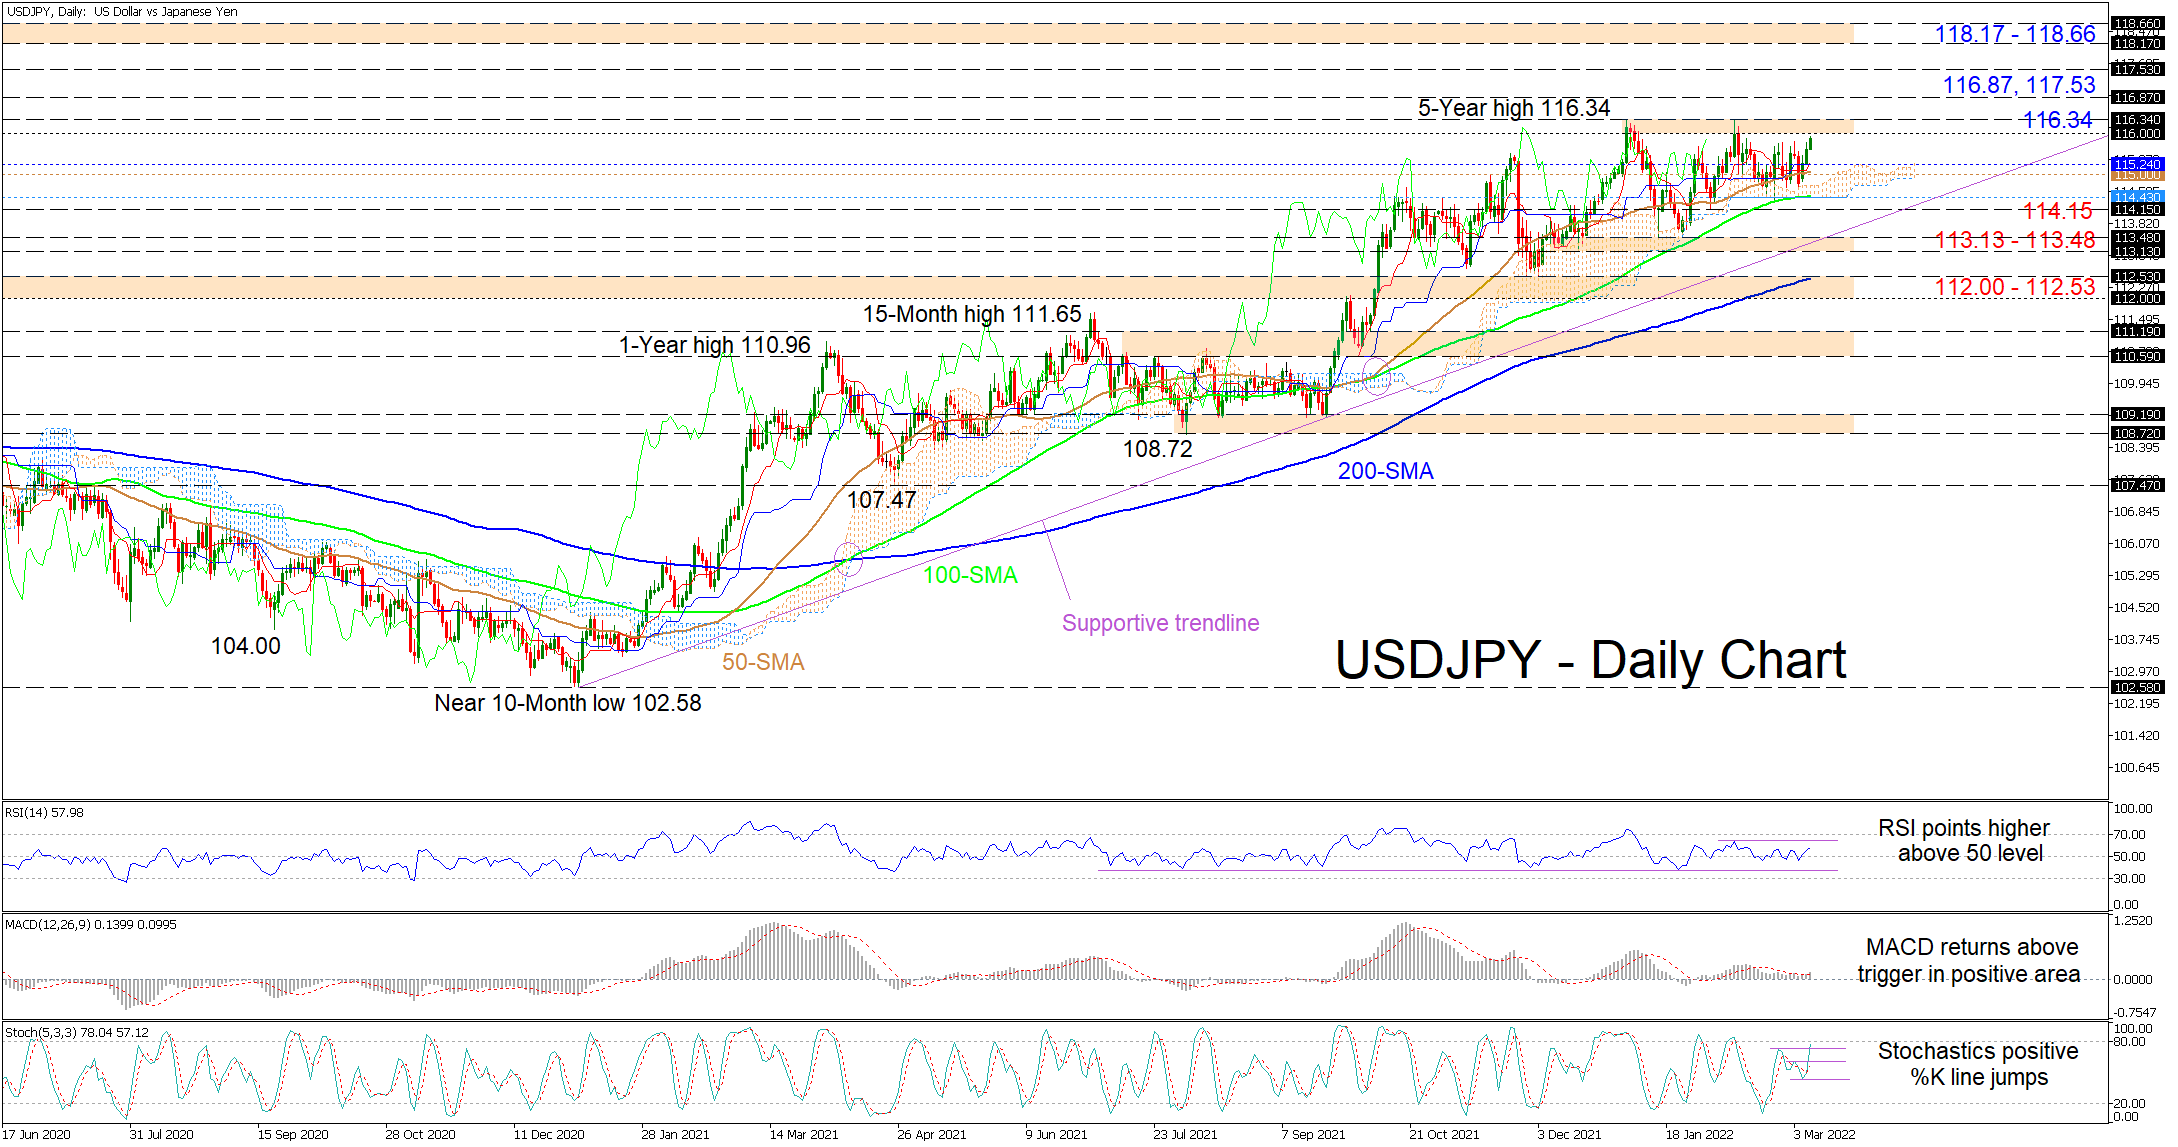
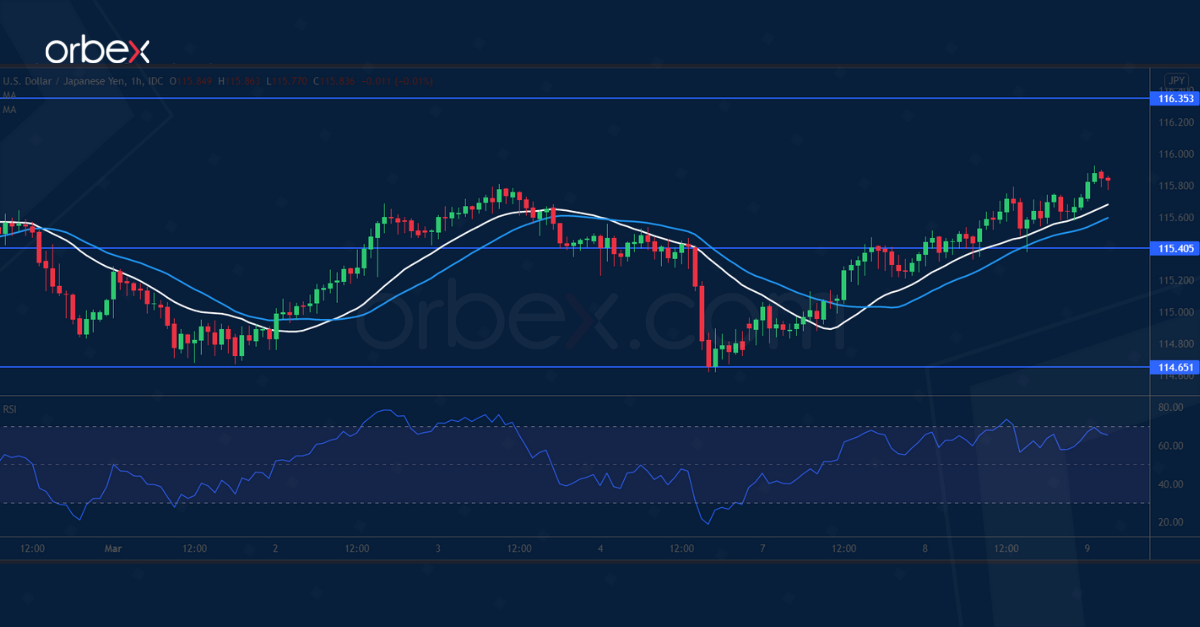
USDJPY is creeping higher toward the 116.00 handle and the five-year high of 116.34 after recently bouncing off the Ichimoku cloud. The bullish simple moving averages (SMAs) are defending the broader positive structure.
Currently, the Ichimoku lines are not exhibiting a convincing directional force, while the short-term oscillators suggest positive momentum is strengthening. The MACD, in the positive region, has pushed back above its red trigger line, while the RSI is improving in bullish territory after vibrating around the 50 threshold. The stochastic oscillator has turned positive after the %K line rocketed higher, promoting upside price action.
In the positive scenario, initial hindrance to the resuscitation of the uptrend is the 116.00-116.34 resistance band, the latter being the five-year high. Overstepping this more than two-month curbing barrier, the pair could target the 116.87 and the 117.53 highs from the first half of January 2017. If the bulls maintain command, the price may then pursue the 118.17-118.66 resistance section that was moulded by the rally peak in mid-December 2016 and the early January 2017 high.
Alternatively, if positive powers fade around the 116.00 level, the Ichimoku lines at 115.24 could delay the test of a tough support zone from the 50-day SMA at 115.00 until the cloud’s floor at 114.43. If the price slides even lower, the 114.15 barrier and a potential supportive trend line pulled from the 102.58 bottom, may try to impede a deeper retracement from evolving. However, if selling pressures remain dominant, the 113.13-113.48 boundary could come under attack.
Summarizing, USDJPY is exhibiting a neutral-to-bullish bearing above the SMAs and the 114.15 low. A break above the 5-year high would revive the broader uptrend. Yet, the price would need to sink below the support border of 112.00-112.53 to spark worries about the bigger positive structure.
EURJPY Stages Upside Reversal after Harsh Sell-Off
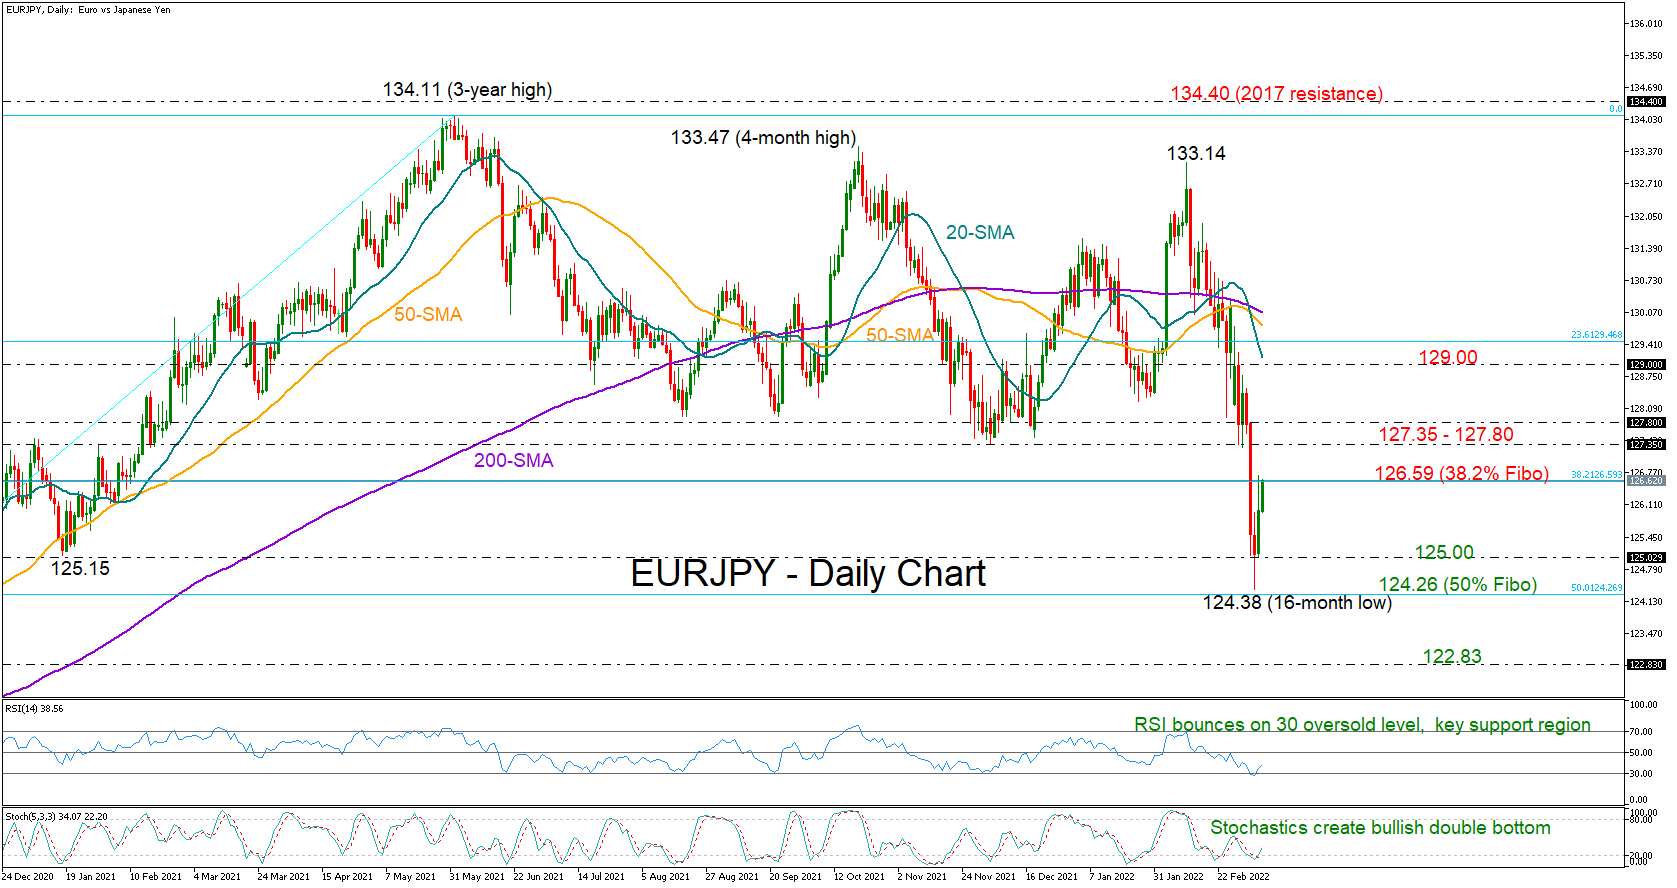
EURJPY entered a bear market in the long-term picture, falling harshly below its previous lows to bottom at a 16-month low of 124.38 last week.
While the 20-day simple moving average (SMA) has just created a double bearish cross with the longer-term SMAs, endorsing the negative trajectory in the market, the RSI and the Stochastics are pointing to oversold conditions. The former has pivoted near its 30 support region, while the latter has formed a bullish double bottom pattern around 20, foreseeing some recovery in the coming sessions.
Having bounced from its recent lows, the price is now looking for a break above the 38.2% Fibonacci retracement of the 114.42 – 134.11 upleg (2020 – 2021) around 126.59. If the bulls claim that area, the ascent could continue towards the key 127.35 – 127.80 zone. A clear violation at this point would put the market back in the previous neutral path, likely shifting the spotlight towards the 129.00 round level and the 20-day SMA.
In the negative scenario, the bears are expected to push again for a close below the 125.00 mark. If efforts prove successful this time, with the price retreating below the 50% Fibonacci of 124.26 as well, the next stop could be around 122.83, last seen in November 2020.
Summarizing, EURJPY is gaining some buying traction as its latest aggressive decline seems overdone. A decisive close above 126.59 could strengthen its bullish momentum. Otherwise, the focus will remain on the 125.00 number.
Crude Oil, Natural Gas and Gold Maintain a Bullish Momentum
Crude oil and natural gas prices surged during the overnight session after the United States and the UK announced new sanctions on Russia. In a statement, Joe Biden said that the US will stop importing Russian oil and gas. Boris Johnson also reiterated the statement while the European Union announced that it will accelerate its process to phase out Russian exports in the coming years. On Monday, Russia warned that it could be forced to end supplies to Europe because of the ongoing sanctions. Therefore, analysts believe that the new normal of higher energy prices is here to stay.
American equities declined sharply for the second straight day this week as concerns about the cost of doing business escalated. Most companies will be negatively affected by the rising costs. For example, retailers will need to pay more for cargo from overseas since shipping companies are expected to boost their prices. Airlines are expected to see thin margins because of high costs and the fact that the important route through Russia has been cut. Further, financial equities are struggling as investors predict a new era in cybercrime. The only beneficiaries are companies in the oil and gas industries.
The economic calendar will not have any major events on Wednesday. Earlier, Japan published strong GDP numbers while China released strong inflation data. The Energy Information Administration will publish the latest inventories numbers although their impact on the oil market will be muted. Meanwhile, investors will focus on the nickel market which saw prices jump sharply on Monday forcing the London Metal Exchange to halt. Also, investors will watch the Russian market, which is expected to reopen after being closed for more than a week.
XBRUSD
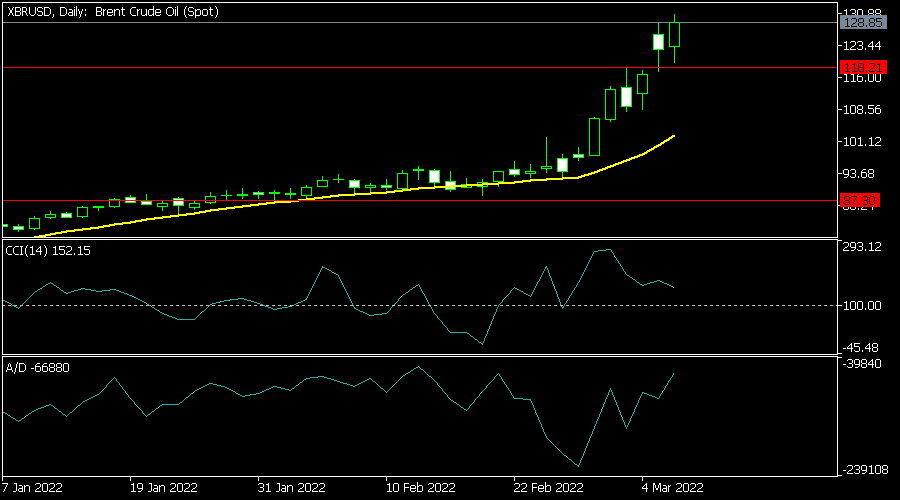
The XBRUSD pair surged to a high of 130 after the US and UK halted purchasing Russian cargo. On the daily chart, the pair has moved above the 25-day and 50-day moving averages. It has also climbed above the key resistance level at 118, which was the highest point last week. Oscillators like the CCI and MACD have also continued their bullish trend. Therefore, there is a likelihood that the bullish momentum will continue.
EURUSD
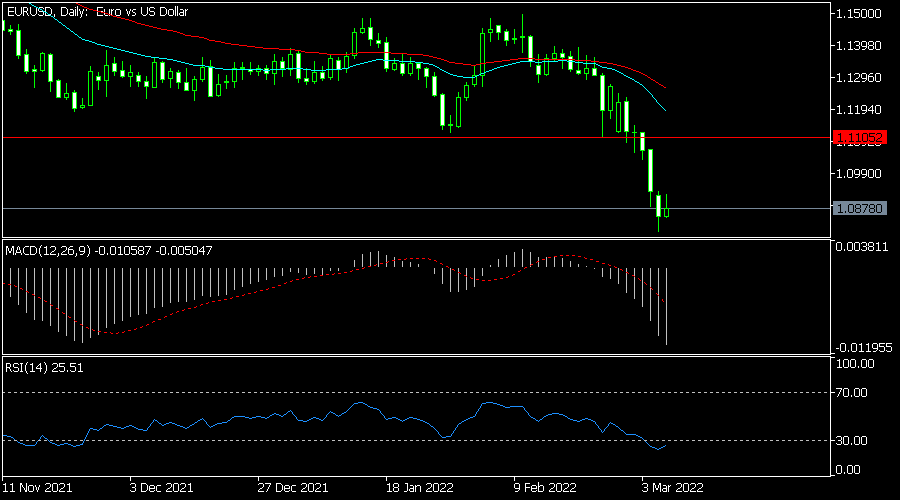
The EURUSD pair was little changed in the overnight session. On the daily chart, the pair has been in a strong bearish trend in the past few months. It has also moved below the 25-day and 50-day moving averages while the Relative Strength Index (RSI) has moved below the oversold level. The MACD has also moved below the neutral level. Therefore, since it has formed a bearish flag pattern, there is a possibility that it will have a bearish breakout.
XAUUSD
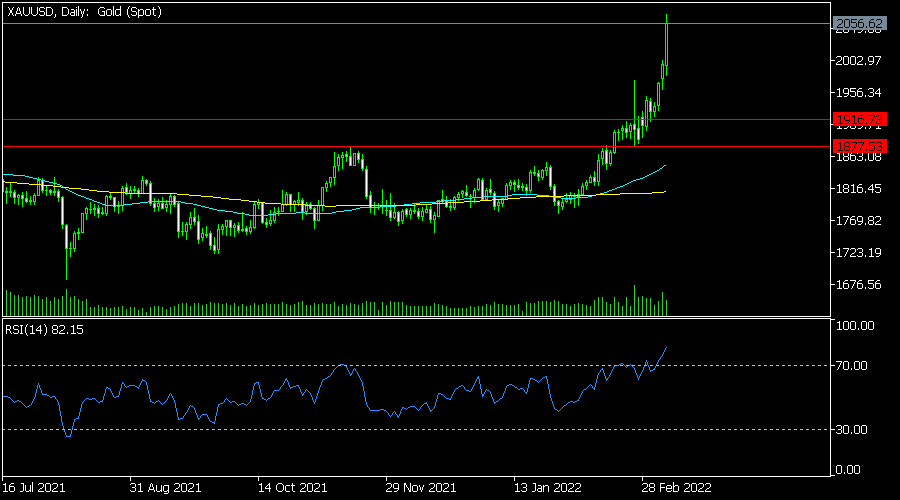
The XAUUSD pair rose sharply in the overnight session as global risks escalated. It rose close to its all-time high. Also, the pair remains above the 25-day and 50-day moving averages. Oscillators like the Relative Strength Index (RSI) and the Commodity Channel Index (CCI) have moved to the overbought level. Therefore, while the bullish trend will probably continue, there is a likelihood that the pair will have a pullback in the near term.
AUDUSD Reacting Lower From The Equal Legs Area
In this technical blog, we will look at the past performance of 4 hour Elliott Wave Charts of AUDUSD. In which, the decline from 25 February 2021 high is unfolding as a 7 swing corrective structure and showing a lower low sequence favoring more downside. Therefore, we knew that the structure in AUDUSD is incomplete to the downside & should see more weakness. So, we advised members not to buy the pair & sell the bounce in 3, 7, or 11 swings at the blue box areas. We will explain the structure & forecast below:
AUDUSD 4 Hour Elliott Wave Chart
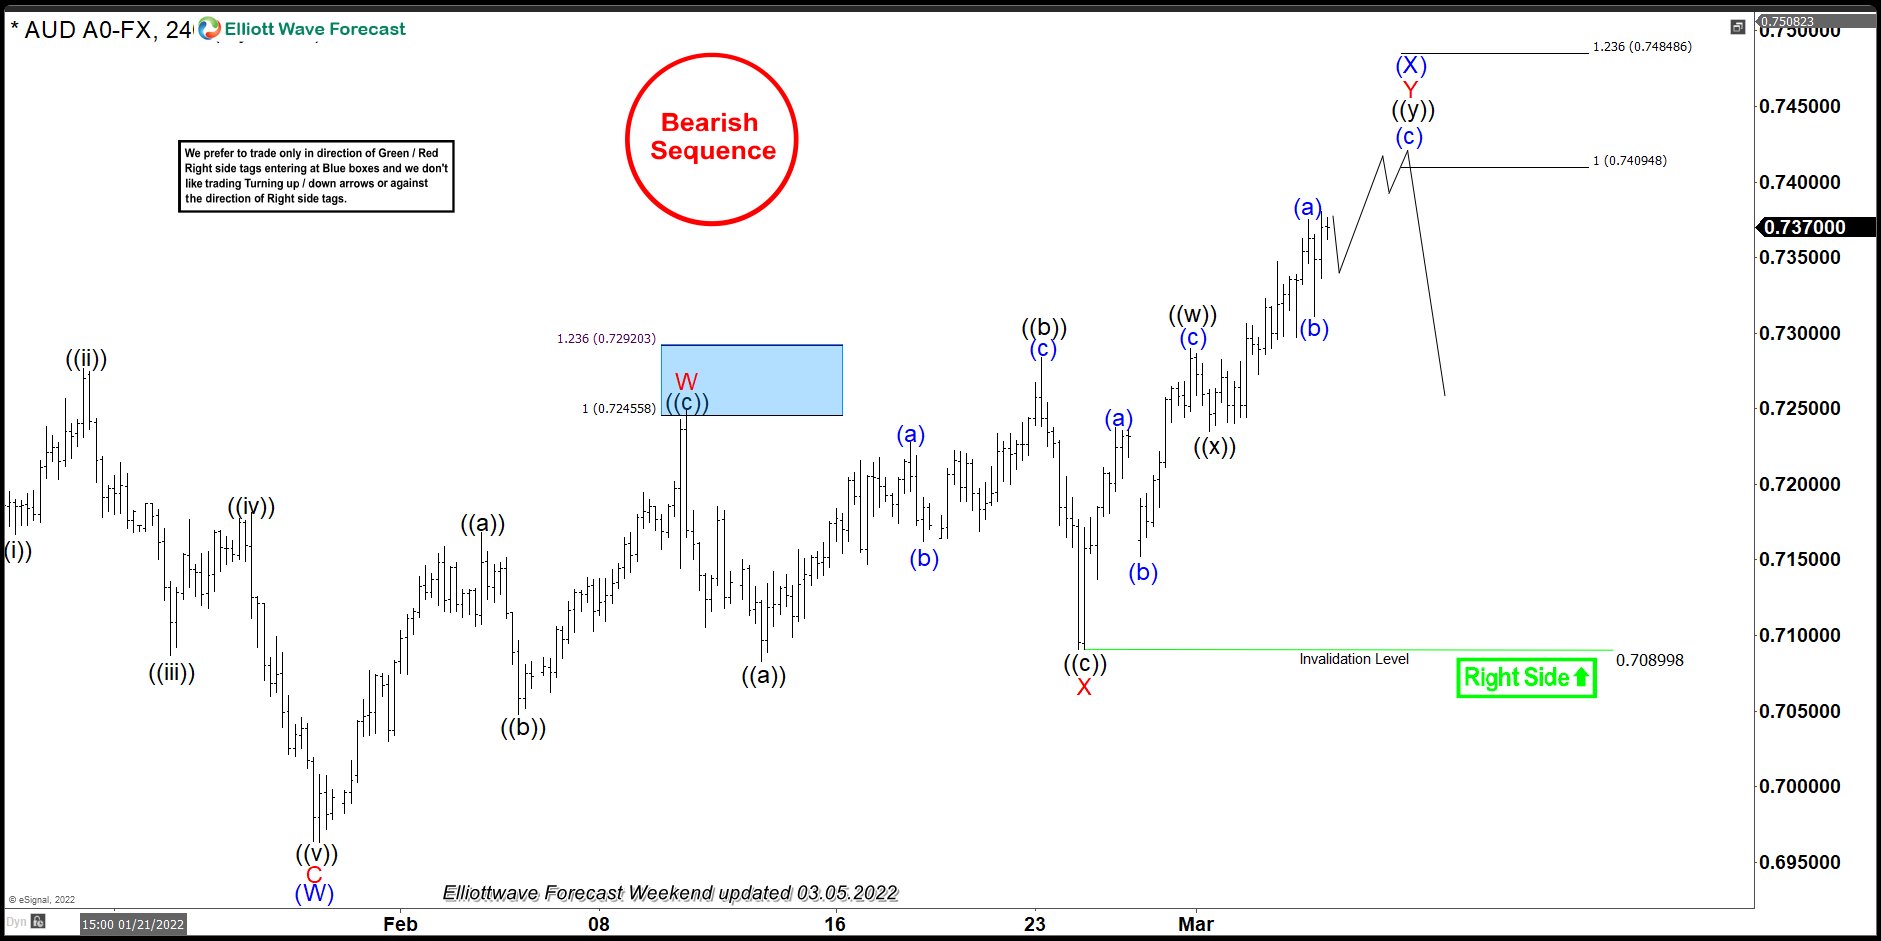
Here’s the 4 Hour Elliott wave chart from the 3/05/2022 weekend update. In which the decline to $0.6963 low ended higher degree wave (W). Up from there, the pair bounced in wave (X) to correct the cycle from 10/28/2021 high. The internals of that bounce unfolded as a double three structure where wave W ended at $0.7248 high. Wave X ended as a flat at $0.7089 low and wave Y was expected to reach $0.7409- $$0.7484 100%-123.6% Fibonacci extension area of W-X. From there, sellers were expected to appear looking for more downside or for a 3 wave reaction lower at least.
AUDUSD 4 Hour Elliott Wave Chart
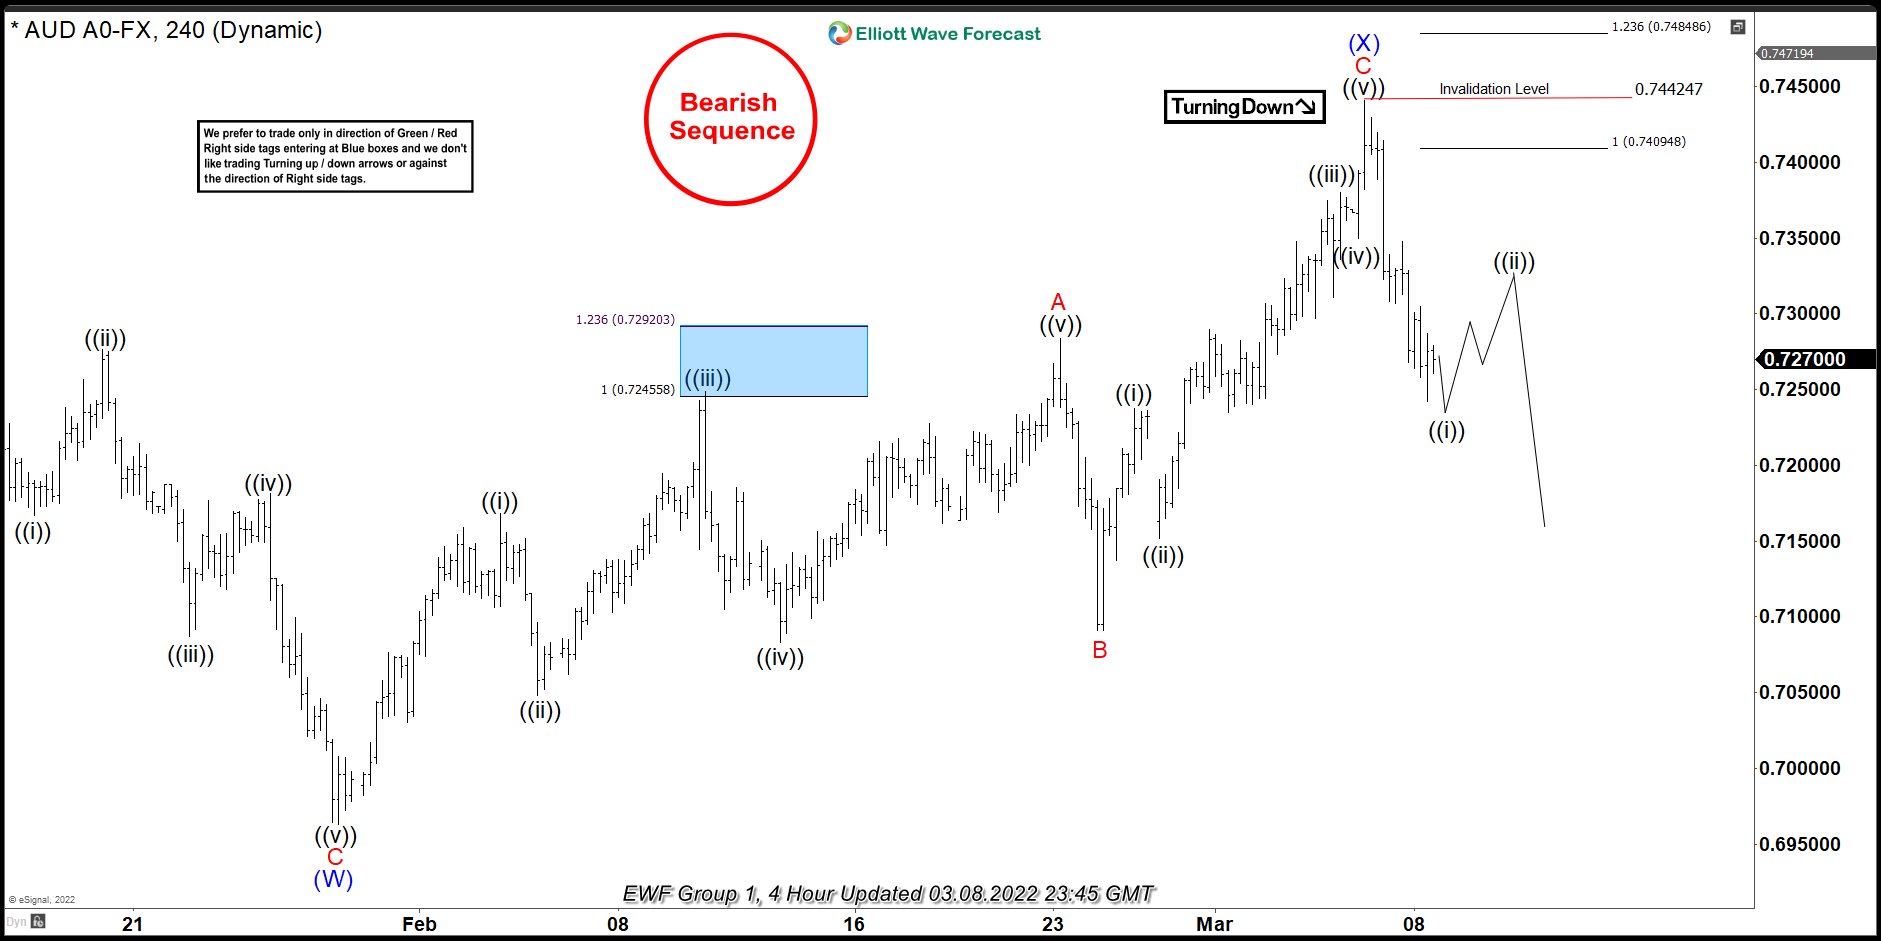
Above is the latest 4hr view from the 3/08/2022 update. In which the pair is showing reaction lower taking place as expected so far. Allowing shorts to get into a risk-free position shortly after taking the position at the equal legs area. Now as far as bounces fail below $0.7442 high then the pair is expected to resume lower. However, a break below $0.6963 level remains to be seen to confirm the next leg lower & avoid double correction higher.
UK 100 Sees Limited Bounce
The FTSE 100 struggles as the UK plans to ban Russian energy imports.
On the daily chart, a break below the demand zone (6850) wiped out 11-months worth of gains and signaled a strong bearish bias. The RSI’s oversold situation may cause a temporary rebound, but a bearish MA cross could attract more selling interest.
The liquidation is yet to end as medium-term buyers scramble for the exit. 7200 is a fresh resistance and 7450 is a major supply zone. A drop below 6800 may lead to 6500.
AUD/USD Seeks Support
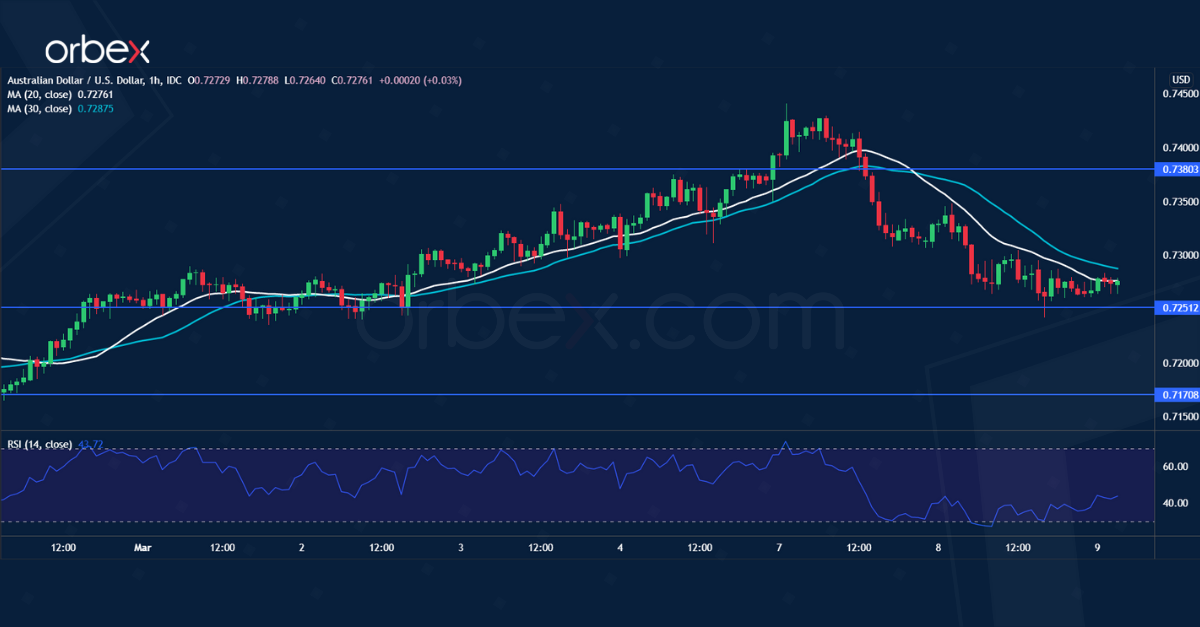
The Australian dollar stalls as commodity prices consolidate. The rally above 0.7310, a major supply area, has weakened selling pressure and put the pair on a bullish reversal course.
The Aussie’s parabolic ascent and an overbought RSI prompted short-term buyers to take profit. As the RSI swings back into the oversold zone, the bulls may see the current fallback as an opportunity to stake in.
0.7380 is a fresh resistance and 0.7250 is the immediate support. Further below 0.7170 is a critical level to keep the rebound valid.