Sample Category Title
Japan PPI rose record 9.3% yoy in Feb, led by energy and commodities
Japan corporate goods price index rose 9.3% yoy in February, above expectation of 8.7% yoy. At 110.7, the index hit the highest level marked since 1985. That's also the highest rise on record, as led by skyrocketing energy prices. Coal and petroleum prices jumped 34.2% yoy. Electricity, city gas and water prices also surged 27.5% yoy.
Commodity prices also surged with iron and steel up 24.5% yoy. Nonferrous metal rose 24.9% yoy. Lumber and wood products rose 58.0% yoy.
Import prices rose 34.0% yoy while export prices rose 12.7% yoy.
Technical Outlook and Review
DXY:
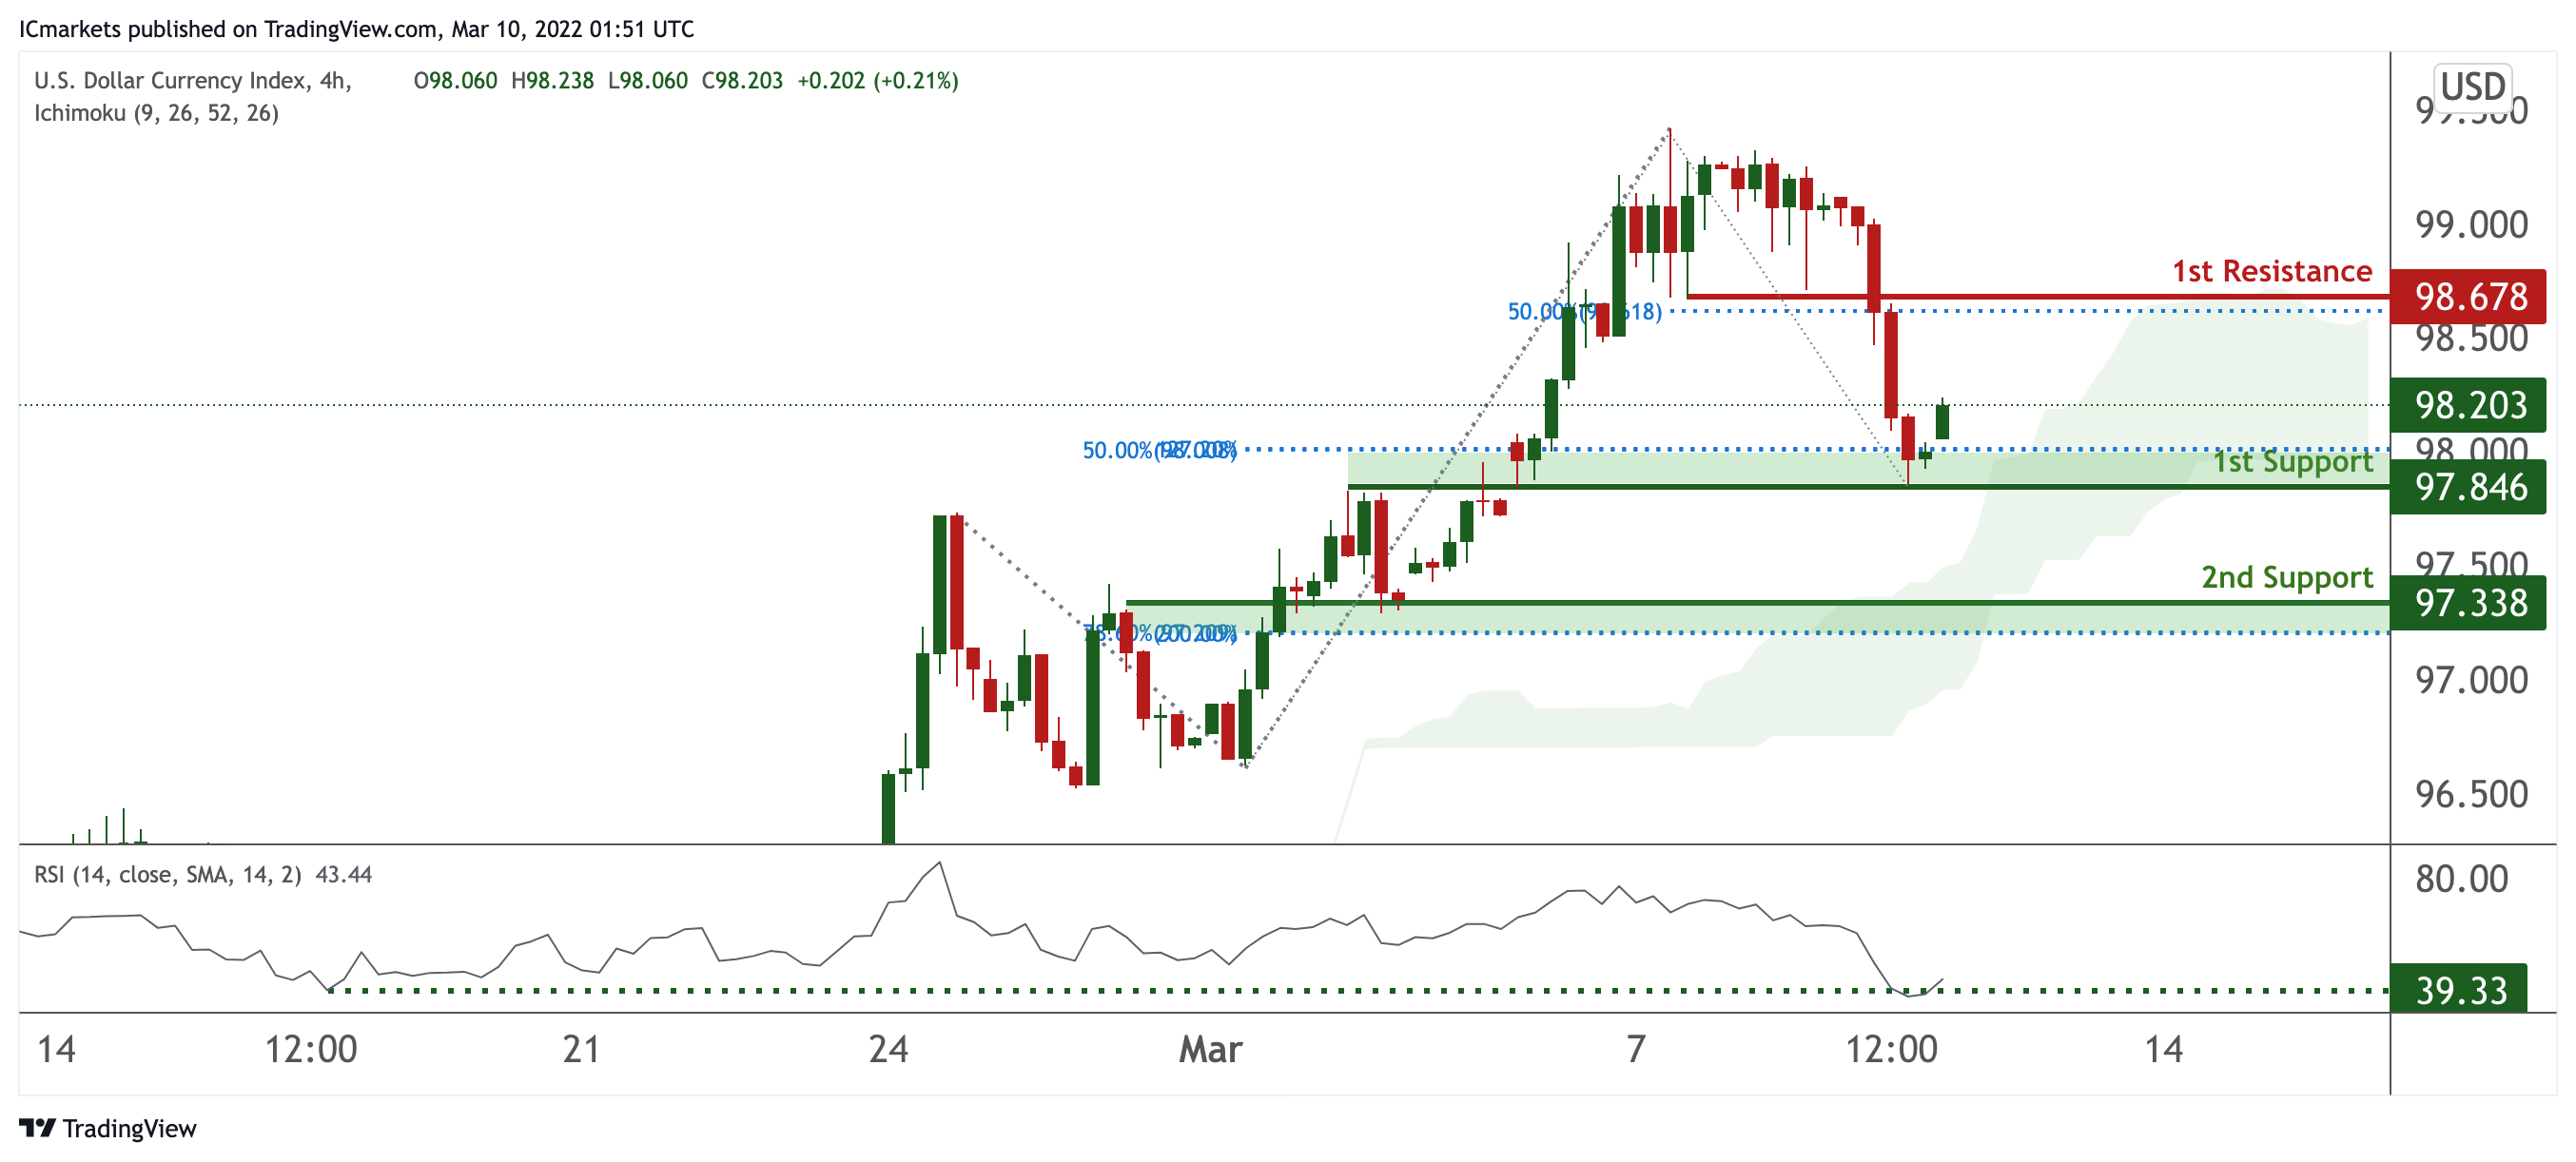
On the H4 timeframe, prices are resting on a strong support. We see the potential for further bullish continuation from our 1st support at 97.846 in line with 50% Fibonacci retracement and 127.2% Fibonacci projection towards our 1st resistance at 98.678 in line with 50% Fibonacci retracement. RSI is at levels where bounces previously occurred.
Areas of consideration:
- H4 time frame, 1st resistance at 98.678
- H4 time frame, 1st support at 97.846
XAU/USD (GOLD):
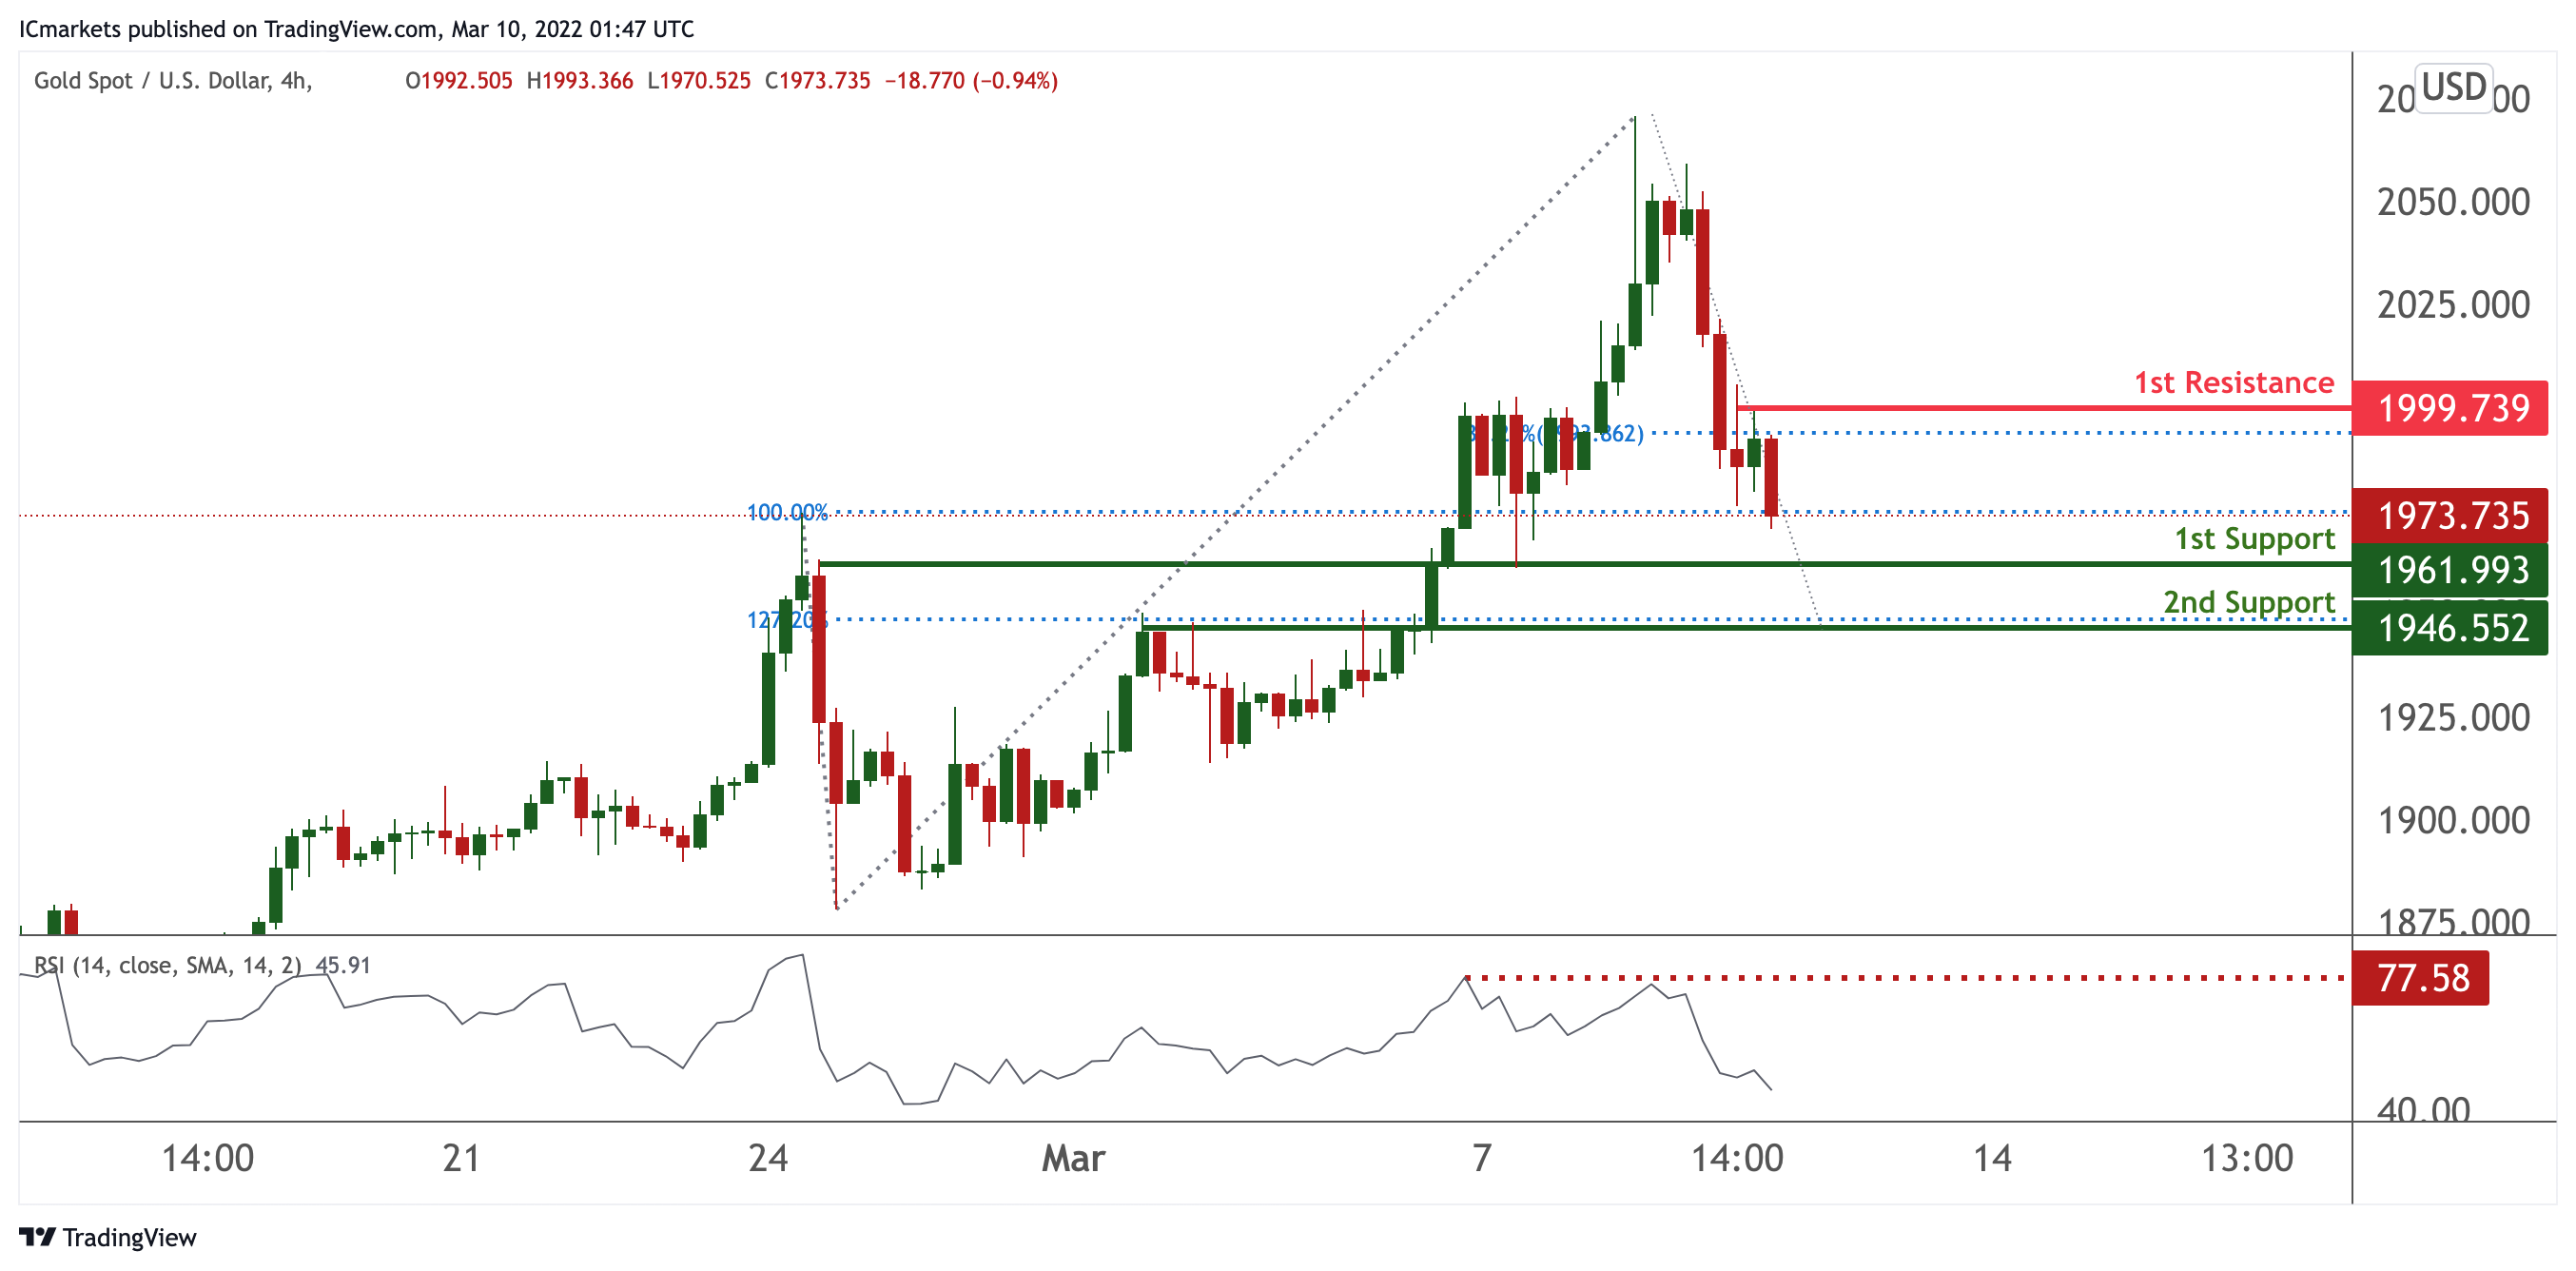
On the H4 chart, prices have recently experienced a strong reversal. We see potential for further bearish continuation from our 1st resistance at 1999.739 in line with 50% Fibonacci retracement towards our 1st support at 1961.993 in line with 100% Fibonacci extension. Divergence is spotted on RSI, further supporting our bearish bias.
Areas of consideration:
- 4h 1st support at 1961.993
- 4h 1st resistance at 1999.739
GBP/USD
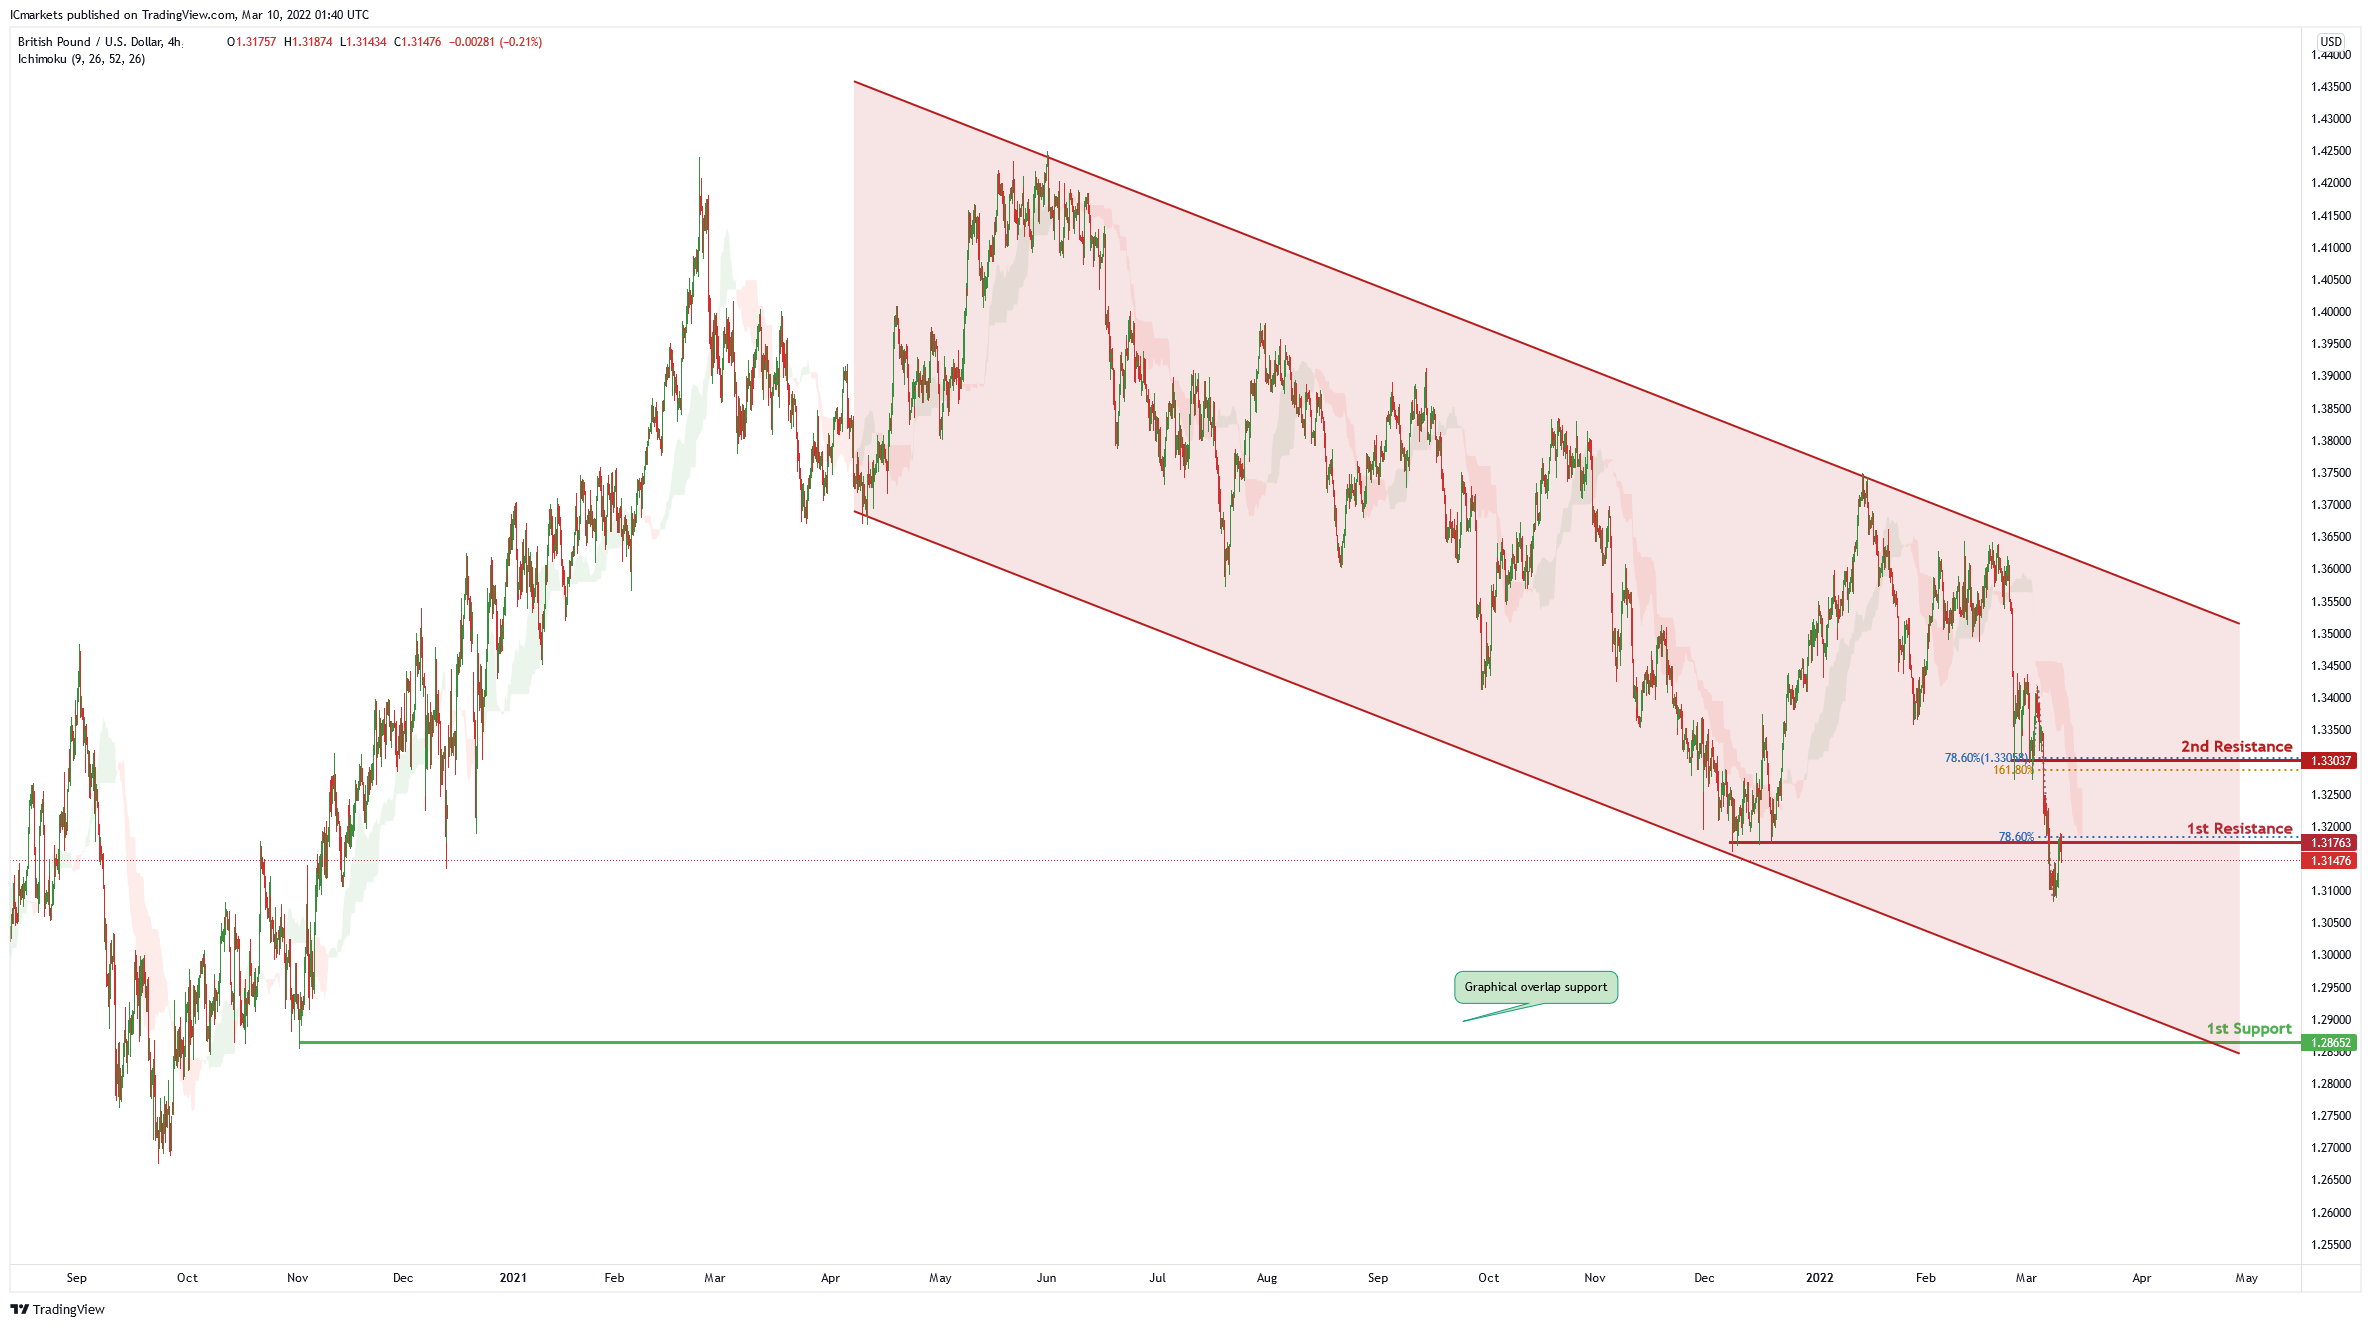
On the H4 chart price is trading in a descending channel and has recently broken the 1st resistance level of 1.31763 in line with 78.6% Fibonacci retracement. Price can potentially dip to the 1st support level of 1.28652 in line which is also the graphical overlap support. Our bearish bias is supported by the ichimoku cloud indicator as price is trading under it.
Areas of consideration
- H4 1st resistance at 1.31763
- H4 1st support at 1.28652
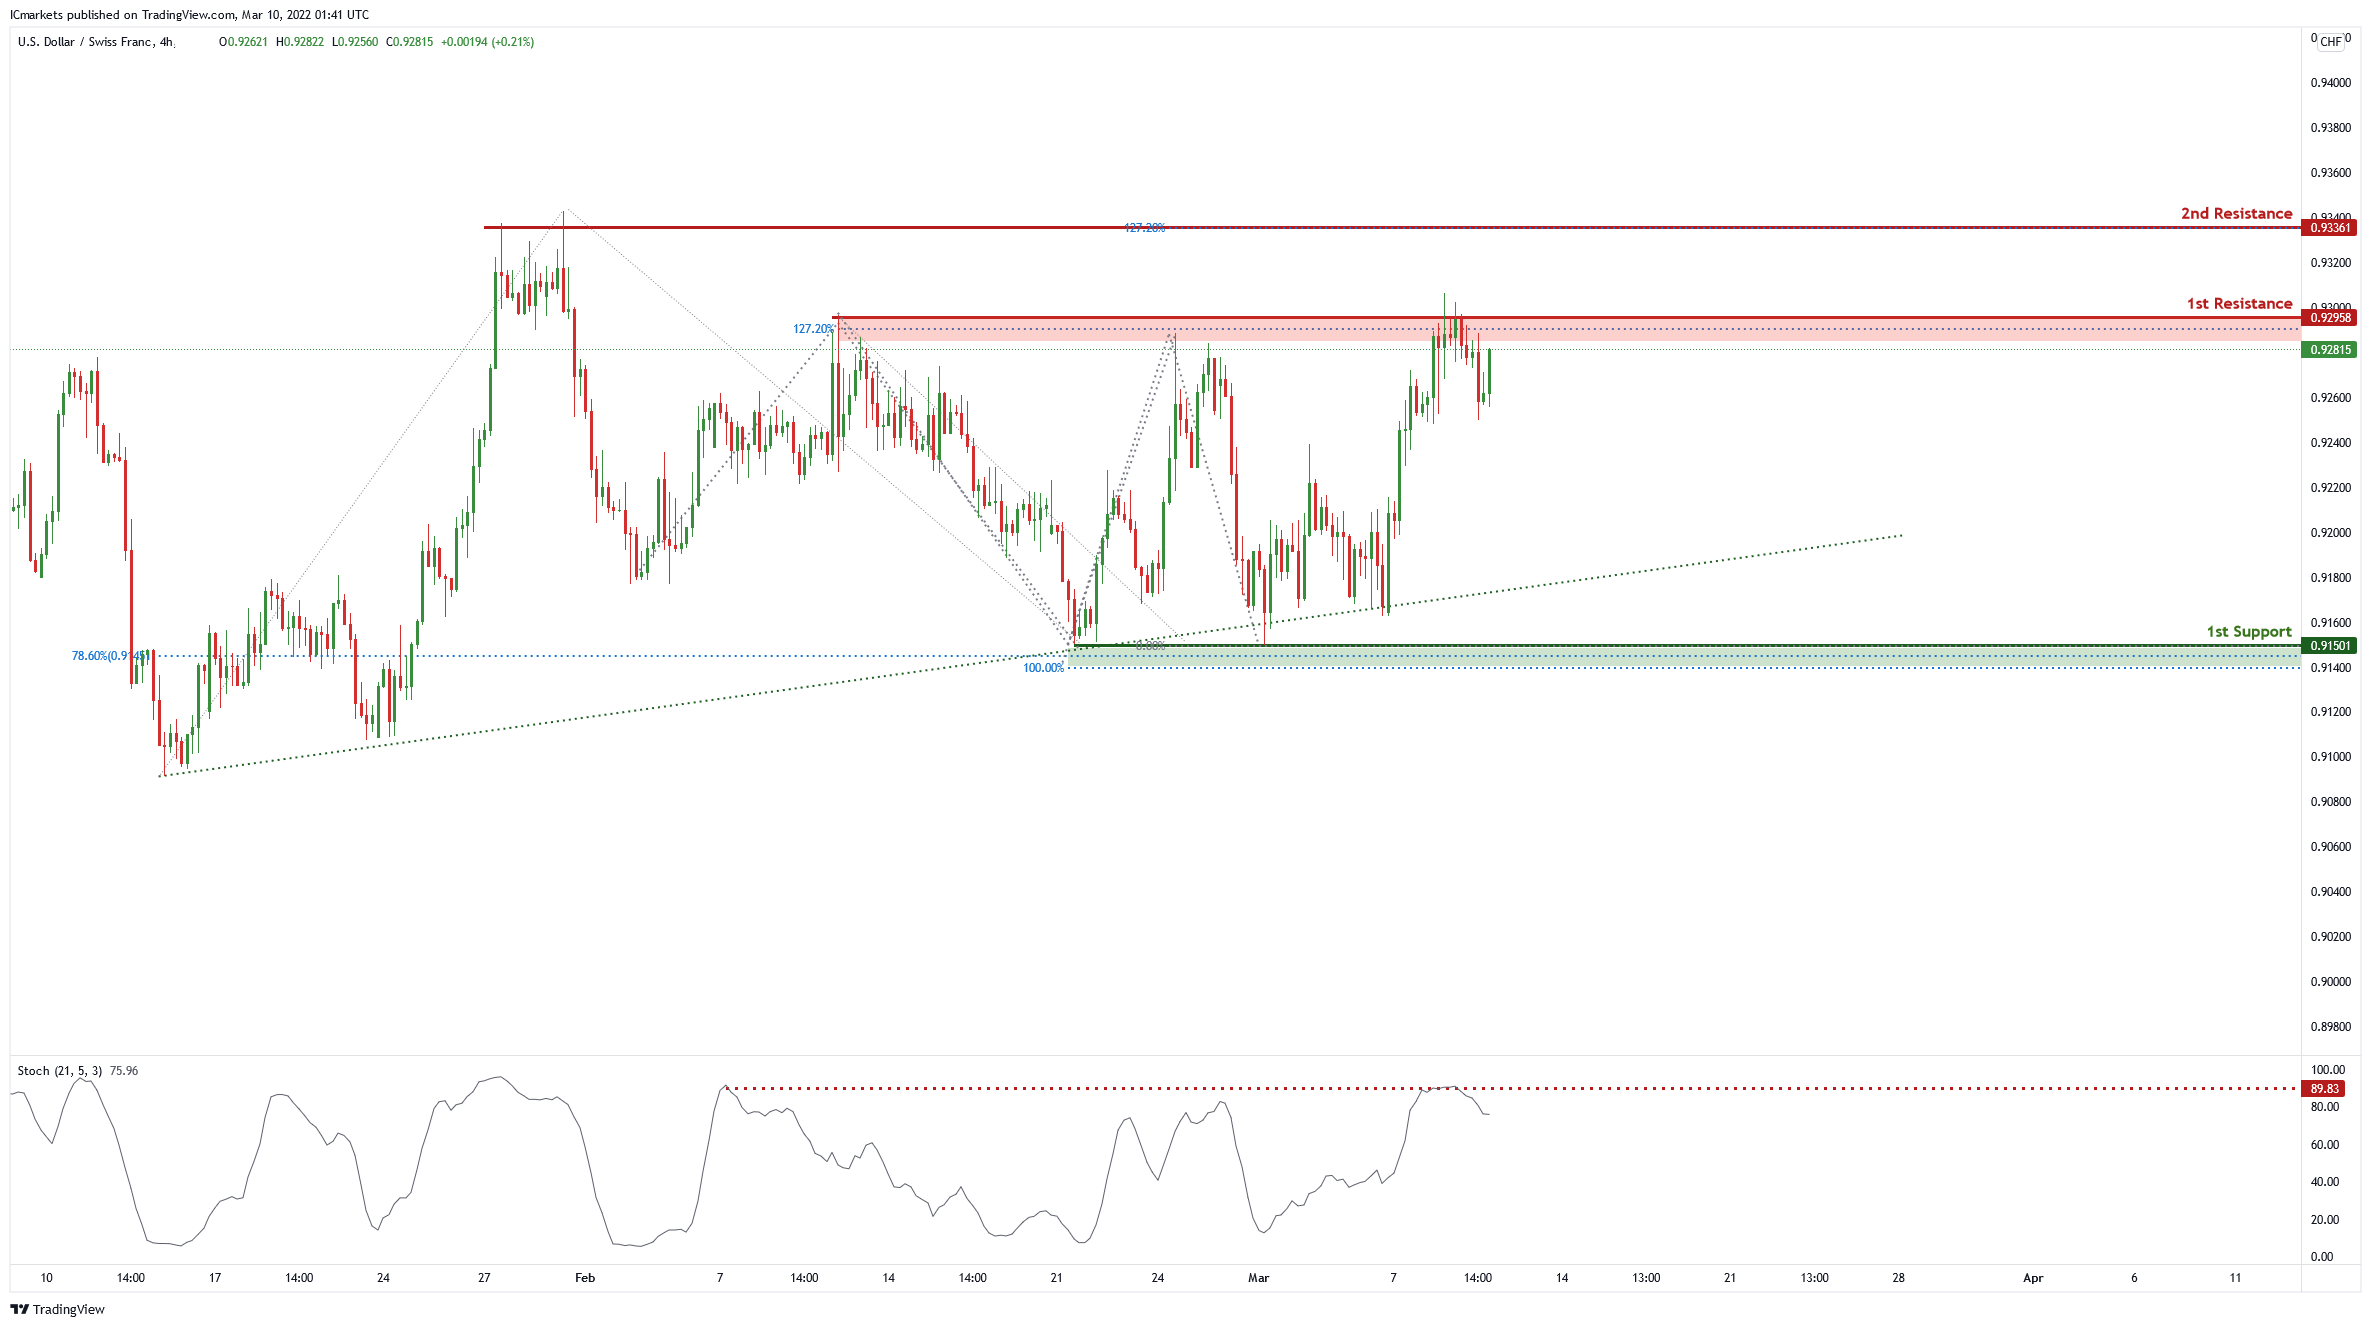
USD/CHF:
On the H4, price is abiding by an ascending trendline and near 1st resistance level of 0.92833 in line with 127.2% Fibonacci projection . Price can potentially dip to the 1st support level of 0.91501 in line with 100% Fibonacci projection and 78.6% Fibonacci retracement. Our bearish bias is supported by a stochastic indicator as it is near the resistance level.
Areas of consideration
- 1st resistance level at 0.92833
- 1st support level at 0.91501
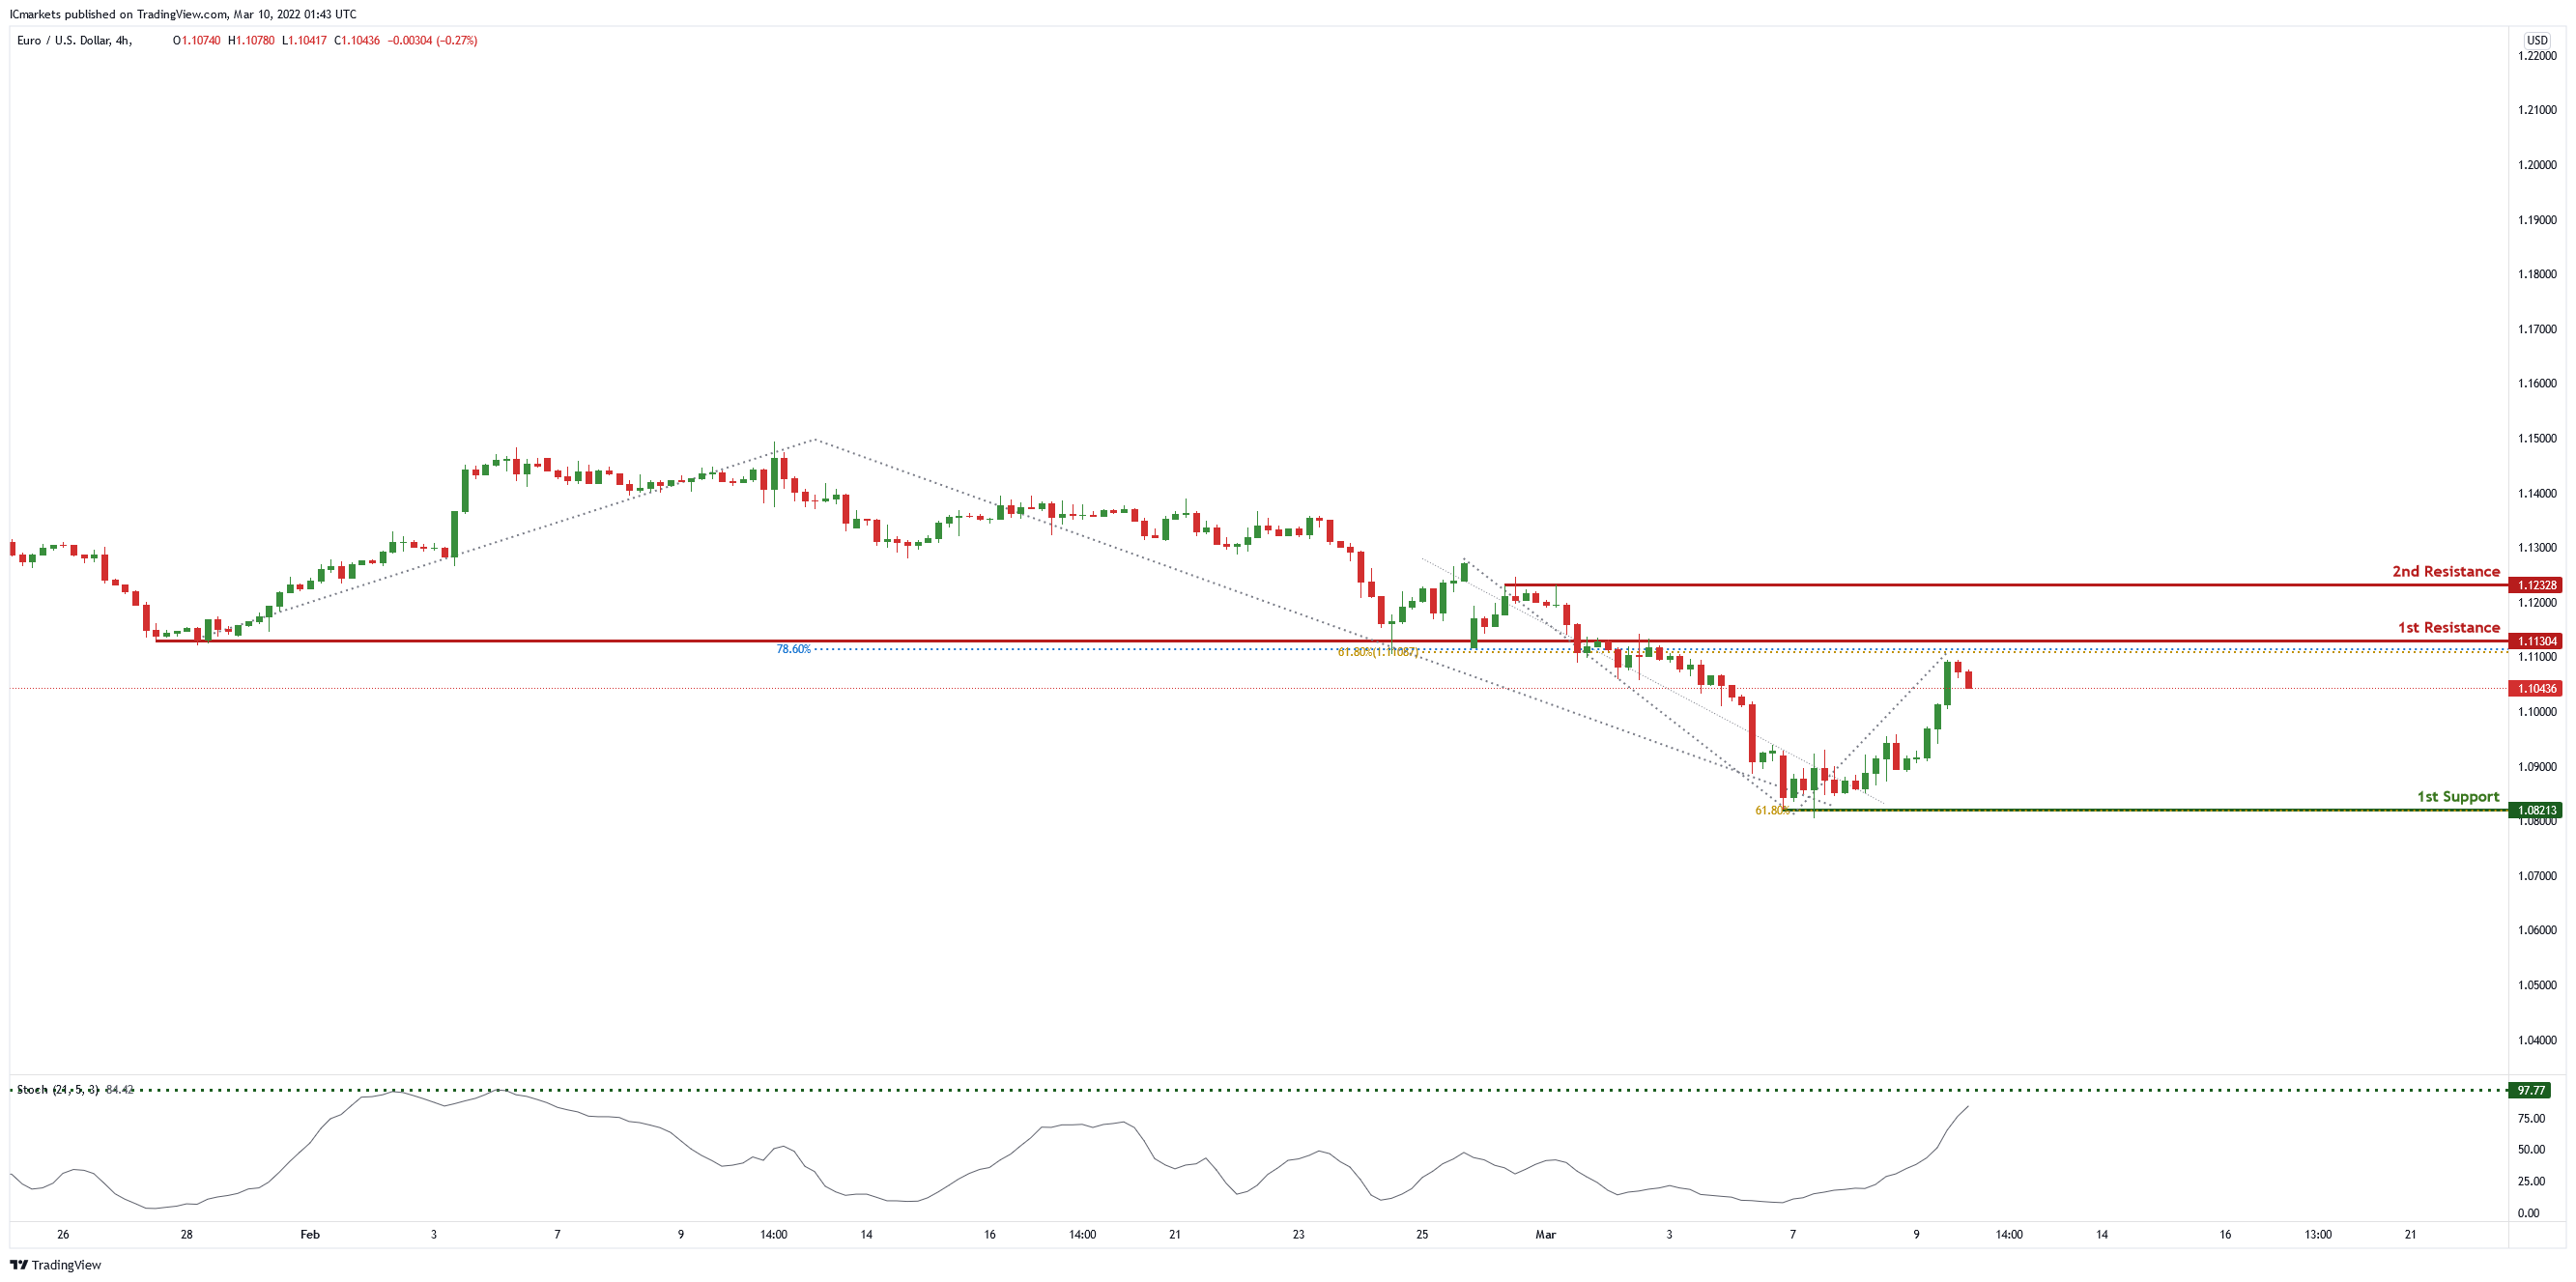
EUR/USD :
On the H4 price is near 1st resistance level of 1.11304 in line with 78.6% Fibonacci projection and 61.8% Fibonacci retracement. Price can potentially dip to the 1st support level which is the graphical swing low and 61.8% Fibonacci projection. Our bearish bias is supported by the stochastic indicator as it is the graphical swing low and 61.8% Fibonacci projection
Areas of consideration :
- H4 1st resistance at 1.11304
- H4 1st support at 1.08213
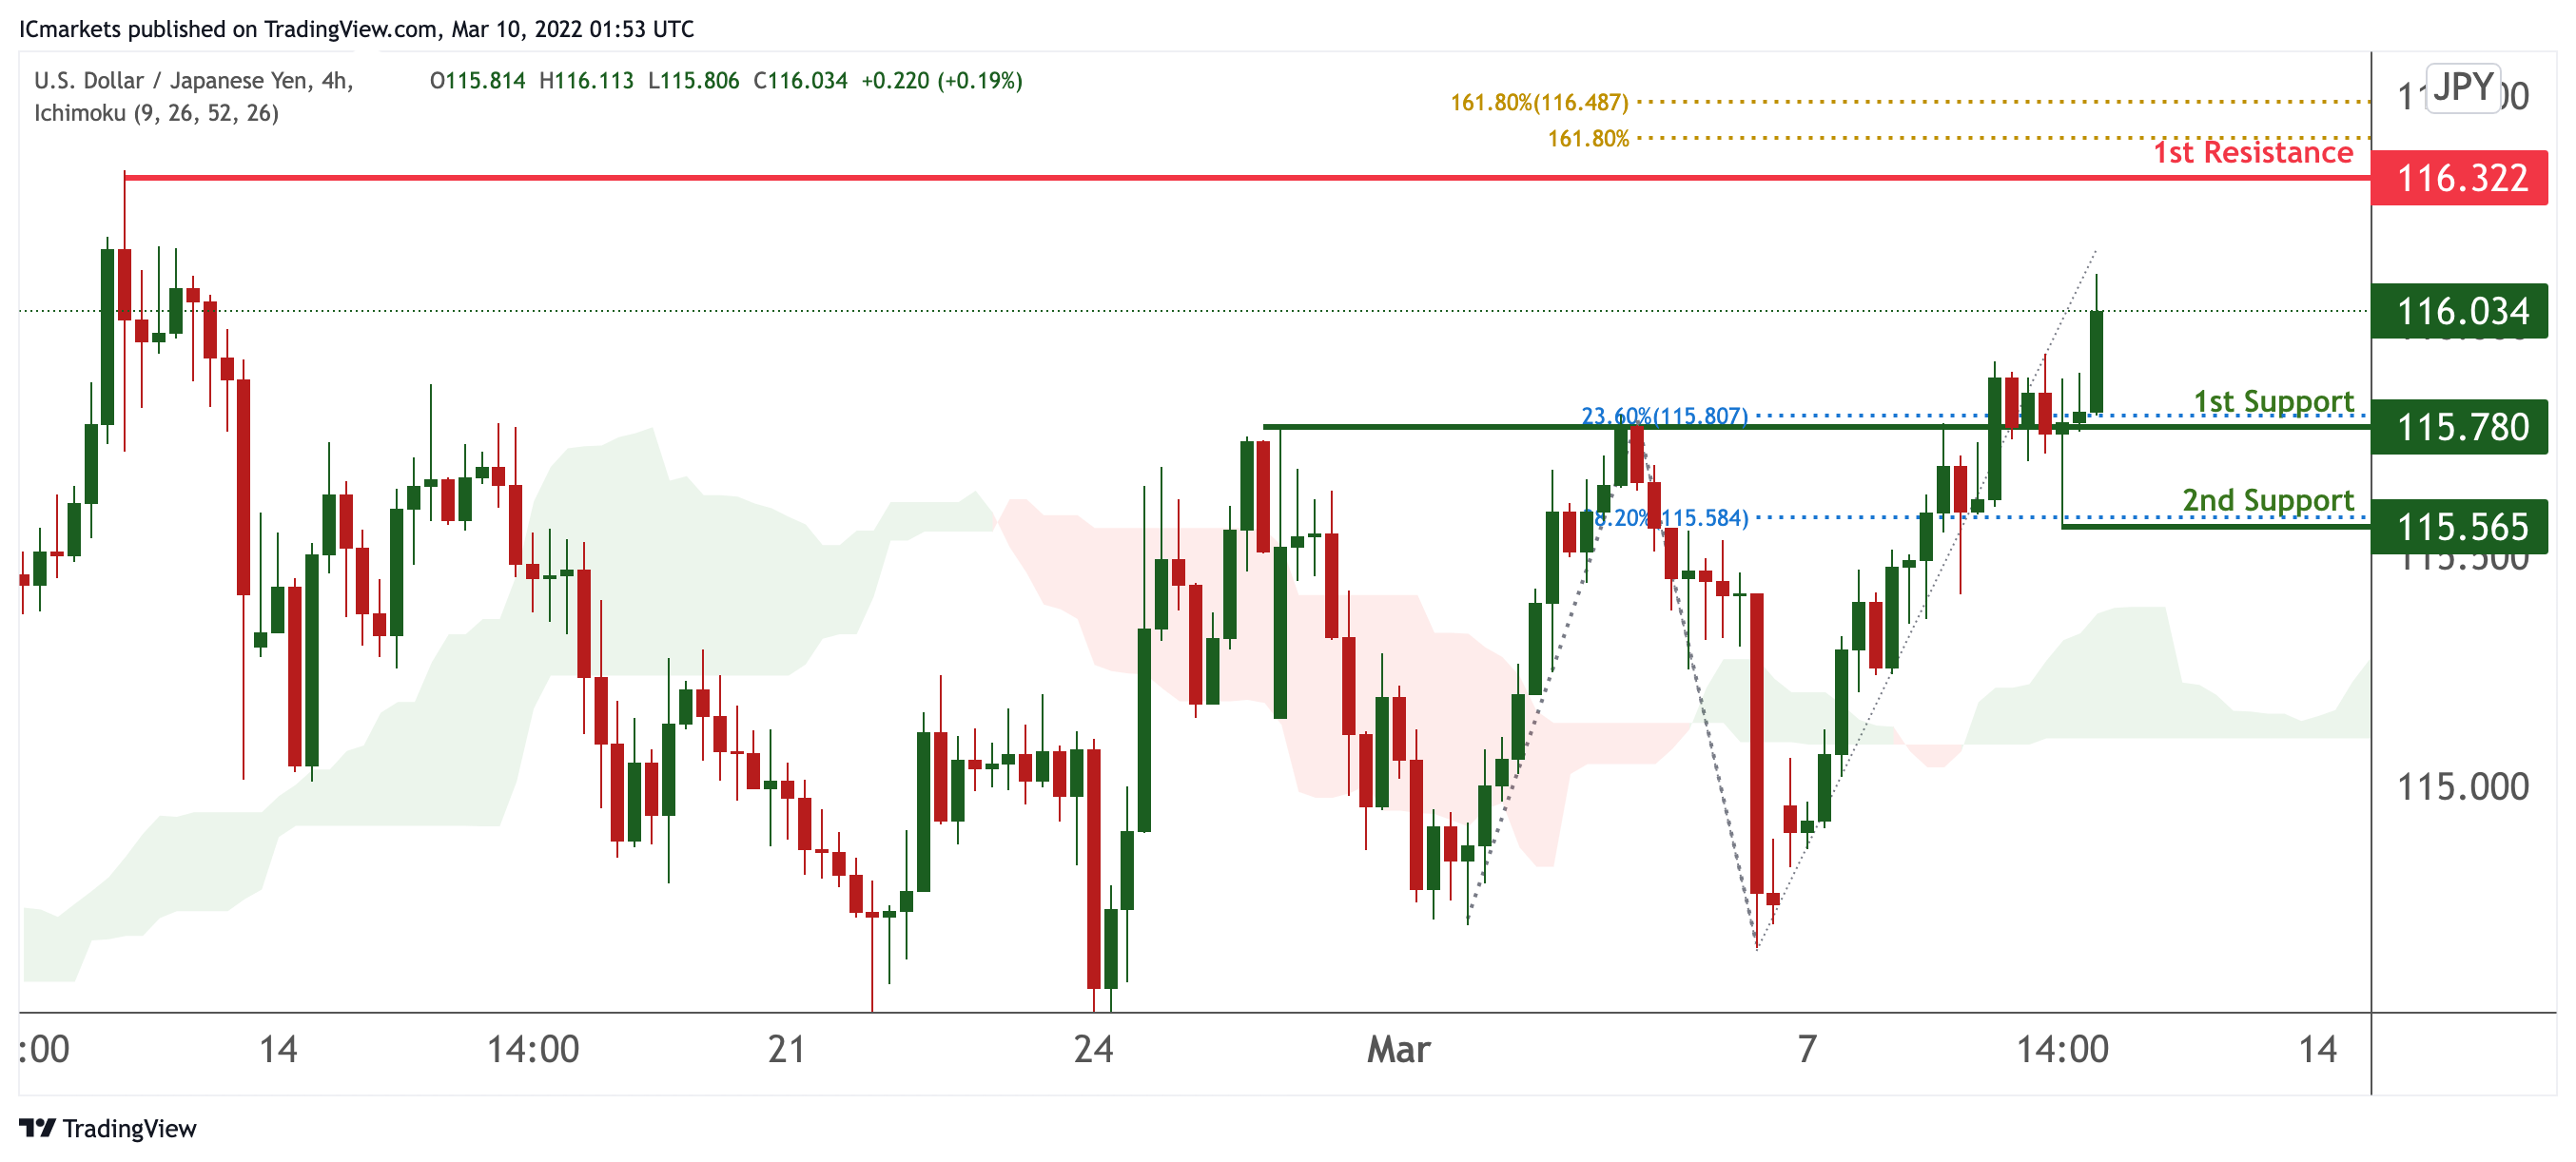
USD/JPY:
On the H4 timeframe, prices are on bullish momentum. We see the potential for further bullish momentum from our 1st support at 115.780 in line with 23.6% Fibonacci retracement and 100% Fibonacci extension towards our 1st resistance at 116.322 in line with 161.8% Fibonacci extension and 161.8% Fibonacci Projection. Our bullish bias is further supported by prices trading above our ichimoku cloud support. Alternatively, prices may dip towards our 2nd support at 115.565 in line with 38.2% Fibonacci retracement.
Areas of consideration:
- H4 time frame, 1st resistance at 116.322
- H4 time frame, 1st support at 115.780
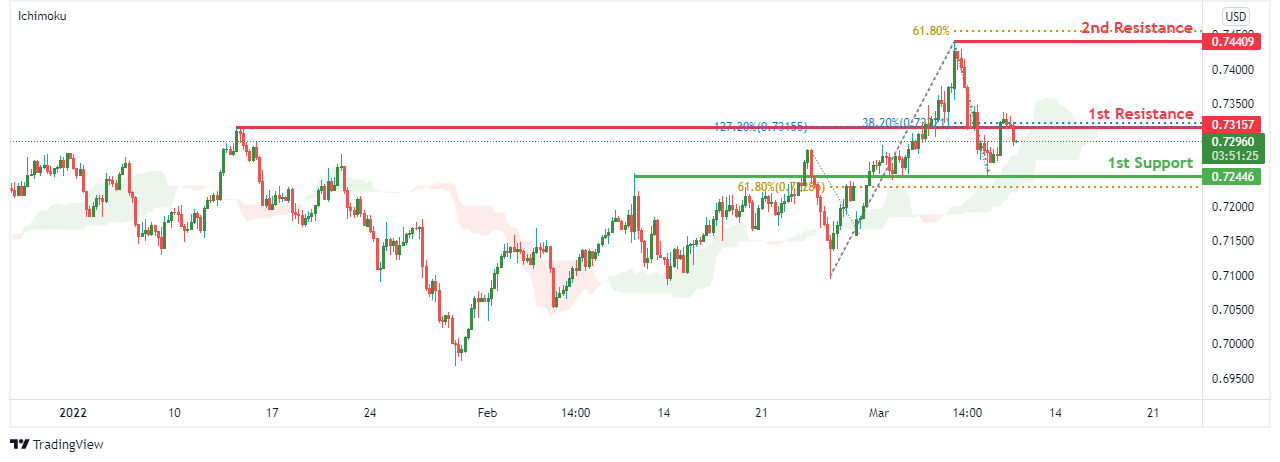
AUD/USD:
On the H4 timeframe, price is abiding by an ascending trendline. We see the potential for further bullish momentum from our 1st resistance at 0.73157 in line with 38.2% Fibonacci retracement and 127.2% Fibonacci extension towards our 2nd resistance at 0.74409 which is in line with 61.8% Fibonacci projection. Our bullish bias is further supported by prices trading above the Ichimoku cloud. Alternatively, prices from 1st resistance might dip to 1st support at 0.72446 with a 61.8% Fibonacci retracement.
Areas of consideration :
- H4 1st support at 0.72446
- H4 1st resistance at 0.73157
NZD/USD:
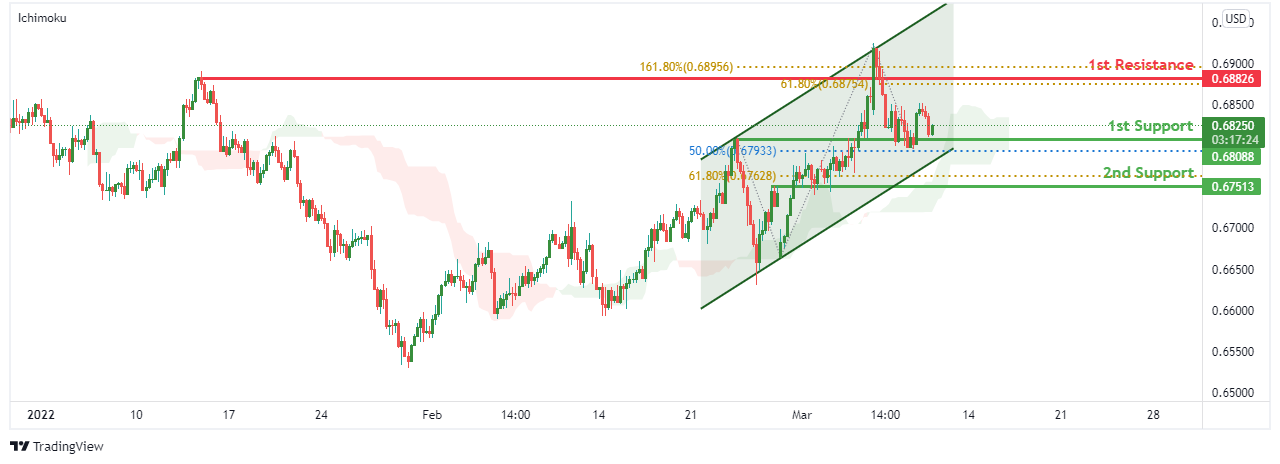
On the H4 chart, prices are abiding by the ascending channel. We see the potential for further bullish momentum from our 1st support at 0.68250 in line with 50% Fibonacci retracement towards our 1st resistance at 0.68826 with 61.8% Fibonacci retracement and 161.8% Fibonacci extension. Our bullish bias is further supported by prices trading above our ichimoku cloud support. Alternatively, prices may dip towards our 2nd support at 0.67513 in line with 61.8% Fibonacci retracement.
Areas of consideration:
- H4 time frame, 1st resistance at 0.68826
- H4 time frame, 1st support at 0.68250
USD/CAD:
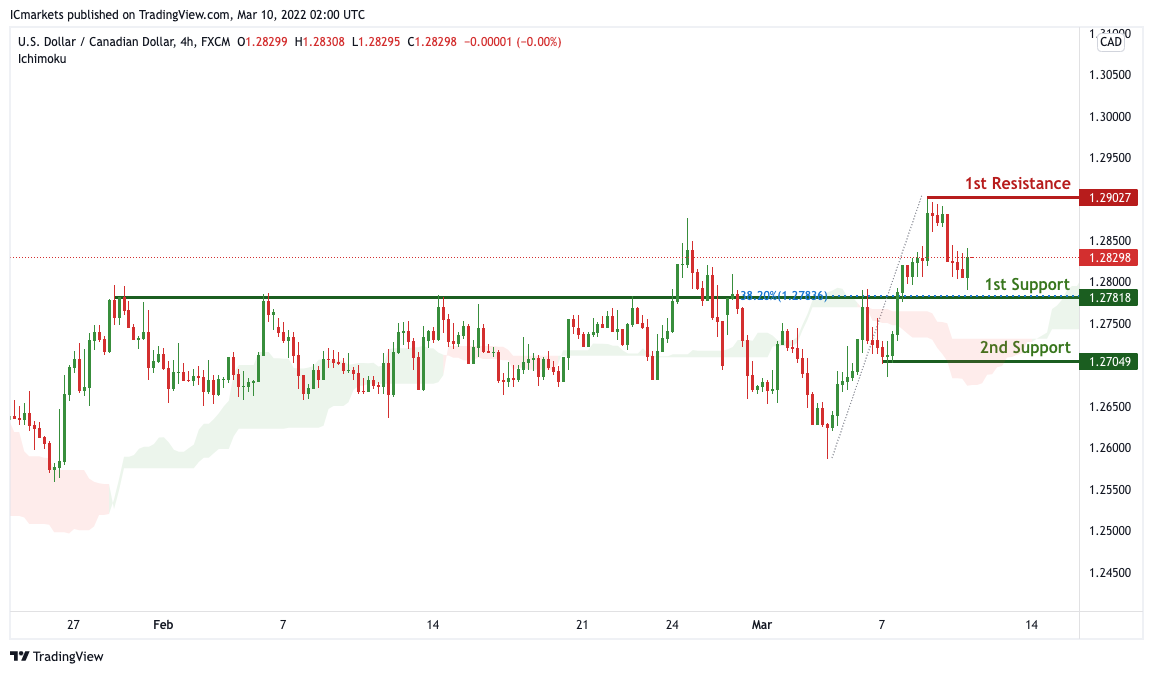
On the H4 timeframe, price is near 1st support level of 1.27818 in line with horizontal overlap support and 38.2% Fibonacci retracement. Price can potentially rise to the 1st resistance level of 1.29027 in line with the swing high resistanc. Alternatively, price may break 1st support and head for 2nd support at 1.27049 where the swing low support. Our bullsh bias is supported by how price is moving above the ichimoku cloud.
Areas of consideration:
- H4 time frame, 1st support at 1.27818
- H4 time frame, 1st resistance at 1.29027
OIL:
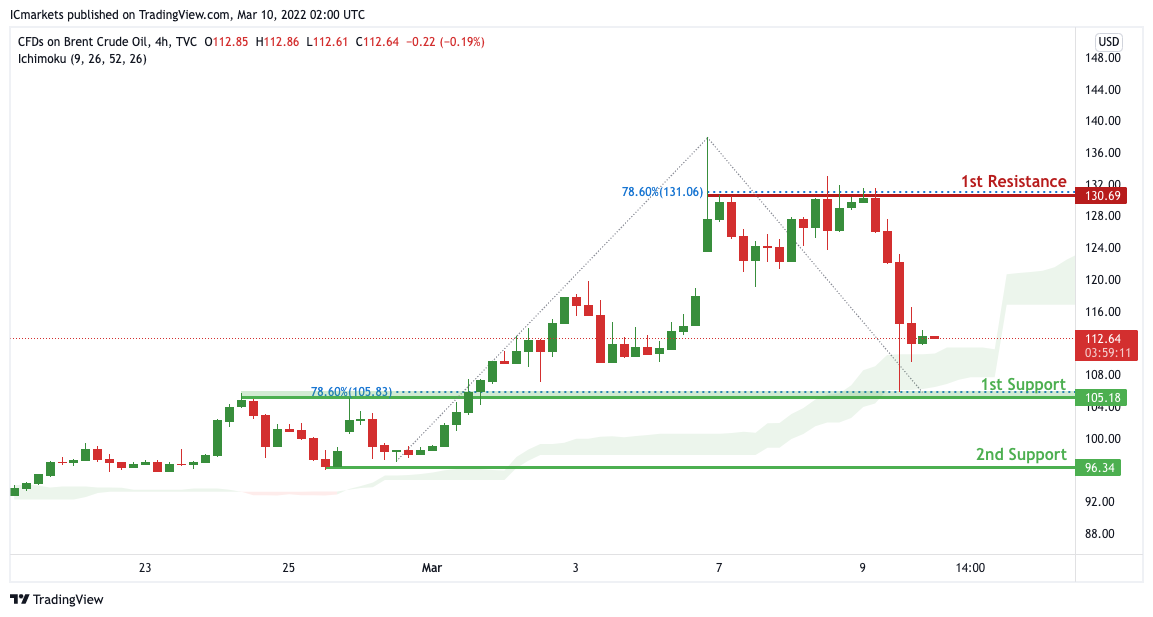
On the H4 timeframe, price is near 1st support level of 105.18 in line with horizontal overlap support and 78.6% Fibonacci retracement. Price can potentially rise to the 1st resistance level of 130.69 in line with the swing high resistance and 78.6% Fibonacci retracement. Alternatively, price may break 1st support and head for 2nd support at 96.34 where the swing low support. Our bullish bias is supported by how price is moving above the ichimoku cloud.
Areas of consideration:
- H4 time frame, 1st resistance of 130.69
- H4 time frame, 1st support of 105.18
Dow Jones Industrial Average:
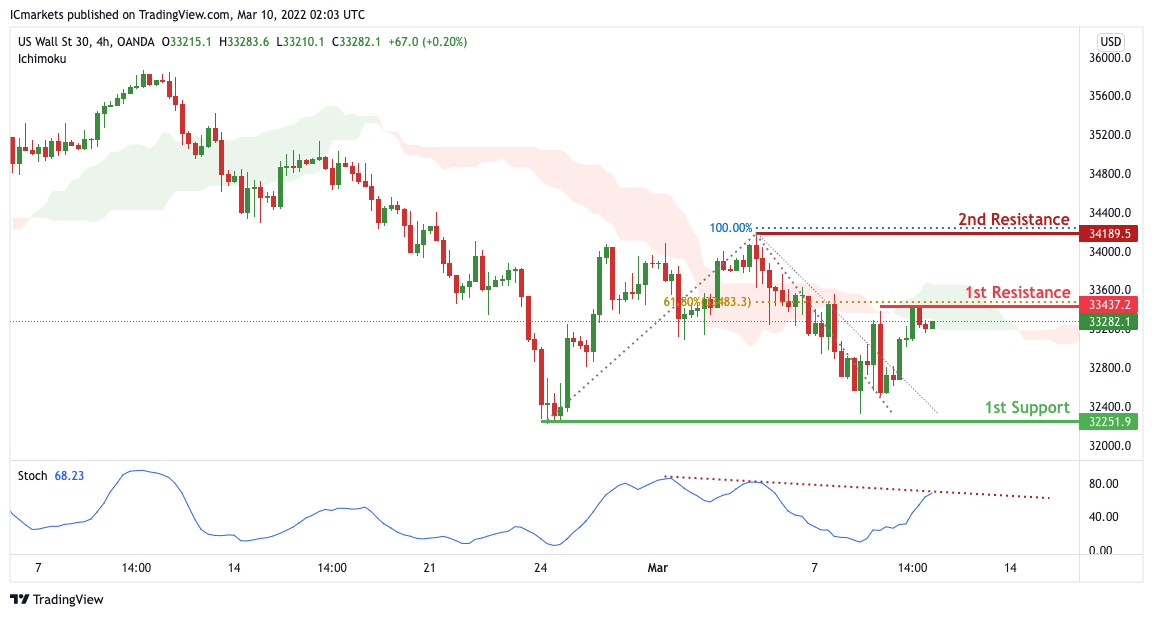
On the H4 timeframe, with price at the resistance of the ichimoku cloud, we have a bearish bias that price will drop from 1st resistance at 33437 in line with the 61.8% Fibonacci retracement to 1st support at 32251 in line with the swing low support .Alternatively, price may break pivot structure and head for 2nd support in line with the 100% Fibonacci projection. Our bearish bias is supported by how price is expected to reverse off the stochastics indicator.
Areas of consideration :
- H4 1st support at 32251
- H4 1st resistance at 33437
Can UK Data Provide Some Relief to Battered Sterling?
The pound has fallen victim to the market turmoil sparked by the Ukraine conflict, plunging more than 3.5% since late February when tensions with Russia started to rapidly escalate. Investors still expect that the Bank of England will go ahead with most of its planned rate hikes this year, but that’s likely to come at the expense of growth. Can the raft of economic indicators out of the UK on Friday (07:00 GMT) cast some positive light over the outlook?
Going from crisis to crisis
Having only just fully recovered from the pandemic-induced slump, the British economy is facing another crisis. The war in Ukraine has worsened Europe’s energy crunch, fuelling the surge in oil and gas prices. But unfortunately, the ripple effects go beyond the energy sector as raw material prices of everything from food to base metals are soaring as Western sanctions on commodity-rich Russia begin to bite on the rest of the world.
Although Britain is nowhere near as reliant on Russia for its energy needs as several Eurozone nations are, UK fuel prices are expected to skyrocket soon, exacerbating the squeeze on consumers, who will additionally be hit by higher national insurance contributions as of April. So far neither the government nor the Bank of England have indicated they are about to change their policy courses.
Is hawkish BoE adding to pound’s woes?
This could be why sterling has nosedived so much as investors think the BoE is headed for a policy mistake by tightening at a time when the growth outlook is fast deteriorating. Unlike the European Central Bank, which has signalled it is willing to overlook the jump in energy prices that are being driven by factors that are out of its control, the BoE will probably only pause its rate hike cycle once growth starts to significantly slow down.
While it’s true that the UK economy is a little more robust than the Eurozone’s at the moment, it’s unlikely to be as resilient as America’s during this crisis. Nevertheless, the latest economic pointers due on Friday might help ease some of the concerns if they show that 2022 got off to a solid start.
Modest GDP rebound anticipated for January
GDP is projected to have bounced back by 0.2% month-on-month in January after contracting by the same amount in December when Omicron restrictions were introduced. Such a figure would push up annual growth to 9.3% from 6.0%.
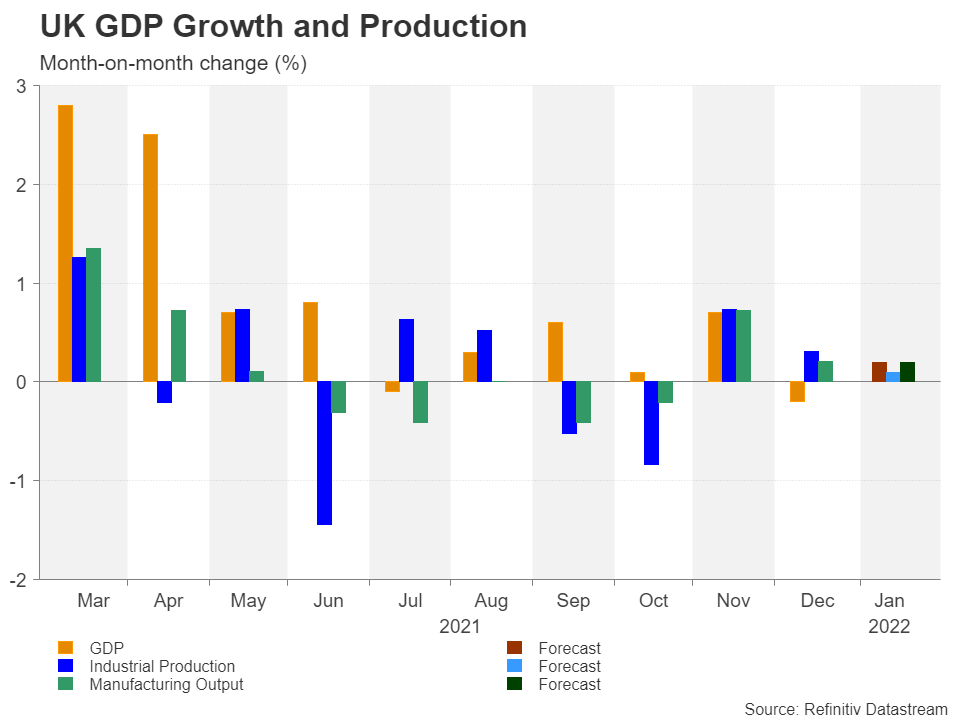
Industrial output on the other hand is expected to have grown by a paltry 0.1% m/m in January, driven mainly by the manufacturing sector, which is forecast to have expanded by 0.2%.
Other figures to be released will include the trade balance and construction output for the same period.
Pound’s fate tied to Ukraine war
It’s hard to see the data having much of an impact on cable while tensions over Ukraine remain so heightened. At best, stronger-than-expected numbers might provide some much-needed support. In which case, the 123.6% Fibonacci extension of the December-January upleg could act as a crucial defence for halting further declines just above the $1.30 level at $1.3027.
If this support were to fail, the 138.2% and 161.8% Fibonacci extensions at $1.2942 and $1.2805, respectively, would next come into focus.
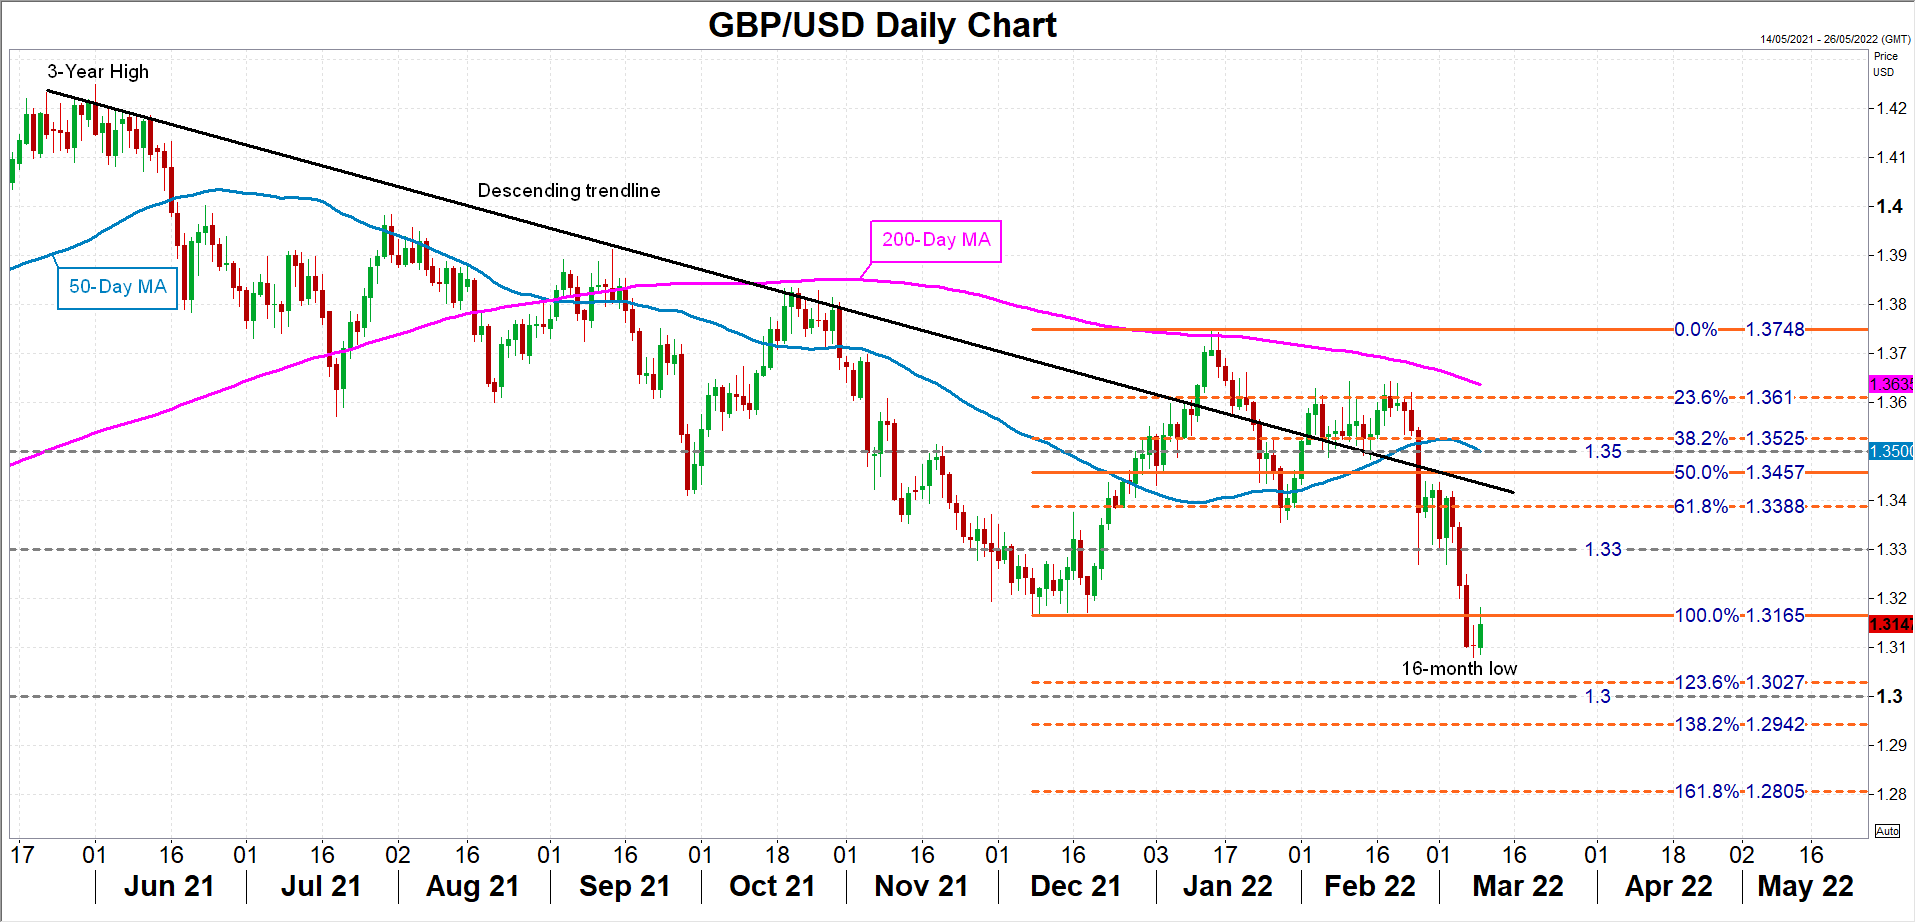
However, in the event that there is progress in the upcoming talks between the Ukrainian and Russian foreign ministers on Thursday, the pound would be poised for a decent rebound, potentially recovering towards the $1.3165 area initially, before testing the $1.33 handle.
In the bigger picture, though, sterling is likely to remain bearish as long as it’s trading below its long-term descending trendline, with not even BoE rate hikes expected to alter this outlook as long as war is raging in Eastern Europe.
AUD/USD Could Resume Increase Above 0.7350
Key Highlights
- AUD/USD started a steady increase above 0.7300.
- A key bullish trend line is forming with support near 0.7290 on the 4-hours chart.
- EUR/USD corrected higher above 1.0950, and GBP/USD consolidated near 1.3100.
- The US Consumer Price Index could jump 7.9% in Feb 2022 (YoY).
AUD/USD Technical Analysis
The Aussie Dollar remained well bid above 0.7200 against the US Dollar. AUD/USD climbed higher when majors like EUR/USD and GBP/USD declined heavily.
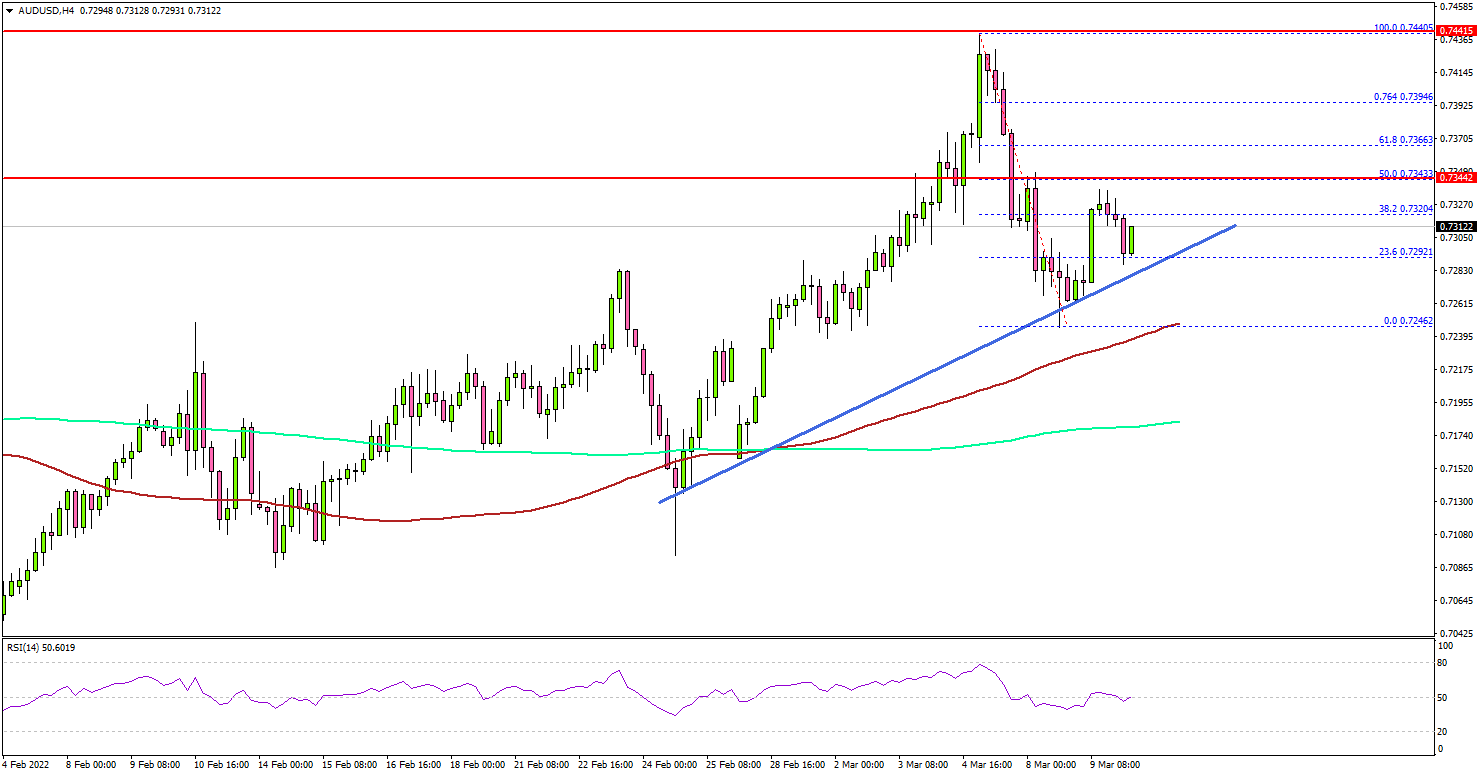
Looking at the 4-hours chart, the pair even surged above the 0.7400 level. It formed a high near 0.7440 and settled above the 100 simple moving average (red, 4-hours), and the 200 simple moving average (green, 4-hours).
Recently, there was a downside correction below the 0.7350 support. However, the pair found support near 0.7250 and stayed above the 100 simple moving average (red, 4-hours).
It is now recovering and trading above 0.7300. To continue higher, the pair must settle above the 0.7350 resistance. The next major resistance might be 0.7395 or 0.7400. It is near the 76.4% Fib retracement level of the recent decline from the 0.7440 high to 0.7246 low.
Any more gains might call for a new high above 0.7440. If not, the pair might start another decline below 0.7300. There is also a key bullish trend line forming with support near 0.7290 on the same chart.
A downside break below the trend line could push the pair towards 0.7250. The next major support sits near the 0.7165 level.
Looking at EUR/USD, the pair started an upside correction from 1.0800. Similarly, GBP/USD is slowly recovering above 1.3100.
Economic Releases
- ECB Interest Rate Decision - Forecast 0%, versus 0% previous.
- US Consumer Price Index for Feb 2022 (MoM) – Forecast +0.8%, versus +0.6% previous.
- US Consumer Price Index for Feb 2022 (YoY) – Forecast +7.9%, versus +7.5% previous.
- US Consumer Price Index Ex Food & Energy for Feb 2022 (YoY) – Forecast +6.4%, versus +6.0% previous.
Did EUR/USD Just Dead Cat Bounce?
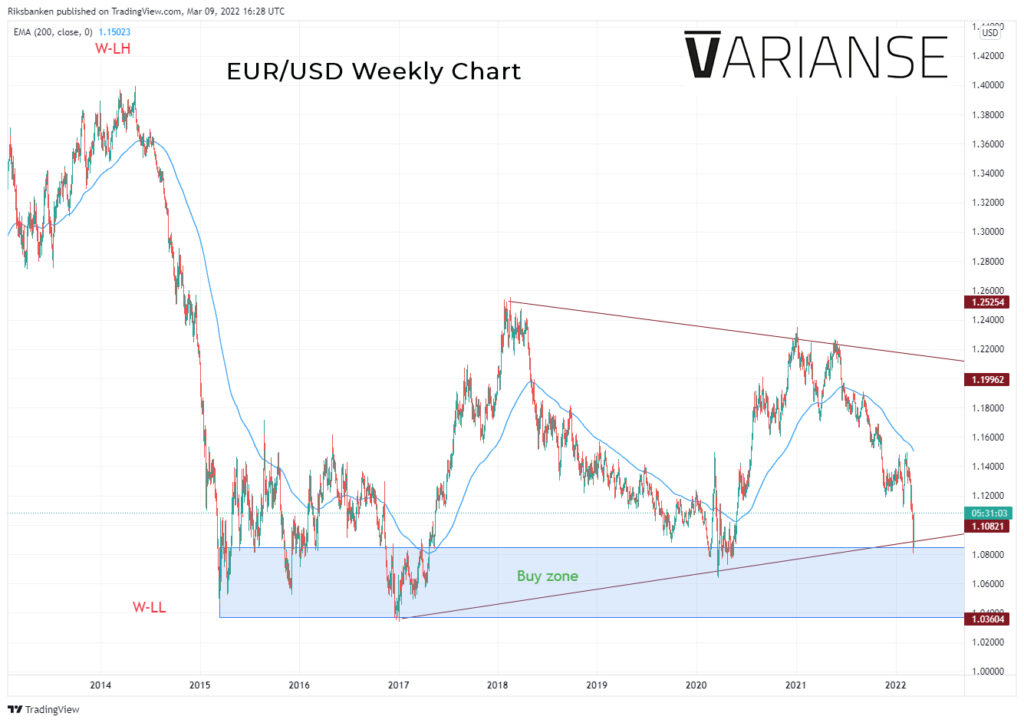
EUR/USD surged higher on Wednesday as the European Union (EU) discussed increased defence and energy sector spending ahead of the European Central Bank (ECB) interest rate decision on Thursday. The pair recently traded at 1.1083, representing a 1.7% gain on the day - its biggest daily percentage gain since 3 February 2016.
Long-term, 1.085 to 1.036 has certainly acted as a past buy zone. Furthermore, the latest look down and subsequent rise in EUR/USD solidifies a symmetrical triangle pattern post the 2015 price collapse, which leaves scope for further rises before any fall.
Still, it’s far too early to start speculating whether this represents the beginning of a big reversal in EUR/USD’s fortunes. Risk related to war in Ukraine remains acute and has a potential to escalate. Reprisals against the West for ratcheting up sanction against Russia are an immediate threat.
EUR/USD, despite Wednesday’s rally, remains down by c. 2.6% since the Ukraine conflict began on 24 September for good reason. Fears of further escalation only tell part of the story. Foreign exchange markets have yet to contend with the longer-term implications the conflict will have on the pair.
The ECB meeting on Thursday may provide the first window of opportunity for the central bank to discuss some of those implications. Will the ECB assess that the short-term inflationary impact of war trumps the long-term economic negatives?
Consensus doesn’t expect any interest rate change from the ECB. But it does see potential for a rejiggering of ECB asset purchases and communications distancing the timing of an interest rates hike. That said, comments from the succeeding ECB press conference are almost guaranteed to matter more.
Eco Data 3/10/22
[php_everywhere instance="1"]
Rising Recession Risk as Yet Another Supply Shock Hits
The war in Ukraine has added a big supply shock to a global economy where supply had not yet fully recovered from the previous supply shock related to the pandemic. On top of reduced labour force that contributed to widespread labour shortage, the world is now facing a reduction in the supply of another important input factor to production: commodities. With much of Russian and Ukrainian supply taken out of the equation in oil markets, many metal markets and grain markets, the world is facing a further shortage. Any companies having production in or sourcing components from Russia or Ukraine will also face new supply disruptions.
The result is clear: Inflation is moving even higher as we see with sharp increases in commodity prices. There is only one cure to it in the short term. As long as supply is reduced, demand has to come down. Otherwise there will continue to be too much demand relative to supply. That may very well require a recession in demand - and thus in the whole economy.
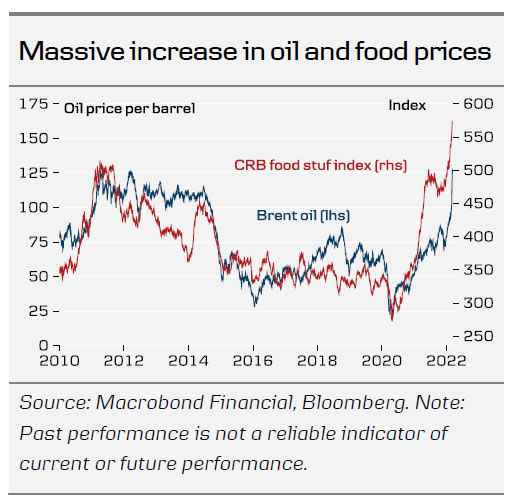
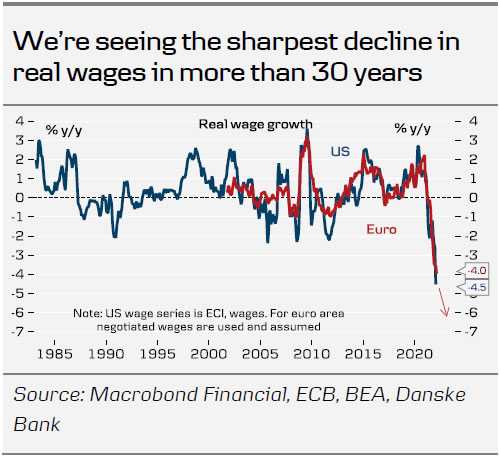
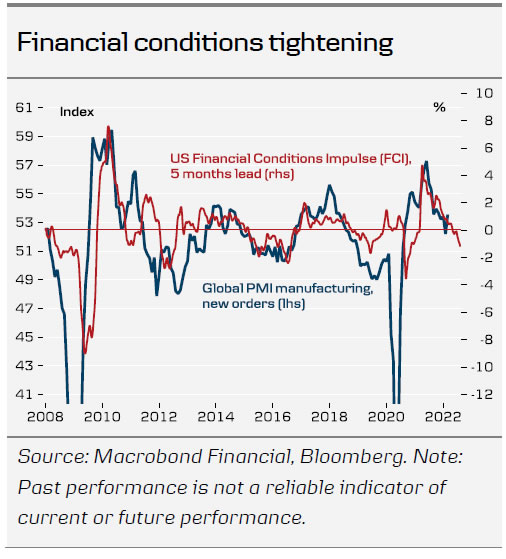
Some of the decline in demand will likely happen by itself. Businesses could put some planned investments on hold due to renewed uncertainty over the outlook. Significant financial tightening is taking place with credit spreads wider and equities sharply lower. Consumer demand is also taking a hit from eroded purchasing power due to the rise in inflation as not least energy and food prices move higher. In the short term, euro inflation could go up to 8-9%, which with would shave up to 6% off real wages. A similar situation is evident in the US. We are witnessing the biggest decline in real wages in more than 30 years. The rise is food prices is creating a global food crisis, which will have dire effects in many emerging markets and developing countries, many of which have still not yet recovered from the pandemic.
In order to reduce demand further to stem inflation pressures, central banks are also on course to tighten policy. The Fed has signalled a lift-off next week and more rate hikes are lined up for the rest of this year. We also expect ECB to raise rates in December, although it has become a closer call. The demand slowdown from the above mentioned factors may do the job for the ECB.
The bottom line is, we currently have significant headwinds to global growth that has increased the risk of recession significantly, especially in Europe. And it could be the case that a recession in demand is in fact needed to be more in line with a global supply that has been reduced and caused new shortages in key production inputs resulting in renewed sharp inflationary pressures. If we do indeed go into recession, we would expect it to be fairly short, as a public driven capex boom within energy sectors, both in oil and green investments, will underpin demand. This would also raise global oil supply in the medium term and energy prices could come down sharply again. China should recover on a 1-year horizon and we also see potential for pent-up demand among European consumers that could come back when the shock abates. The outlook is extremely blurred, though, and any projections have to be taken with a lot of caution. A lot depends on how the war in Ukraine unfolds, how far US and EU goes in terms of energy embargos, government action to mitigate the hit from higher commodity prices, how commodity prices respond and how businesses and consumers react to all this. We are (again) unchartered territory and the crystal ball has suddenly again become very foggy. Over the coming week we will outline some scenarios for where we see the world economy and financial markets evolving based on a different set of assumptions for how the war develops and commodity markets develop. Stay tuned.
Sunset Market Commentary
Markets
What a difference a day makes. Yesterday, the US announcing a ban on the import of fossil energy from Russia still caused some caution on US equity markets. Today, investors apparently concluded that this action might be the harbinger of at least a pause in the retaliatory dynamics between Russia and the West. The astonishing commodity rally finally slowed. At $122 p/b or $1230 p/bushel the likes of brent oil, wheat and other commodities for sure aren’t cheap and still profoundly erode consumers’ disposable income. Even so, the pause was enough for dip-buyers to return to equity markets. Whether this move will endure given the potential negative impact of the ‘commodity tax’ on growth remains an open question. Whatever, European indices are recovering up to 5.0%+. US indices, which suffered less of late, open with gains of up to 2.2% (Nasdaq). Earlier this week, core yields rebounded as rising in inflation expectations outpaced to decline in real yields due to broad risk-aversion. Today, yields are extending their march north but current move is driven by a rebound in real yields. Inflation expectations are stabilizing (US) or easing modestly (EMU). German yields are gaining across the curve (2-y +10 bps; 5-y + 8.5 bps; 30-y +9.5 bps). The bund-swap spread narrows. Yesterday, intra-EMU spreads narrowed after reports on a new EU funding plan. This trend continues today despite higher core yields. The 10-y spread of Greece versus Germany eases another 6 bps. The Italian spread narrows of 4 bps. European investors now are looking forward to tomorrow’s ECB meeting for clues on the ECB’s anti-inflation tactics. US yields are rising between 3.75 bps (30-y) and 7.5 bps (5-y) ahead of tomorrow’s US February CPI release. Later today, the US Treasury will sell $34 bln of 10-y Notes. Yesterday’s 3-year action only drew mediocre investor interest despite recent rise in yield.
On FX, currencies that suffered most from the Ukraine crisis also enjoyed further relief today. EUR/USD regained the 1.10 barrier (1.1035) after it filled bids just north of north of 1.08 only two days ago. The single currency also rebounds sharply against the safe havens with EUR/CHF trading at 1.024 and EUR/JPY jumping to the 127.75 area. The TW DXY index is sliding from 99+ levels to currently 98.15. CE currencies are also extending yesterday’s comeback, profiting for a combination of persistent CB support (interest rates and potential FX interventions), a better regional/global risk sentiment and the potential perspective of coordinated EU support. The forint, the Czech koruna and the zloty are strengthening respectively to EUR/HUF 378, EUR/CZK 25.20 and EUR/PLN 4.80. Sterling is gaining against the dollar (1.3175), but eases further against the euro (EUR/GBP 0.8385) even as markets again embrace the idea of more aggressive BoE tightening to address inflationary risks.
News Headlines
Hungarian inflation in February quickened 1.1% m/m, faster than the 0.8% expected but slower than the 1.4% in January. Food prices over the past month rose 2.1%, the Hungarian Central Statistical Office noted, though some subcomponents were cheaper M/M due to the price caps imposed by the government. Consumer durables were 0.7% more expensive, services 0.7%. General prices rose 8.3%Y/Y (8.1% expected) – the fastest since August 2007. Food surged 11.3% y/y; motor fuel prices 18.7%. Services charges were up by 5.5% and consumer durables 8.3%. The Hungarian forint strengthened today even as inflation in the future is bound to soar even further amid spiraling commodity prices and earlier forint depreciation. The move was mainly driven by strong risk-on. EUR/HUF retreated from 387.8 to 378.4. The central bank will decide tomorrow on its one-week deposit rate, a tool aimed at supporting the forint in times of stress. Consensus expects an increase to 6% from 5.35%.
Italy’s statistics bureau said the country’s economic growth is already affected by “price shock on energy compared to the base scenario”. The toll is estimated at 0.7% and follows a probable cut in consumption by families. Italy started the year on soft footing industrially as well. Production fell a more than expected 3.4% in January, hurt by the last wave of pandemic restrictions.
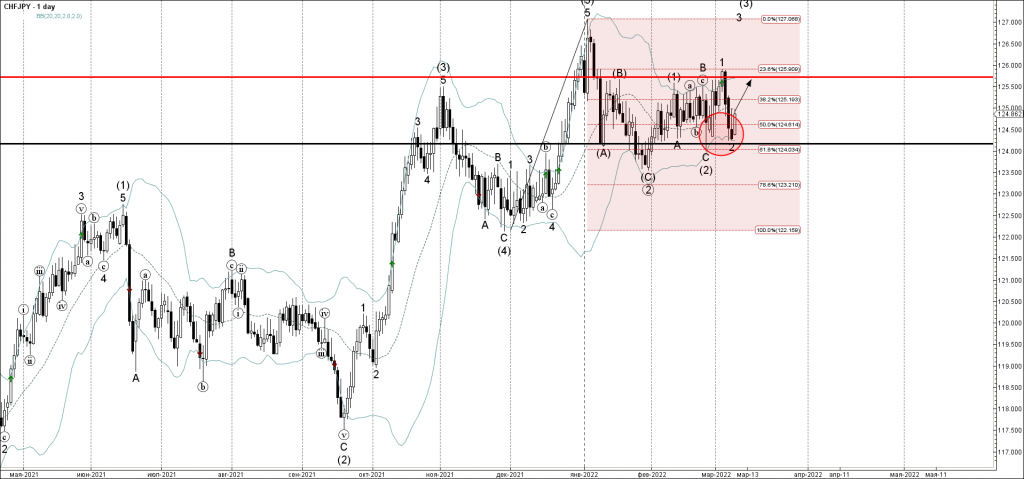
CHFJPY Wave Analysis
- CHFJPY reversed from support area
- Likely to rise to resistance level 125.70
CHFJPY currency pair recently reversed up from the support area located between the key support level 124.00 (which has been reversing the price from the start of February) and the lower daily Bollinger Band.
The upward reversal from this support area stopped the previous short-term correction 2 of the higher order impusle wave (3).
CHFJPY can be expected to rise further toward the next resistance level 125.70 (which has been reversing the price from Janaury).
Dow Jones Wave Analysis
- Dow Jones reversed from support area
- Likely to rise to resistance level 34000.00
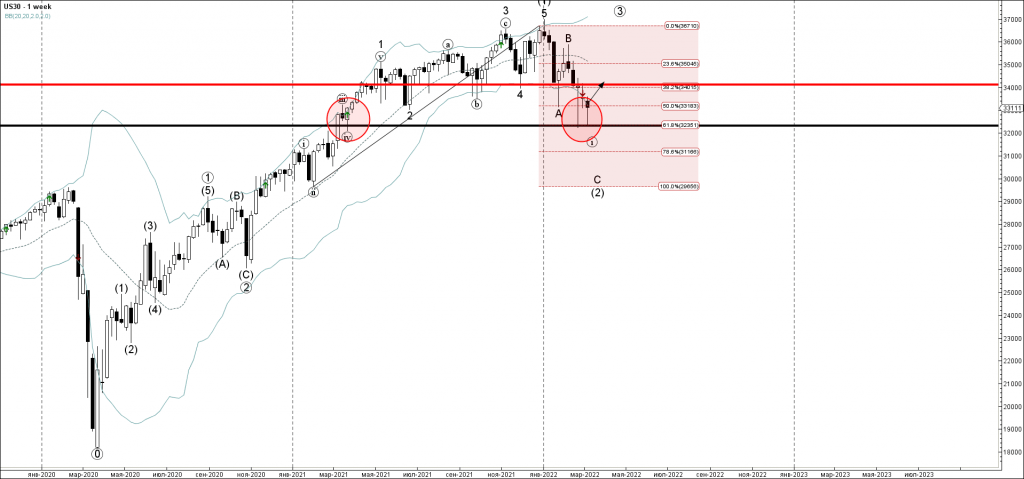
Dow Jones index recently reversed up from the support zone set between the strong support level 32325.00 (which has been reversing the price from the start of 2021), 61.8% Fibonacci correction of the upward impulse from lasy year and the lower weekly Bollinger Band.
The upward reversal from this support area will most likly create the weekly Hammer – similar to how it made it last month.
Give the multi-year uptrend – Dow Jones can be expected to rise further toward the next resistance level 34000.00 (former strong support from the middle of July).