Sample Category Title
(ECB) Monetary policy decisions
The Russian invasion of Ukraine is a watershed for Europe. The Governing Council expresses its full support to the people of Ukraine. It will ensure smooth liquidity conditions and implement the sanctions decided by the European Union and European governments. The Governing Council will take whatever action is needed to fulfil the ECB's mandate to pursue price stability and to safeguard financial stability.
Asset purchase programme (APP)
Based on its updated assessment and taking into account the uncertain environment, the Governing Council today revised the purchase schedule for its APP for the coming months. Monthly net purchases under the APP will amount to €40 billion in April, €30 billion in May and €20 billion in June. The calibration of net purchases for the third quarter will be data-dependent and reflect its evolving assessment of the outlook. If the incoming data support the expectation that the medium-term inflation outlook will not weaken even after the end of our net asset purchases, the Governing Council will conclude net purchases under the APP in the third quarter. If the medium term inflation outlook changes and if financing conditions become inconsistent with further progress towards our two per cent target, we stand ready to revise our schedule for net asset purchases in terms of size and/or duration.
The Governing Council also intends to continue reinvesting, in full, the principal payments from maturing securities purchased under the APP for an extended period of time past the date when it starts raising the key ECB interest rates and, in any case, for as long as necessary to maintain favourable liquidity conditions and an ample degree of monetary accommodation.
Key ECB interest rates
The interest rate on the main refinancing operations and the interest rates on the marginal lending facility and the deposit facility will remain unchanged at 0.00%, 0.25% and -0.50% respectively.
Any adjustments to the key ECB interest rates will take place some time after the end of the Governing Council's net purchases under the APP and will be gradual. The path for the key ECB interest rates will continue to be determined by the Governing Council's forward guidance and by its strategic commitment to stabilise inflation at two per cent over the medium term. Accordingly, the Governing Council expects the key ECB interest rates to remain at their present levels until it sees inflation reaching two per cent well ahead of the end of its projection horizon and durably for the rest of the projection horizon, and it judges that realised progress in underlying inflation is sufficiently advanced to be consistent with inflation stabilising at two per cent over the medium term.
Pandemic emergency purchase programme (PEPP)
In the first quarter of 2022, the Governing Council is conducting net asset purchases under the PEPP at a lower pace than in the previous quarter. It will discontinue net asset purchases under the PEPP at the end of March 2022.
The Governing Council intends to reinvest the principal payments from maturing securities purchased under the PEPP until at least the end of 2024. In any case, the future roll-off of the PEPP portfolio will be managed to avoid interference with the appropriate monetary policy stance.
The pandemic has shown that, under stressed conditions, flexibility in the design and conduct of asset purchases has helped to counter the impaired transmission of monetary policy and made the Governing Council's efforts to achieve its goal more effective. Within the Governing Council's mandate, under stressed conditions, flexibility will remain an element of monetary policy whenever threats to monetary policy transmission jeopardise the attainment of price stability. In particular, in the event of renewed market fragmentation related to the pandemic, PEPP reinvestments can be adjusted flexibly across time, asset classes and jurisdictions at any time. This could include purchasing bonds issued by the Hellenic Republic over and above rollovers of redemptions in order to avoid an interruption of purchases in that jurisdiction, which could impair the transmission of monetary policy to the Greek economy while it is still recovering from the fallout from the pandemic. Net purchases under the PEPP could also be resumed, if necessary, to counter negative shocks related to the pandemic.
Refinancing operations
The Governing Council will continue to monitor bank funding conditions and ensure that the maturing of operations under the third series of targeted longer-term refinancing operations (TLTRO III) does not hamper the smooth transmission of its monetary policy. The Governing Council will also regularly assess how targeted lending operations are contributing to its monetary policy stance. As announced, it expects the special conditions applicable under TLTRO III to end in June this year. The Governing Council will also assess the appropriate calibration of its two-tier system for reserve remuneration so that the negative interest rate policy does not limit banks' intermediation capacity in an environment of ample excess liquidity.
Liquidity lines with non-euro area central banks
In view of the highly uncertain environment caused by the Russian invasion of Ukraine and the risk of regional spillovers that could adversely affect euro area financial markets, the Governing Council decided to extend the Eurosystem repo facility for central banks (EUREP) until 15 January 2023. EUREP will therefore continue to complement the regular euro liquidity-providing arrangements for non-euro area central banks. Together, these form a comprehensive set of backstop facilities to address possible euro liquidity needs in the event of market dysfunctions outside the euro area that could adversely affect the smooth transmission of the ECB's monetary policy. Requests from non-euro area central banks for individual euro liquidity lines will be assessed by the Governing Council on a case-by-case basis.
***
The Governing Council stands ready to adjust all of its instruments, as appropriate, to ensure that inflation stabilises at its 2% target over the medium term.
The President of the ECB will comment on the considerations underlying these decisions at a press conference starting at 14:30 CET today.
GBP/USD Outlook: Recovery Loses Traction, Keeping in Play Risk of Bearish
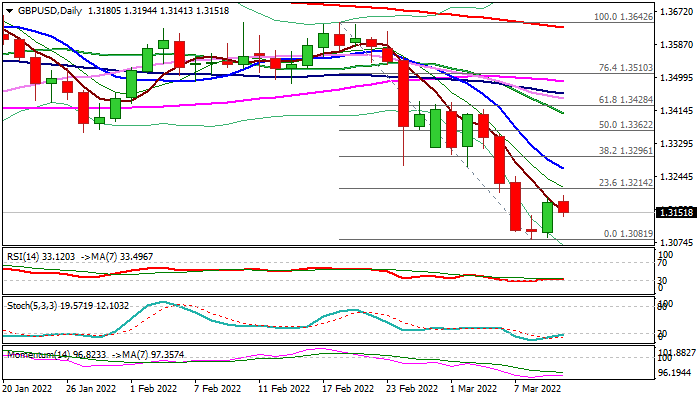
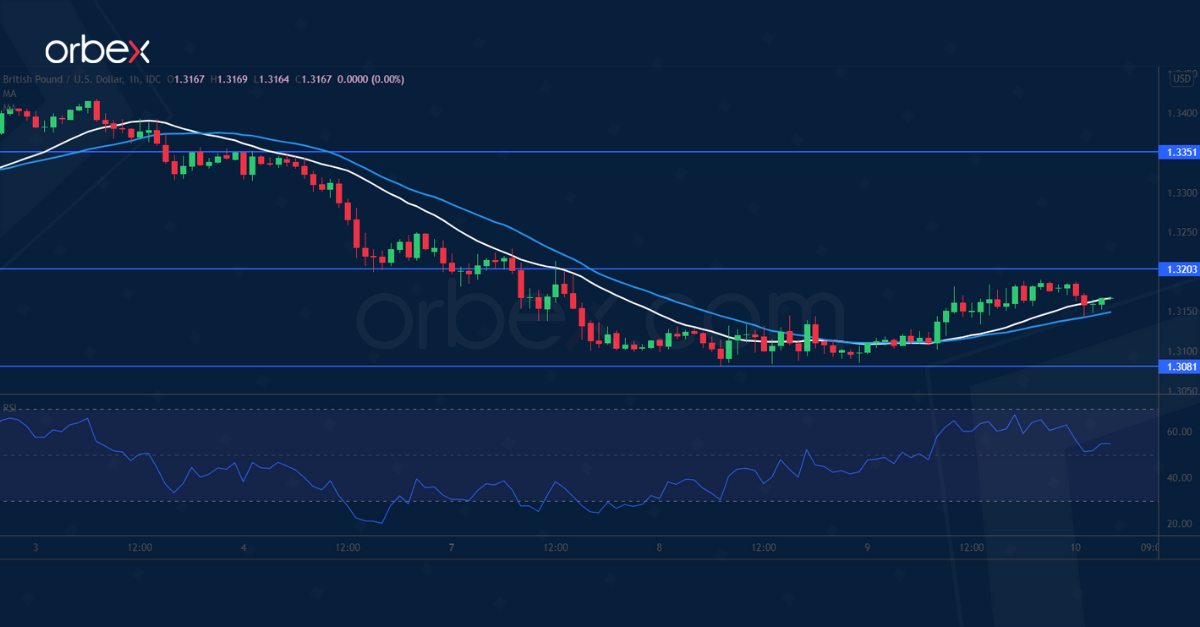
Cable eases on Thursday following repeated rejection on approach to 1.3200 barrier, signaling that fresh bulls might be running out of steam.
Initial signal of reversal on formation of Doji reversal pattern failed to get a confirmation on extension above 1.3214 (Fibo 23.6% of 1.3642/1.3081 bear-leg), warning that recovery was short-lived and larger bears are about to re-take full control.
Daily studies support this scenario as 14-d momentum remains deeply in the negative territory and full bearish setup of daily MA’s stays intact, however, bears need to register weekly close below key supports at 1.3164/20 (Fibo 38.2% of 1.1409/1.4249 / cracked 200WMA) to confirm bearish stance generate initial signal of bearish continuation.
Violation of new multi-month low at 1.3081 (the lowest since Nov 2020) would open way towards psychological 1.30 support and 1.2829 (50% retracement of 1.1409/1.4249) in extension.
Initial resistances lay at 1.3194/1.3214, followed by falling 10DMA (1.3265), but only sustained break above former strong support at 1.3300 zone (broken Fibo 76.4% of 1.3161/1.3748 / Fibo 38.2% of 1.3642/1.3081 bear-leg) would sideline larger bears.
Res: 1.3194; 1.3214; 1.3265; 1.3300.
Sup: 1.3124; 1.3081; 1.3000; 1.2950.
The US Won’t allow crypto to be used as shadow business
Bitcoin soared 8.8% on Wednesday, ending the day around $41.9K. Apparently, the benchmark cryptocurrency experienced clear problems with growth above $42K. On Thursday morning we see an equally strong reversal move back to $39K. As a result, Bitcoin lost 5.6% in 24hours Ethereum – 4.8%, other leading altcoins from the top ten are declining from 1% (Terra) to 7.2% (Avalanche).
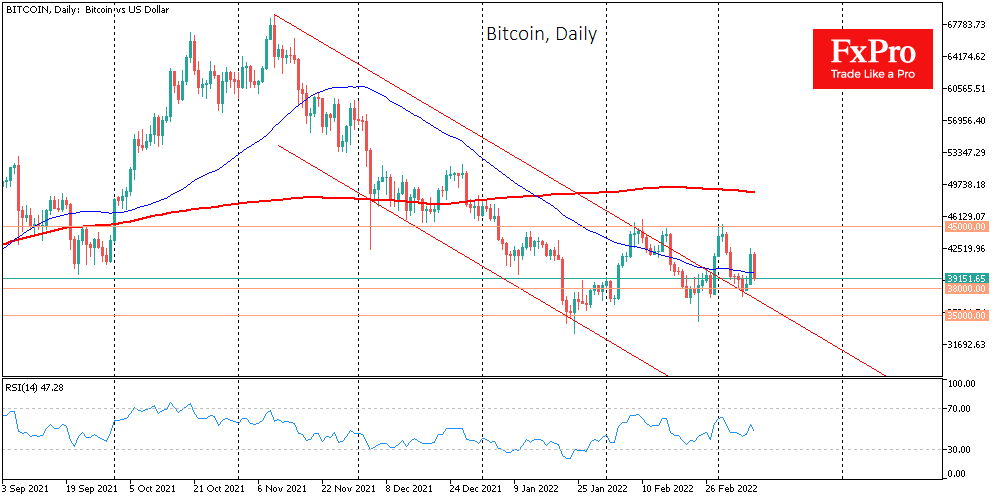
According to CoinMarketCap, the total capitalization of the crypto market decreased by 4.5% over the day, to $1.75 trillion. The Bitcoin Dominance Index dropped from 43.0% to 42.7%.
The Cryptocurrency Fear and Greed Index added 6 points to 28, climbing into “fear” territory.
Bitcoin’s growth momentum was also supported by the positive dynamics of stock indices, however, on Thursday morning, the positive pull on them remains in contrast to the sell-off of cryptocurrencies.
Bitcoin jumped when a statement by Janet Yellen appeared on the website of the US Department of the Treasury, which does not contain strict measures to control the field of cryptocurrencies. The statement was posted, probably prematurely, and then quickly removed from the site.
Later on Wednesday, US President Joe Biden signed the first executive order to regulate cryptocurrencies in the country. The document contained only the most general provisions, such as consumer protection, financial stability, technology development and the illegal use of cryptocurrencies. More specific measures in the field of control over the digital asset market will be developed by individual federal departments.
In our opinion, the States are making it clear that they will not allow cryptocurrencies to become a shadow business and be used to circumvent sanctions, taxes, money laundering and similar things. Such control is more difficult to implement than with centrally issued fiat money.
Oil Knocked Out on Chances of Supply Growth
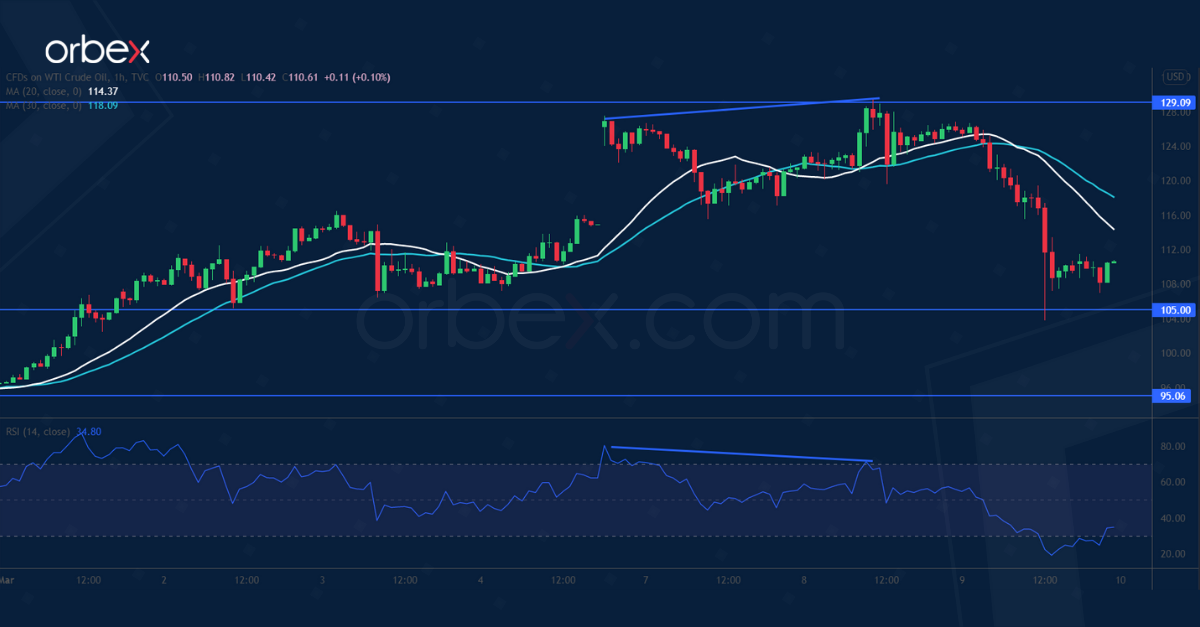
Brent crude experienced its biggest intraday decline yesterday, losing more than $17 on the day to $110, with the range of movements on the spot market exceeding $26.The momentum of the decline was triggered by Blinken’s (US Secretary of State) reports that the UAE was ready to ramp up its production, replacing Oil from Russia and stabilising the market. UAE officials soon said they remained committed to the current agreements. But this did not help Oil, which stabilised near levels a week ago.
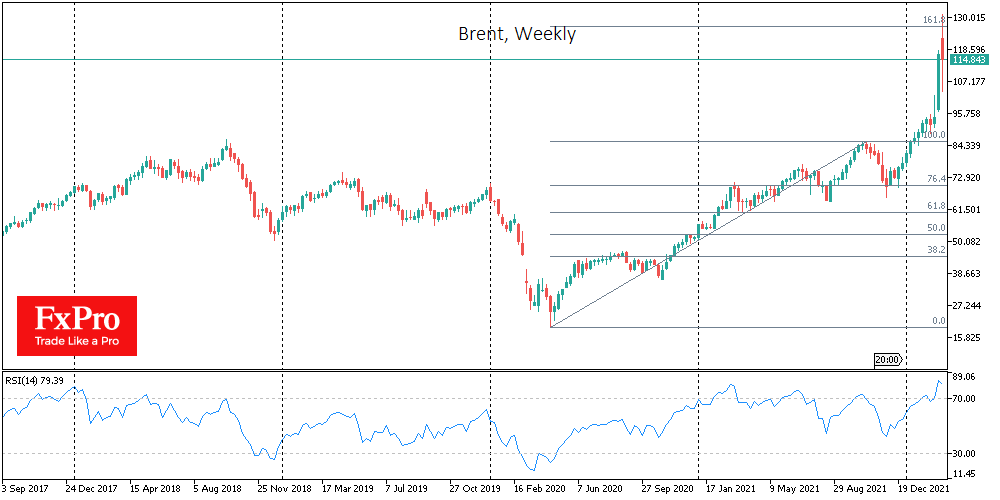
The UAE and Saudi Arabia have significant spare capacity to restore their production to pre-demand levels and even increase their global market share. At the same time, most OPEC representatives are not fully committed to their quotas.
Iran and Venezuela have more options. Both countries are trying to use the situation to ease US sanctions pressure. Iran produces 2.3 million barrels per day, about half of pre-sanctions levels. Venezuela’s production is around 0.8m BPD versus 3.1m BPD before the 2019 sanctions. Both countries can get 0.4m b/d back on the market quickly, but it will take a significant investment in the industry and a long time to grow after that.
Caracas is already curtseying towards the US by releasing two prisoners. The US is lifting some sanctions on some Iranian politicians even before the deal is struck. These are signs of progress towards easing sanctions and a clear signal to Russia that the world is not so dependent on its energy.
These are all signs favouring our idea that the peak of fear, and therefore oil prices, is over. Furthermore, Russia has not yet even gone so far as to threaten to halt exports as OPEC did in 1972. That said, military tensions and further restrictions on Russian oil and gas imports could trigger growth impulses, some of which could be strong. However, the oil price situation looks depleted.
We are set to see either a consolidation around these levels in a pessimistic war scenario, or a correction to around $90 on progress in the peace talks and the start of a move to ease sanctions on Russia, Iran and Venezuela.
EUR/USD Outlook: Euro Steadies above 1.10, Awaiting the ECB’s Decision
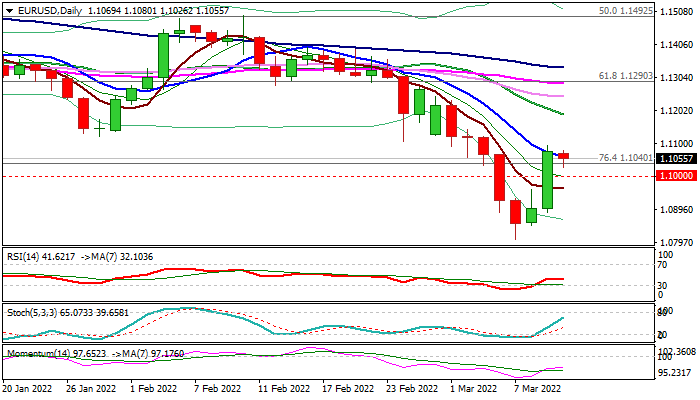
The Euro steadies above 1.10 level in European session on Thursday, following 1.6% rally previous day (the biggest one-day rally since Jan 9, 2019).
The single currency was lifted by improved sentiment on hopes of de-escalation of the conflict in Ukraine that prompted investors into riskier assets.
The two-day rebound from 22-month low (1.0806) and Wednesday’s close above pivotal barriers at 1.1000/40, improved near-term outlook and put larger bears temporarily on hold.
Technical studies on daily chart show rising momentum (although the indicator is still deeply in the negative territory) and fresh bulls cracking next pivot at 1.1059 (10DMA), with clear break here to add to positive signals and open way towards targets at 1.1121 (Jan 28 former low) and 1.1150 (50% retracement of 1.1494/1.0806 fall, reinforced by daily Kijun-sen).
Repeated daily close above 1.1040 (former strong Fibo support) is needed to reinforce near-term bullish stance and add to reversal signals.
However, fundamental are expected to keep the key role in defining the pair’s near-term direction, with all eyes on talks between top Russian and Ukrainian officials, the ECB policy meeting and the EU summit.
The European Union leaders are expected to provide more details of the further steps of bloc’s policy response to Russia’s military action in Ukraine, while investors expect the European Central Bank to announce the start of gradual phasing out its pandemic bond-buying program and to start raising interest rates before the end of the year.
On the other side, the EU is facing strong pressure from the war and fears that impact of the sanctions imposed on Russia may derail the economy and slow stable post-pandemic growth, as the EU is the most vulnerable due to its strong economic ties with Russia and heavy dependence on Russian energy and raw materials.
This may cause the more cautious approach by the policymakers and possibly result in a more dovish than expected central bank’s stance on today’s policy meeting.
Res: 1.1095; 1.1121; 1.1150; 1.1231.
Sup: 1.1040; 1.1000; 1.0962; 1.0900.
AUDUSD Returns above 200-MA, Minor Uptrend Intact
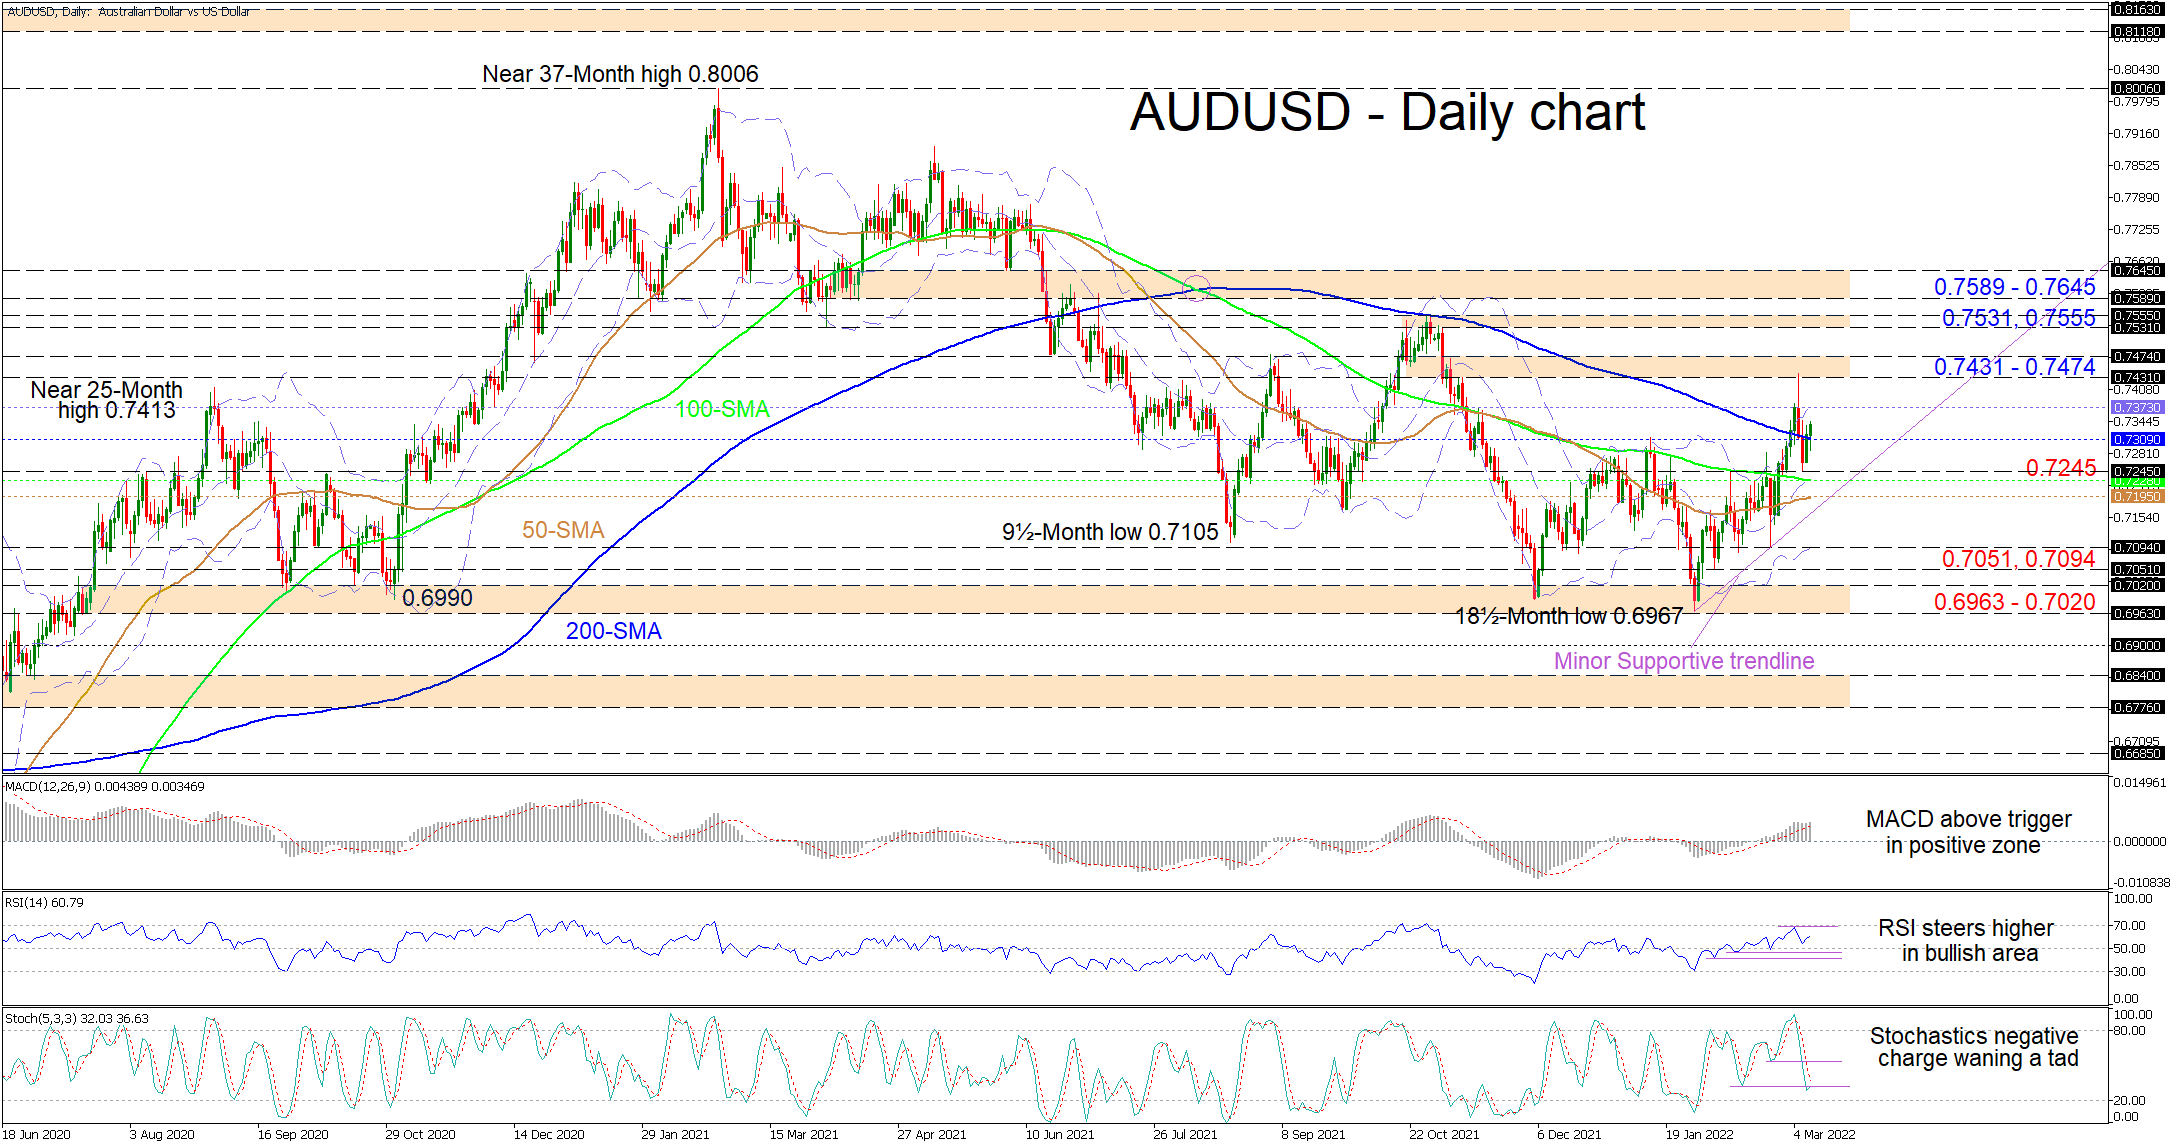
AUDUSD has pushed back above the 0.7300 handle and is recouping previously lost ground following the pullback from the 0.7431-0.7474 resistance border. The longer-term SMAs continue to retain a negative bearing but the 50-day SMA, which has been developing a positive incline, is hinting that the positive trajectory in the pair is sturdy for now.
The short-term oscillators are mixed but are leaning slightly towards a continued upside development in the price. The MACD, in the positive region, is persisting above its red trigger line, while the RSI is improving in the bullish zone. On the other hand, the stochastic oscillator is signalling some weakness in its negative charge as its %K line turns marginally higher. However, traders need to keep in mind that the stochastic oscillator has yet to confirm that negative pressures have fully abated.
If the price reclaims additional ground, the upper Bollinger band at 0.7373 may test the potency of the renewed positive traction in the pair. Steering higher, the 0.7431-0.7474 resistance border could then try to cap price advances. In the event buyers conquer this barrier, the bulls may pursue an area formed between the October 2021 highs of 0.7531 and 0.7555 respectively.
Alternatively, if positive forces start to fade and the price withdraws back beneath the 200-day SMA at 0.7309, a profound negative force would be needed to avoid the pair finding its feet within a fortified buffer zone between the 0.7245 low and the 50-day SMA at 0.7195. This area is also overlapped by a potential supportive trend line pulled from the 18½-month low of 0.6967. Diving past this tough boundary, sellers may aim for the lower Bollinger band - residing at the 0.7094 trough - and the nearby 0.7051 low.
Summarizing, AUDUSD is sustaining a minor uptrend above the 0.7195-0.7245 support zone. To significantly reinforce upside momentum, the price would need to propel above the 0.7589-0.7645 barrier, while a decline beyond the 0.6963-0.7020 base would intensify negative pressures in the pair.
Nasdaq 100, Dow Jones, S&P 500 Rise as VIX Slips
US stock rallied sharply on Wednesday after falling in the past four consecutive days. The Dow Jones rose by more than 600 points while the tech-heavy Nasdaq 100 index rose by over 373 points. Some of the biggest winners were technology companies like Bumble, Figs, Carvana and United Airlines, which rose by more than 10%. On the other hand, the CBOE Volatility index crashed by almost 8% while energy groups like Marathon Oil, ExxonMobil, and Pioneer Natural Resources crashed. Still, it is unclear whether Wednesday’s gains will hold because of how volatile the markets have been lately.
The euro bounced back on Thursday morning as investors waited for the upcoming Eurogroup meeting and the interest rate decision by the European Central Bank (ECB). Analysts expect that European leaders will announce a new round of stimulus in a bid to prevent the bloc from going into a recession. At the same time, they will deliberate on how to reduce their dependence on Russian oil and gas. On the other hand, analysts believe that the ECB will decide to be more dovish in a bid to support the economy.
The US dollar strength took a breather as the VIX index dropped. Data published by the American labor department showed that the country’s vacancies rose to over 11 million people as companies continued recovering. The data came a few days after the US said that its total unemployment rate dropped to 3.8% in February. Later today, the US will publish the latest consumer inflation data. Analysts expect the data to show that the headline CPI jumped to 7.9% in February while core CPI dropped slightly to 5.9%.
EURUSD
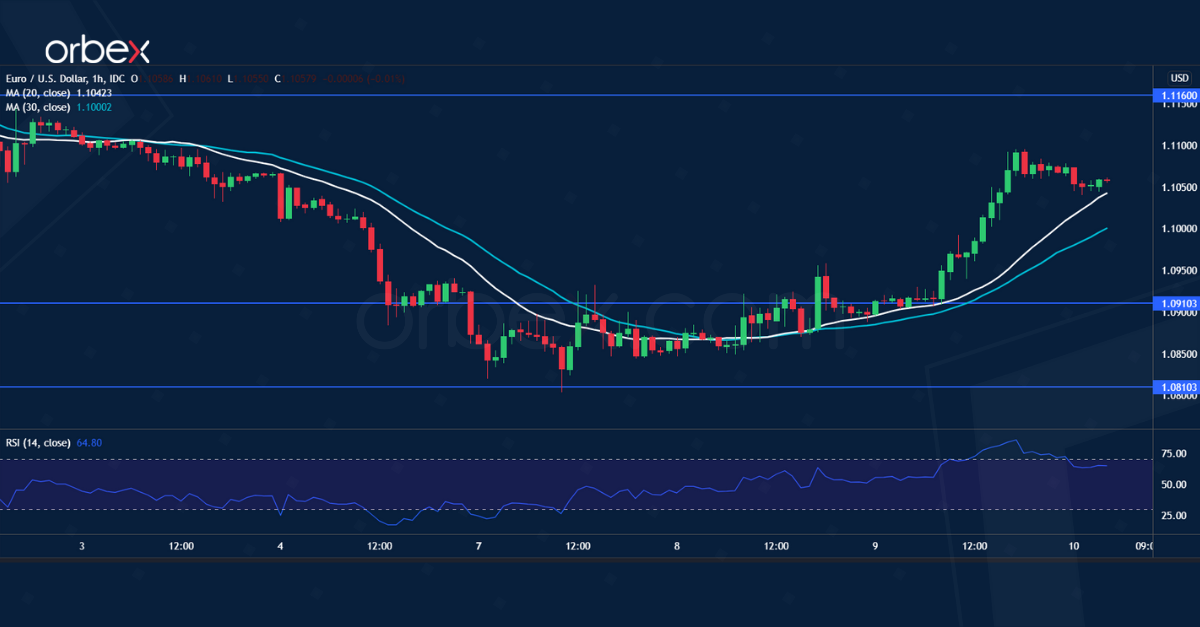
The EURUSD pair has been in a strong bearish trend in the past few days. It fell to a low of 1.0805. It has bounced back in the past 2 days and is trading at 1.1045. On the four-hour chart, the pair has managed to move above the 25-day and 50-day moving averages. It is also approaching the 38.2% Fibonacci retracement level. Therefore, the pair will likely keep rising as bulls target the next key resistance at 1.1150, which is along the 50% retracement level.
USDMXN
The USDMXN pair dropped sharply as most emerging market currencies rose. It moved to a low of 20.93, which is the lowest it has been since March 7. This price is substantially below this week’s high of 21.50. On the four-hour chart, the pair has moved below the 25-day moving average while the Relative Strength Index has moved to the oversold level. Therefore, the pair will likely keep falling in the near term.
NAS100
The Nasdaq 100 index rose as the significant sell-off took a rest. The index is trading at $13,460, which is significantly higher than this week’s low of $13,095. On the four-hour chart, the index is slightly above the middle line of the Bollinger Bands while the Relative Strength Index (RSI) has moved from the oversold level. Therefore, the index will likely keep rising in the coming days.
US 30 Index Dives Below SMAs in Short-Term
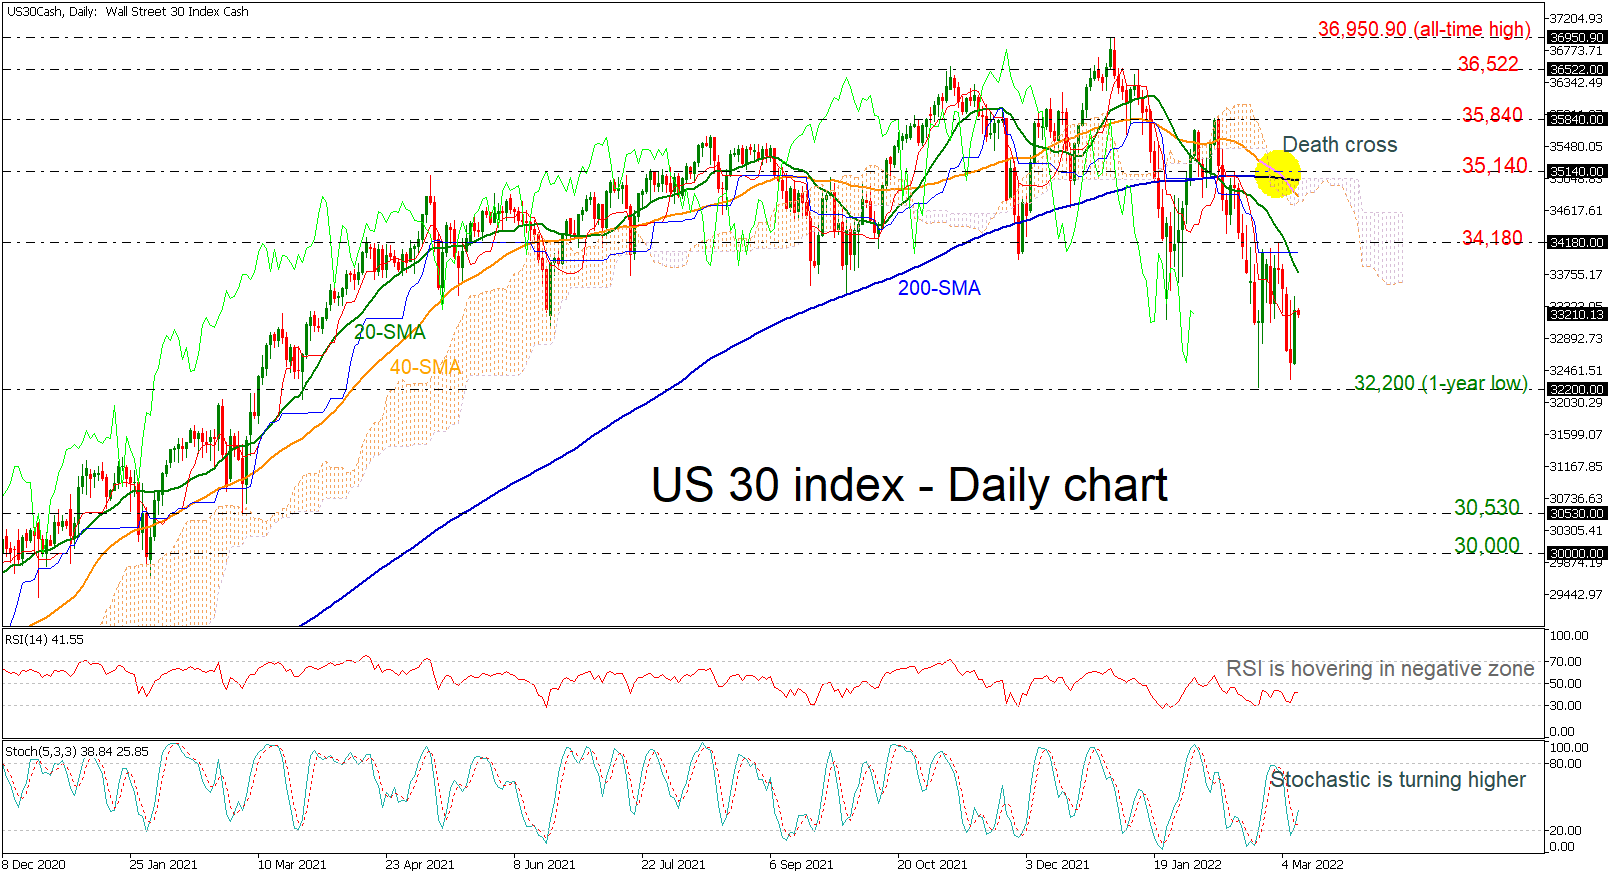
The US 30 (cash) index failed again to touch the one-year low of 32,200 and returned higher but the near-term bias is still bearish. The 40- and the 200-day simple moving averages (SMAs) posted a death cross, confirming the bearish outlook. The RSI indicator is flattening below the 50 level, while the %K and the %D lines are ticking higher after the bullish cross.
Further losses should see the latest low of 32,200 being tested before tumbling to the next support level of 30,530. If the bears continue to sell the index, the 30,000 round number may halt the negative movements.
In the event of an upside reversal, the 20-day SMA at 33,766 may act as strong resistance ahead of the 34,180 peak. Above these crucial levels the death cross around 35,058 could be the next target around the 35,140 hurdle.
All in all, the US 30 index has been in a negative tendency since January and only a successful climb above the SMAs may change this outlook.
Elliott Wave View: GBPUSD Looking for Further Downside
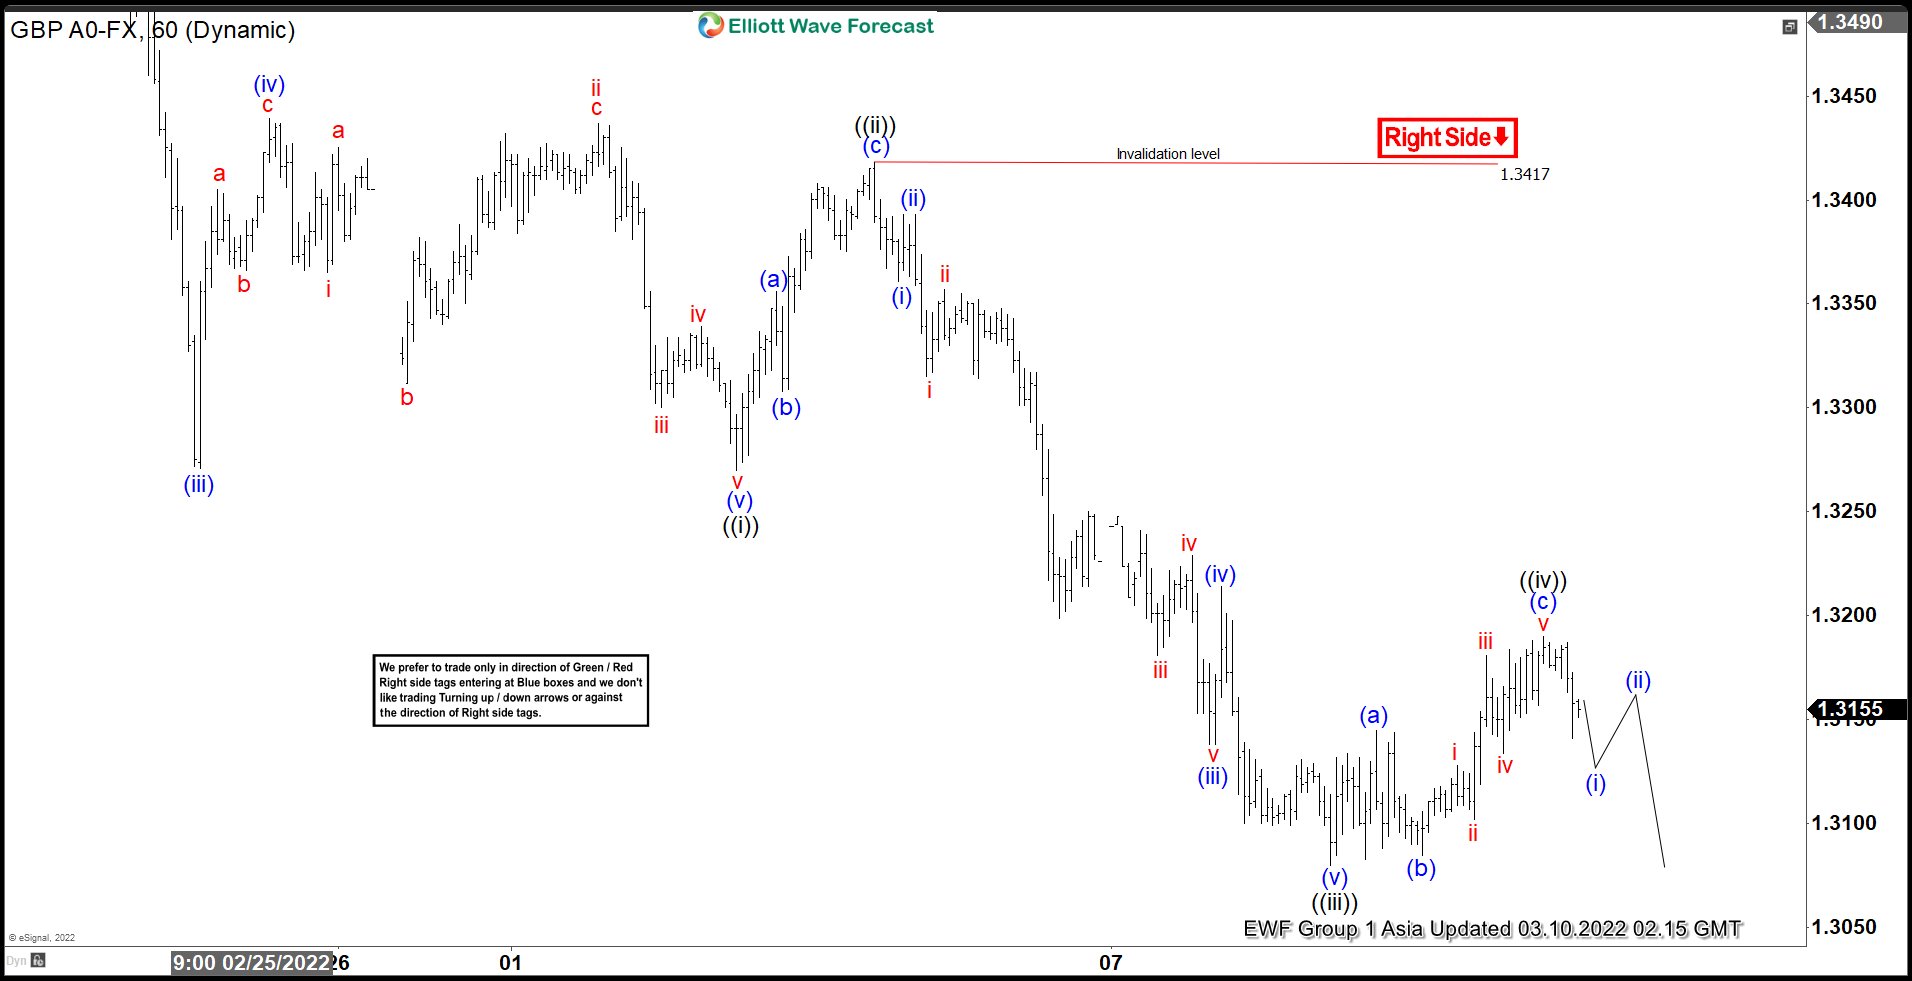
Short Term Elliott Wave View in GBPUSD suggests that the decline from February 18 peak is unfolding as a 5 waves impulse Elliott Wave structure. Down from February 18, wave (i) ended at 1.3536, and rally in wave (ii) ended at 1.3621. Pair then resumes lower in wave (iii) towards 1.3272, and rally in wave (iv) ended at 1.3439. Final leg lower wave (v) ended at 1.327 which also completed wave ((i)). Rally in wave ((ii)) completed at 1.3417 with internal subdivision as a zigzag. Up from wave ((i)), wave (a) ended at 1.335, pullback in wave (b) ended at 1.3308, and wave (c) higher ended at 1.3417 which completed wave ((ii)).
Pair resumes lower in wave ((iii)) with internal subdivision as an impulse. Down from wave ((ii)), wave (i) ended at 1.336, and wave (ii) ended at 1.3393. Pair resumes lower in wave (iii) which ended at 1.3138, and wave (iv) rally ended at 1.3214. Final leg lower wave (v) of ((iii)) ended at 1.3080. Wave ((iv)) rally in GBPUSD ended at 1.3190 with internal subdivision as a flat Elliott Wave structure. Near term, expect pair to extend lower in wave ((v)). As far as pivot at 1.3417 high stays intact, rally should fail in the sequence of 3, 7, or 11 swing for further downside.
GBPUSD 60 Minutes Elliott Wave Chart
NZDUSD Neutral with Bullish Potential
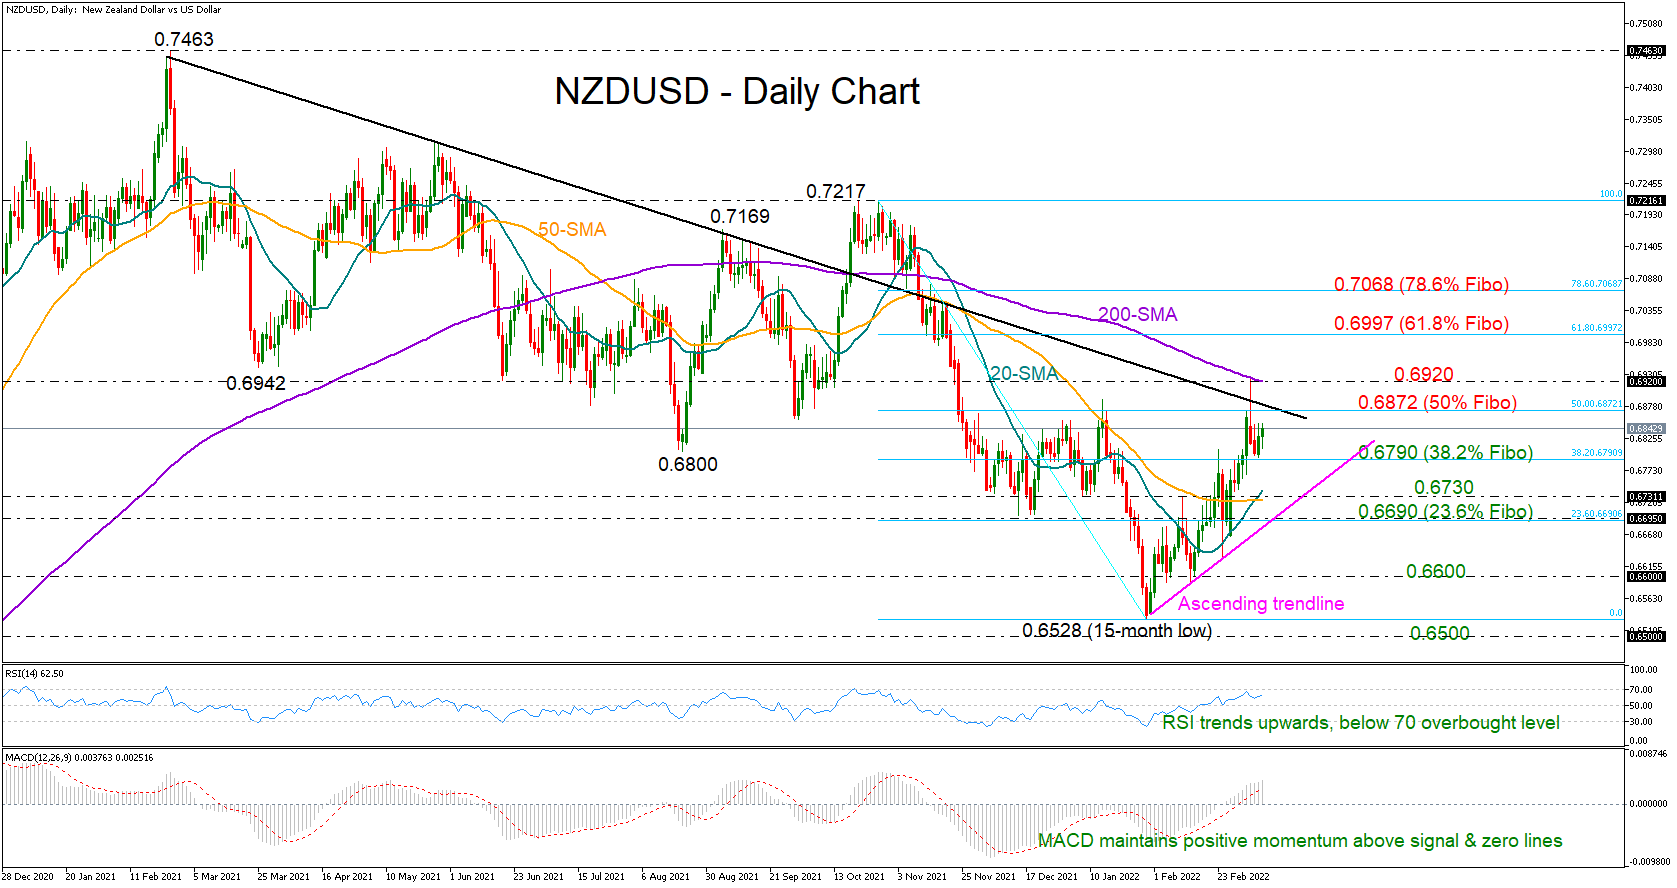
NZDUSD shifted to the sidelines after Monday’s advance faltered near the 200-day simple moving average (SMA) and at a three-month high of 0.6924.
Despite yesterday’s festive mood in the FX space, the pair could barely extract any gains, remaining constrained within its weekly range and the 0.6800 territory. That said, the technical picture is still promising. The 20- and 50-day SMAs have registered a bullish cross for the first time since October, while the RSI and MACD oscillators maintain a clear uptrend within the bullish zone, all brightening prospects for the short-term trading.
Practically, for the positive signals to boost buying orders, the price will need to close above the 50% Fibonacci retracement of the 0.7217 – 0.6528 downleg at 0.6872, and then successfully claim the 200-day SMA at 0.6920. Such an action could add fuel to the bullish wave, driving the price straight up to the 61.8% Fibonacci of 0.6997. Further up, the price may test the 78.6% Fibonacci of 0.7068 before accelerating towards September’s and October’s highs at 0.7169 and 0.7217, respectively.
On the downside, the 38.2% Fibonacci of 0.6790 managed to add strong footing under the price this week. If it collapses, selling pressures could amplify towards the 0.6730 – 0.6690 zone that encapsulates the short-term SMAs and the 23.6% Fibonacci. Notably, the descending trendline drawn from January’s lows is also passing through this region. Hence, any violation at this point could produce a sharper decline likely to 0.6600, while deeper, the bears will attempt to activate the one-year-old downtrend below 0.6528.
In brief, the short-term bullish bias in NZDUSD has not faded yet despite the ongoing sideways trading. Traders may wisely wait for a rally above the 0.6872 – 0.6920 zone before they raise exposure in the market. Alternatively, a break below 0.6790 could boost engagement in selling activities.