Sample Category Title
Technical Outlook and Review
DXY:
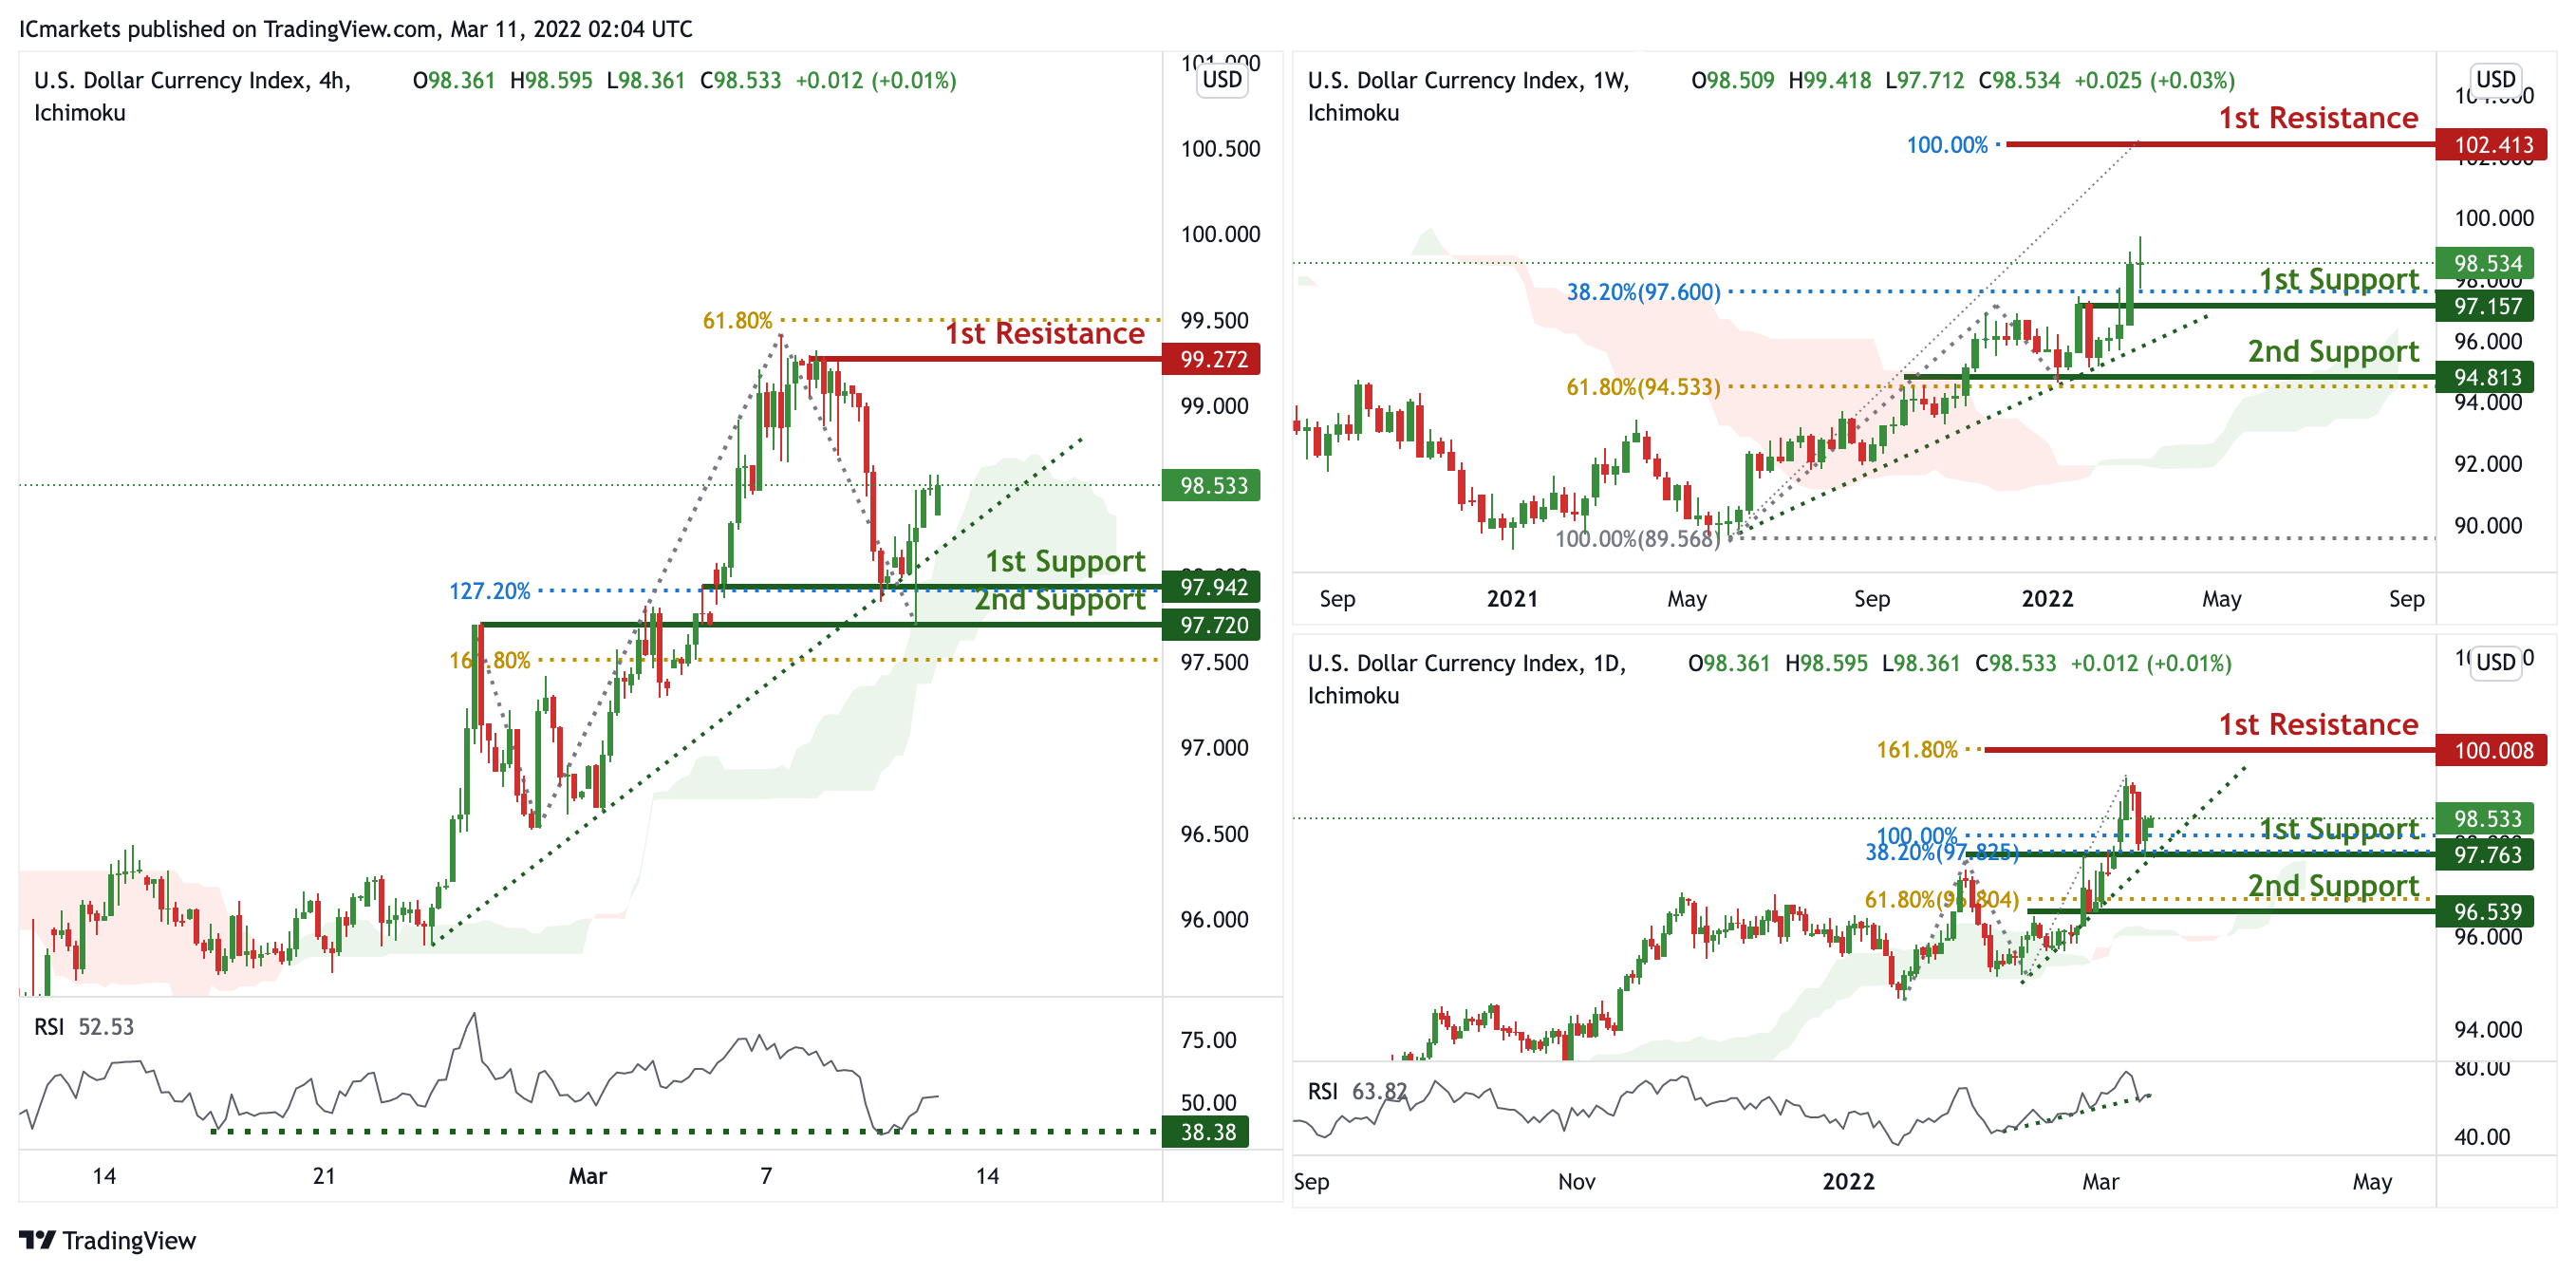
On the weekly, prices are on bullish momentum and abiding to our ascending trendline support. We see the potential for further bullish continuation from our 1st support at 97.157 in line with 38.2% Fibonacci retracement towards our 1st resistance at 102.413 in line with 100% Fibonacci projection. Prices are trading above our ichimoku clouds, further supporting our bullish bias.
On the daily, prices are on bullish momentum and abiding to our ascending trendline support. We see the potential for further bullish continuation from our 1st support at 97.763 in line with 100% Fibonacci projection and 38.2% Fibonacci retracement towards our 1st resistance at 100.008 in line with 161.8% Fibonacci projection. Prices are trading above our ichimoku clouds and RSI is on bullish momentum, further supporting our bullish bias.
On the H4 timeframe, prices are on bullish momentum and abiding to our ascending trendline support. We see the potential for further bullish continuation from our 1st support at 97.942 in line with 127.2% Fibonacci projection towards our 1st resistance at 99.272 in line with 61.8% Fibonacci retracement. Prices are trading above our ichimoku clouds and RSI is at levels where bounces previously occurred.
Areas of consideration:
- H4 time frame, 1st resistance at 99.272
- H4 time frame, 1st support at 97.942
XAU/USD (GOLD):
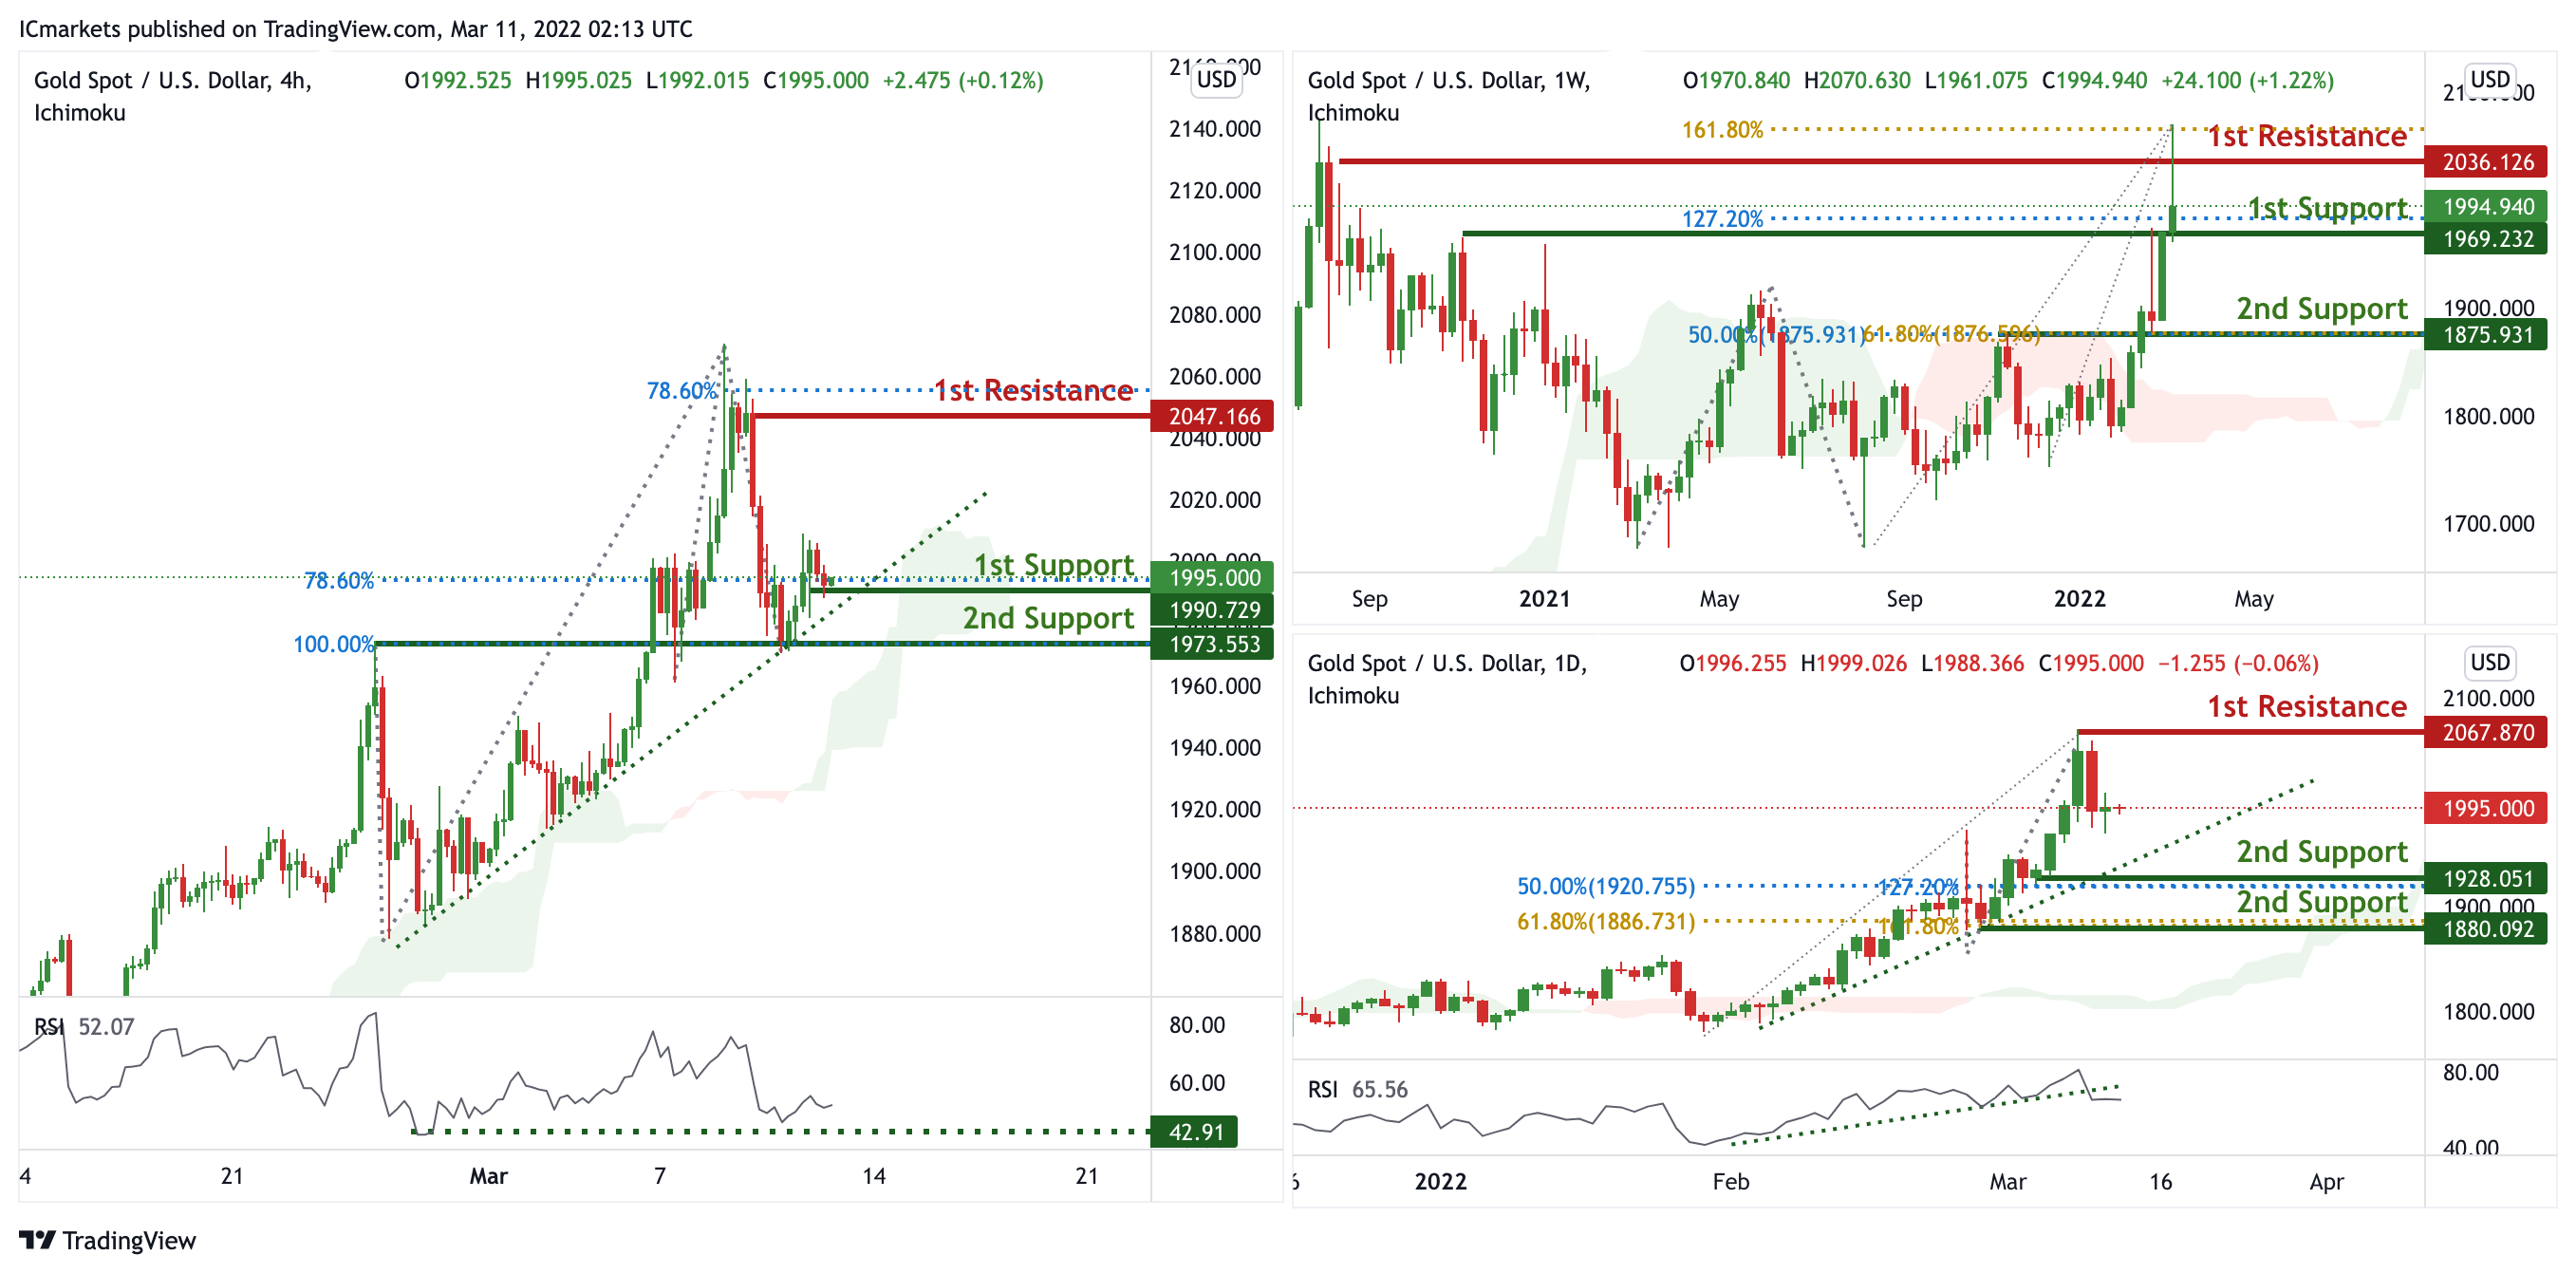
On the weekly, prices are on bullish momentum and abiding to our ascending trendline support. We see the potential for further bullish continuation from our 1st support at 1969.232 in line with 127.2% Fibonacci projection towards our 1st resistance at 2036.126 in line with 161.8% % Fibonacci projection. Prices are trading above our ichimoku clouds and RSI is on bullish momentum, further supporting our bullish bias.
On the daily, prices are on bullish momentum and abiding to our ascending trendline support. We see the potential for further bullish continuation from our 1st support at 1928.051 in line with 127.2% Fibonacci projection and 50% Fibonacci retracement towards our 1st resistance at 2067.870 which is a graphical swing high. Prices are trading above our ichimoku clouds and RSI is on bullish momentum, further supporting our bullish bias.
On the H4, prices are on bullish momentum and abiding to our ascending trendline support. We see the potential for further bullish continuation from our 1st support at 1990.729 in line with 78.6% Fibonacci projection towards our 1st resistance at 2047.166 in line with 78.6% Fibonacci projection. Prices are trading above our ichimoku clouds and RSI is on bullish momentum, further supporting our bullish bias.
Areas of consideration:
- 4h 1st support at 1990.729
- 4h 1st resistance at 2047.166
GBP/USD:
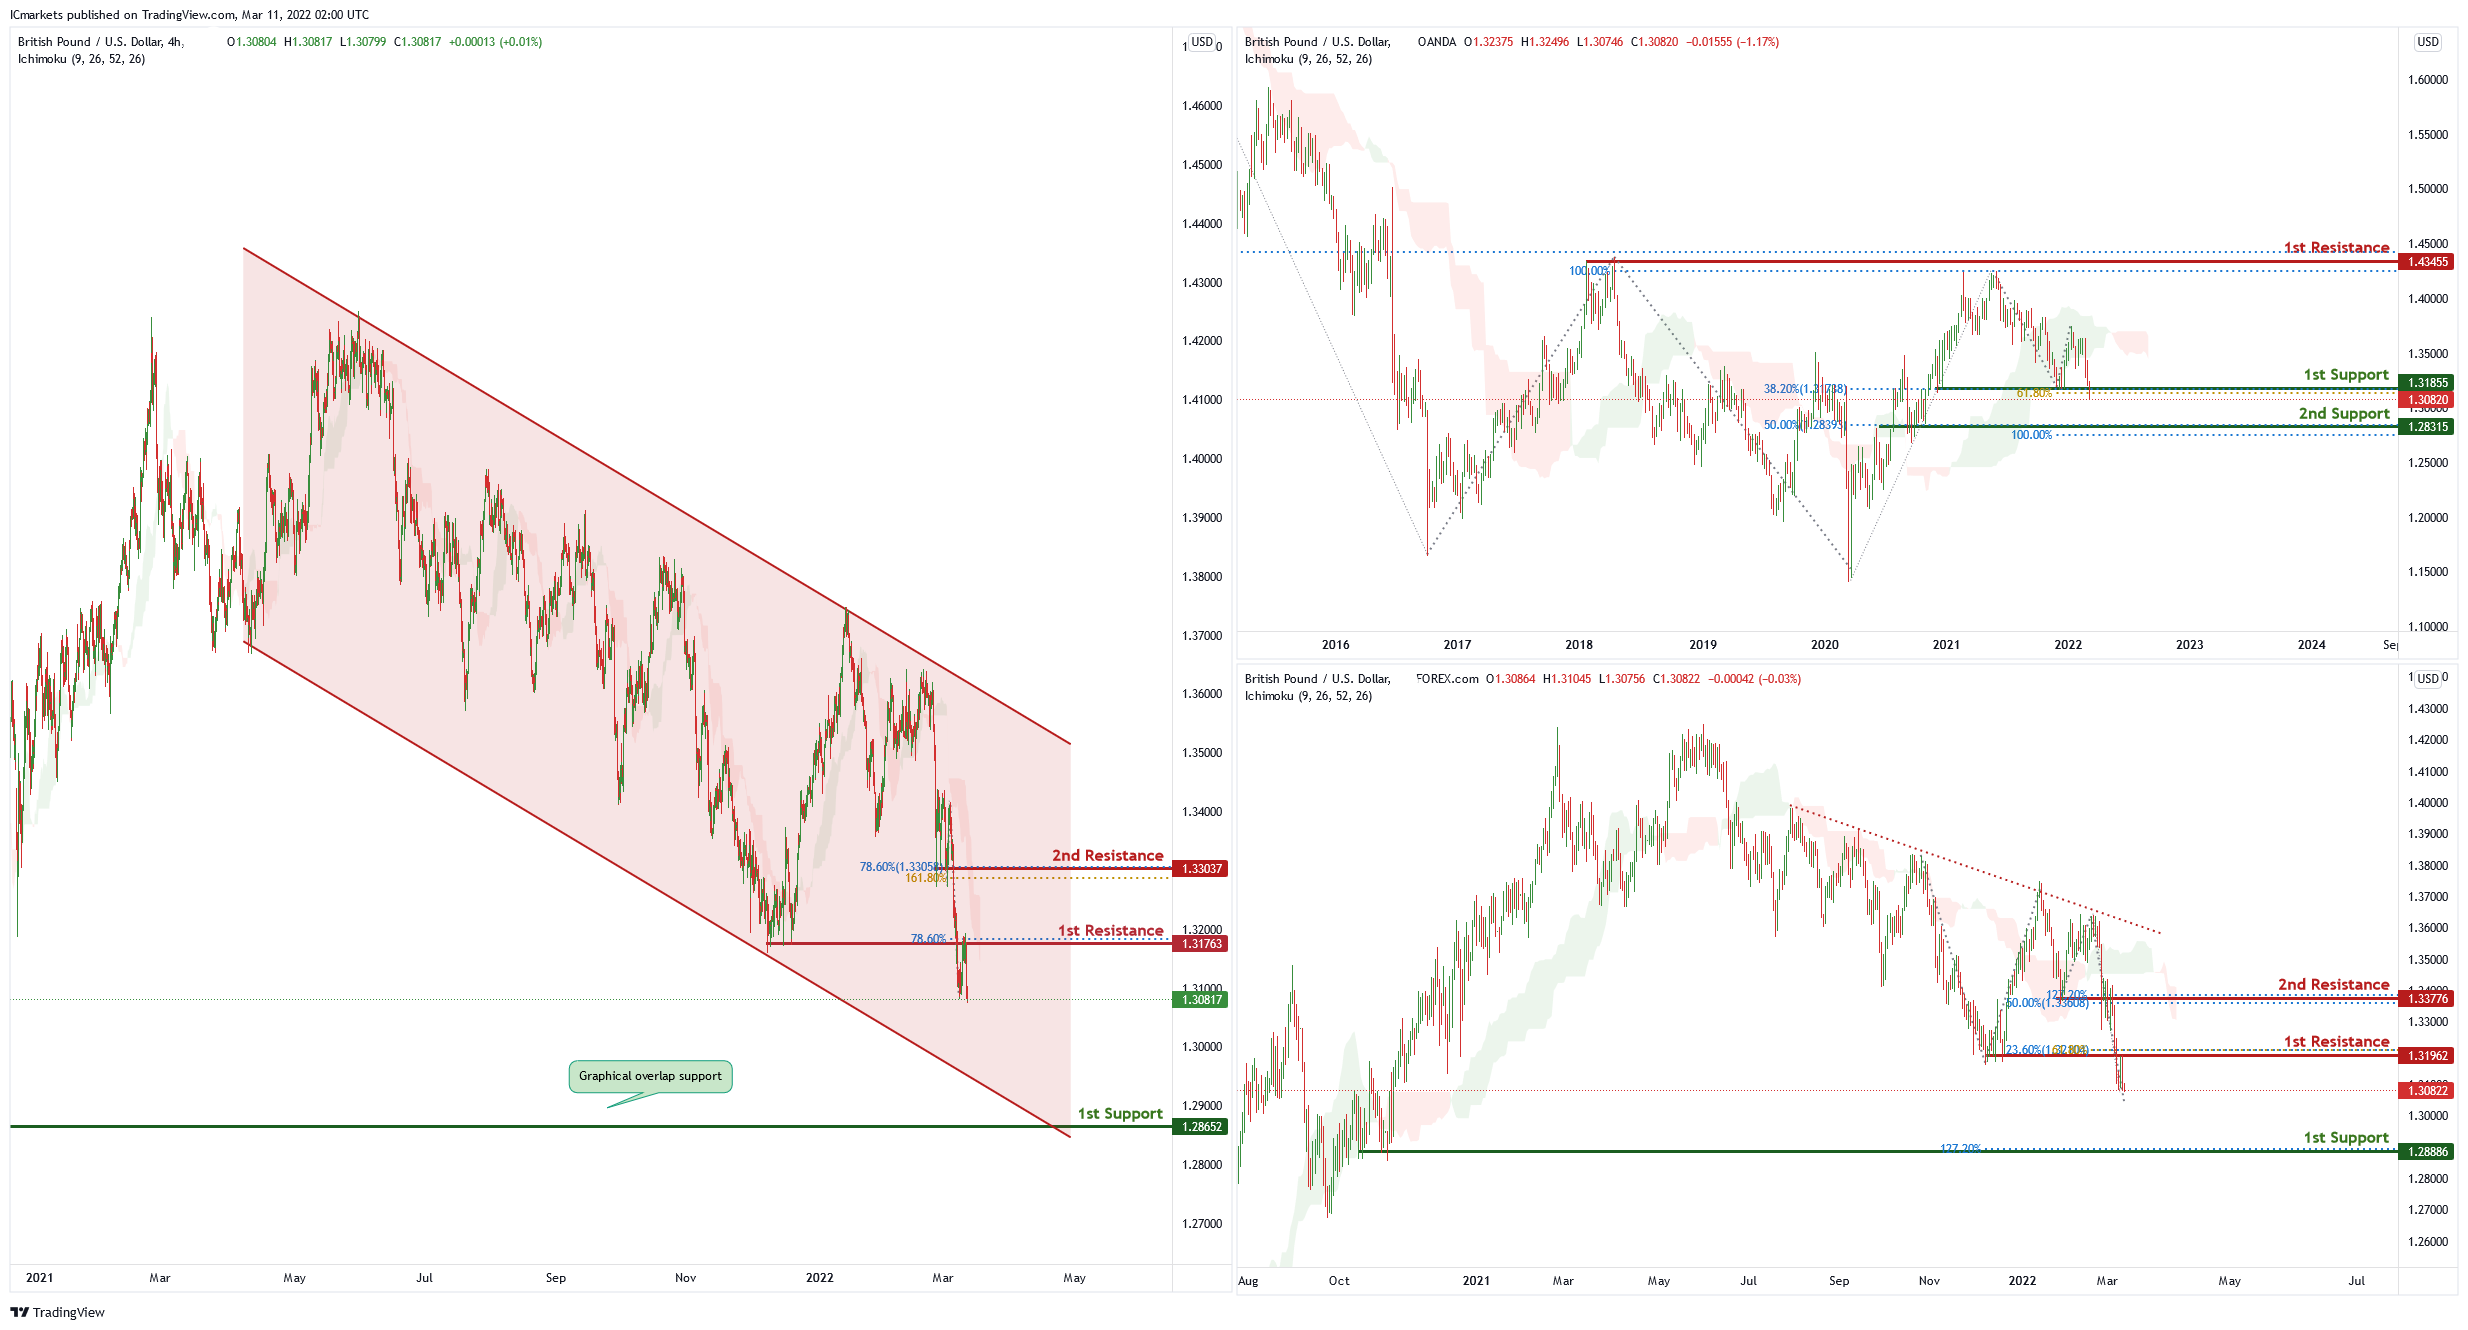
On the weekly chart , price has recently bounced off the 1st support level of 1.31885 which is also 38.2% Fibonacci retracement and 61.8% Fibonacci projection. Price can potentially go to the 1st resistance level of 1.42498 which is also 100% Fibonacci projection and 50% Fibonacci retracement. Our bullish bias is supported by the ichimoku cloud indicator.
On the daily chart , price is abiding by a descending trendline . Price is near the 1st resistance level of 1.31962 in line with 23.6% Fibonacci retracement and 61.8% Fibonacci projection. Price can potentially dip to the 1st support level of 1.28886 in line with 127.2% Fibonacci projection.Our bearish bias is supported by the ichimoku cloud indicator.
On the H4 chart price is trading in a descending channel and has recently broken the 1st resistance level of 1.31763 in line with 78.6% Fibonacci retracement. Price can potentially dip to the 1st support level of 1.28652 in line which is also the graphical overlap support. Our bearish bias is supported by the ichimoku cloud indicator as price is trading under it.
Areas of consideration
- H4 1st resistance at 1.31763
- H4 1st support at 1.28652
USD/CHF:
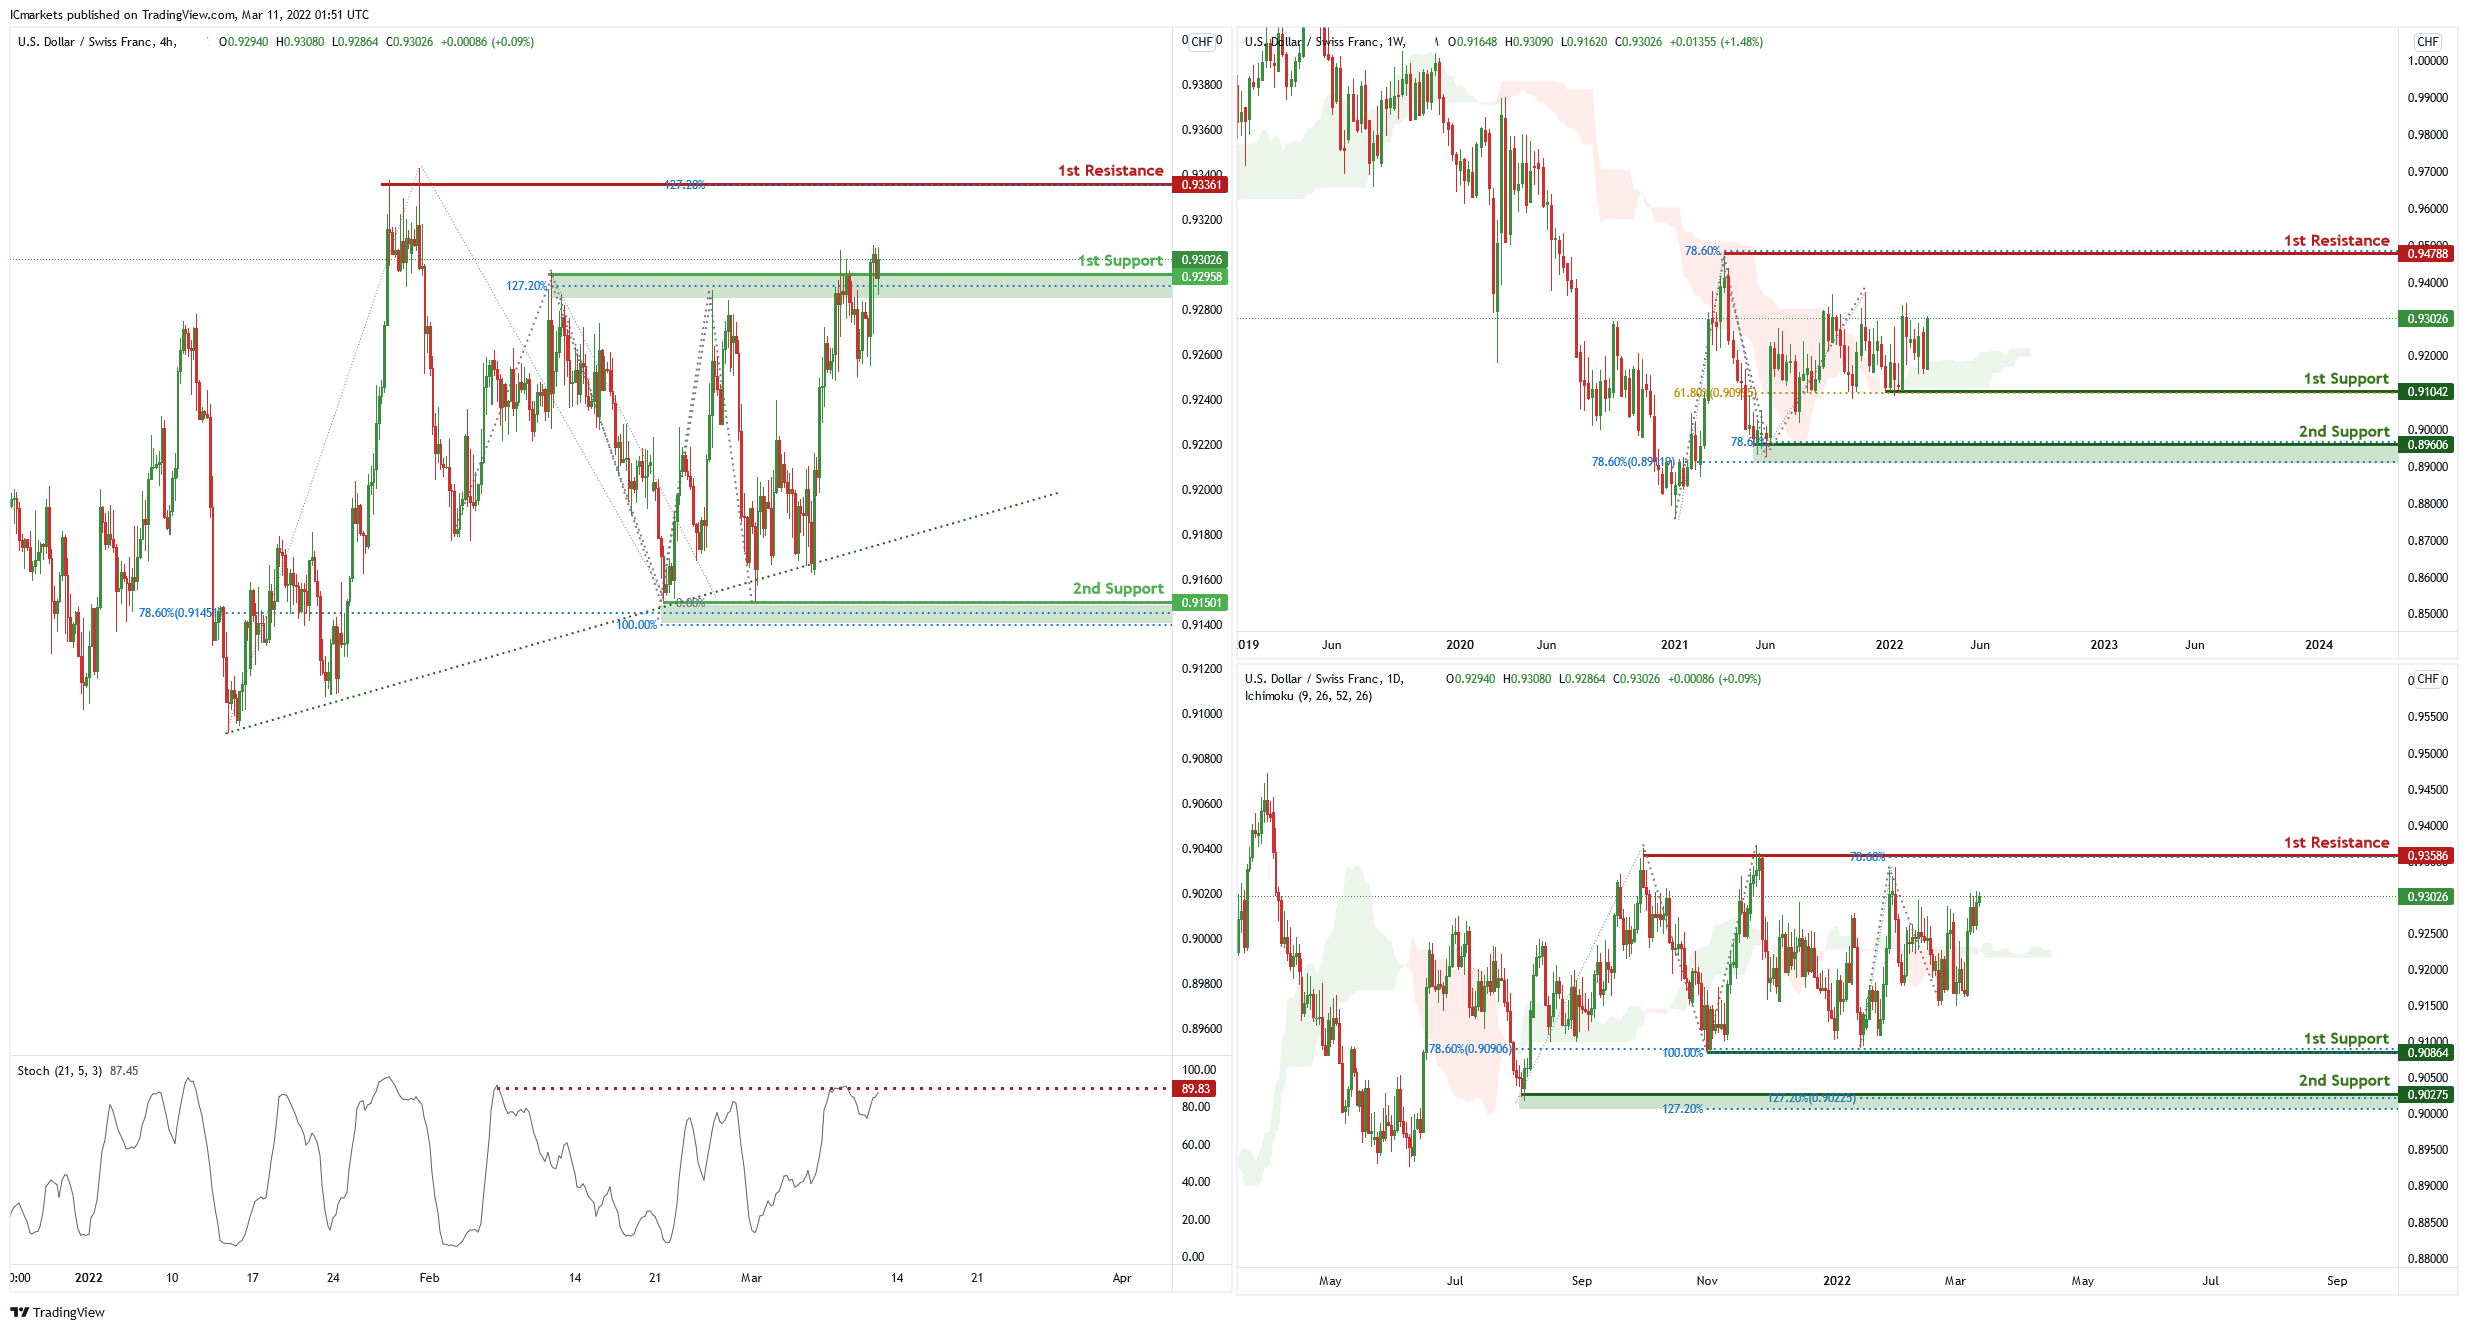
On the weekly chart, price is between 1st support level of 0.91042 in line with 61.8% Fibonacci retracement and 1st resistance level of 0.94788 in line with 78.6% Fibonacci projection. Price can potentially go to the 1st resistance level. Our bullish bias is supported by the ichimoku cloud indicator.
On the daily chart price is between 1st support of 0.90864 in line with 100% Fibonacci projection, 78.6% Fibonacci retracement and 1st resistance level of 0.93586 in line with 78.6% Fibonacci projection. Price can potentially go to the 1st resistance level which is also the graphical swing high level. Our bullish bias is supported by the ichimoku cloud indicator.
On the H4, price is abiding by an ascending trendline and near 1st support level of 0.92958 in line with 127.2% Fibonacci projection. Price can potentially dip to the 2nd support level of 0.91501 in line with 100% Fibonacci projection and 78.6% Fibonacci retracement. Our bearish bias is supported by the stochastic indicator as it is near resistance level
Areas of consideration
- 1st support level 0.92956
- 2nd support 0.91501
EUR/USD :
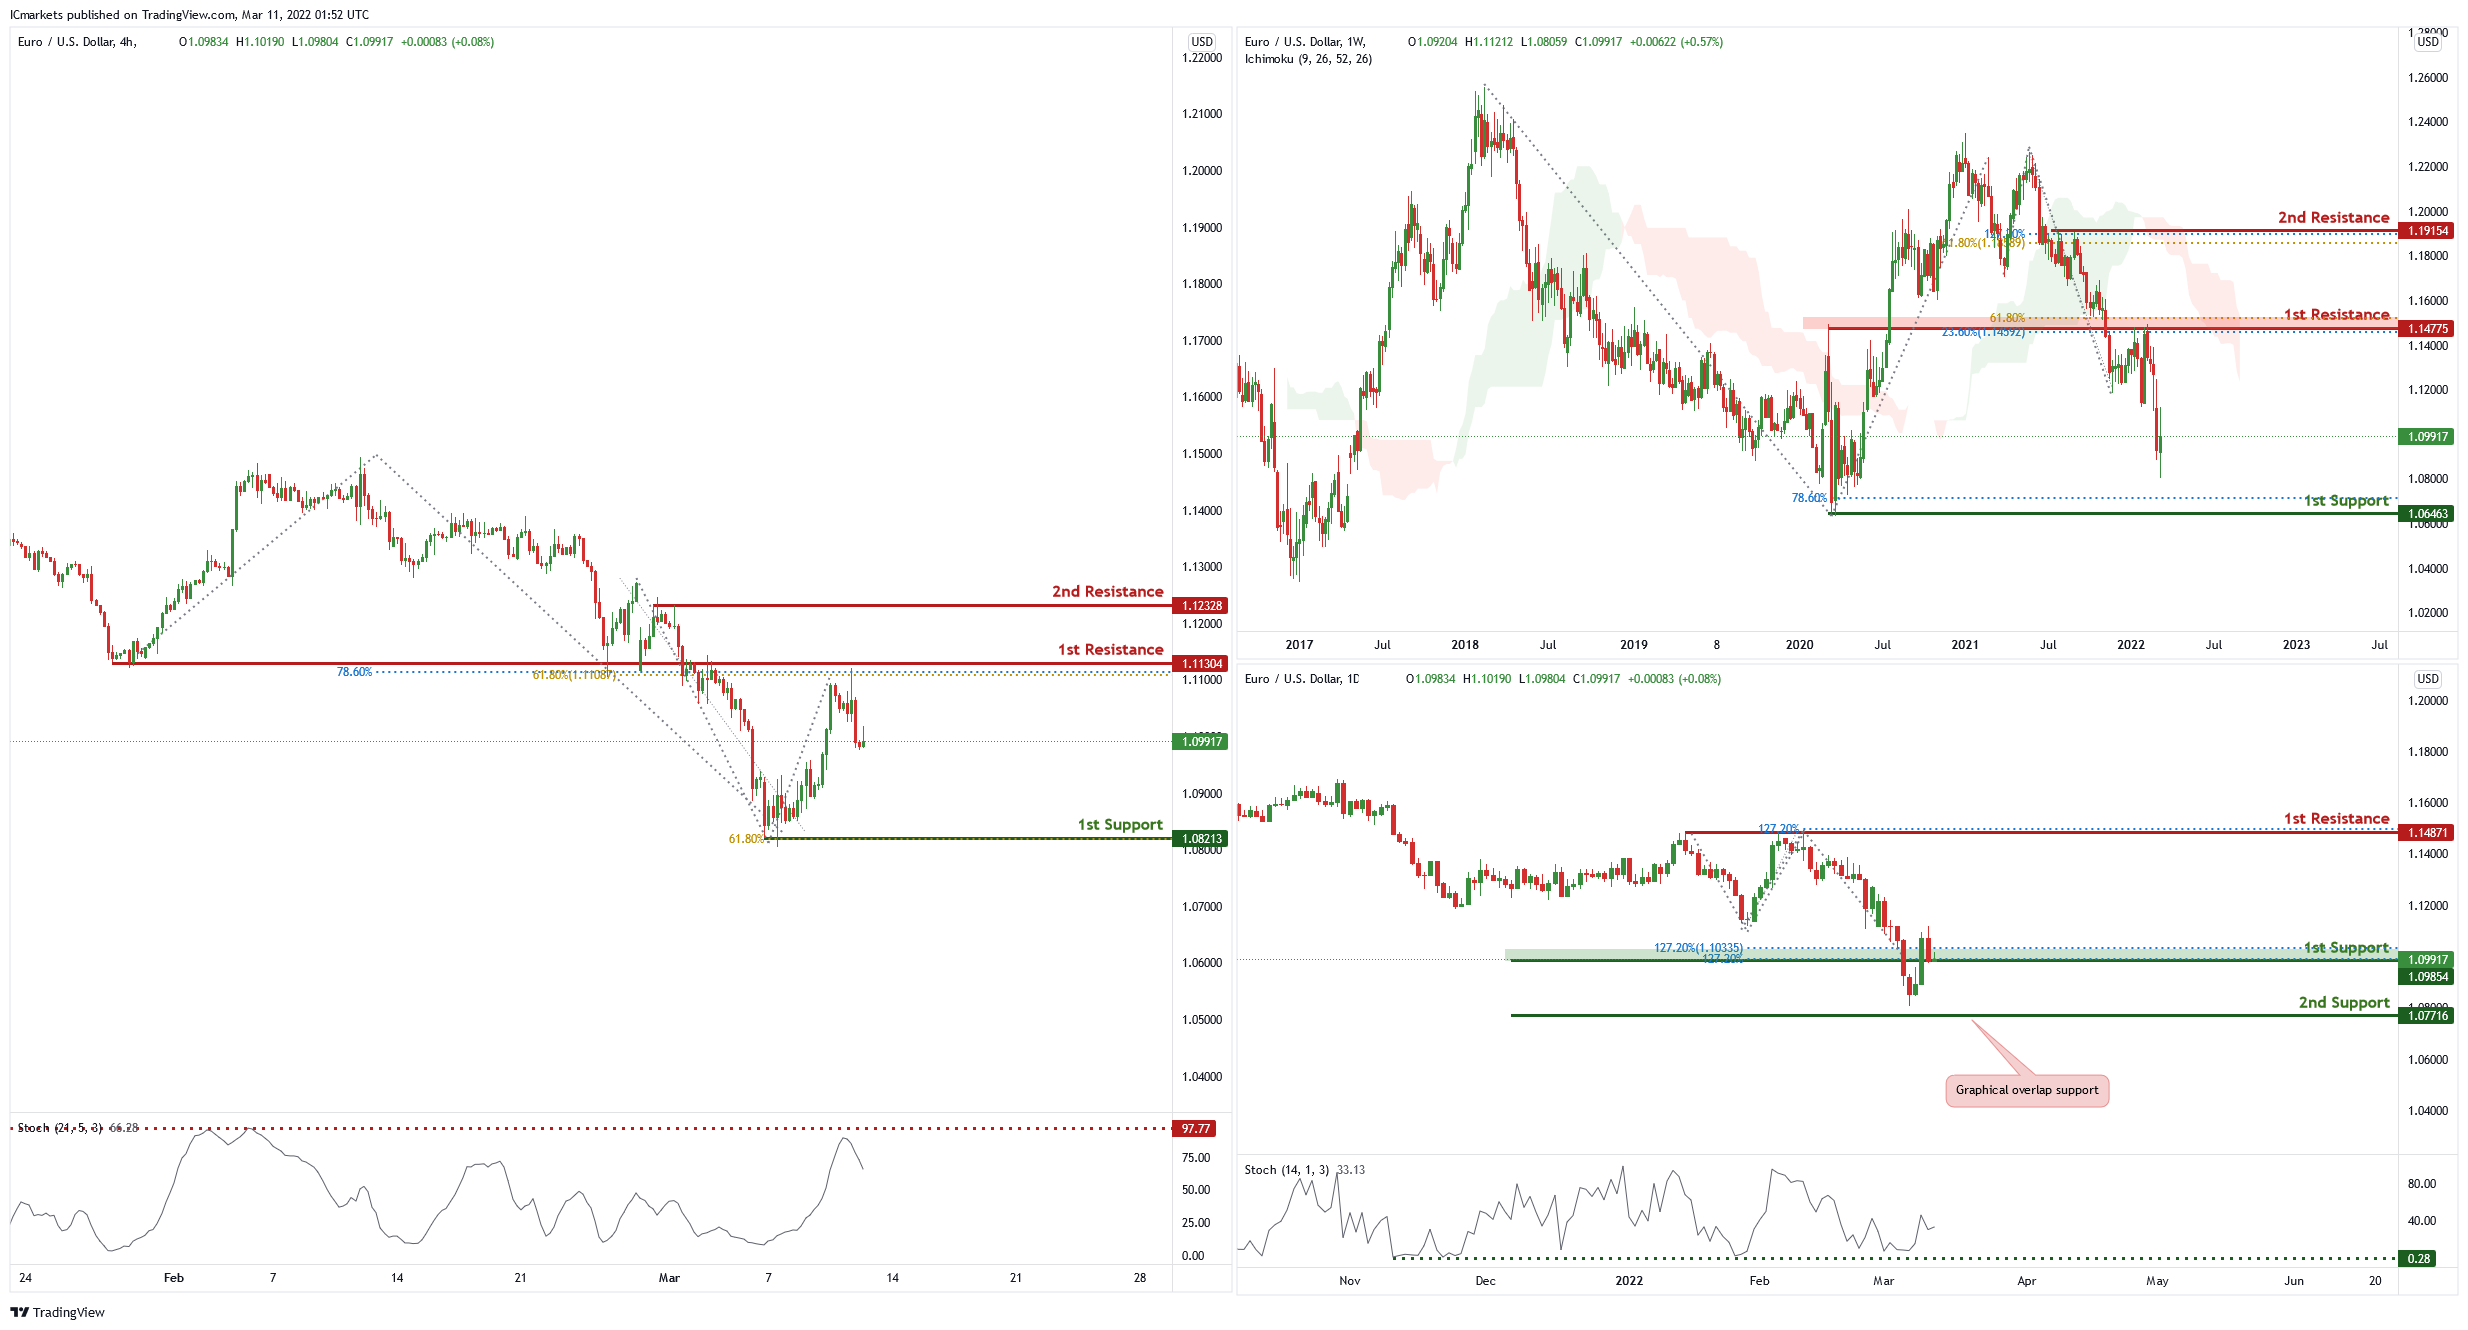
On the weekly chart , price is near 1st resistance level of 1.14775 in line with 23.6% Fibonacci retracement and 61.8% Fibonacci projection. Price can potentially dip to the 1st support level of 1.06463 in line with 78.6% Fibonacci projection. Our bearish bias is supported by the ichimoku cloud indicator as price is trading below it.
On the daily chart, price is at 1st support level of 1.09854 in line with 127.2% Fibonacci projection and 127.2% Fibonacci retracement. Price can bounce to the 1st resistance level of 1.14871 in line with 127.2% Fibonacci projection and graphical swing high . Our bullish bias is supported by the stochastic indicator as it is at support level.
On the H4 price is near 1st resistance level of 1.11304 in line with 78.6% Fibonacci projection and 61.8% Fibonacci retracement. Price can potentially dip to the 1st support level which is the graphical swing low and 61.8% Fibonacci projection. Our bearish bias is supported by the stochastic indicator as it is the graphical swing low and 61.8% Fibonacci projection
Areas of consideration :
- H4 1st resistance at 1.11304
- H4 1st support at 1.08213
USD/JPY:
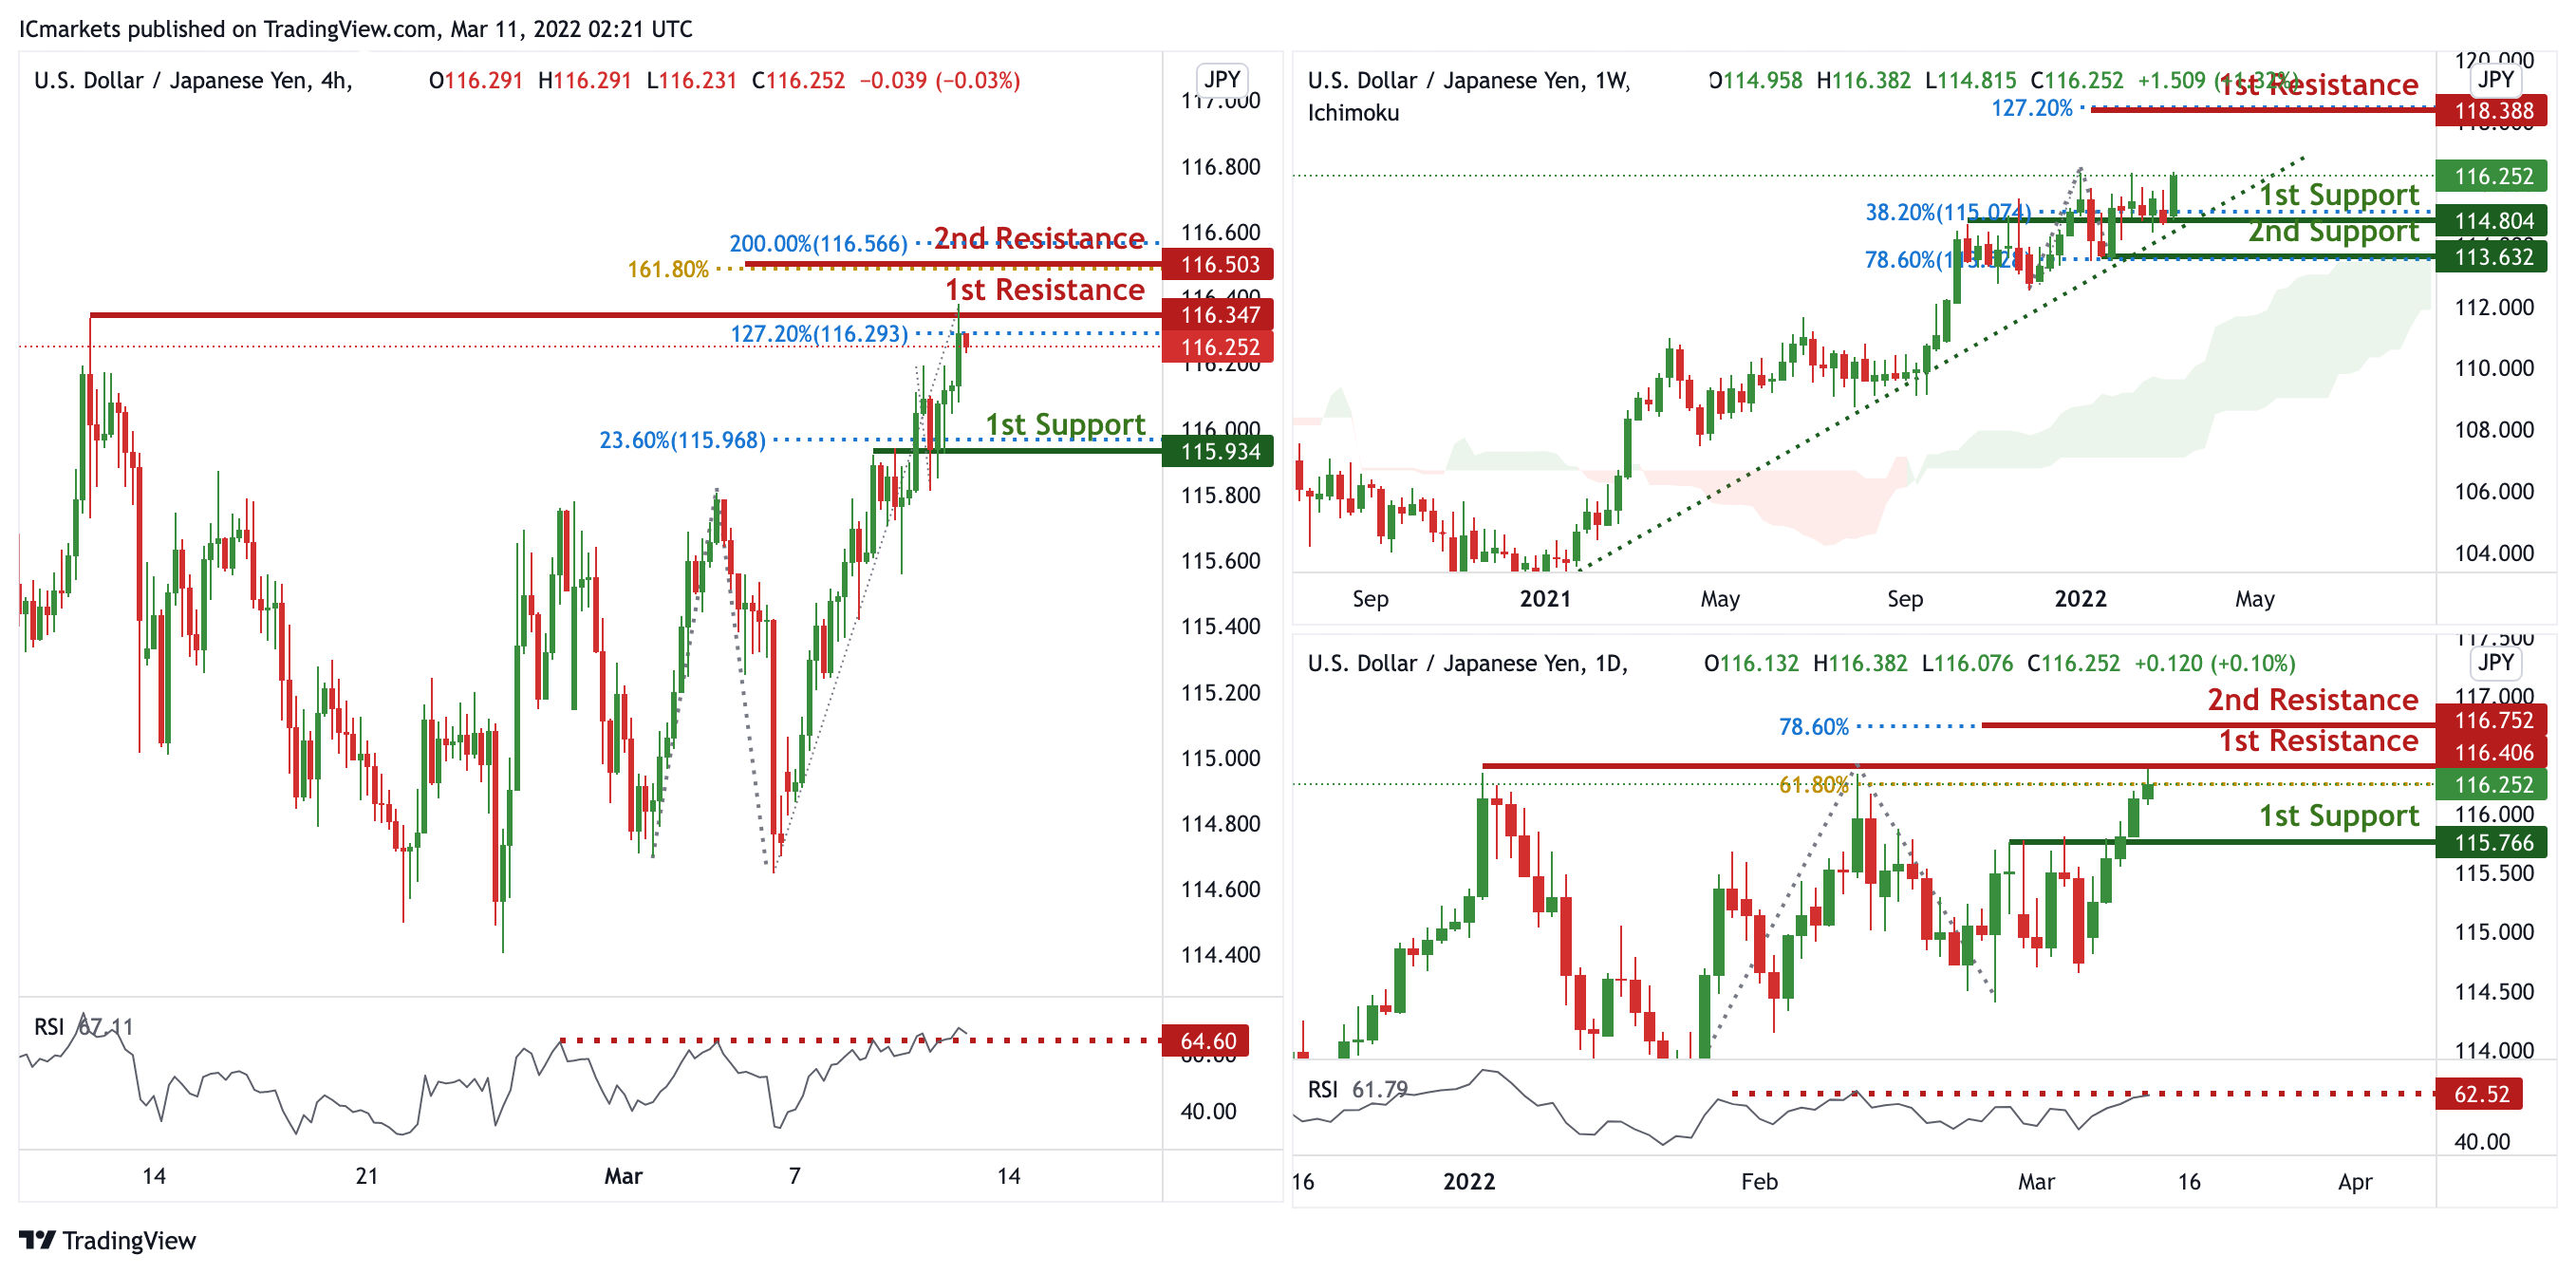
On the weekly, prices are on bullish momentum and abiding to our ascending trendline support. We see the potential for further bullish continuation from our 1st support at 114.804 in line with 38.2% Fibonacci retracement towards our 1st resistance at 118.388 in line with 127.2% Fibonacci projection. Prices are trading above our ichimoku clouds and RSI is on bullish momentum, further supporting our bullish bias.
On the daily, prices are at a strong resistance level. We see the potential for a dip from our 1st resistance at 116.406 in line with 61.8% Fibonacci projection towards our 1st support at 100.008 which is also a graphical overlap. RSI is at levels where dips previously occurred, further supporting the bias of a pullback. On the H4 timeframe prices are at a strong resistance level. We see the potential for a dip from our 1st resistance at 116.347 in line with 127.2% Fibonacci projection towards our 1st support at 115.934 which is also a graphical overlap. RSI is at levels where dips previously occurred, further supporting the bias of a pullback.
Areas of consideration:
- H4 time frame, 1st resistance at 116.347
- H4 time frame, 1st support at 115.934
AUD/USD:
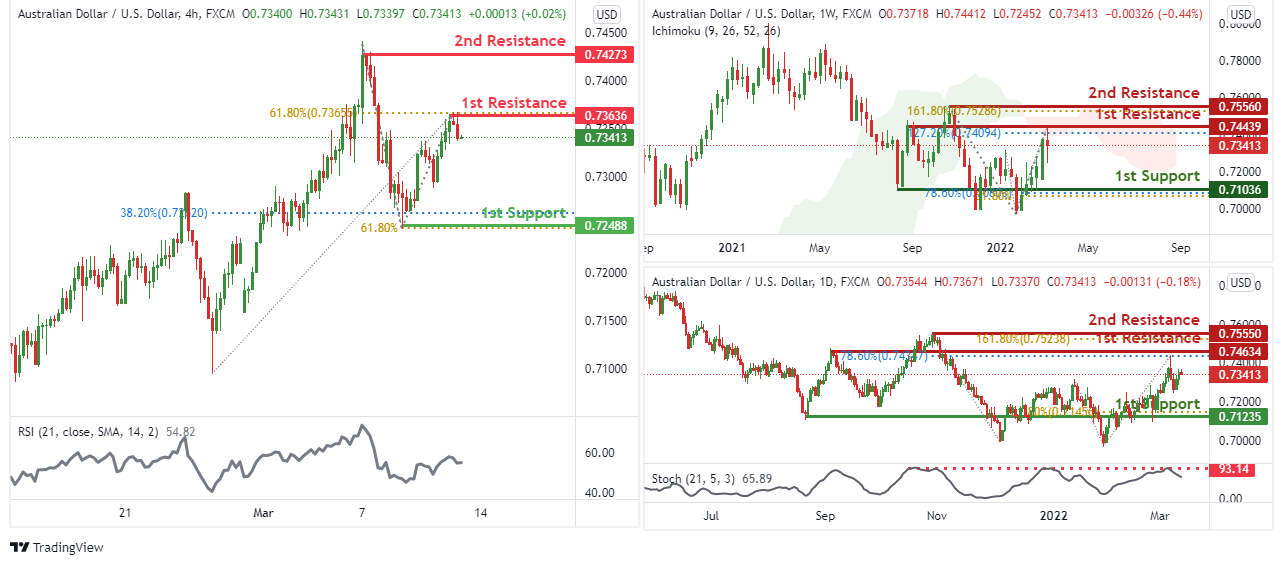
On the weekly chart, we can see that price can potentially dip from the 1st resistance level of 0.74439 which is also 127.2% Fibonacci extension. Price can move to the 1st support level of 0.71036 which is also 61.8% Fibonacci projection and 78.6% Fibonacci retracement. Our bearish bias is further supported by price trading below the Ichimoku cloud indicator.
On the daily chart, price is near the 1st resistance level of 0.73636 in line with 78.6% Fibonacci retracement. Price can potentially dip to the 1st support level of 0.71235 in line with 61.8% Fibonacci retracement. Our bearish bias is further supported by the stochastic indicator as it is near the resistance level.
On the H4 chart, price is near the 1st resistance level of 1.31763 in line with 61.8% Fibonacci retracement. Price can potentially dip to the 1st support level of 0.72488 in line with 38.2% Fibonacci retracement and 61.8% Fibonacci projection. Our bearish bias is further supported by the RSI indicator.
Areas of consideration
- H4 1st resistance at 0.73636
- H4 1st support at 0.72488
NZD/USD:
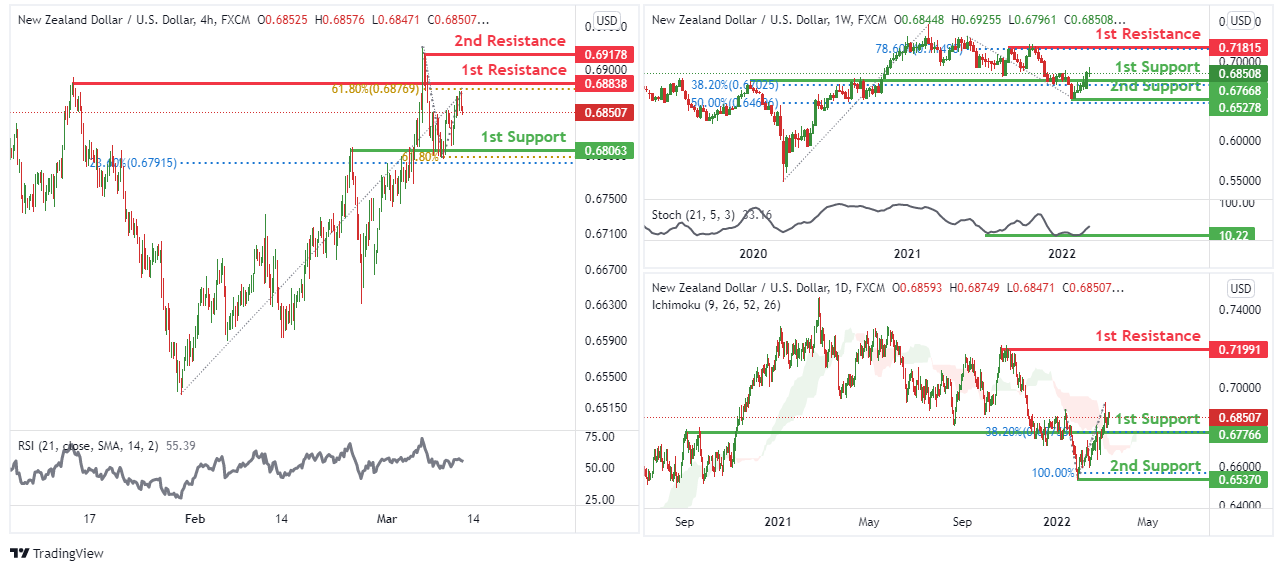
On the weekly chart , price is near 1st support level of 0.68506 in line with 38.2% Fibonacci retracement. Price can potentially move towards the 1st resistance level of 0.71815 in line with 78.6% Fibonacci retracement. Our bullish bias is supported by the stochastic indicator as it is near support level.
On the daily chart, price is at 1st support level of 0.67766 in line with 38.2% Fibonacci retracement. Price can move towards the 1st resistance level of 0.71991 which is a graphical swing high. Our bullish bias is supported by price trading above the Ichimoku cloud indicator..
On the H4 price is near 1st resistance level of 0.68838 in line with 61.8% Fibonacci retracement. Price can potentially dip to the 1st support level at 0.68063 in line with 23.6% Fibonacci retracement and 61.8% Fibonacci projection, which is also a graphical swing low. Our bearish bias is further supported by the RSI indicator.
Areas of consideration :
- H4 1st resistance at 0.68838
- H4 1st support at 0.68063
USD/CAD:
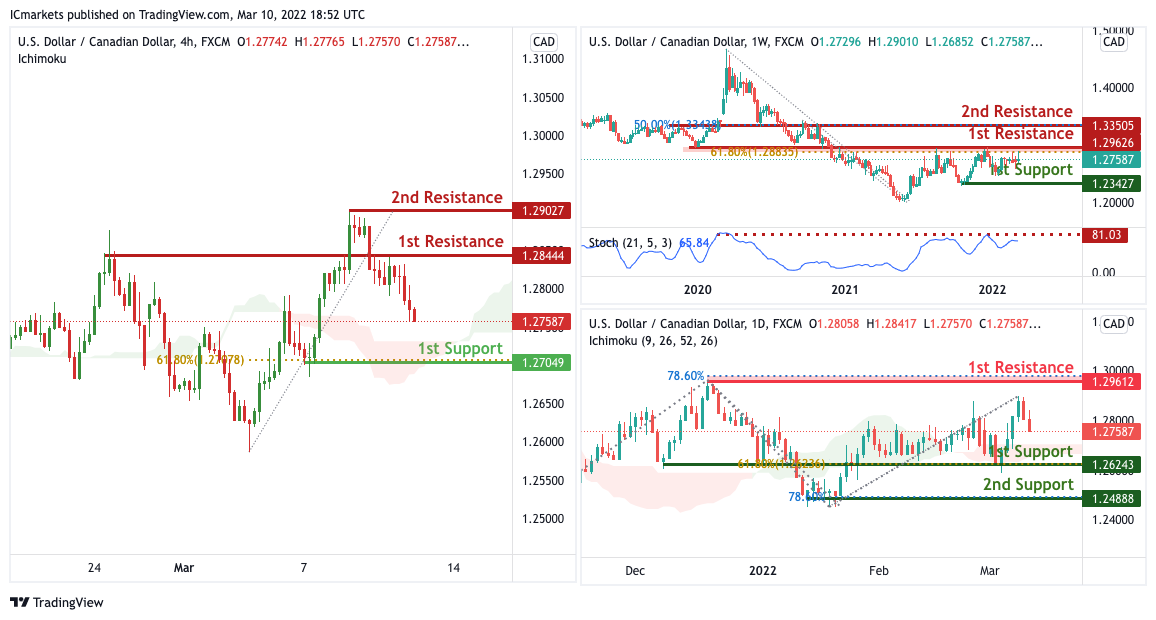
On the weekly timeframe, with price expected to reverse off the resistance of the stochastics indicator, we have a bearish bias that price will drop to our 1st support at 1.23427 in line with the horizontal swing low support from our 1st resistance of 1.29626 in line with the horizontal overlap resistance and 61.8% Fibonacci retracement. Alternatively, price may break our 1st resistance and head for 2nd resistance at 1.33505 in line with the 50% Fibonacci retracement and horizontal pullback resistance.
On the Daily timeframe, price is near 1st support level of 1.26243 in line with horizontal overlap support and 61.8% Fibonacci retracement. Price can potentially rise to the 1st resistance level of 1.29612 in line with the swing high resistance and 78.6% Fibonacci retracement. Alternatively, price may break 1st support and head for 2nd support at 1.24888 where the swing low support. Our bullish bias is supported by how price is moving above the ichimoku cloud.
On the H4 timeframe, with price expected to reverse off the resistance of the stochastics indicator, we have a bearish bias that price will drop to our 1st support at 1.27049 in line with the horizontal swing low support and 61.8% Fibonacci retracement from our 1st resistance of 1.28444 in line with the horizontal overlap resistance. Alternatively, price may break our 1st resistance and head for 2nd resistance at 1.29027in line with the horizontal swing high resistance.
Areas of consideration:
- H4 time frame, 1st support at 1.27049
- H4 time frame, 1st resistance at 1.28444
OIL:
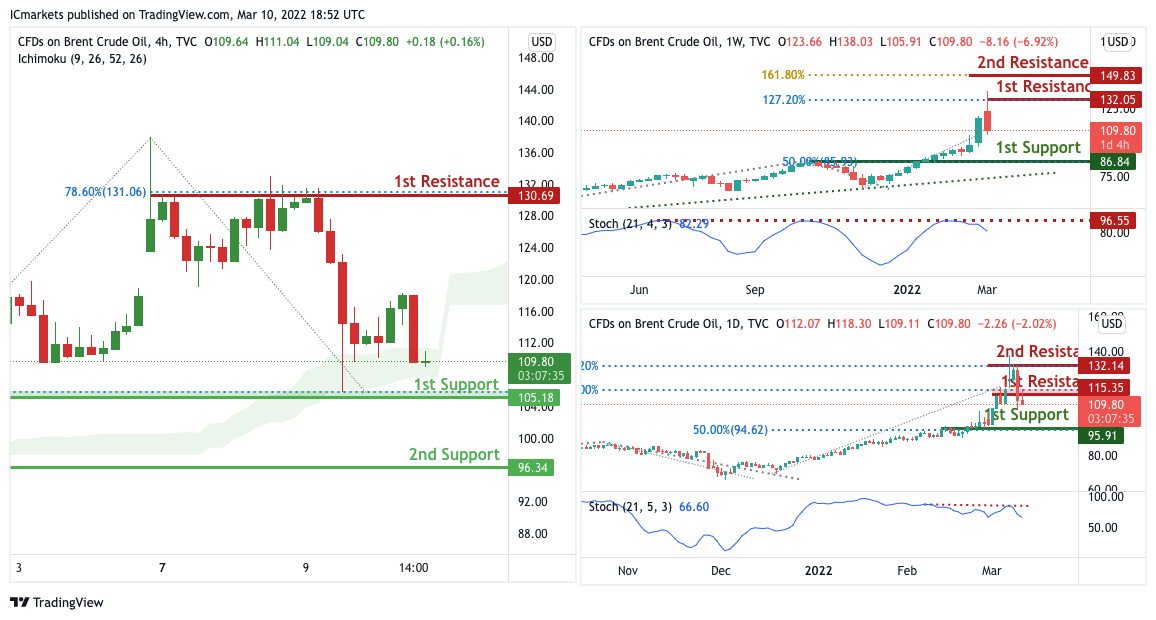
On the weekly timeframe, with price expected to reverse off the resistance of the stochastics indicator, we have a bearish bias that price will drop to our 1st support at 86.84 in line with the 50% Fibonacci retracement from our 1st resistance of 132.05 in line with the 127.2% Fibonacci extension. Alternatively, price may break our 1st resistance and head for 2nd resistance at 149.83 in line with the 161.8% Fibonacci extension.
On the Daily timeframe, with price expected to reverse off the resistance of the stochastics indicator, we have a bearish bias that price will drop to our 1st support at 95.91 in line with the 50% Fibonacci retracement from our 1st resistance of 115.35 in line with the 100% Fibonacci projection. Alternatively, price may break our 1st resistance and head for 2nd resistance at 132.14 in line with the 127.2% Fibonacci extension..
On the H4 timeframe, price is near 1st support level of 105.18 in line with horizontal overlap support and 78.6% Fibonacci retracement. Price can potentially rise to the 1st resistance level of 130.69 in line with the swing high resistance and 78.6% Fibonacci retracement. Alternatively, price may break 1st support and head for 2nd support at 96.34 where the swing low support. Our bullish bias is supported by how price is moving above the ichimoku cloud.
Areas of consideration:
- H4 time frame, 1st resistance of 130.69
- H4 time frame, 1st support of 105.18
Dow Jones Industrial Average:
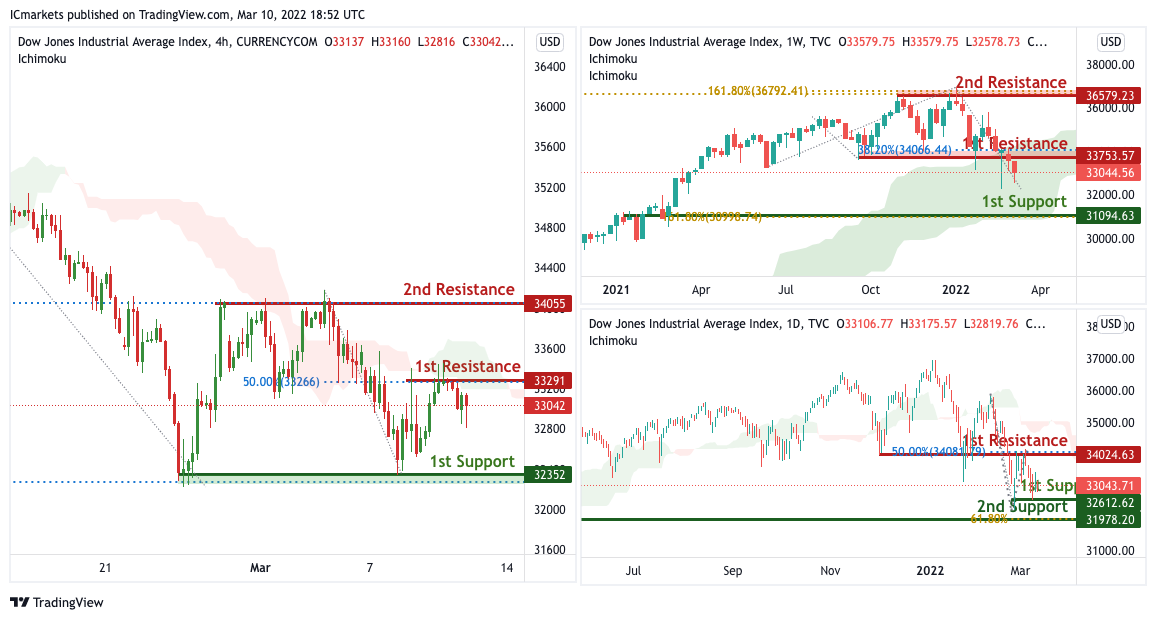
On the Weekly timeframe, we have a bearish bias that price will drop from 1st resistance at 33753 in line with the 38.2% Fibonacci retracement to 1st support at 31094 in line with 61.8% Fibonacci retracement.Alternatively, price may break pivot structure and head for 2nd support at 36579 in line with the 161.8% Fibonacci projection. Our bearish bias is supported by how price has recently broken the 1st support of the ichimoku cloud and is expected to bounce off the second support.
On the Daily timeframe, price is near 1st support level of 32612 in line with horizontal swing low support. Price can potentially rise to the 1st resistance level of 34024 in line with the 50% Fibonacci retracement. Alternatively, price may break 1st support and head for 2nd support at 31978 where the 61.8% Fibonacci retracement. Our bullish bias is supported by how price is moving above the ichimoku cloud.
On the H4 timeframe, with price at the resistance of the ichimoku cloud, we have a bearish bias that price will drop from 1st resistance at 33291 in line with the 50% Fibonacci retracement to 1st support at 32352 in line with the swing low support and 127.2% Fibonacci extension .Alternatively, price may break pivot structure and head for 2nd support at 34055 in line with the 50% Fibonacci retracement. Our bearish bias is supported by how price is moving below the ichimoku cloud.
Areas of consideration :
- H4 1st support at 32352
- H4 1st resistance at 33291
Crude Oil Price Reverse Gains And Faces Resistance
Key Highlights
- Crude oil price surged to $131 before there was a sharp decline.
- It broke a major bullish trend line at $118.50 on the 4-hours chart.
- EUR/USD corrected losses and climbed above 1.1020.
- Gold price stayed above the $1,975 support zone.
Crude Oil Price Technical Analysis
In the past few days, crude oil price saw a major increase above $100.00 against the US Dollar. The price surpassed the $120.00 level and extended gains.
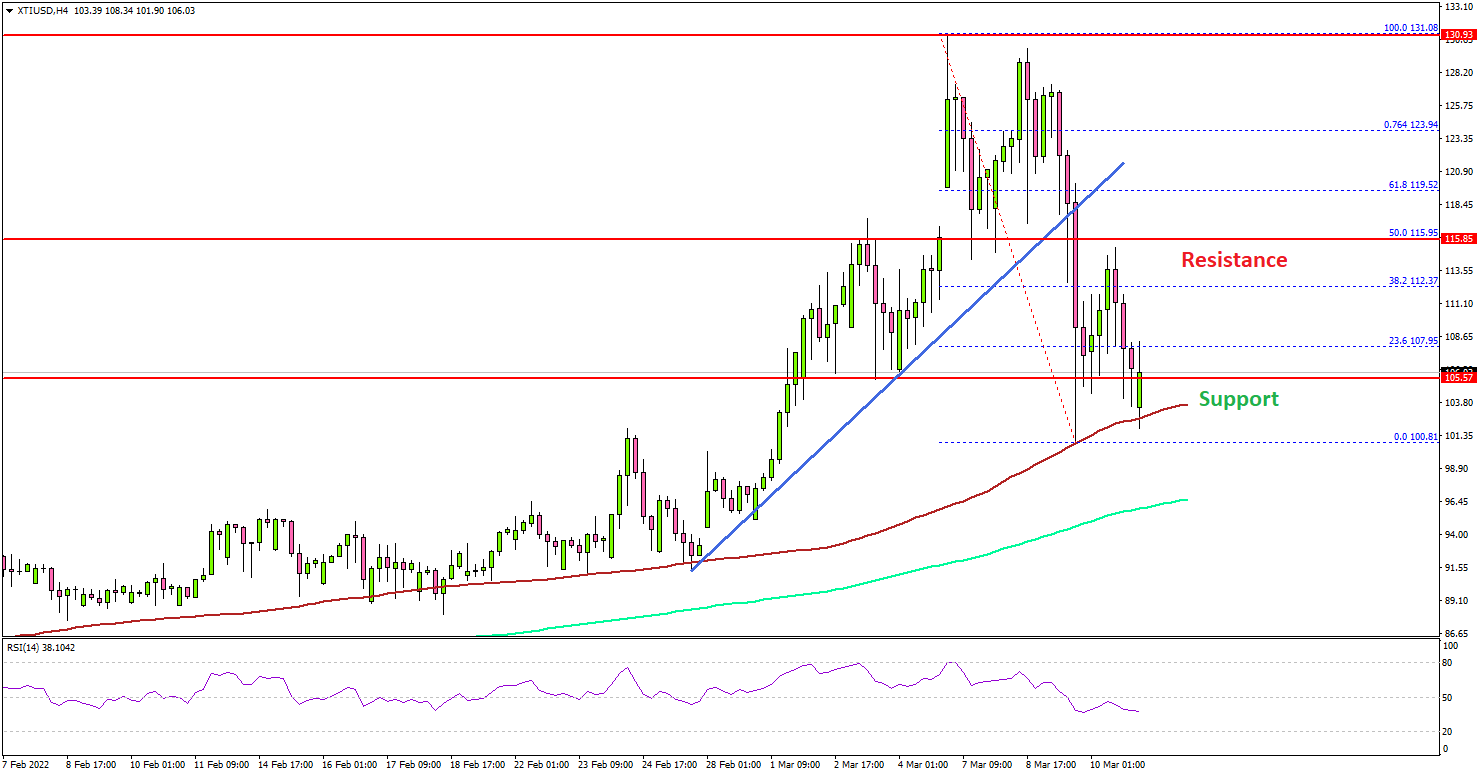
Looking at the monthly chart of XTI/USD, the price even surged towards $130.00. A multi-year high was formed near $131.08 and the price settled above the 100 simple moving average (red, 4-hours).
Recently, there was a sharp downside correction below the $120.00 level. The price even dived below $110.00. However, the bulls were active near the $100.00 level and the 100 simple moving average (red, 4-hours).
The price started a fresh increase and climbed above the $110.00 level. It is now facing resistance near the $115 zone. The next major resistance might be $120.00, above which oil price might revisit $130.00.
If not, there is a risk of a fresh move towards the $100.00 support level. Any more gains might call for a test of the $95.00 level and the 200 simple moving average (green, 4-hours).
Fundamentally, the US Consumer Price Index for Feb 2022 was released yesterday by the US Bureau of Labor Statistics. The market was looking for a 7.9% increase in the CPI compared with the same month a year ago.
The actual result was similar, as the US Consumer Price Index increased 7.9%. The monthly change was +0.8%, up from the last +0.6%.
Looking at EUR/USD, the pair started a decent recovery wave above 1.0950 and 1.1000. Besides, GBP/USD is still consolidating above 1.3100.
Economic Releases to Watch Today
- UK GDP for Jan 2022 (MoM) - Forecast +0.2%, versus -0.2% previous.
- German Consumer Price Index for Feb 2022 (YoY) – Forecast +5.1%, versus +5.1% previous.
- German Consumer Price Index for Feb 2022 (MoM) – Forecast +0.9%, versus +0.9% previous.
- Canada’s employment Change for Feb 2022 – Forecast 160K, versus -200.1K previous.
- Canada’s Unemployment Rate for Feb 2022 - Forecast 6.2%, versus 6.5% previous.
Elliott Wave View: USDCHF 5 Waves Rally Favors Upside
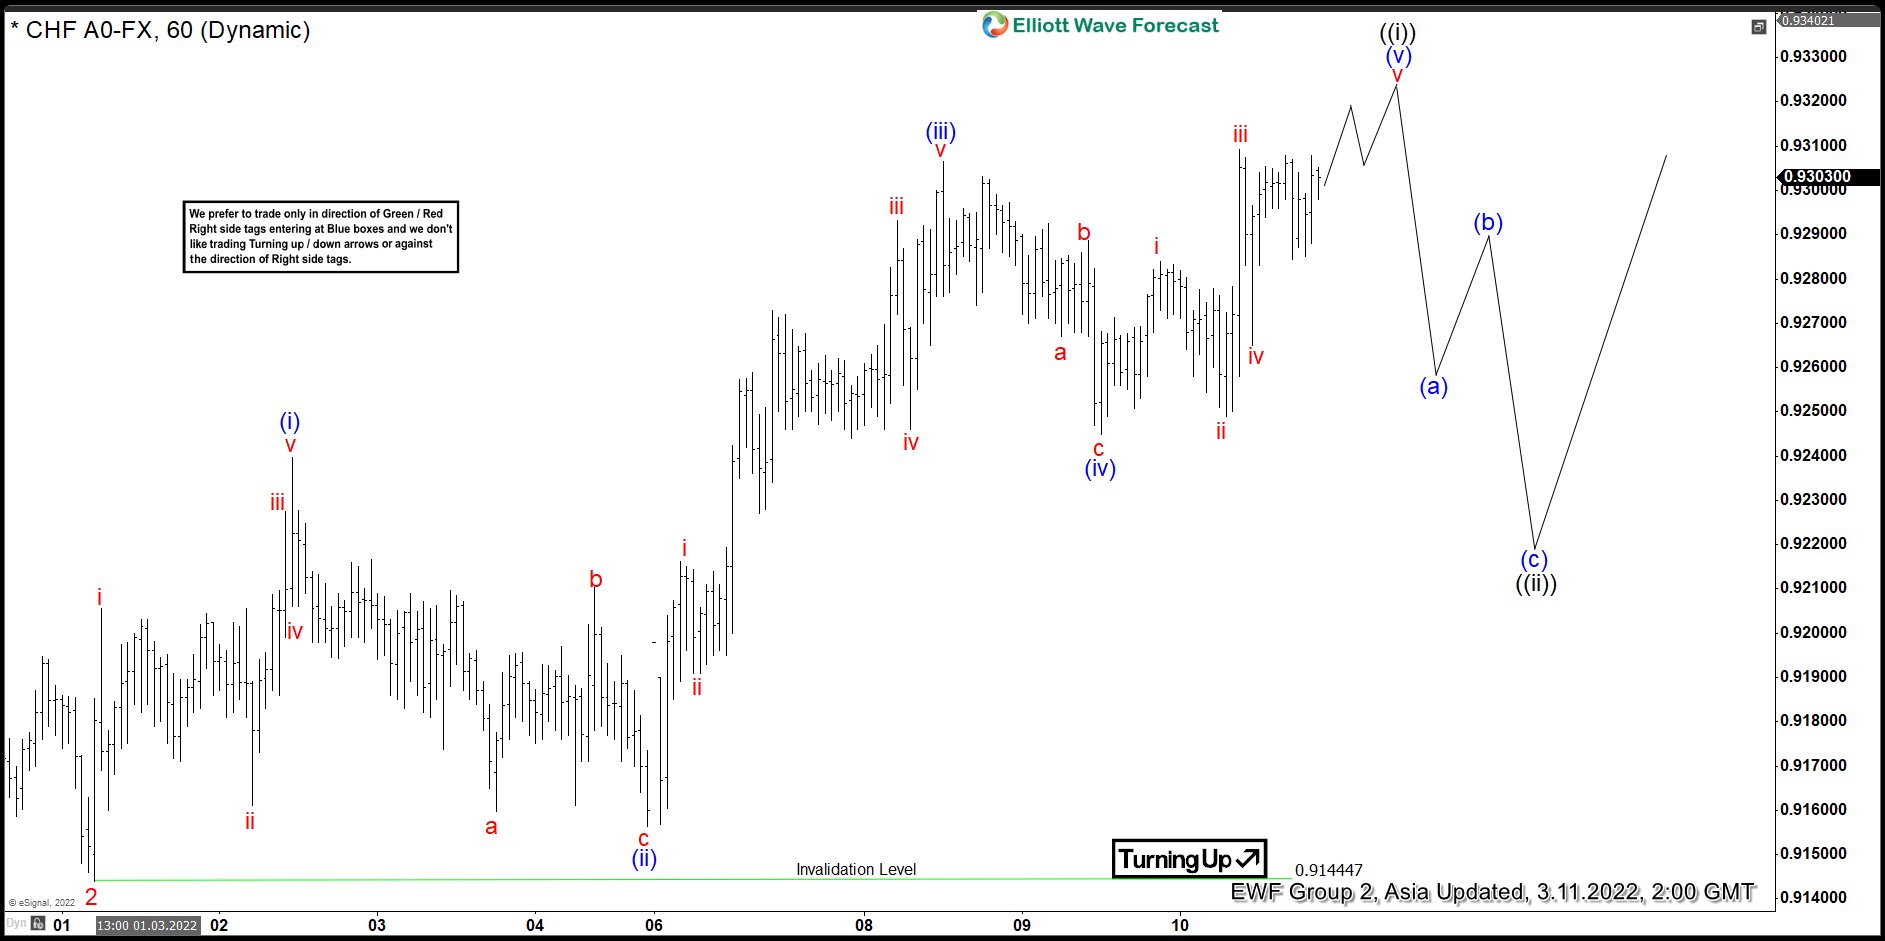
Short Term Elliott Wave View in USDCHF suggests the rally from January 13, 2022 low is unfolding as a 5 waves impulse. Up from January 13 low, wave 1 ended at 0.9343 and pullback in wave 2 ended at 0.9144. The 60 minutes chart below shows pair has turned higher again in wave 3. Internal subdivision of wave 3 is unfolding as another 5 waves in lesser degree. Up from wave 2, wave (i) ended at 0.9239 and dips in wave (ii) ended at 0.9156. Pair then resumes higher in wave (iii) towards 0.9306 and pullback in wave (iv) ended at 0.9245. Expect wave (v) to end soon which should also complete wave ((i)).
Pair should then pullback in wave ((ii)) to correct cycle from March 1 low before the next leg higher. Near term, as far as pivot at 0.914 low stays intact, expect pullback to find support in the sequence of 3, 7, or 11 swing for further upside in wave ((iii)). The bias to the upside will get further validation if pair can break above wave 1 on January 31, 2022 at 0.934. Break above wave 1 should create a higher high (bullish ) sequence from January 13, 2022 low confirming the upside bias.
USDCHF 60 Minutes Elliott Wave Chart
Eco Data 3/11/22
[php_everywhere instance="1"]
US inflation accelerates, but the Fed’s hands are tied
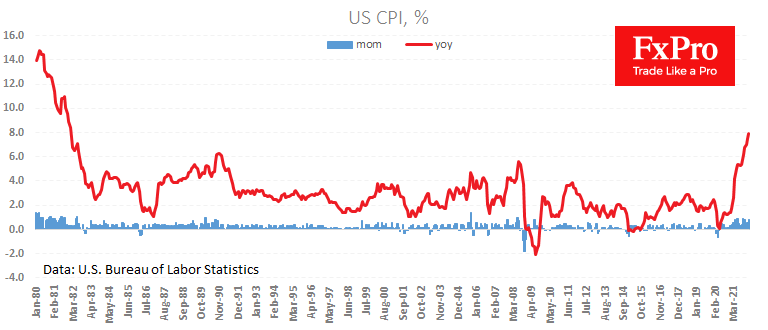
Consumer prices in the USA rose by 0.8% in February as expected. Inflation for the same month a year earlier was 7.9% compared to 7.5% a month earlier and in line with average forecasts.
Over the last 12 months, the actual data has exceeded the forecast ten times, so the stabilisation seen in February is regarded as cautiously good news. Previously, market participants had assumed that inflation would peak in February, but the latest round of commodity prices makes these forecasts overly optimistic.
In peacetime, markets would have priced in more decisive monetary policy tightening moves by the Fed. However, investors have recently discounted expectations of a rate hike by 50 points, contrary to a jump in commodity prices. The markets assume that the Fed will be much more cautious in tightening policy. This thesis is doubly true against the background of falling government bond yields and widening spreads between them and high-yield bonds.
When the Fed has limited capacity to respond to inflation, this is bad news for the dollar because it undermines its long-term prospects for maintaining purchasing power. In this regard, the impulsive pressure on the US currency immediately after the release should not be surprising.
Long term, this is also good news for bitcoin, which is not subject to inflation. However, the short-term reaction could well be mixed, as fears of a new stock market decline are also added to this cocktail, as stocks “don’t like” accelerating inflation.
Dollar Pushes Wobbly Yen to 116
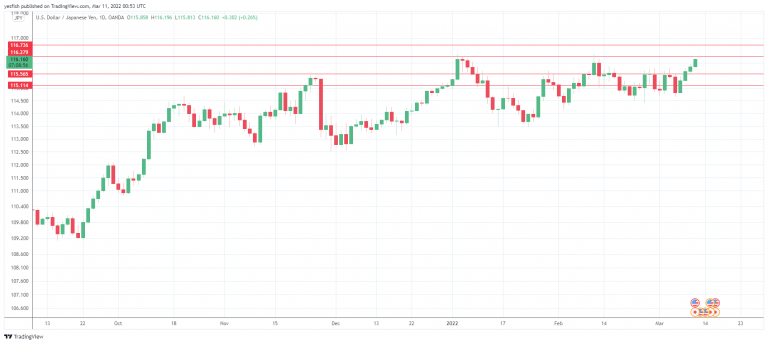
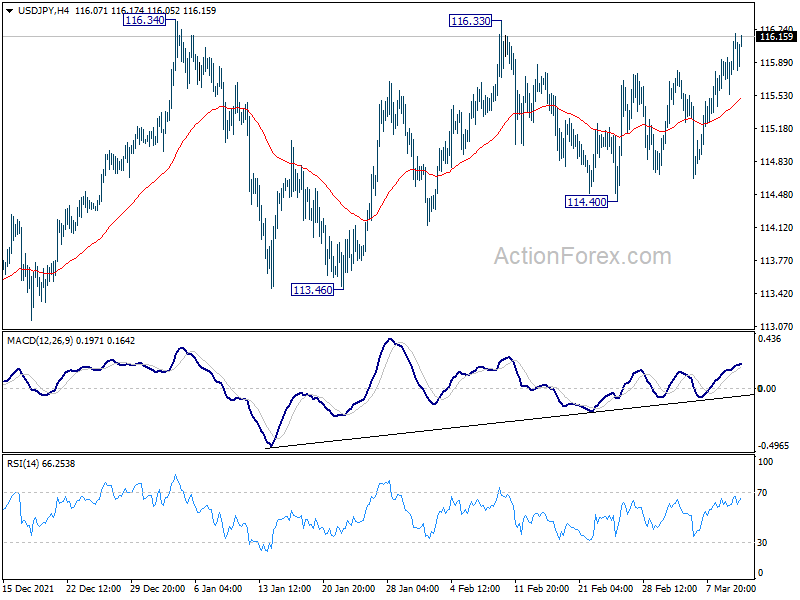
The Japanese yen continues to lose ground to the US dollar. USD/JPY has climbed above the 116 line for the first time since early February. The yen is on its heels, as USD/JPY is within striking distance of 116.35, which has held since January 2017.
With risk apprehension at high levels due to the Ukraine crisis and the staggering surge in oil prices, financial markets have been volatile and investors have snapped up safe-haven assets, such as the US dollar. The yen is also considered a safe-haven currency, but with the US economy in much better shape than that of Japan, the US dollar has been the big winner from the recent turbulence.
US inflation jumps to 7.9%
In the US, headline CPI continued to accelerate, with a gain of 7.9% for February YoY. This matched the forecast and was up from 7.5% beforehand. With inflation running close to 8%, a rate hike is a virtual given at next week’s meeting. What happens after that is less clear, as the Fed has to worry about stagflation, given the massive upswing in oil prices.
The markets are expecting positive numbers from Japan on Friday, which could give the beleaguered yen a shot in the arm. Household Spending, a key driver of the economy, is expected to show a strong gain of 3.6% YoY for January, following a 0.2% decline in December. The BSI Manufacturing Index is forecast to accelerate to 8.2 for Q1, up from 7.9 beforehand.
On the Ukraine front, a meeting between the foreign ministers of Russia and Ukraine earlier today did not result in any breakthroughs, although the sides agreed to continue to meet. The fighting continues, and with the Russian invasion force appearing to have stalled, there are fears that Russian President Putin could barrel down in frustration and hit more civilian targets. This would exacerbate the massive humanitarian crisis, which has displaced millions of Ukrainians.
For Japan, the crisis in Ukraine could further muddy the outlook for the county’s fragile economy. Oil has pushed has risen as high as USD 130 and a disruption in Russian oil and gas deliveries to world markets will send energy prices even higher, which will raise prices and dampen consumer spending.
USD/JPY Technical
- USD/JPY has support at 114.71. Next, the 100-DMA at 114.37 is providing support
- There is resistance at 116.06 and 116.59
Sunset Market Commentary
Markets
Markets yesterday staged a broad risk-on repositioning since the start of the Russian invasion in Ukraine, hoping that mutual economic retaliations at least would come to a pause. There was even hope that a high level meeting between the foreign ministers of Ukraine and Russian could yield some progress. That didn’t materialize as Russia still urges that its demands will need to be fulfilled first. After yesterday’s impressive rise, European equities, the euro and yields corrected mostly lower even before the headlines of the failure of the talks hit the screens.
The ECB as expected left policy rates unchanged. However, even the ECB can’t ignore runaway inflation anymore. The recalibration of the APP program in order to guarantee a smooth transition after the end of PEPP was changed before it at even started. APP buying will be raised to €40 bln in April, but will immediately being scaled back to €30 bln in May and €20 bln in June. The statement then reads that ‘If the incoming data support the expectation that the medium-term inflation outlook will not weaken even after the end of our net asset purchases, the Governing Council will conclude net purchases under the APP in the third quarter.’ According to the December roadmap, the ECB only expected APP to be reduced to € 20 bln in Q4. The bank also amended the sentence that ‘it expects the key ECB interest rates to remain at their present or lower levels’ by scrapping “or lower”. The ECB now guides that ‘Any adjustments to the key ECB interest rates will take place some time after the end of the Governing Council’s net purchases under the APP’. Growth and inflation evidently are subject to a high degree of uncertainty. Even so, the new ECB roadmap opens the door for a first rate hike at the September or October meeting. According to the ECB forecasts growth is downwardly revised to 3.7% in 2022 (from 4.2% in December) for 2022, to 2.8% (from 2.9%) and left unchanged at 1.6% for 2024. On the other hand inflation is once again upwardly revised to 5.1% this year (from 3.2%), to 2.1% in 2023 (from 1.8%) and to 1.9% in 2024 (from 1.8%). So, the ECB forecast puts inflation above or near the 2.0% target over the whole policy horizon, opening the way to more protracted policy normalization. EMU interest rate markets are reacting accordingly. Markets now again expect positive money market rates at the end of the year. The German curve bear flattens with yields rising 11/12 bps for the 2/5-y sector, down to 1.7 bps for the 30-y. The 10-y EMU swap almost touched the 1.0% barrier for the first time since October 2018. The 2-y surpassed 0.25% first time since 2014. Faster phasing out of APP bond buying widened the intra-EMU bond spreads with the 10-y Italian spreads rising 15 bps. European equities are ceding up to 3.0% after yesterday’s astonishing rally, but most of this correction occurred before the ECB policy announcement.
Moves on the FX market are again less pronounced (and less sustained) compared to what happens on interest rate markets. The euro briefly touched EUR/USD 1.11+ levels, but currently even trades in the red (1.1020). The dollar reversed post-ECB softness with DXY at 98.20, near intraday highs. Post ECB euro strength against sterling also evaporates, with EUR/GBP (0.8385)n returning near opening levels.
News Headlines
US inflation in February perfectly matched analyst consensus, quickening from 0.6% m/m to 0.8% to be up 7.9% y/y (from 7.5% in January). And it probably hasn’t peaked yet. Core inflation also rose from 6% to 6.4%. Owing to the sharpest price increase in four decades is exceptionally strong energy inflation (3.5% m/m) in particular. However, price pressures are broad-based with key-component shelter (with a 32% basket weight) costs growing an above-average 0.5% m/m. The food price is also on the rise (1%) as is transportation (1.9%). With inflation rising as expected, US money markets have little reason to ramp up bets for an aggressive hiking cycle (ie 50 bps) that will take off in March. US yields are higher since the CPI release but that was the result of knock-on effects by the ECB publishing its policy statement. US yields are rising between 3 bps (5-y) and 1.5 bp (30-y).
U.S. Inflation Reaches New Post-Pandemic High in February
Consumer prices continued to heat up in February, jumping 0.8% month-on-month (m/m). That marks an acceleration from the prior two months' pace. That drove the year-on-year (y/y) pace of inflation to 7.9%, the fastest pace in over 40 years.
Not surprising to anyone who has filled up their tank this winter, the 6.6% m/m jump in gasoline prices was a key driver, accounting for almost a third of the headline increase. Food price gains also accelerated, rising 1.0% m/m. Food prices were up 7.9% versus a year ago in February.
Core inflation (ex. food and energy) also jumped up 0.5% m/m, tiptoeing down from January's 0.6% gain. As a result, the year-on-year rate of core inflation picked up to 6.4%, also a new post-pandemic high.
Shelter costs were once again a key contributor to monthly inflation, rising 0.5% m/m and accounting for 40% of the increase in core prices. Shelter inflation is up 4.7% year-on-year, the fastest pace since 1991. But prices were also up strongly elsewhere: recreation (+0.7% m/m), household furnishings and operations (+0.6% m/m), motor vehicle insurance (+1.2% m/m), personal care (+1.2% m/m), airline fares (+5.2% m/m), and apparel (+0.7% m/m).
Notably, used vehicle prices fell 0.2% m/m and new vehicle prices were up 0.3% m/m – a modest gain compared to recent history. Vehicle prices have been a key source of inflation over the past year.
Core goods inflation rose 0.4% m/m in February, a big step down from the 1% monthly gains they had averaged since October. Unfortunately, as core goods inflation cools, core services inflation picked up, rising 0.5% m/m.
Key Implications
Another month, another new high for inflation. Unfortunately, things are about to get worse before they get better. Russia's war in Ukraine has pushed prices for many commodities sky high, and these will boost headline inflation in the coming months. Headline CPI inflation will almost certainly top 8% in March, how long it will remain there depends on the highly volatile path of oil prices and to what degree higher agricultural commodity prices are passed on at the grocery store.
We still expect inflation to move downward over the course of 2022. With food and energy prices likely to see continued upward pressure due to the war, easing inflation will show up in core prices first. We are starting to see inflation for one previously problematic area (new and used vehicle prices) ease. And, as we move into the spring, base effects will pull the annual rate of core inflation lower. Core inflation rose 7.8% annualized in the second quarter of 2021 (or 0.8% m/m on average) as a rapidly reopening economy saw prices surge for many travel-related goods and services. Core prices would need to exceed that pace this spring to prevent the pace from decelerating.
Economists focus on core inflation to gauge underlying price pressures in the economy, because food and energy prices are volatile and often mean revert. But consumers pay for the full basket of goods. Even with healthy wage gains due to a tight labor market, inflation is going to weigh on consumer spending in real terms, slowing growth in the broader economy. The Fed is set to raise interest rates next week, but how many hikes we ultimately see depends on how much the war tightens financial conditions and slows economic growth in the coming months.
USD/JPY Mid-Day Outlook
Daily Pivots: (S1) 115.36; (P) 115.58; (R1) 115.88; More...
Intraday bias in USD/JPY stays neutral at this point. On the upside, firm break of 116.34 will resume larger up trend from 102.58 to 118.65 long term resistance next. On the downside, though, break of 114.40 will continue the corrective pattern from 116.34 with another fall to 113.46 support.
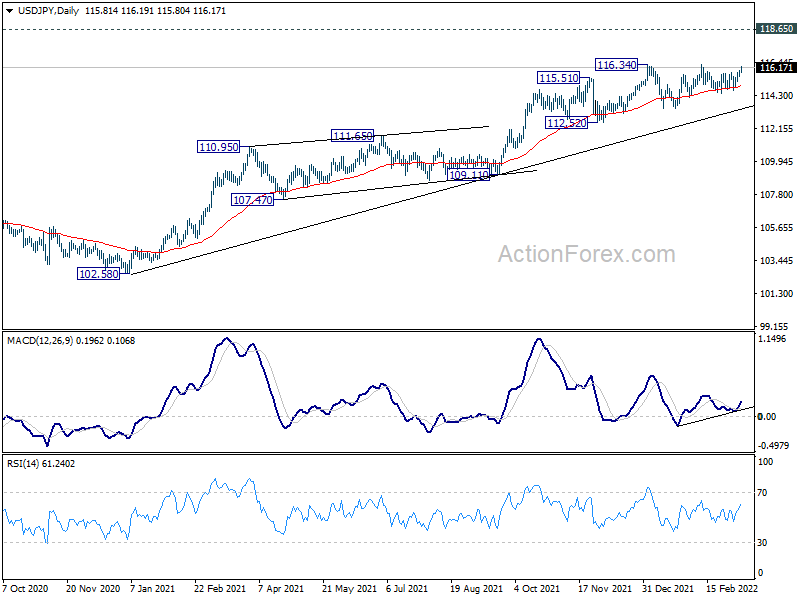
In the bigger picture, no change in the view that rise from 102.58 is the third leg of the up trend from 101.18 (2020 low). Such rally should target a test on 118.65 (2016 high). Sustained break there will pave the way to 120.85 (2015 high) and raise the chance of long term up trend resumption. This will remain the favored case as long as 55 week EMA (now at 111.64) holds.
USD/CHF Mid-Day Outlook
Daily Pivots: (S1) 0.9243; (P) 0.9273; (R1) 0.9296; More....
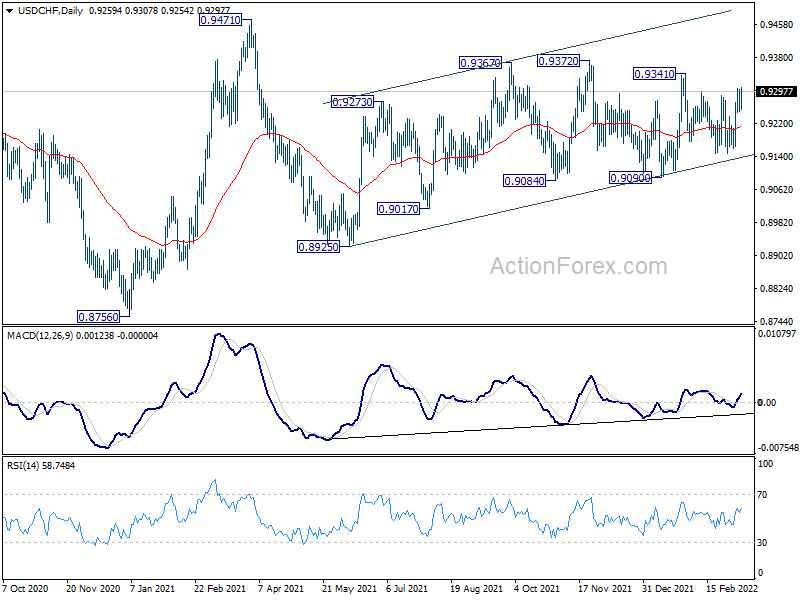
Sideway trading continues in USD/CHF and intraday bias remains neutral. Choppy rise from 0.8925 would still be in favor to extend higher as long as 0.9090 support holds. Break of 0.9341 will target 0.9372 resistance and then 0.9471. On the downside, however, break of 0.9090 will bring deeper fall back to 0.8925 support.
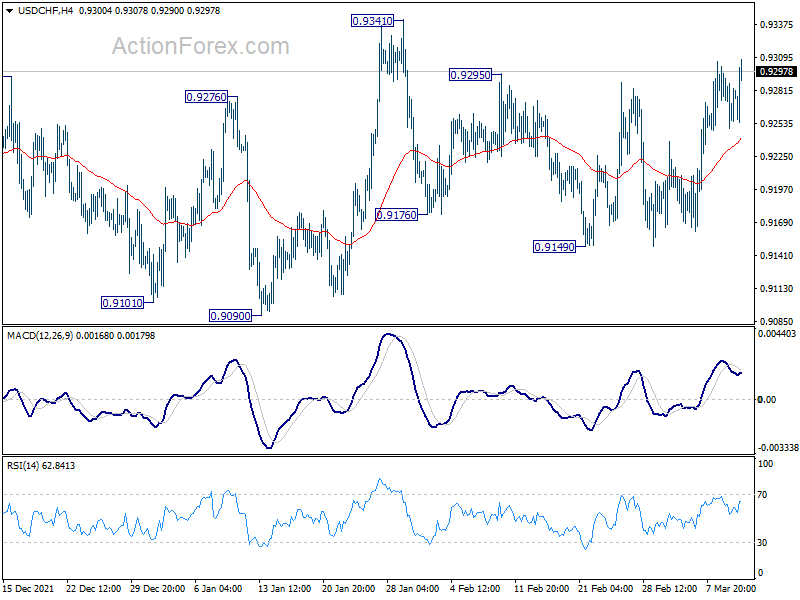
In the bigger picture, medium term outlook will be neutral at best as long as 0.9471 resistance holds. Larger down trend could still extend through 0.8756 (2021 low). However, firm break of 0.9471 will argue that the trend has already reversed and rebound the rally from 0.8756 with another impulsive move.