Sample Category Title
USDCAD Deflects Off 1.29 Hurdle, Soft Uptrend Still Intact
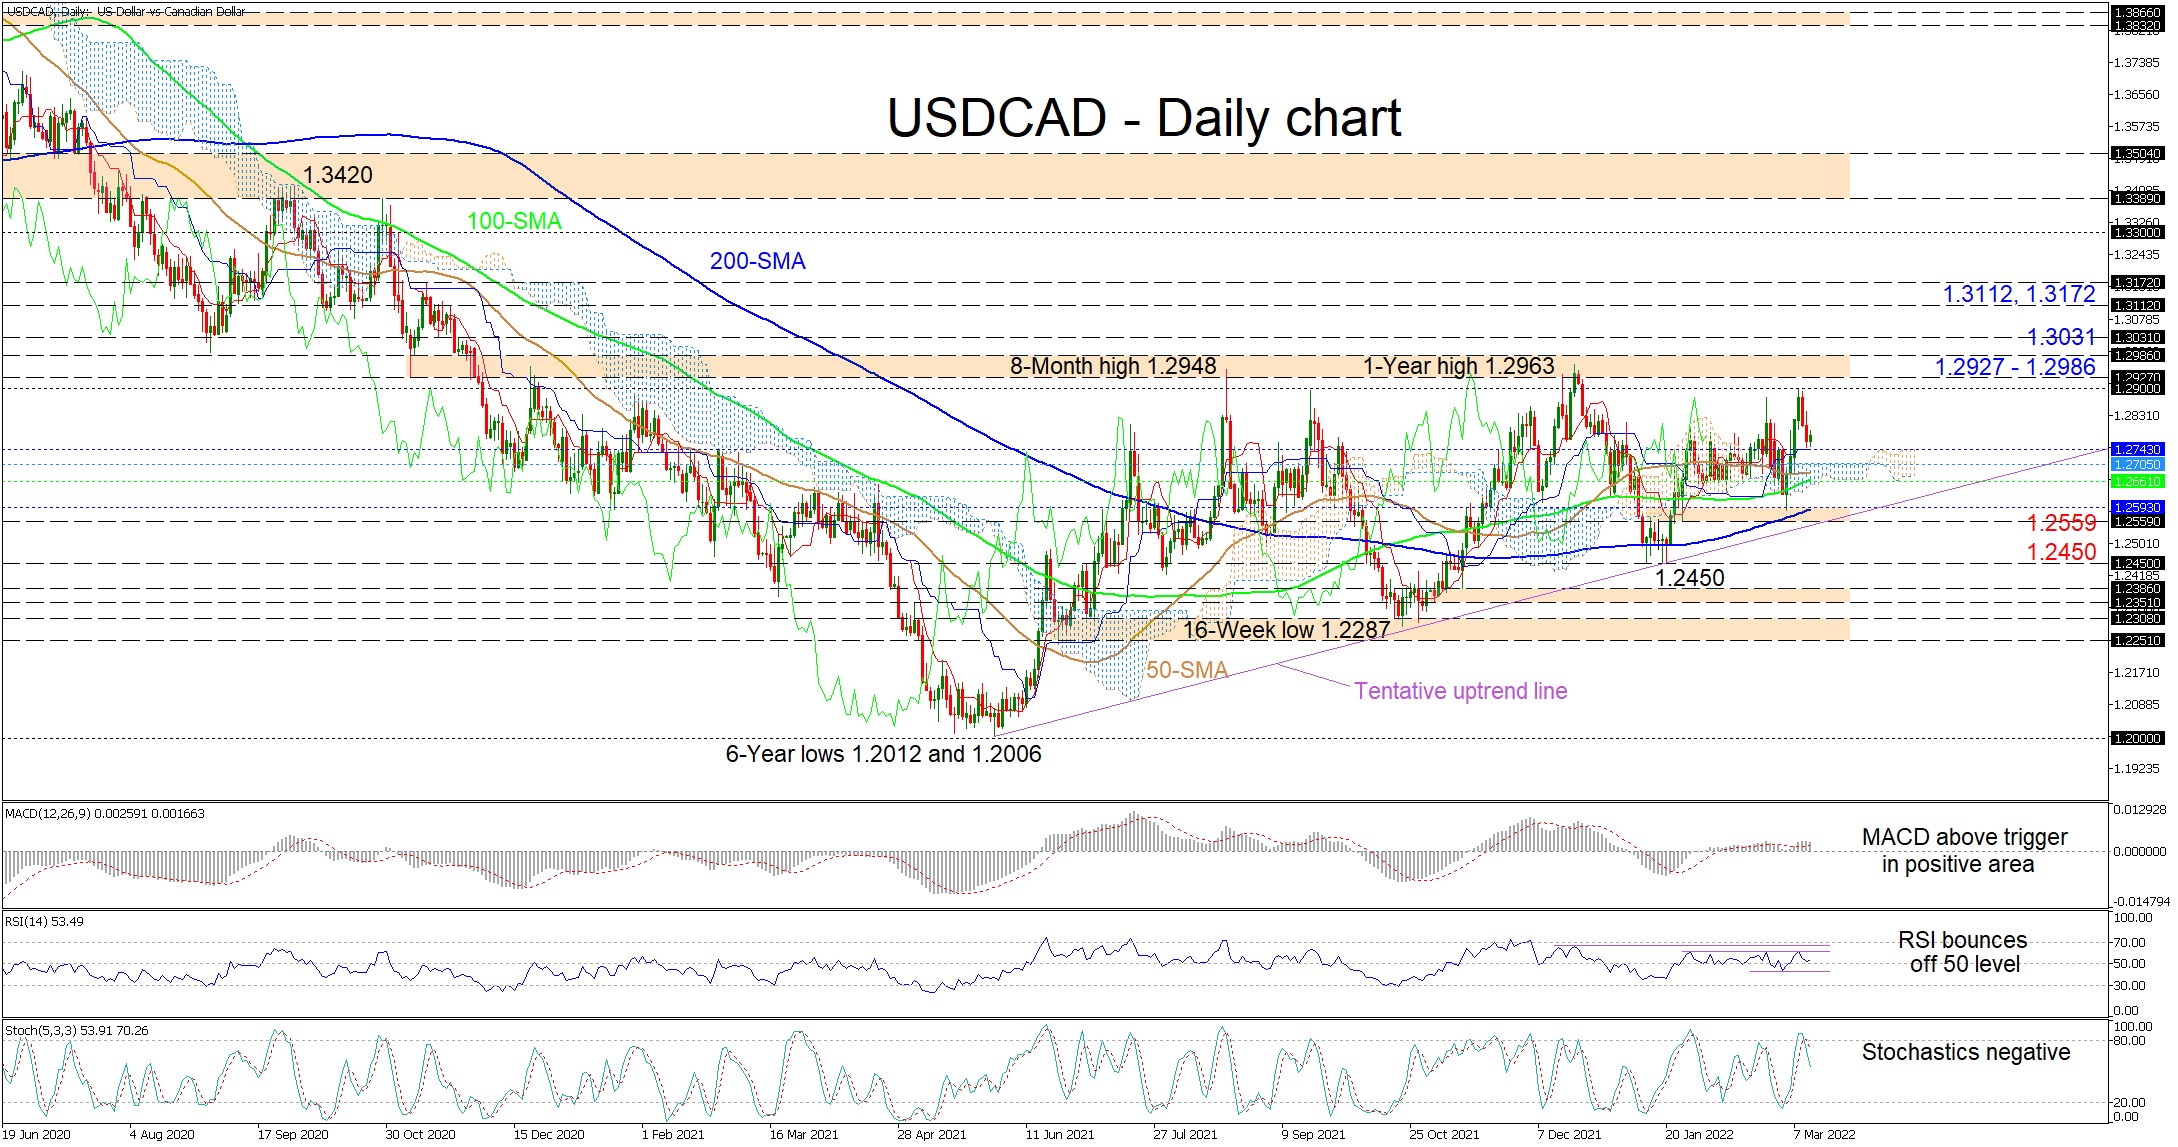
USDCAD buyers have emerged around the Ichimoku lines at 1.2743 after the fresh pullback from the 1.2900 mark. Currently, the simple moving averages (SMAs) are endorsing a neutral-to-bullish trend in the pair.
At the moment, the Ichimoku lines are not conveying any clear driving forces, while the short-term oscillators are transmitting mixed signals in directional momentum. The MACD, slightly in the positive zone, is holding above the red trigger line, while the RSI has started to turn higher just above the 50 threshold. Meanwhile, the negatively charged stochastic oscillator continues to promote additional bearish price action in the pair.
At present the price is finding footing from the Ichimoku lines around 1.2743. A price dip in the pair below the Ichimoku lines could encounter a fortified zone of support between the Ichimoku cloud’s upper surface at 1.2705 and the 100-day SMA at 1.2661. In the event sellers drive the pair beneath the cloud, the support border from the 200-day SMA at 1.2593 until the 1.2559 barrier, which overlaps with a tentative uptrend line pulled from the six-year low of 1.2006, could draw traders’ attention. A deeper retreat from here may then test the 1.2450 trough from mid-January.
Otherwise, if buyers produce positive traction off the Ichimoku lines at 1.2743, the bulls may meet initial upside constraints at the 1.2900 handle before challenging the critical 1.2927-1.2986 resistance boundary. Successfully overcoming this barricade that has capped advances since November 2020, the price could then snag at the 1.3031 level before targeting the 1.3112 and the 1.3172 highs from the second half of November 2020.
Summarizing, for USDCAD’s medium-term uptrend to remain intact, the price would need to hold above the cloud and the 1.2559-1.2593 support band. An extended dive below the 1.2450 trough would intensify negative pressures, while a climb north of the 1.2927-1.2986 ceiling could juice up upside momentum.
EUR/USD Outlook: Recovery Stall and Formation of Bull Trap Weigh on Euro
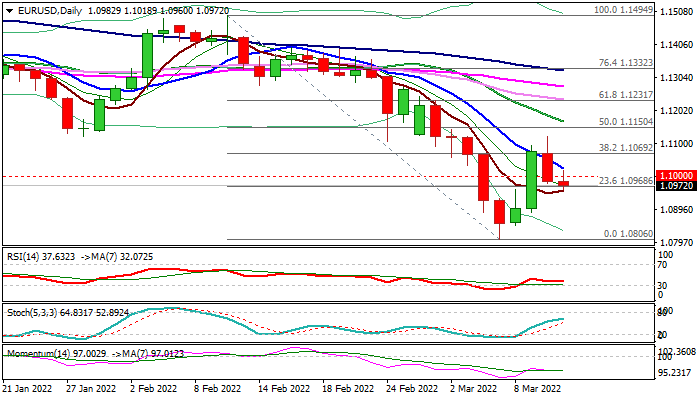
The Euro extends weakness in early Friday after strong recovery from multi-month low (1.0806) lost traction and quick pullback resulted in bearish close on Thursday (big red daily candle with long upper shadow).
The sentiment weakened by rising growth risks that offset the impact from ECB’s unexpectedly hawkish stance, while strong US inflation report added to hopes for Fed’s rate hike next week and lifted dollar.
With 50% of two-day 1.0806/1.1121 rebound being retraced so far, recovery phase is likely over and weekly close below 1.10 level to confirm bears back in play.
Bearish signal was generated on formation of bull-trap on daily chart after recovery repeatedly failed to sustain break above pivotal Fibo barrier at 1.1069 (38.2% of 1.1494/1.0806) and subsequent pullback completed the pattern.
Daily studies support negative scenario as 14-d momentum turned south after brief recovery and remains deeply in the negative territory, while moving averages remain in bearish configuration after the price action repeatedly failed to clearly break above initial obstacle (falling 10DMA).
Near-term bias is expected to remain with bears while the price action continues to trade below 1.10 level, with extension below 1.0926 (Fibo 61.8% of 1.0806/1.1121 upleg) to confirm reversal. Conversely, return and close above 1.10 handle would ease downside pressure, however, near-term action would remain without clear direction below cracked pivot at 1.1069 (Fibo 38.2% of 1.1494/1.0806) and only firm break here would bring bulls fully in play.
Res: 1.1000; 1.1023; 1.1046; 1.1095.
Sup: 1.0957; 1.0926; 1.0880; 1.0848.
Turkish Lira Under Sustained Pressure Due to Energy, Food Prices
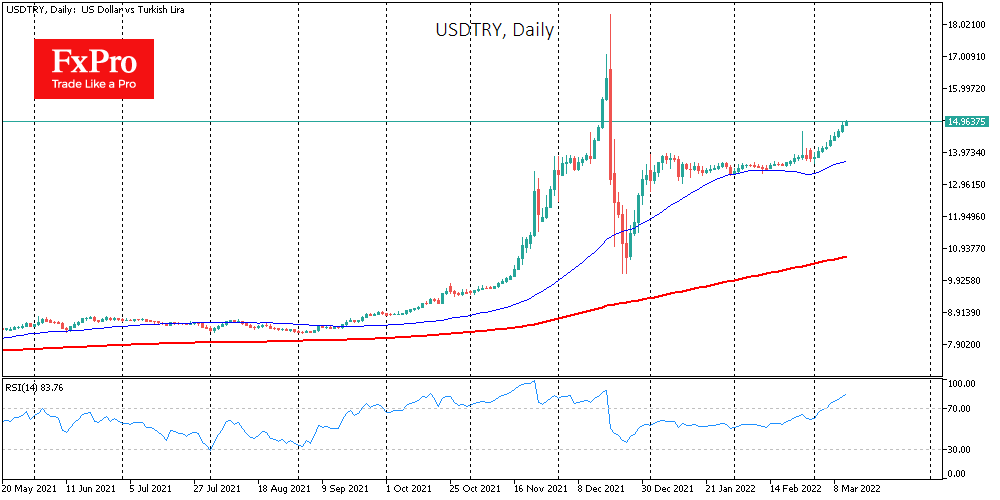
The Turkish lira has fallen back-to-back on each working day in March, having weakened against the US Dollar by 8.2% over this time and coming close to 15.0, where it was last seen in mid-December.
The current development of the lira is reminiscent of the early October-November situation when we have seen a similar sustained decline, but the volatility (by the standards of the Turkish lira) has remained subdued.
The pressure on the lira is due to the country’s heavy reliance on imports of oil, gas, and agricultural commodities, mainly wheat. Turkey’s Current Account deficit rose to 7.1bn in January from 3.8bn a month earlier. In February and early March, we see a gloomier picture in commodity prices, promising to put even more pressure on the balance of payments.
The jump in the price of basic commodities has caused a decline in industrial production, and the situation could worsen in the coming months. The exchange rate, in this case, is a natural damping mechanism unless it is maintained artificially through currency interventions or severe capital controls. In Turkey, the second variant is now the case, but these controls merely stretch out the natural self-adjustment of the economy over time.
UK Stood in Good Shape in January, But it Little Helps Pound Now
The new monthly package of UK statistics highlighted the fine shape of the economy in January. For the month, GDP rose by 0.8%, against an expected strengthening of 0.2% and the three-month growth rate accelerated from 1.0% to 1.1%.
Industrial production strengthened by 0.7% for the month and 2.3% for January 2021, also beating economists’ expectations.
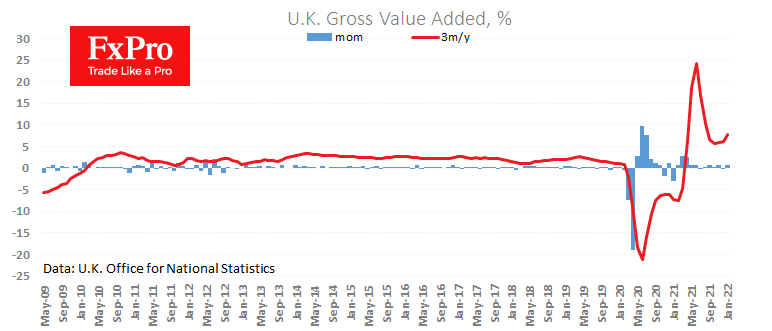
The UK economy started the year in good shape, responding positively to the easing of the coronavirus restrictions.
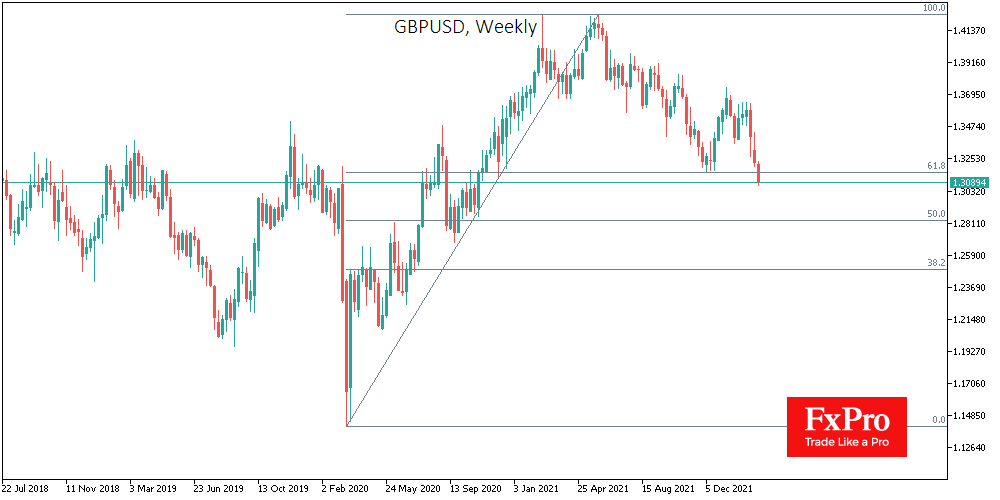
This is short-term positive news for the British pound, which has managed to find support after touching another low since November 2020 at 1.3080 per dollar. A strong base in the economy will allow the Bank of England to strengthen its fight against inflation by raising rates.
However, price shocks across many commodities and foodstuffs dramatically increase the chances of short-term stagflation in the UK as consumers will save more by cutting back on purchases of non-essential goods and services due to rising energy and food prices.
The Ukrainian war crisis, now in its third week, has seen the GBPUSD fall 3.8%, taking more than 1/3 of the pair’s rise from the lows at the start of the pandemic. A move below 1.3160 was a signal to a move into a deeper correction phase, and the pair could plunge to 1.2880 at the beginning of next week.
GBPJPY Heads for Moderate Gains But Still Fragile
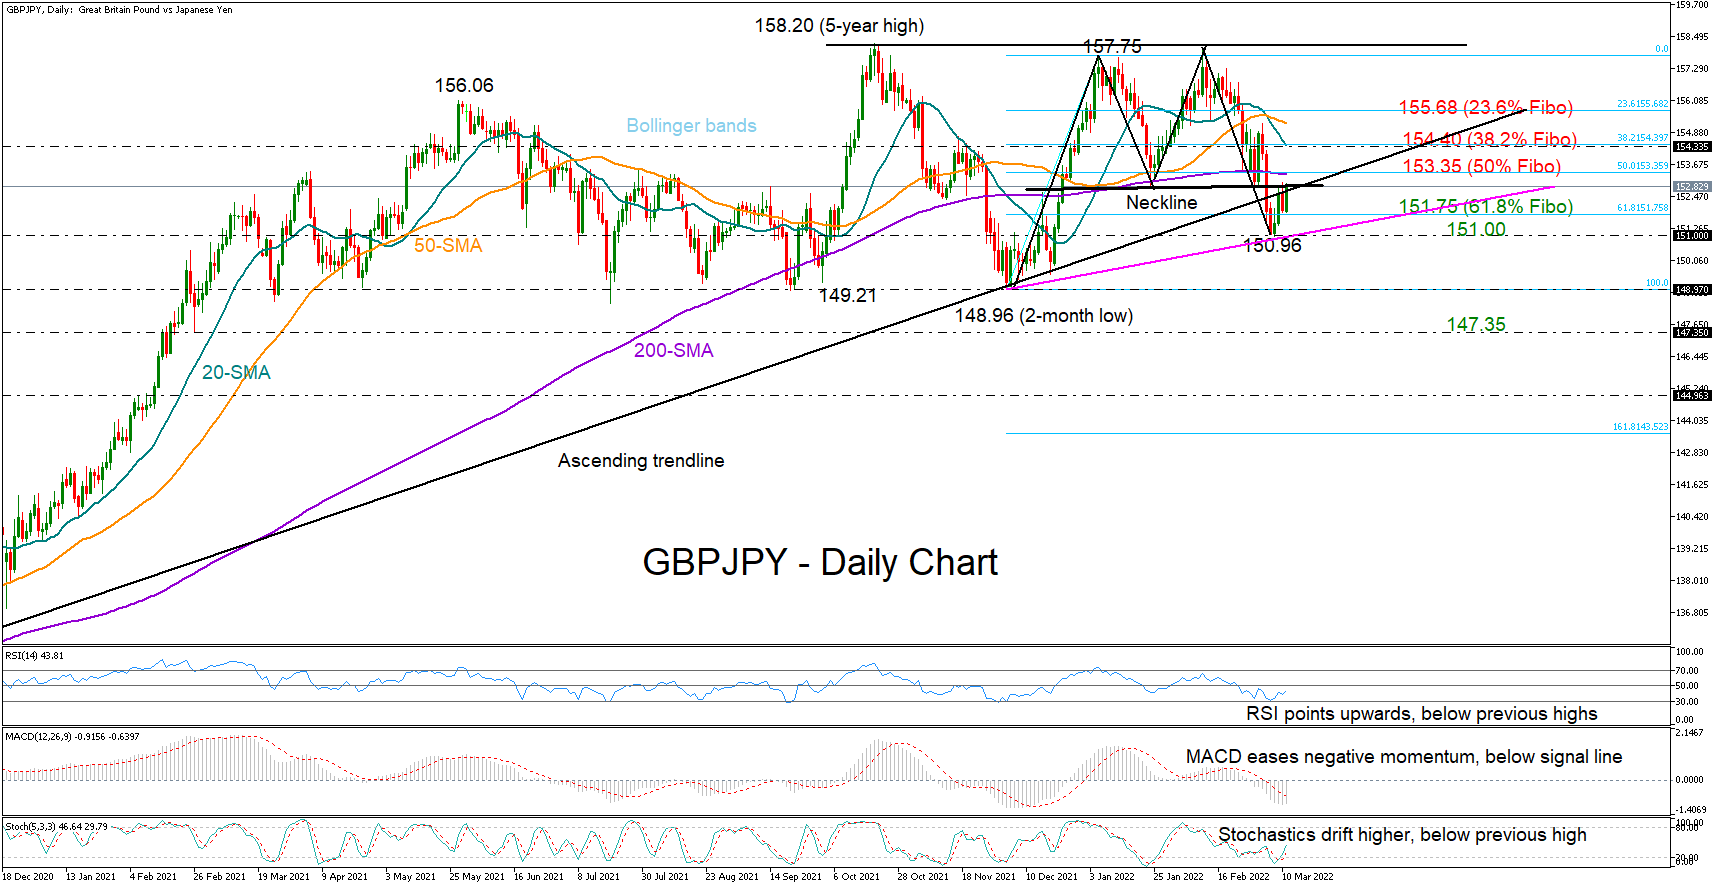
GBPJPY softly switched back into gains after two consecutive negative weeks following the bounce off a five-week low of 150.96 on Tuesday. The price is currently trying to extend its recovery above the 152.80 level, which is the neckline of the confirmed double top bearish formation. Notably, the supportive trendline drawn from the September 2020 low of 133.00 is also in the same location, while the 200-day simple moving average (SMA) is within breathing distance at 153.35.
The upturn in the RSI and the fast Stochastics, as well as the weakening negative momentum in the MACD are endorsing the latest positive action in the price, though some caution is still warranted as the RSI and the MACD have yet to post higher highs and they are comfortably dipped in the bearish territory.
Nevertheless, if the bulls manage to crawl above the 200-day SMA, which coincides with the 50% Fibonacci retracement of the 148.96 – 157.75 up leg at 153.35, the 20-day SMA and the 38.2% Fibonacci of 154.40 could immediately halt the recovery. Should buying pressures persist, the next stop could be around the 23.6% Fibonacci of 155.68, where another successful step higher may stage a new tough battle with the crucial ceiling of 157.70 – 158.20.
In the event the pair retreats below the 61.8% Fibonacci of 151.75 and closes clearly below the 151.00 mark, the decline could sharpen towards the 148.96 base. A move lover from here would mark a new lower low in the chart, violating the one-year-old neutral trajectory. In this case, selling engagement could grow further, bringing the 147.35 restrictive region next on the radar.
Summarizing, the latest rebound in GBPJPY has not eliminated downside risks yet. For that to happen, the price will need to to strengthen beyond 153.35.
ECB Villeroy: Interest rate rise would be very graudal
ECB Governing Council member Francois Villeroy de Galhau reiterated to BFM business radio, "we have said that if the rise in interest rates were to start, it would be very gradual. We have decided to lift our foot off the accelerator ... but there is not the automaticity we seen in other central banks."
Villeroy also dismissed the idea that rising commodity prices could drag Eurozone into recession. He said, "growth remain positive, there is no recession." Meanwhile, he expected inflation to "get back down to around 2%" from from the current 5.1% level.
Another Governing Council member Olli Rehn echoed, "any adjustments to the key ECB interest rates will take place some time after the end of the APP net purchases and will be gradual."
Daily Technical Analysis
EUR/USD
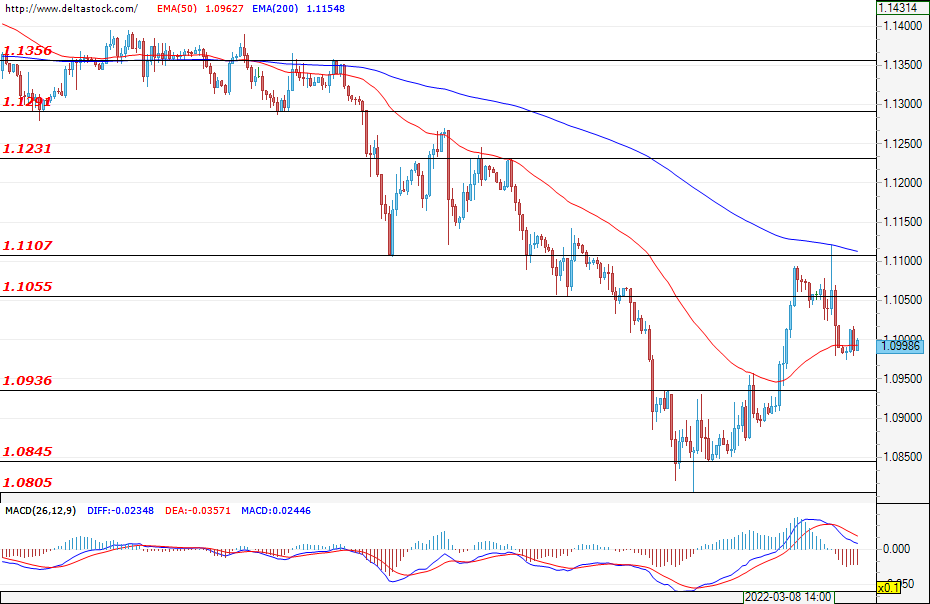
Although the single European currency managed to regain some of its lost positions against the U.S. dollar, the bulls were limited around the resistance level at 1.1107. The bears managed to gain momentum, and as the pair entered a consolidation phase, the subsequent depreciation of the euro against the greenback could deepen towards the support zone at 1.0936 and the local bottom at 1.0800. During the last trading session for the week, no economic news is expected to affect the market, but investors continue to follow closely the events around the war between Russia and Ukraine.
USD/JPY
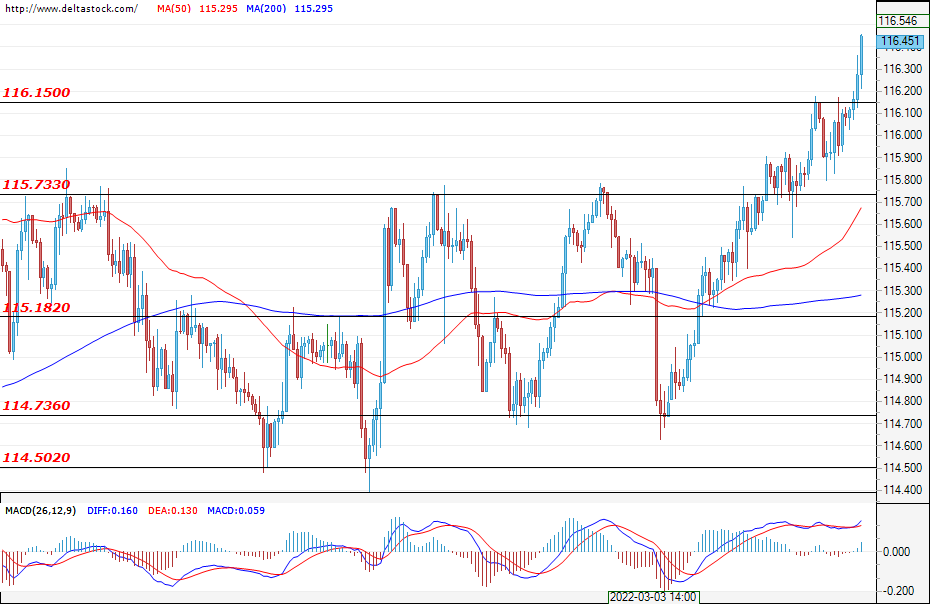
The U.S. dollar continues to gain ground against the Japanese yen as the bulls easily overcome any resistance in their way. The next significant area in front of the currency pair would be the 117.00 zone. In a downward direction, the main support is the level at 115.73, and in case of a successful breach, it is possible to witness the resumption of the range move of 114.73 – 115.73.
GBP/USD
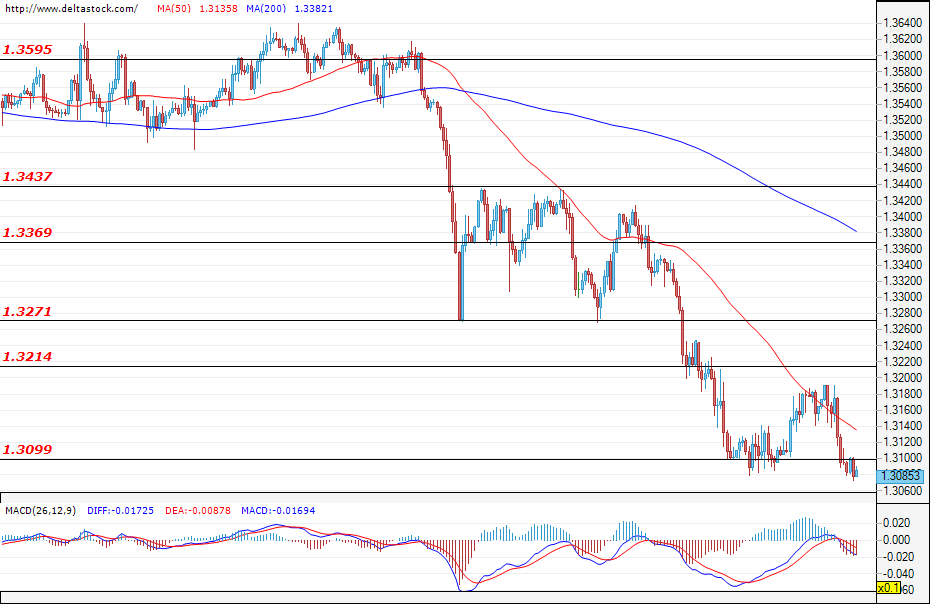
The support area at 1.3099 played its role, and from the beginning of the last session, the bulls took control for a brief moment. At the end of the day, however, the bears regained control of the market and brought the price towards the local minimum at 1.3099. At the time of writing the analysis, the currency pair is sitting directly below the mentioned support and so the breach still cannot be considered complete. A confirmation here could give additional impetus to the sellers, which in turn would deepen the sell-off down towards the level of 1.3000. The manufacturing production data in the UK (today; 07:00 GMT), as well as the GDP data for the United Kingdom (also today; 07:00 GMT) could affect the volatility of the currency pair.
EUGERMANY40
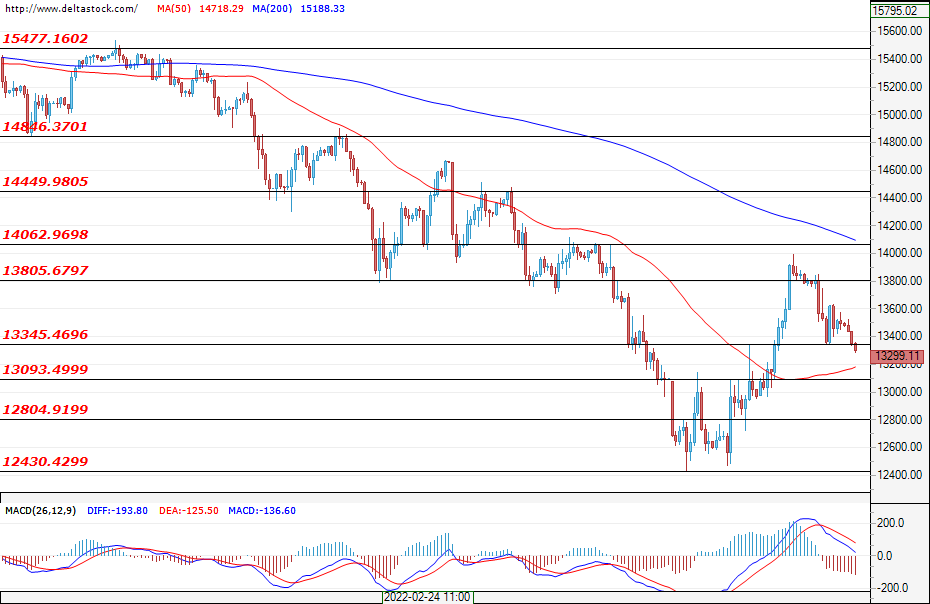
The German index failed to keep its gains after we witnessed a significant recovery earlier this week. At the time of writing, the EUGERMANY40 is trading directly below the support area at 13345. If the bears manage to maintain their control, we could see an additional sell-off wave aimed towards the local bottom at 12430. Rising inflation and uncertainty around the war between Russia and Ukraine are among the leading factors responsible for the high market volatility.
US30
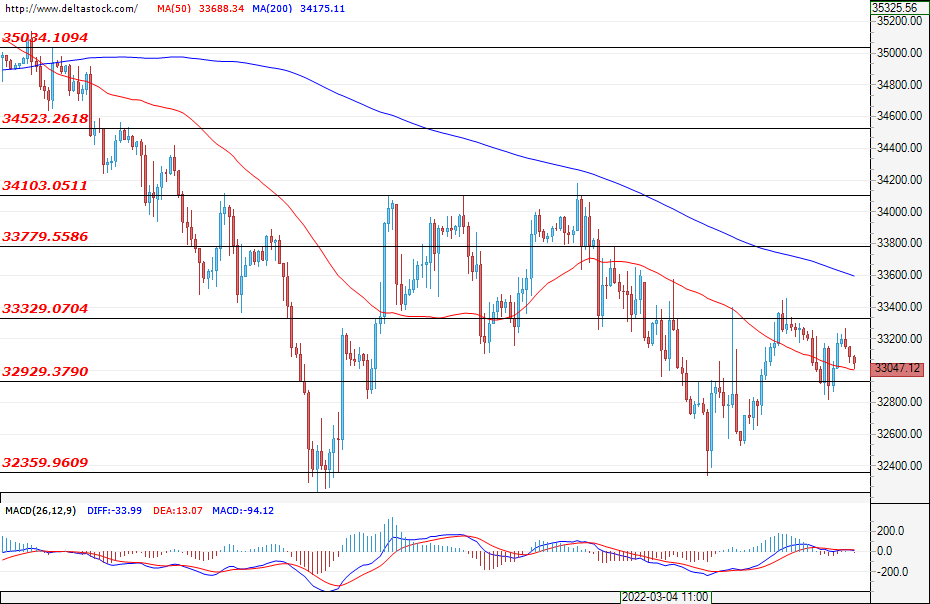
After a significant recovery from the middle of the week, the U.S. blue-chip stock index failed to overcome the resistance at around 33400 twice. This could be a sign that the bears will take control again, and in the event of a successful breach of the 32930 level, could bring the price towards the local minimum at 32360. Inflation in the United States hit a forty-year record high of 7.9% in February and speculations that the Federal Reserve would have to end its loose monetary policy faster started being priced in. This, combined with the war in Ukraine, has led to market instability and increased volatility.
Improving Asian Sentiment to Roll Over into European Dealings
Markets
The ECB delivered a hawkish surprise. The APP will wind down more rapidly with purchases of €40bn in April, €30bn in May and €20bn in June. Previously, those same amounts would have been bought in all of Q2, Q3 and Q4 respectively. On the condition data evolves as expected (ie inflation outlook does not weaken), net buying will end in the third quarter. This allows for a first rate hike in the fourth quarter. This ticks the box of a rate move taking place “some time” (changed from “shortly after”) QE ends. The decision implies that despite the fall-out of the war on European growth (slight downward revisions), upside risks to inflation (materially upgraded, especially near-term) dominate.
With US February CPI (7.9%) coming in exactly as expected, we had a clean view on what turned out to be a text book (bond) market reaction. The German yield curve bear flattened, adding 10.6-10.9 bps in the 2y-5y sector and 2.4 to 5.8 bps in the 30y and 10y. Real yields’ increase strongly outpaced the decline in inflation expectations. European swaps jumped up to almost 15 bps with, amongst others, the 2y and the 10y closing at new recovery highs. US yields added up to 5.3 bps at the belly in knock-on effects.
European stocks retreated more than 3% but already suffered long before the ECB policy meeting. EUR/USD briefly sprinted to 1.11+ but couldn’t maintain gains. The general risk-off outweighed interest rate support. The pair finished at 1.0986. Seeing some safe haven flows, the trade-weighted dollar bounced off 98 to 98.5. EUR/JPY eased sub 128. Euro vs sterling was more balanced with the couple sticking near to the 0.84 big figure. Oil on commodity markets continued to ease from multi-year highs though the pace eased. Brent finished at $109.33 per barrel. Dutch gas futures finished 19% lower.
Asian stock markets started the final day of the week on soft footing. The risk-off is inspired by yesterday’s European and to a lesser extent US performance rather than bad news hitting the screens. Most indices still trade 1 or 2% in the red though left behind intraday lows. China swapped losses for minor gains. Core bonds eke out a slight gain. The euro is better bid, the dollar trades mixed. EUR/USD is attacking the 1.10 big figure. The Japanese yen underperforms heavily. USD/JPY surged beyond recent highs to 116.65 – the strongest level since early 2017.
We expect the gently improving Asian sentiment to roll over into European dealings. It will dominate today’s economic calendar of secondary importance (US Michigan consumer confidence and UK industrial update). Signs are emerging that markets are looking past the war. Eg. yesterday’s failure in talks between Ukraine’s and Russia’s foreign ministers didn’t add to the negative sentiment. Risk-on bets may be dampened somewhat by the weekend lurking, but we hold a cautious optimistic bias on EUR/USD with the ECB now guarding its downside. First resistance situates at 1.104, followed by 1.1163/7. Core bond yields are protected by real yields bottoming out. We look for the European swap yields at the front and back end to hold and finish the week above the previous recovery highs.
News Headlines
The Czech Central Bank commented on February inflation which earlier was reported at 1.3% M/M and 11.1% Y/Y. The outcome was higher than the CNB winter forecast mainly due to food but also to higher administered prices as a result of growth in housing-related energy prices and rapid growth in fuel prices. Core inflation was slightly higher too, at 10.4% versus a 10.2% forecast. The CNB expected inflation to peak at around 10% in the first half of this year and return close to the 2% target in the first half of 2023. However, as a result of extreme price pressures due to the war in Ukraine and the koruna depreciating, inflation is very likely to record a further noticeable, albeit temporary, increase in the months ahead. Rusnok repeated he can’t rule out a slight rate hike at the March 31 meeting. At the same time, inflation will prevent the CNB from cutting interest rates near the end of the year.
US 30 Struggles for Buyers
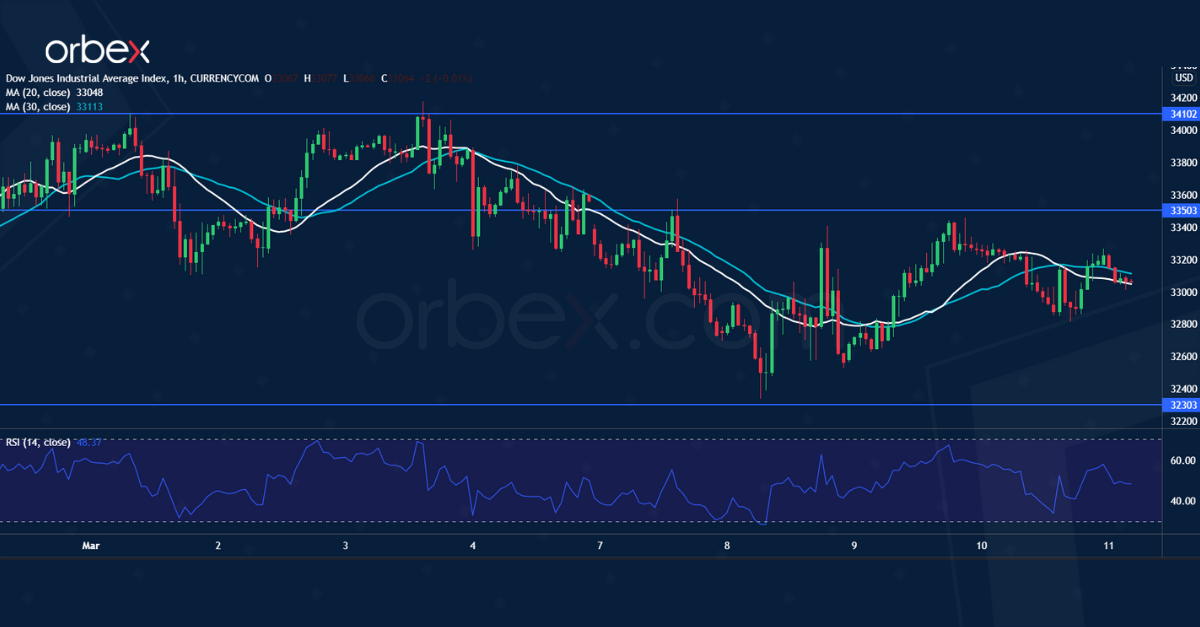
The Dow Jones 30 turned south after talks between Russia and Ukraine stalled again. A rebound above 34000 has provided some relief.
Nonetheless, enthusiasm could be short-lived after the index gave up all recent gains. The prospect of a bear market looms if this turns out to be a dead cat bounce. A fall below 32300 could trigger another round of liquidation and push the Dow to a 12-month low at 30800.
On the upside, 33500 is the first resistance. The bulls will need to lift offers around 34100 before they could attract more followers.
XAG/USD Seeks Support
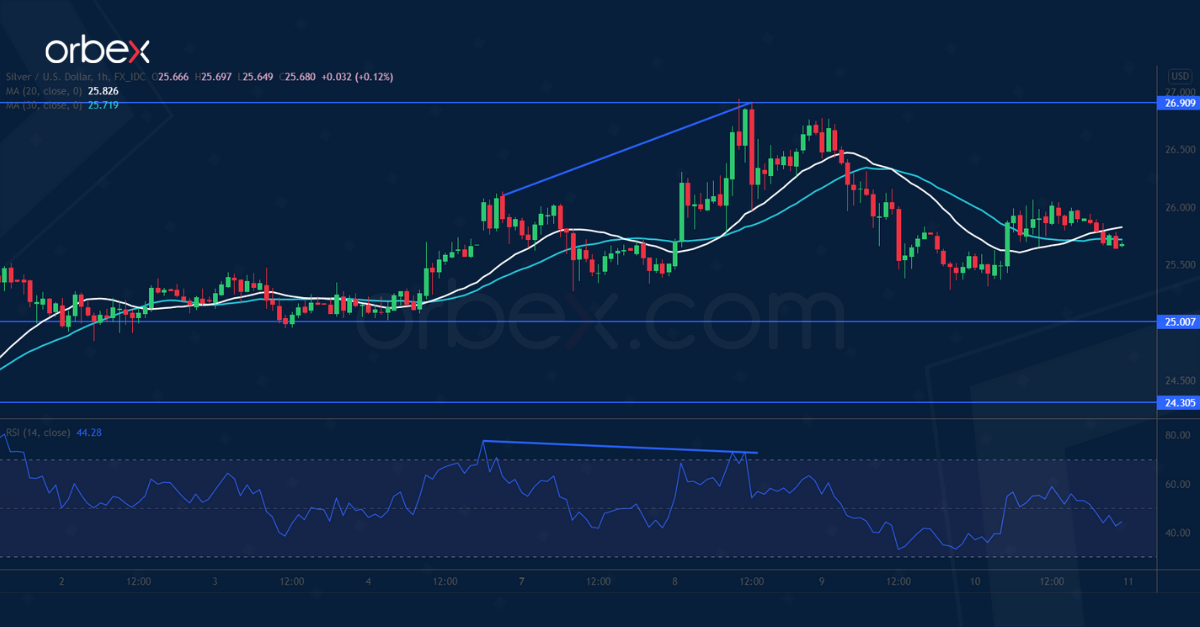
Silver consolidates amid ongoing geopolitical instability. A bearish RSI divergence suggests a deceleration in the rally.
A tentative break below 25.40 has prompted some buyers to take profit. While sentiment remains optimistic, a correction might be necessary for the bulls to take a breather.
The psychological level of 25.00 is a major demand zone. Its breach could send the precious metal to 24.30 which sits on the 30-day moving average. A rally above 26.90 could propel the price to last May’s highs around 28.50.