Sample Category Title
EUR/USD Daily Outlook
Daily Pivots: (S1) 1.0849; (P) 1.0903; (R1) 1.0958; More...
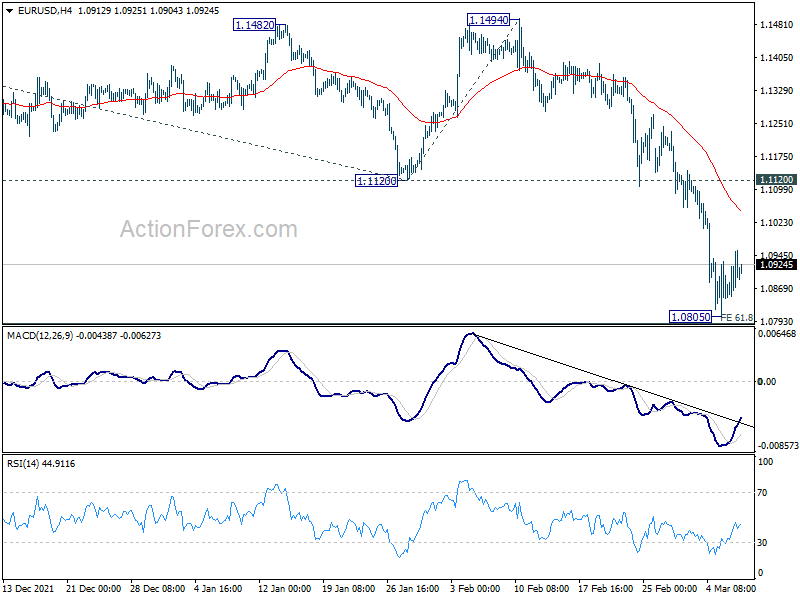
Intraday bias in EUR/USD remains neutral for consolidation above 1.0805 temporary low. Stronger recovery cannot be ruled out. But upside should be limited by 1.1120 support turned resistance to bring down trend resumption. On the downside, firm break of 61.8% projection of 1.2265 to 1.1120 from 1.1494 at 1.0786 will pave they way to 100% projection at 1.0349 next.
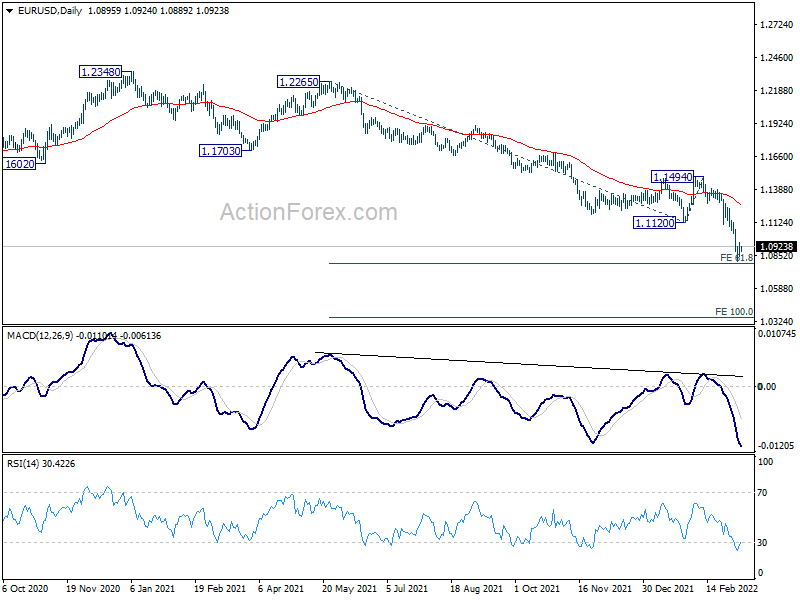
In the bigger picture, the decline from 1.2348 (2021 high) is expected to continue as long as 1.1494 resistance holds. Firm break of 1.0635 (2020 low) will raise the chance of long term down trend resumption and target a retest on 1.0339 (2017 low) next. Nevertheless, break of 1.1494 will maintain medium term neutral outlook, and extend range trading first.
GBP/USD Daily Outlook
Daily Pivots: (S1) 1.3074; (P) 1.3109; (R1) 1.3137; More...
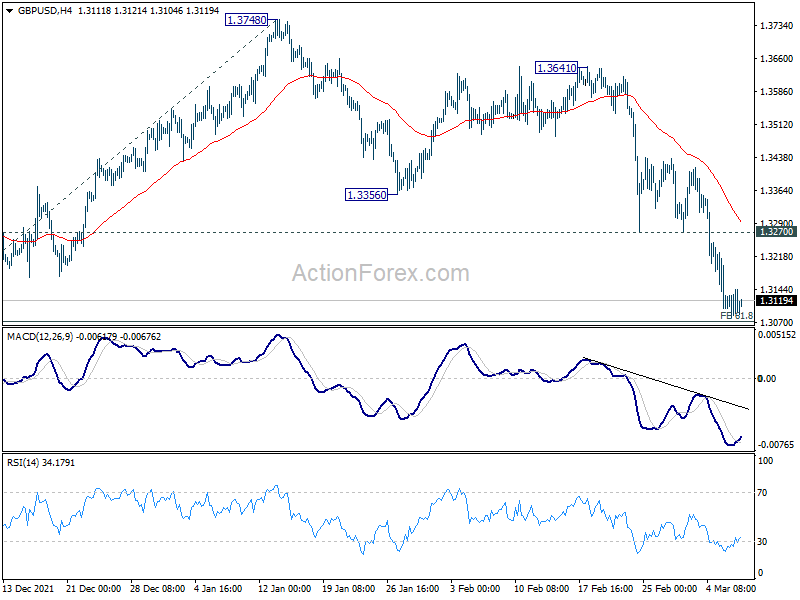
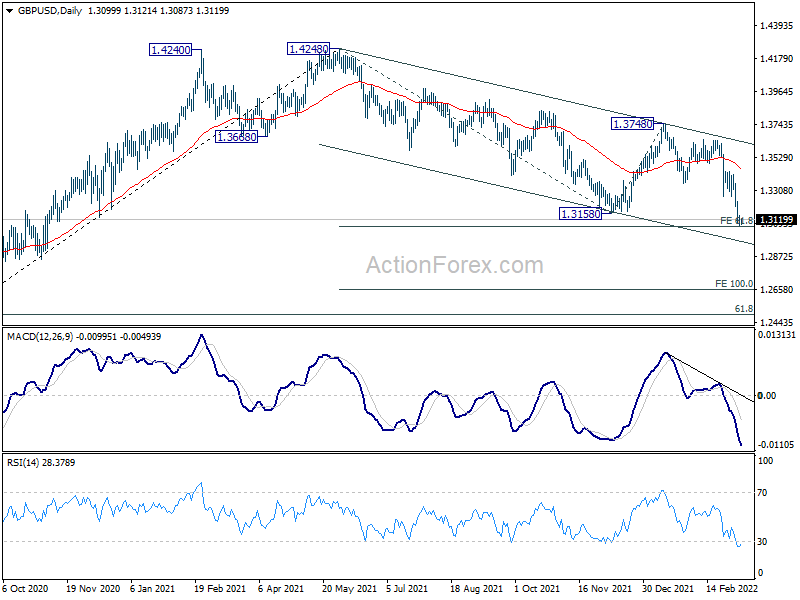
With 4 hour MACD crossed above signal line, intraday bias in GBP/USD is turned neutral first. Some consolidations could be seen, but recovery should be limited by 1.3270 support turned resistance. On the downside, sustained break of 61.8% projection of 1.4248 to 1.3158 from 1.3748 at 1.3074 will extend the down trend from 1.4248 to 100% projection at 1.2658.
In the bigger picture, current development suggests that the up trend from 1.1409 (2020 low) has completed at 1.4248. Decline from 1.4248 could still be a corrective move, or it could be the start of a long term down trend. In either case, deeper decline would now be seen back to 61.8% retracement of 2.1161 to 1.1409 at 1.2493. In case, break of 1.3748 resistance is needed to indicate medium term bottoming, or outlook will stay bearish.
USD/CHF Daily Outlook
Daily Pivots: (S1) 0.9258; (P) 0.9282; (R1) 0.9316; More....
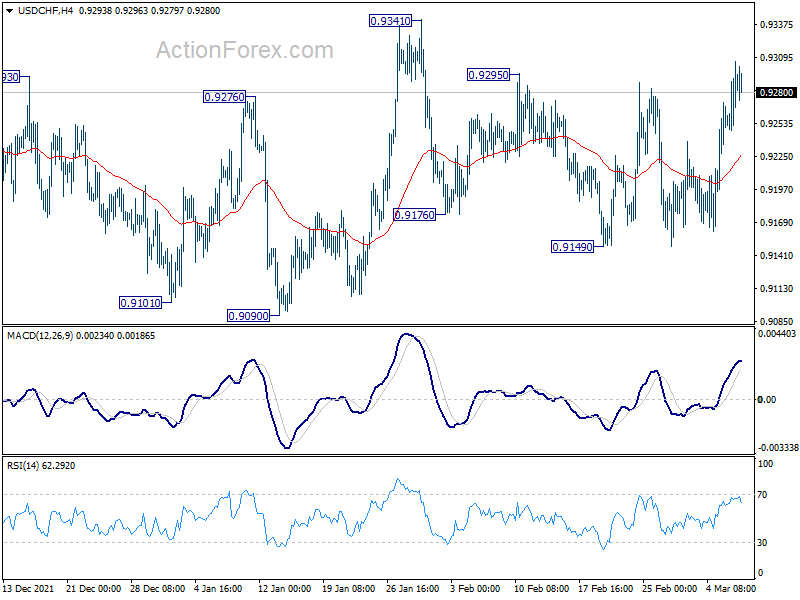
Intraday bias in USD/CHF remains neutral for the moment. Choppy rise from 0.8925 would still be in favor to extend higher as long as 0.9090 support holds. Break of 0.9341 will target 0.9372 resistance and then 0.9471. On the downside, however, break of 0.9090 will bring deeper fall back to 0.8925 support.
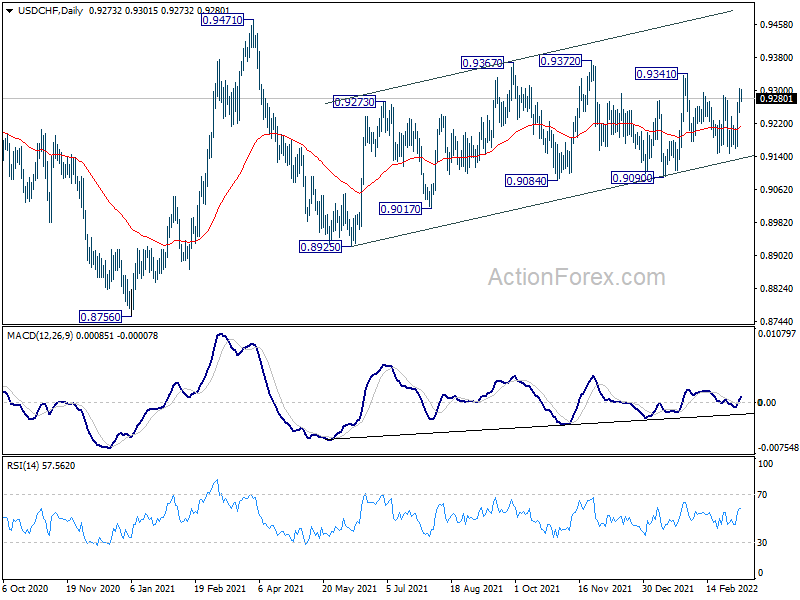
In the bigger picture, medium term outlook will be neutral at best as long as 0.9471 resistance holds. Larger down trend could still extend through 0.8756 (2021 low). However, firm break of 0.9471 will argue that the trend has already reversed and rebound the rally from 0.8756 with another impulsive move.
USD/JPY Daily Outlook
Daily Pivots: (S1) 115.36; (P) 115.58; (R1) 115.88; More...
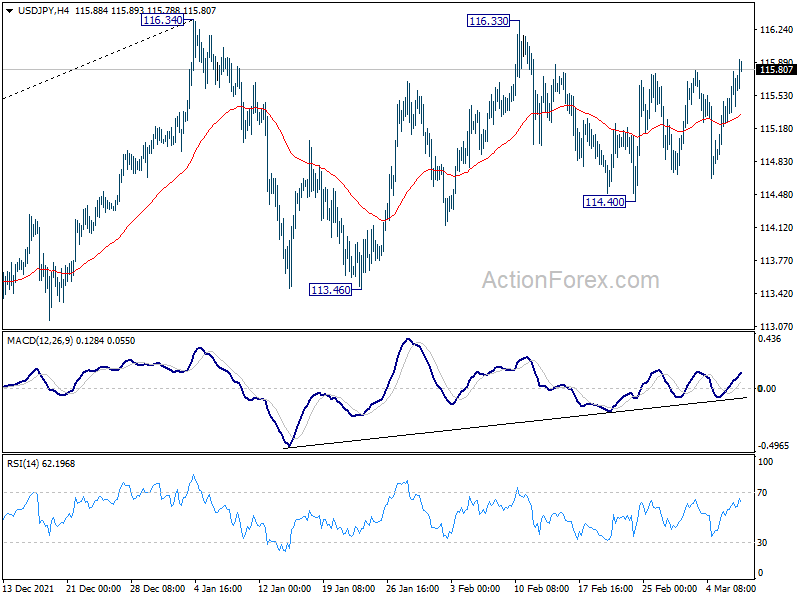
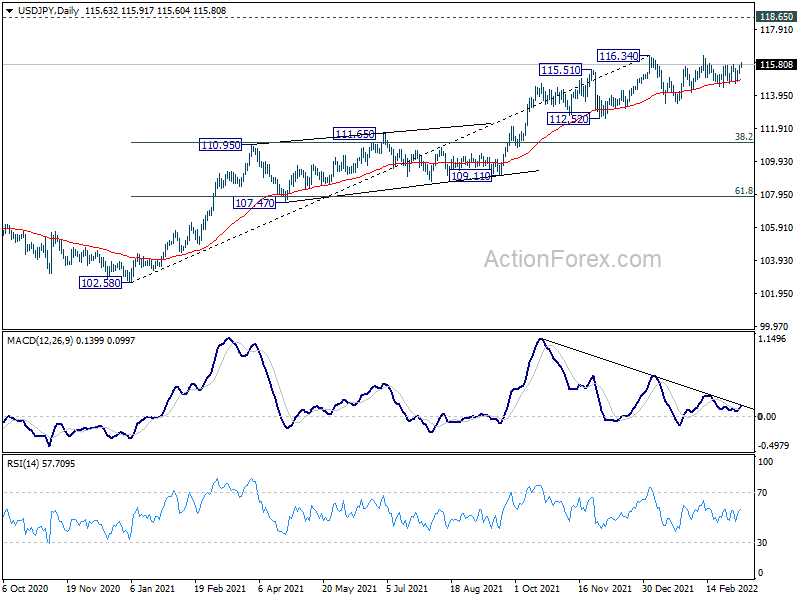
USD/JPY is still bounded in sideway trading between 114.40 and 116.34 and intraday bias remains neutral first. On the upside, firm break of 116.34 will resume larger up trend from 102.58 to 118.65 long term resistance next. On the downside, though, break of 114.40 will continue the corrective pattern from 116.34 with another fall to 113.46 support.
In the bigger picture, no change in the view that rise from 102.58 is the third leg of the up trend from 101.18 (2020 low). Such rally should target a test on 118.65 (2016 high). Sustained break there will pave the way to 120.85 (2015 high) and raise the chance of long term up trend resumption. This will remain the favored case as long as 55 week EMA (now at 111.64) holds.
AUD/USD Daily Report
Daily Pivots: (S1) 0.7229; (P) 0.7288; (R1) 0.7332; More...
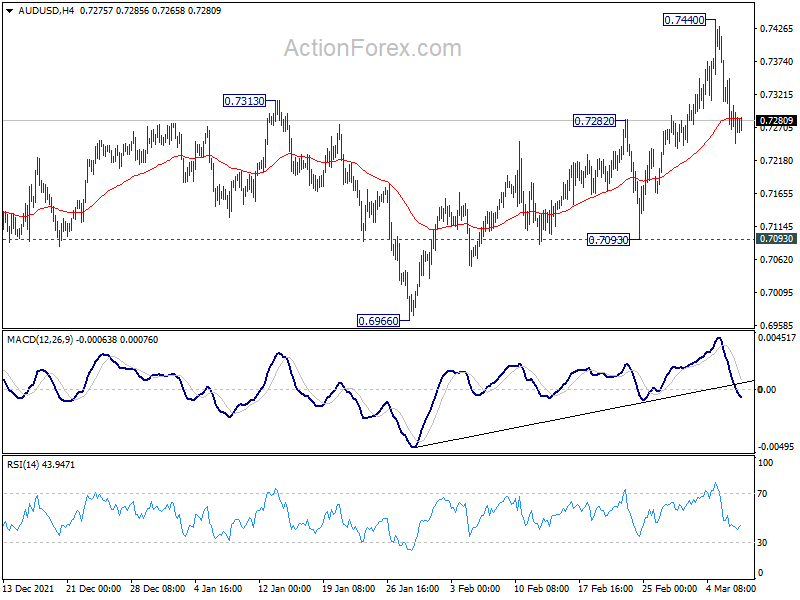
Intraday bias in AUD/USD remains neutral at this point. Some more correction could be seen and deeper pull back cannot be ruled out. But further rally will remain in favor as long as 0.7093 support holds. As noted before, larger decline from 0.8006 might have completed at 0.6966 already. Above 0.7440 will resume the rise from 0.6966 for 0.7555 resistance next.
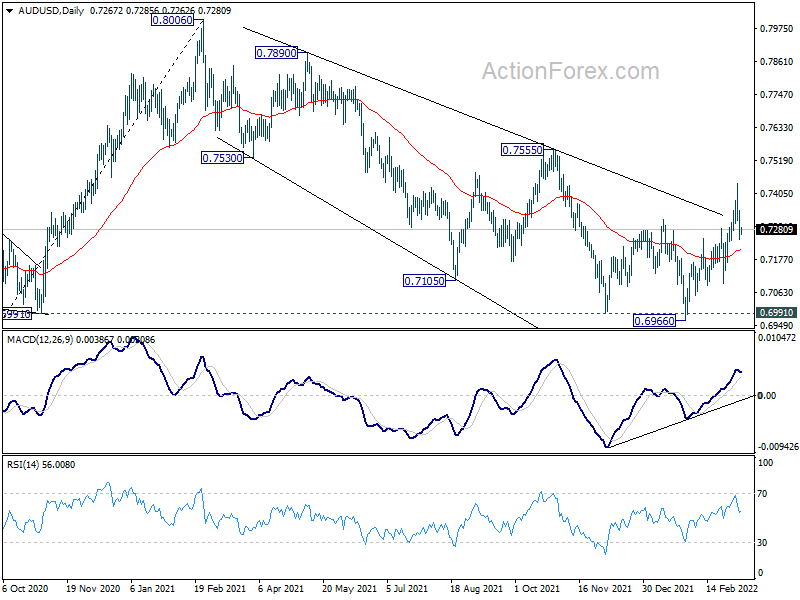
In the bigger picture, focus remains on 0.6991 key structural support. Sustained break there will argue that the whole up trend from 0.5506 might be finished at 0.8006, after rejection by 0.8135 long term resistance. Deeper decline would then be seen back to 61.8% retracement of 0.5506 to 0.8006 at 0.6461. Meanwhile, strong rebound from 0.6991 will retain medium term bullishness. That is, whole up trend from 0.5506 is still in progress for another rise through 0.8006 at a later stage.
Elliott Wave View: GBPJPY Rally Expected to Fail
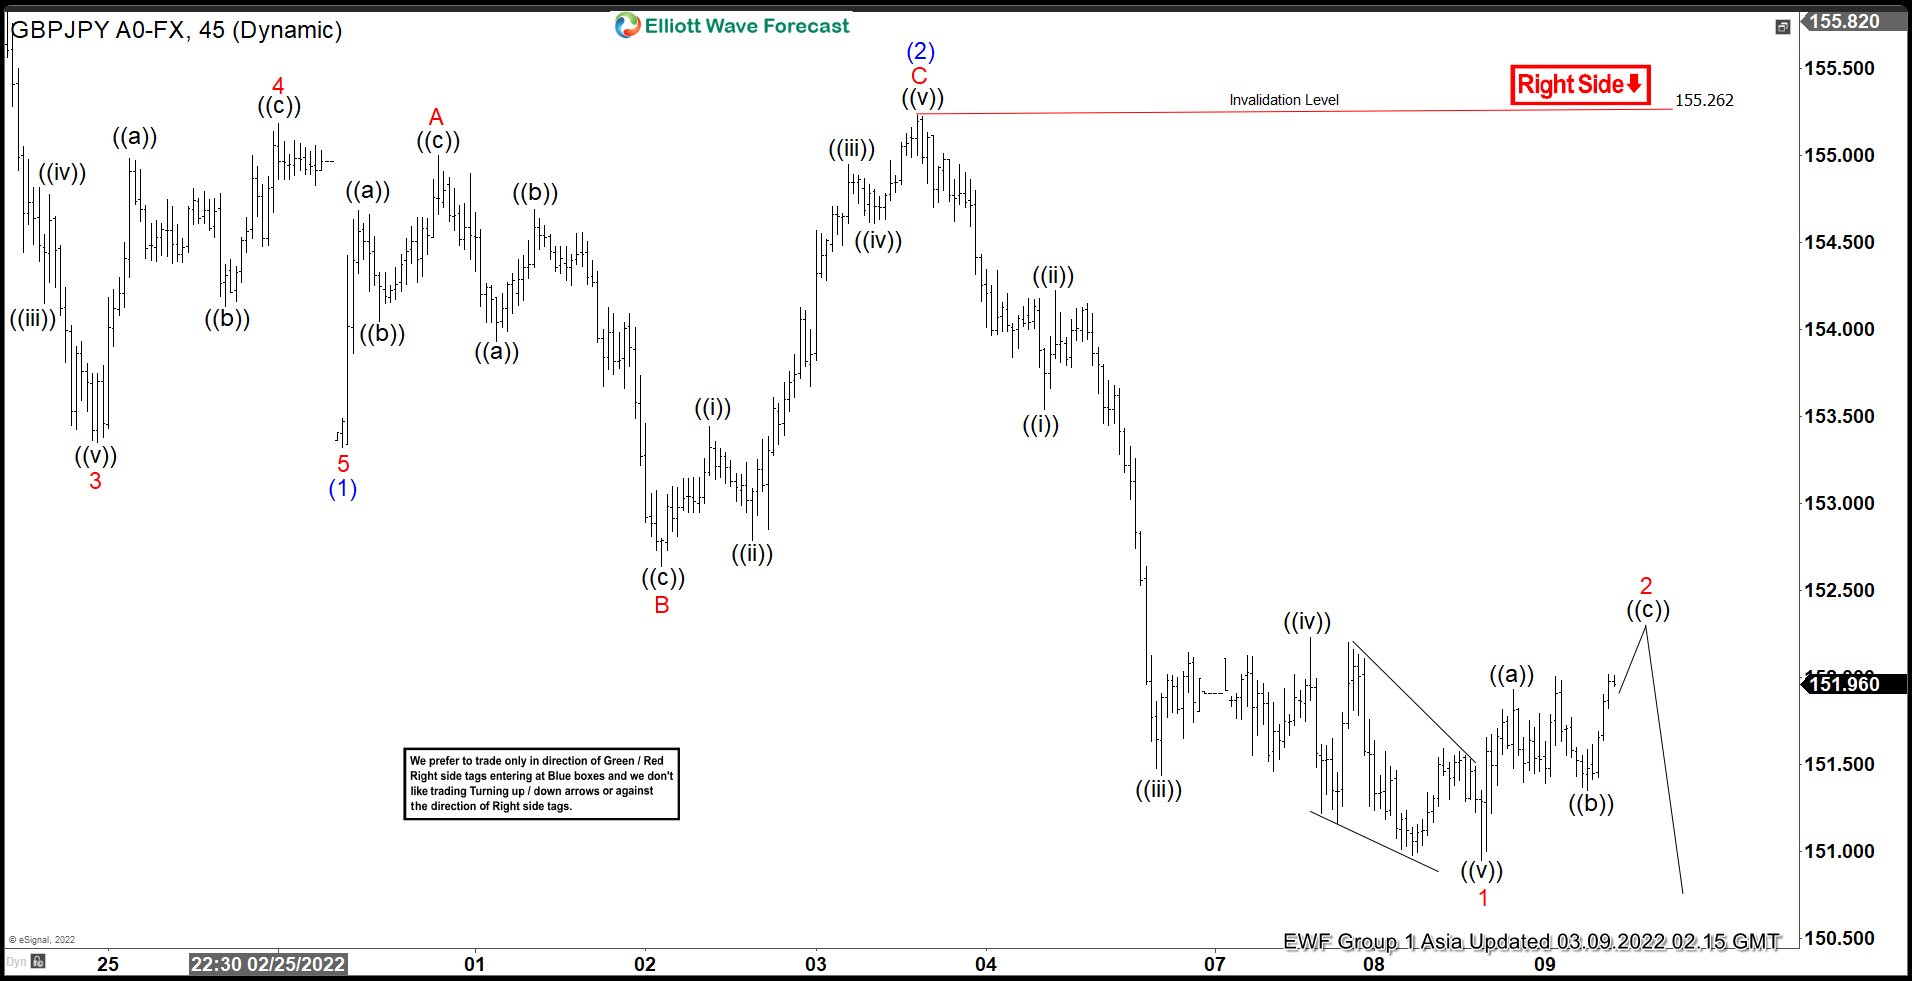
Short Term Elliott Wave View in GBPJPY suggests the decline from February 11, 2022 high is in progress as a 5 waves impulse Elliott Wave structure. Down from February 11 high, wave (1) ended at 153.32 and rally in wave (2) ended at 155.23. The 45 minutes chart below shows the internal subdivision of wave (2) unfolded as an expanded Flat structure. Wave A of (2) ended at 155, wave B of (2) ended at 152.64, and wave C of (2) finished at 155.26.
Wave (3) is now in progress as another impulse in lesser degree. Down from wave (2), wave ((i)) ended at 154.54 and rally in wave ((ii)) ended at 154.22. Pair then resumes lower in wave ((iii)) towards 151.44, and wave ((iv)) ended at 152.23. Final leg lower wave ((v)) ended at 150.95 which should complete wave 1 in higher degree. Near term, wave 2 rally is ongoing to correct cycle from March 3 peak in 3 or 7 swing. Up from wave 1, wave ((a)) ended at 151.93 and dips in wave ((b)) ended at 151.35. As far as pivot at 155.26 high remains intact, expect rally to fail in the sequence of 3, 7, or 11 swing for further downside.
GBPJPY 45 Minutes Elliott Wave Chart
Technical Outlook and Review
DXY:
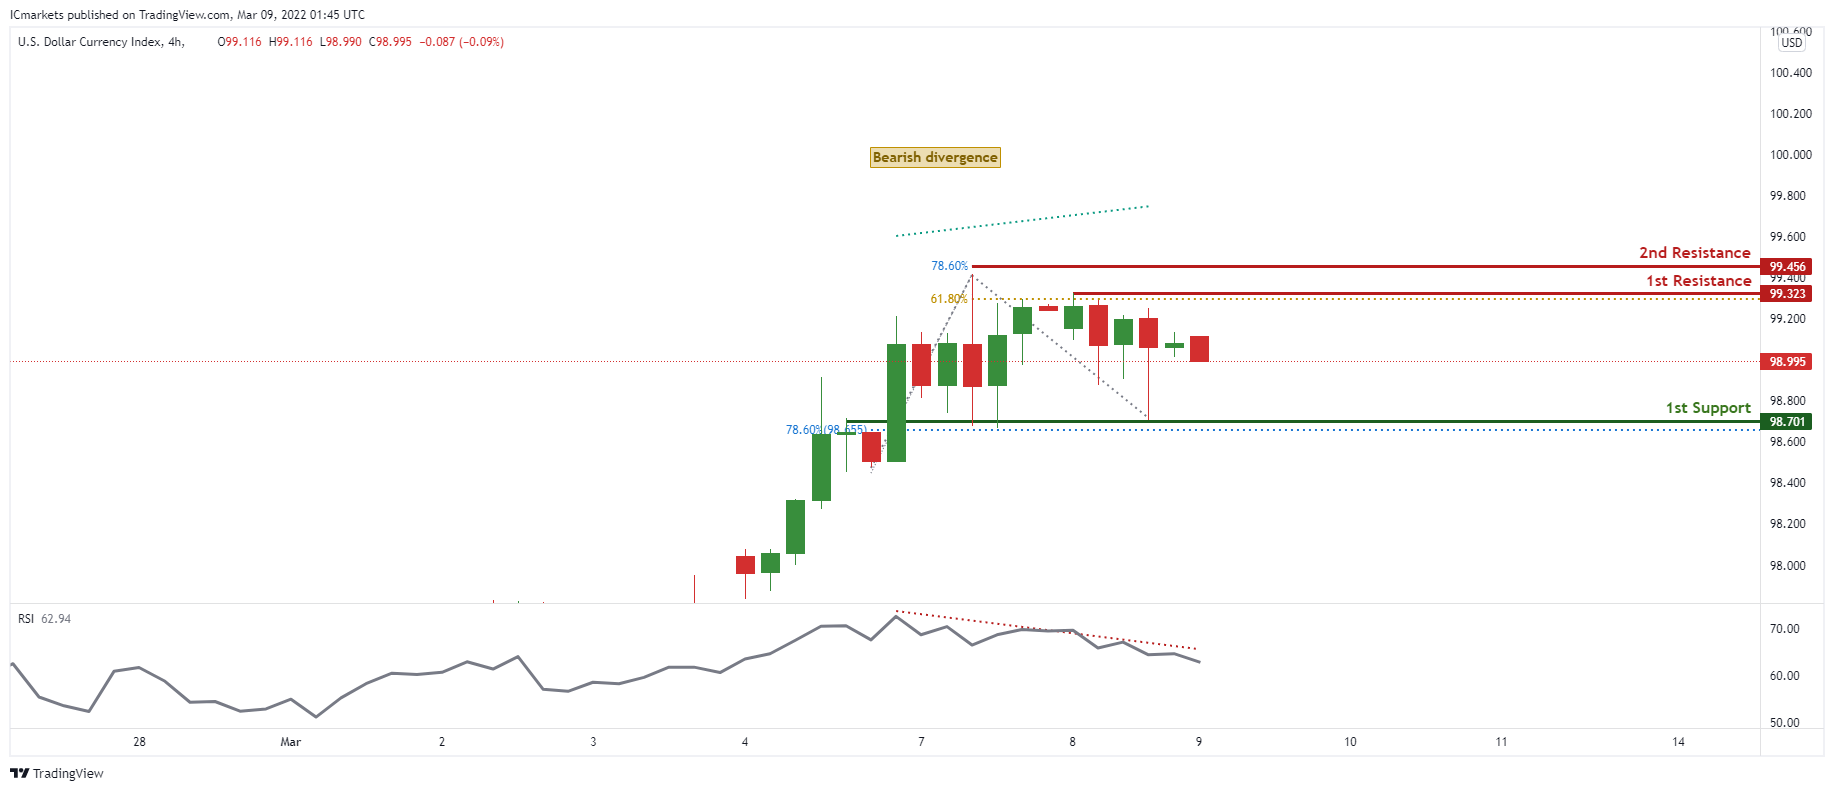
On the H4 timeframe, prices are at a recent high and approaching our pivot. We see the potential for a pullback from our 1st resistance at 99.323 in line with 61.9% Fibonacci projection towards our 1st support at 98.701 in line with 78.6% Fibonacci retracement. RSI is portraying bearish momentum, further supporting our bearish bias.
Areas of consideration:
- H4 time frame, 1st resistance at 99.323
- H4 time frame, 1st support at 98.701
XAU/USD (GOLD):
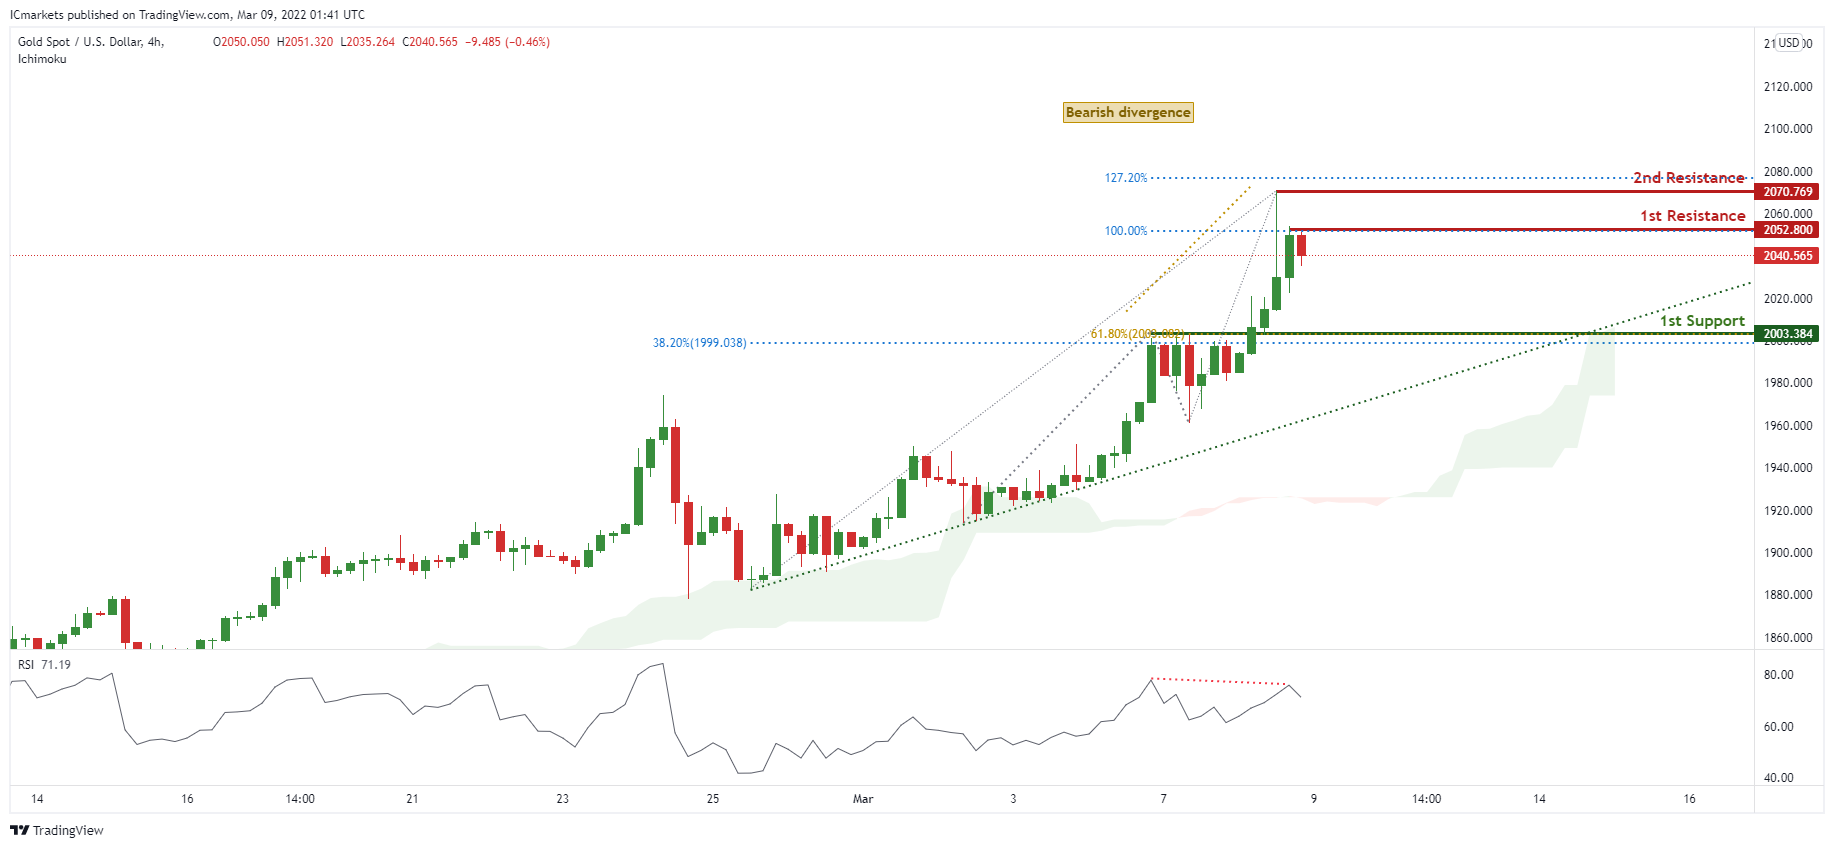
On the H4 chart, prices are on strong bullish momentum and abiding to our ascending trendline support. We see potential for a short pullback from our 1st resistance at 2052.800 in line with 100% Fibonacci extension towards our 1st support at 2003.384 in line with 38.2% Fibonacci retracement and 61.8% Fibonacci retracement. Divergence is spotted on RSI, further supporting our bearish bias.
Areas of consideration:
- 4h 1st support at 2003.384
- 4h 1st resistance at 2052.800
GBP/USD
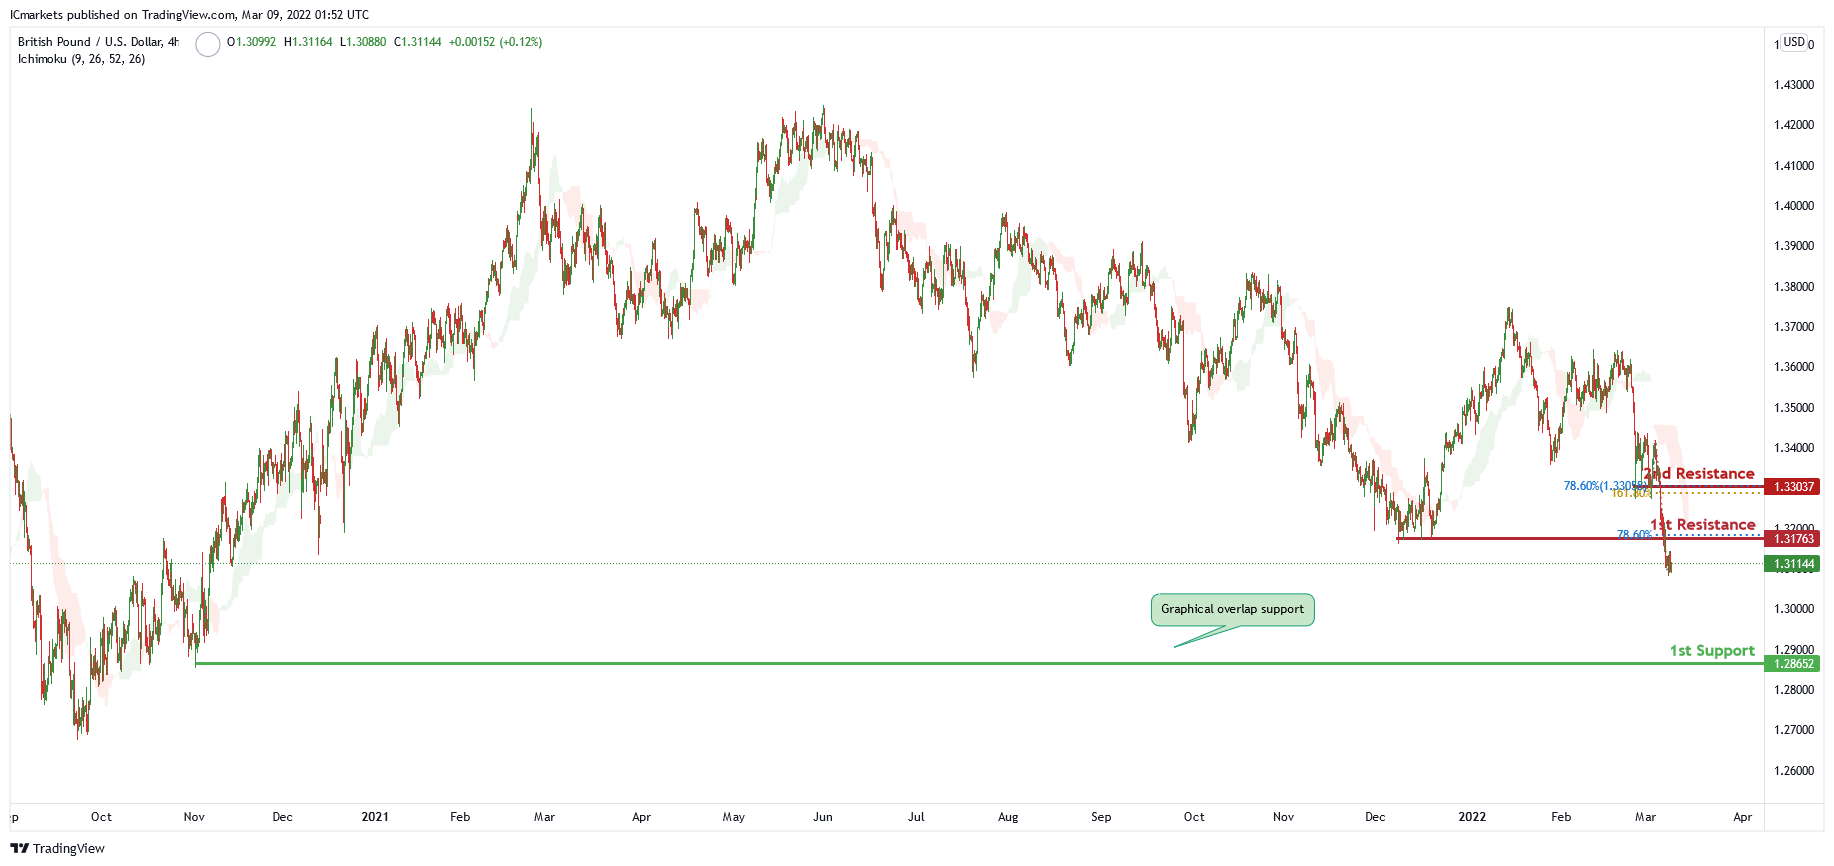
On the H4 chart price has recently broken the 1st resistance level of 1.31763 in line with 78.6% Fibonacci retracement. Price can potentially dip to the 1st support level of 1.28652 in line which is also the graphical overlap support. Our bearish bias is supported by the ichimoku cloud indicator as price is trading under it.
Areas of consideration
- H4 1st resistance at 1.31763
- H4 1st support at 1.28652
USD/CHF:
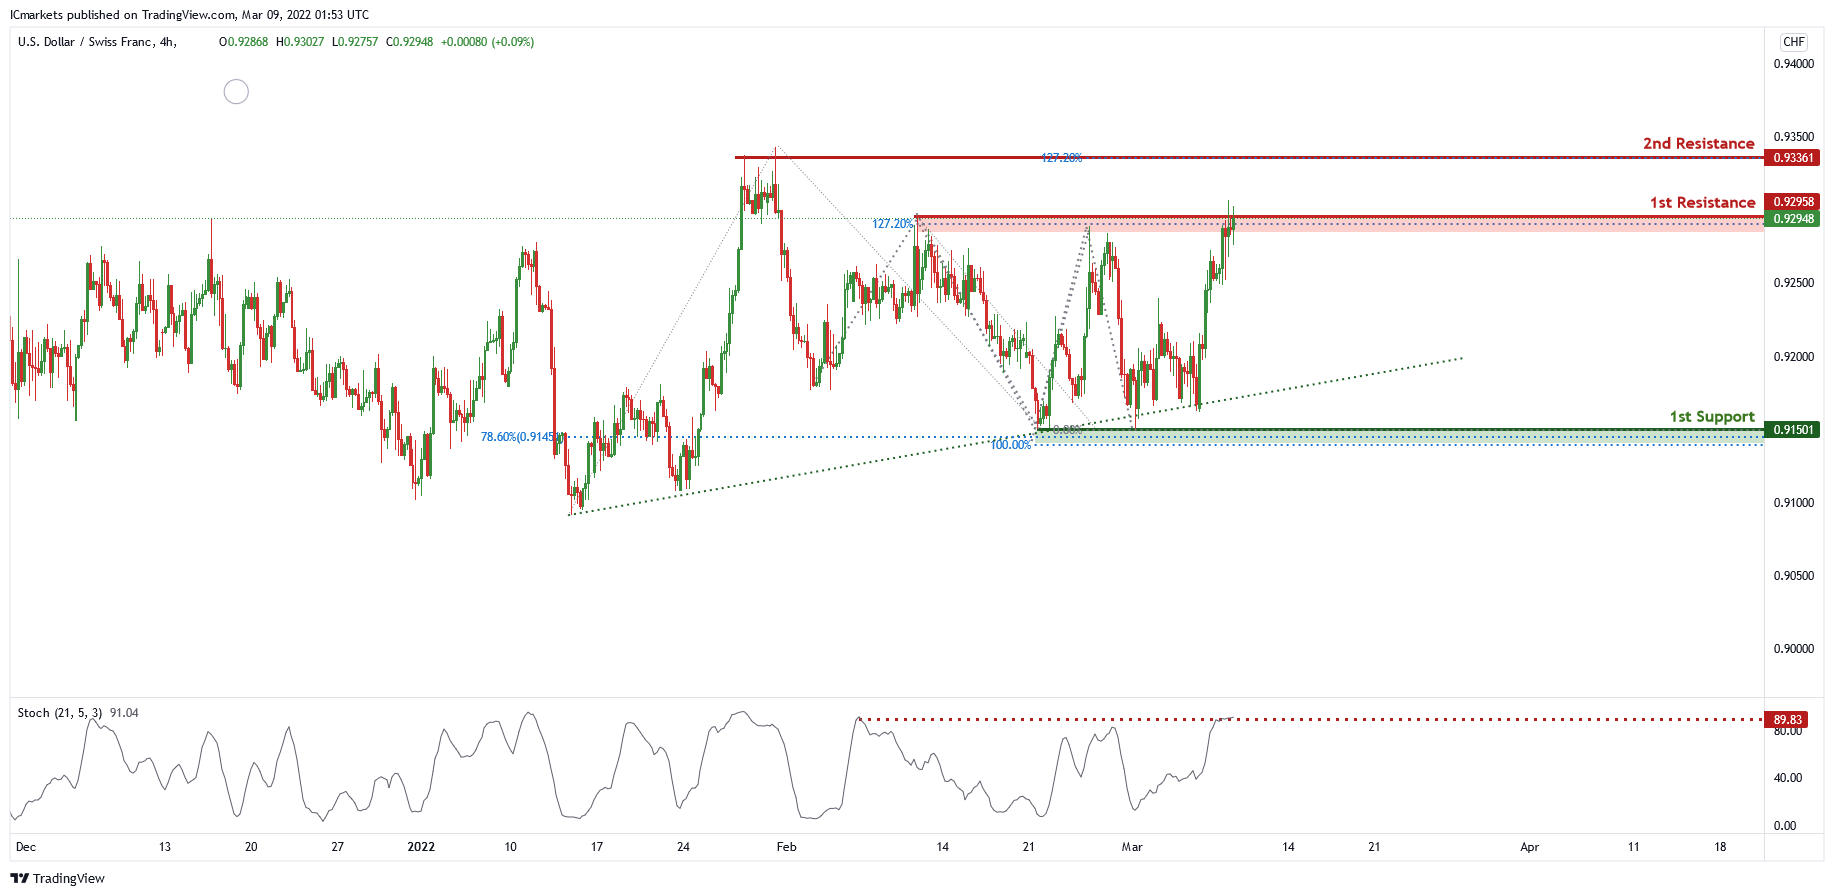
On the H4, price is abiding by an ascending trendline and near 1st resistance level of 0.92833 in line with 127.2% Fibonacci projection . Price can potentially dip to the 1st support level of 0.91501 in line with 100% Fibonacci projection and 78.6% Fibonacci retracement. Our bearish bias is supported by a stochastic indicator as it is near the resistance level.
Areas of consideration
- 1st resistance level at 0.92833
- 1st support level at 0.91501
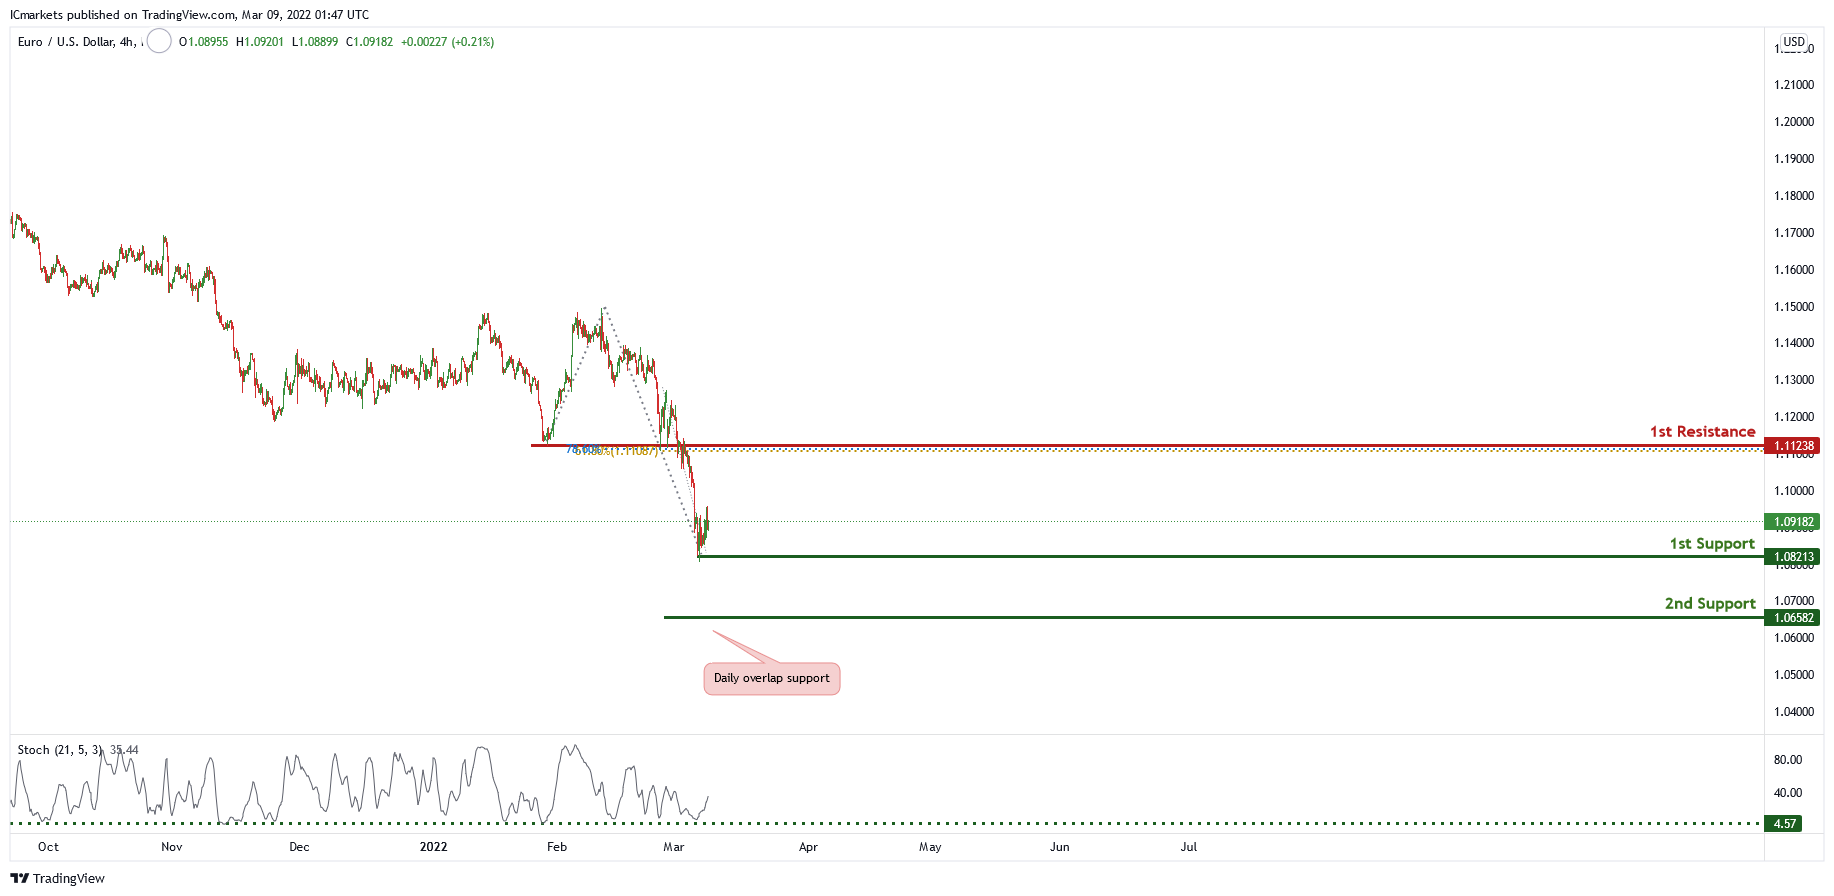
EUR/USD :
On the H4 chart price is near 1st support level of 1.07828 in which is also the graphical swing low . Price can potentially bounce from this support level to 1st resistance of 1.11241 in line with 78.6% Fibonacci projection and 61.8% Fibonacci retracement. Our bullish bias is supported by the stochastic indicator as it is at support level.
Areas of consideration :
- H4 1st resistance at 1.11238
- H4 1st support at 1.08213
USD/JPY:
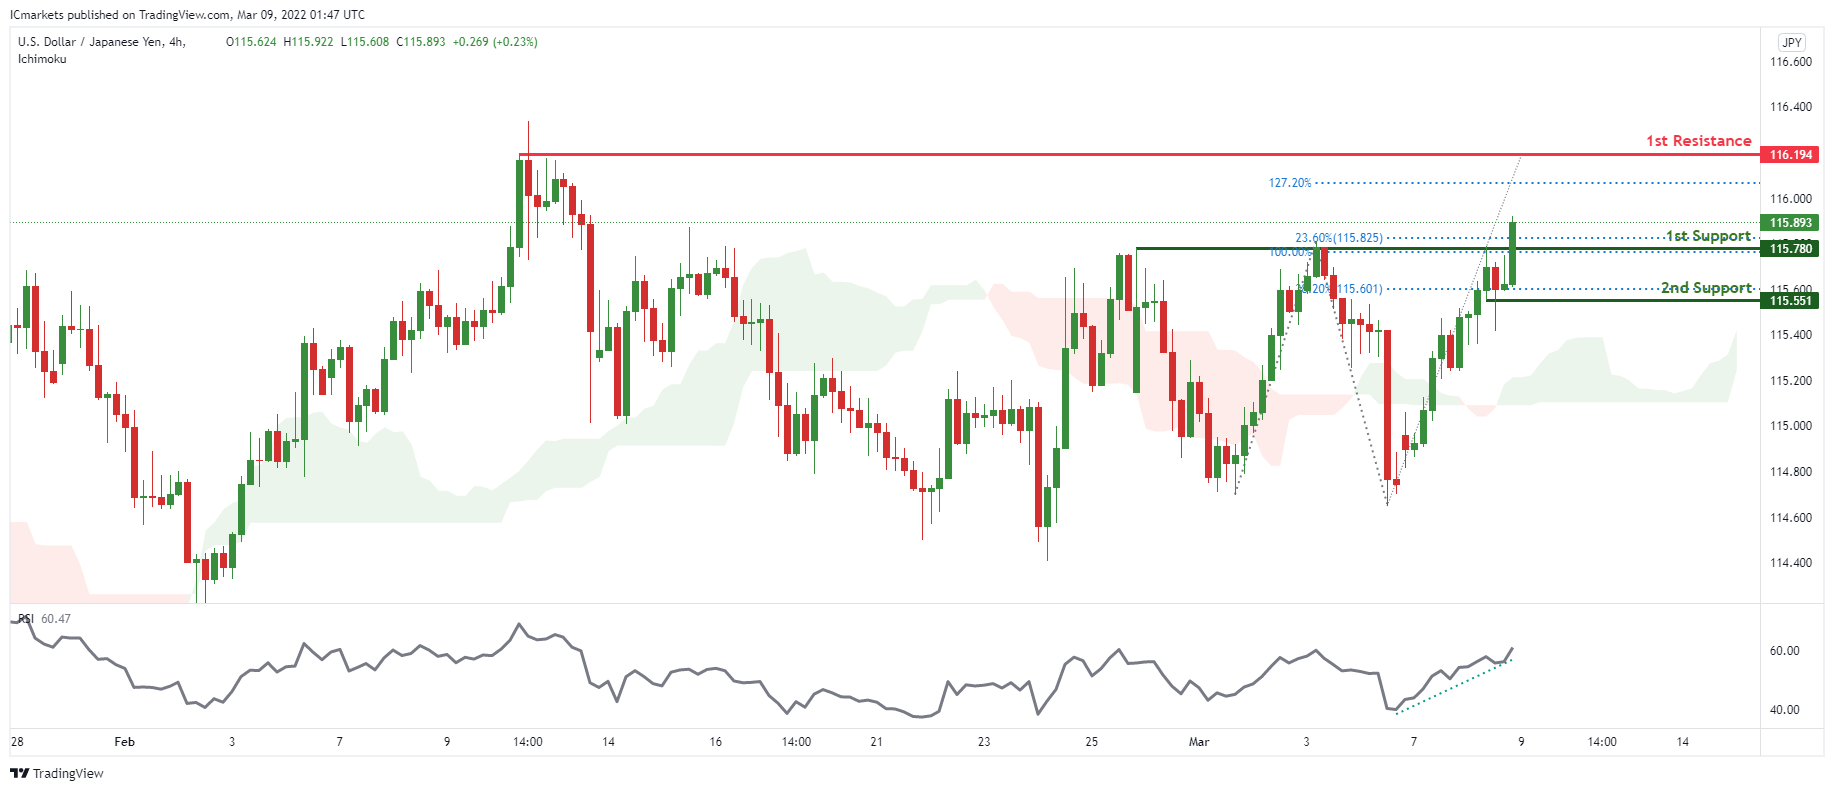
On the H4 timeframe, prices are on bullish momentum. We see the potential for further bullish momentum from our 1st support at 115.780 in line with 23.6% Fibonacci retracement and 100% Fibonacci extension towards our 1st resistance at 116.194 in line with 127.2% Fibonacci extension. Our bullish bias is further supported by prices trading above our ichimoku cloud support and also RSI being on bullish momentum. Alternatively, prices may dip towards our 2nd support at 115.551 in line with 38.2% Fibonacci retracement.
Areas of consideration:
- H4 time frame, 1st resistance at 116.194
- H4 time frame, 1st support at 115.780
AUD/USD:
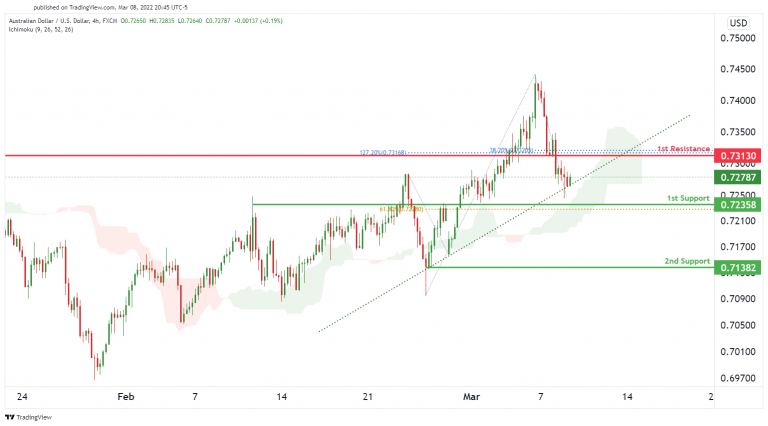
On the H4 timeframe, we see the potential for further bullish momentum from our 1st support at 0.72358in line with 61.8% Fibonacci retracement and towards our 1st resistance at 0.73130. which is in line with 127.20% Fibonacci extension and 38.2% Fibonacci retracement. Our bullish bias is further supported by prices trading above the Ichimoku cloud. Alternatively, prices from 1st support might dip to 2nd support at 0.71382with a graphical swing low level.
Areas of consideration :
- H4 1st support at 0.72358
- H4 1st resistance at 0.73130
NZD/USD:
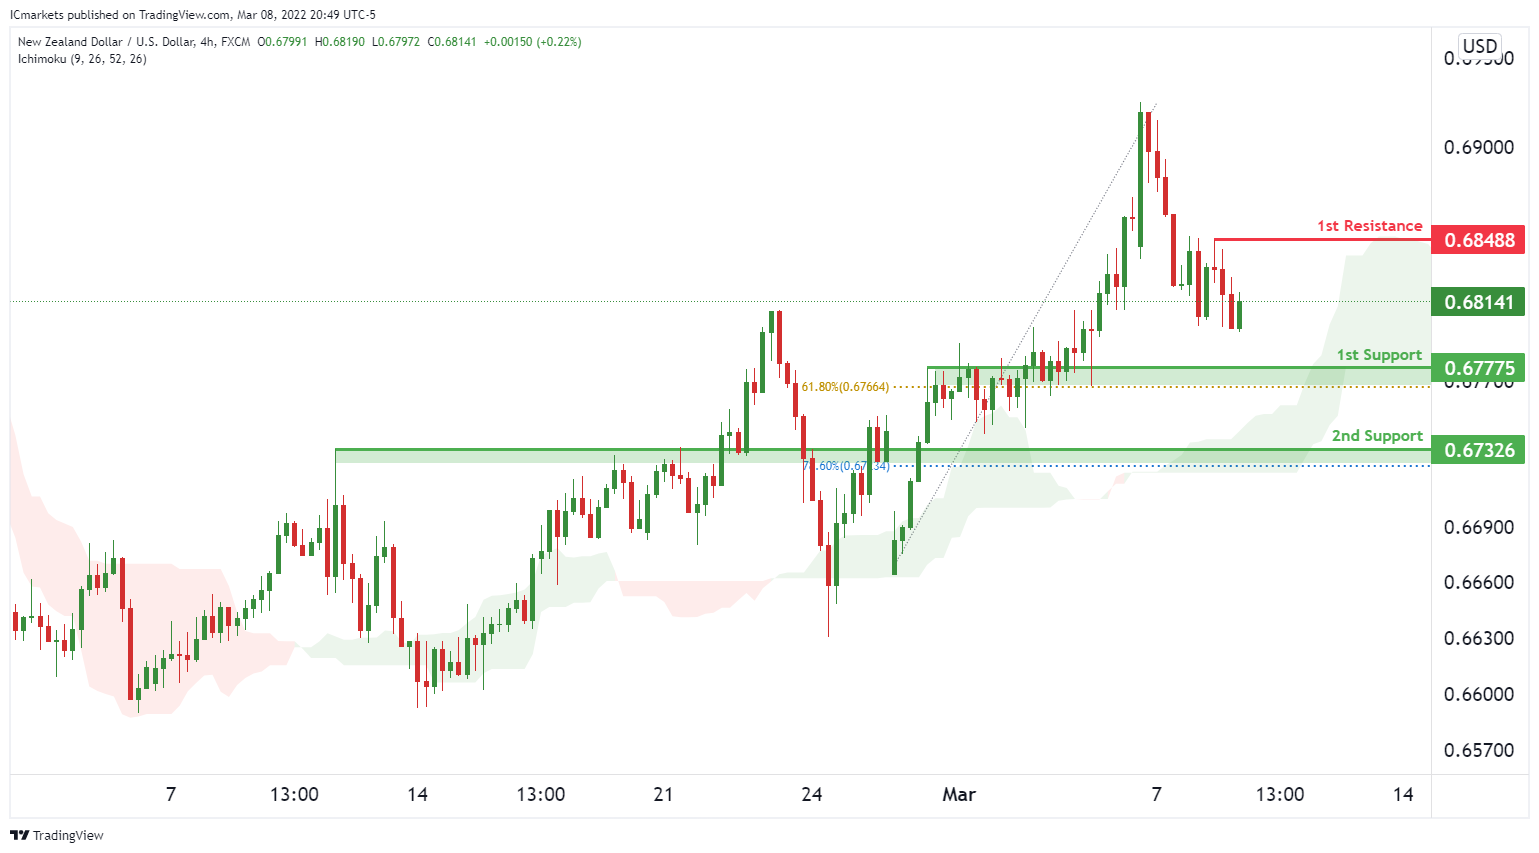
On the H4 chart, prices are on bullish momentum. We see the potential for further bullish momentum from our 1st support at 0.67775 in line with 61.8% Fibonacci retracement towards our 1st resistance at 0.68488 with a graphical swing high resistance. Our bullish bias is further supported by prices trading above our ichimoku cloud support. Alternatively, prices may dip towards our 2nd support at 0.67326 in line with 78.6% Fibonacci retracement.
Areas of consideration:
- H4 time frame, 1st resistance at 0.68488
- H4 time frame, 1st support at 0.67775
USD/CAD:
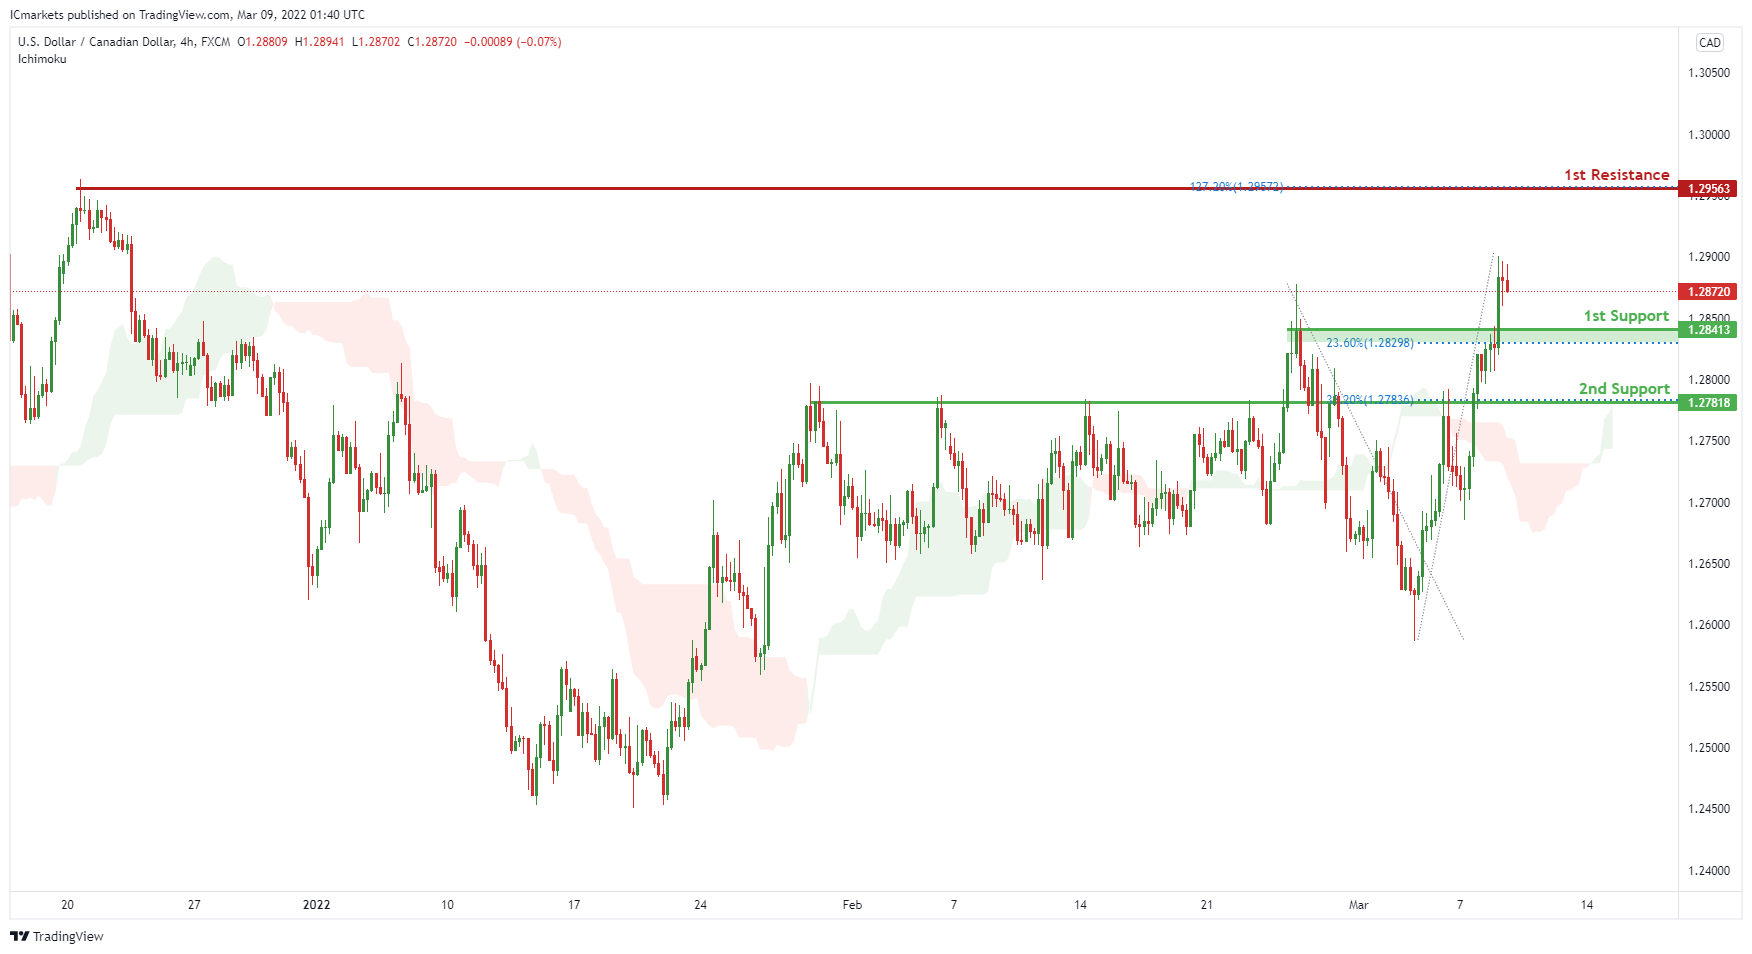
On the H4 timeframe, price is near 1st support level of 1.28413 in line with horizontal overlap support and 23.6% Fibonacci retracement. Price can potentially rise to the 1st resistance level of 1.29563 in line with the swing high resistance and 127.2% Fibonacci retracement. Alternatively, price may break 1st support and head for 2nd support at 1.27818 where the 38.2% Fibonacci retracement is. Our bullsh bias is supported by how price is moving above the ichimoku cloud.
Areas of consideration:
- H4 time frame, 1st support at 1.28413
- H4 time frame, 1st resistance at 1.29563
OIL:
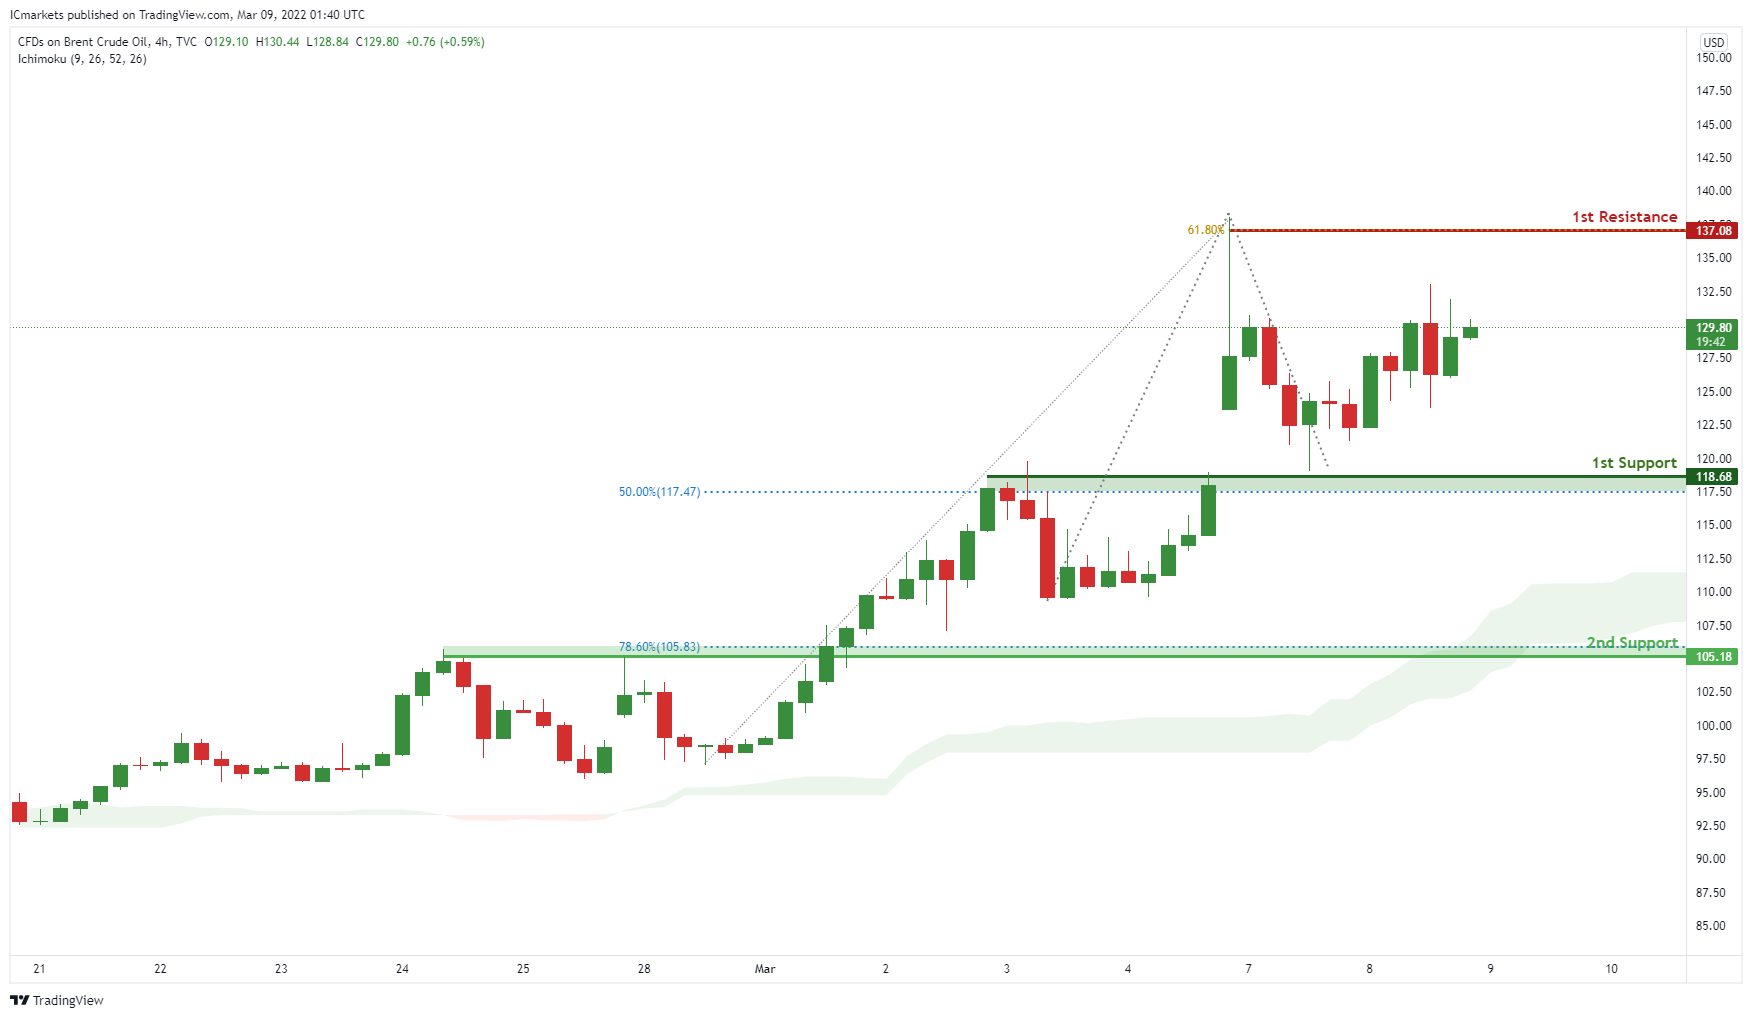
On the H4 timeframe, price is near 1st support level of 118.68 in line with horizontal overlap support and 50% Fibonacci retracement. Price can potentially rise to the 1st resistance level of 137.08 in line with the swing high resistance. Alternatively, price may break 1st support and head for 2nd support at 105.18 where the 61.8% Fibonacci retracement is. Our bullsh bias is supported by how price is moving above the ichimoku cloud.
Areas of consideration:
- H4 time frame, 1st resistance of 137.08
- H4 time frame, 1st support of 118.68
Dow Jones Industrial Average:
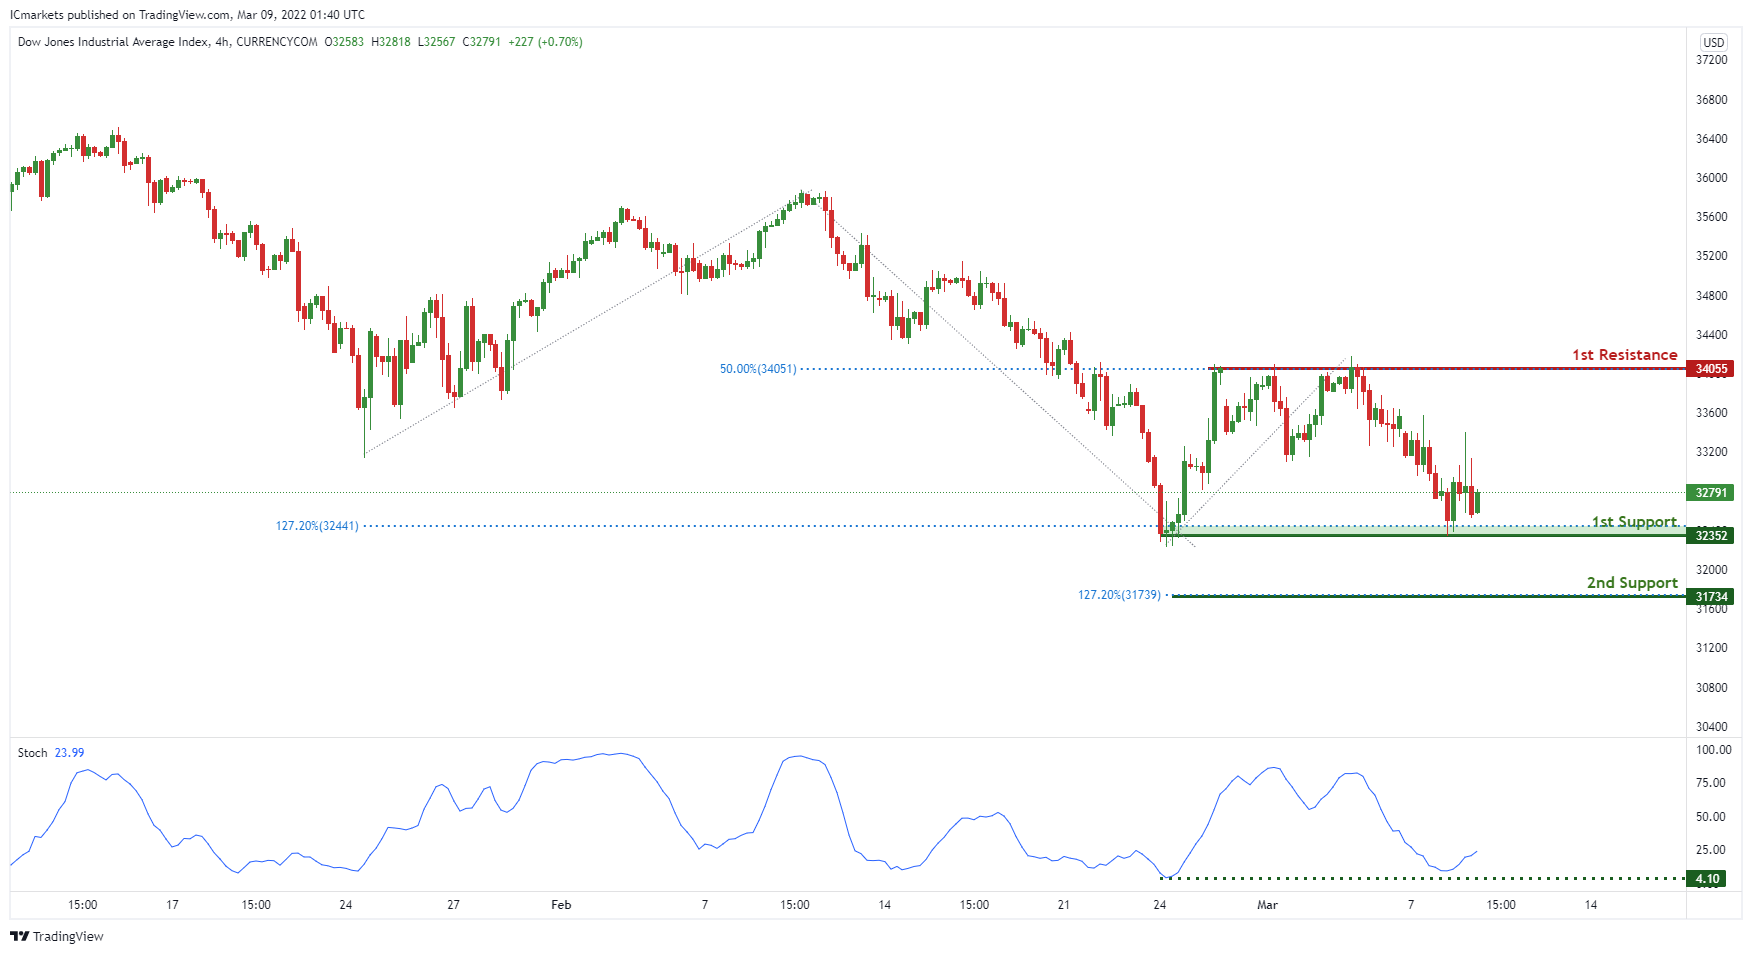
On the H4 timeframe, price is near 1st support level of 32352 in line with horizontal swing low support and 127.2% Fibonacci extension. Price can potentially rise to the 1st resistance level of 34055 in line with the swing high resistance and 50% Fibonacci retracement. Alternatively, price may break 1st support and head for 2nd support at 31734 where the127.2% Fibonacci extension is. Our bullsh bias is supported by how price is expected to bounce off the stochastics indicator.
Areas of consideration :
- H4 1st support at 32352
- H4 1st resistance at 34055
Gold Price Extends Rally Above $2K, Dollar Gains
Key Highlights
- Gold price extended rally above the key $2,000 region.
- A crucial bullish trend line is forming with support near $1,935 on the 4-hours chart.
- EUR/USD consolidated near 1.0800, and GBP/USD seems to be facing selling pressure.
- Crude oil price could attempt more gains above $130.
Gold Price Technical Analysis
Gold price started another increase after it broke the $1,950 resistance against the US Dollar. The price even cleared the $1,980 level to move into a positive zone.
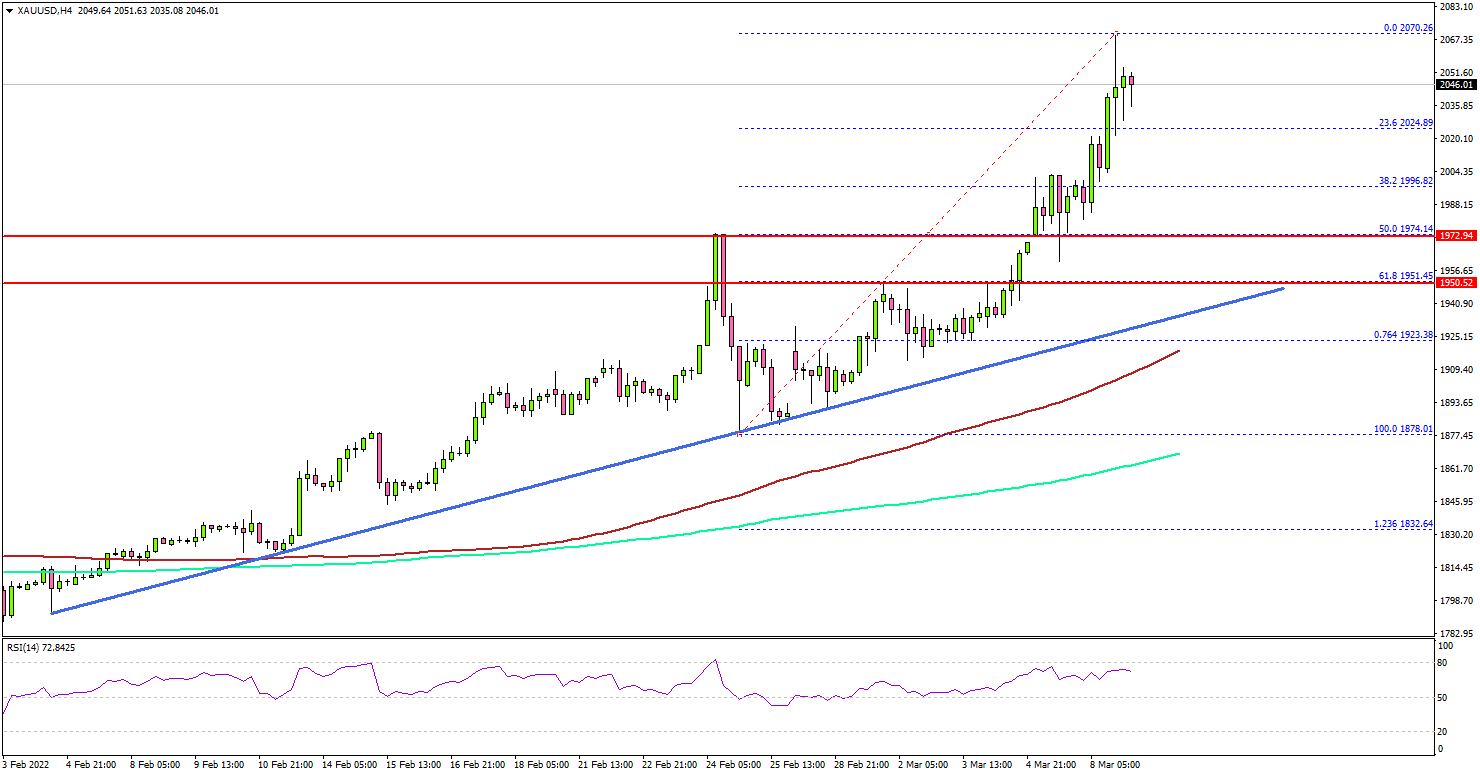
The 4-hours chart of XAU/USD indicates that the price gained pace for a move above the main $2,000 resistance. The price traded to a new multi-month high above $2,070.
There was also a close above $2,000, the 100 simple moving average (red, 4-hours) and the 200 simple moving average (green, 4-hours). The current price action suggests high chances of more gains above the $2,050 level.
The next key resistance could be $2,060, above which the bulls might aim a test of the $2,075 resistance zone (high formed in 2020). Any more gains could push the price above $2,120.
If not, the price might correct lower and trade below the $2,020 level. The next major support is near $1,980, below which the price might decline to $1,950. There is also a crucial bullish trend line forming with support near $1,935 on the same chart.
Looking at EUR/USD, the pair could recover, but upsides might be limited above 1.1120. Besides, GBP/USD remains at a risk of a move towards the 1.3000 zone.
Economic Releases to Watch Today
- EIA Crude Oil Stocks Change – Forecast -0.833M, versus -2.597M previous.
Gold’s Recent Surge and the Upcoming US CPI Rates
Gold continues to be up for the second consecutive week and today has surged notably in the European morning surpassing the $2000 per ounce barrier. Even though Gold traders have a packed economic calendar with significant releases in the upcoming days, the market is currently concerned about the impact of geopolitical happenings on the global economy. This report will shed light on the most dominant factors driving the Gold market and close with a technical analysis identifying important price levels for traders to keep in mind.
From our point of view Gold’s most visible upward movement came on the 4th of March during the US employment report release. The report was rather solid, with the NFP figure showing an increase of 678K and the Unemployment rate dropping to 3.8%, figures that were much better than the market’s expectations. The figures could be evidence that the US economy’s performance can be moving in red hot territory so far in 2022. This event may have been a big bet for the Federal Reserve which is keeping its eyes firmly on the most important indicators of the economy, possibly using them as a guidance or a metric for its own decision making. The FOMC’s upcoming meeting scheduled for the 15-16 of March could be a huge event for the Gold market since the central bank’s intentions in terms of rate hikes are still unclear. Though, a rate hike could be in the FOMC’s cards for the meeting, the size of the rate hike is still to be determined and could surprise market participants creating conditions for a session with intense volatility for the Gold market.
A key factor for traders to be mindful of in the following sessions is the current relationship between the USD and Gold. During the current week the Greenback has been lifted to a new yearly high, with the Dollar Index jumping to levels previously seen in May 2020. On the other hand, the Gold market today reached levels previously seen in August 2020 and is nearing the previous all-time high price which was nearby $2075 seen back then. The greenback could be appreciating as the US economy continues to display strength on multiple fronts possibly approaching pre pandemic levels, leaving aside supply bottle necks that continue to drive inflationary pressures. However, Gold’s impressive rise could be driven by global economic uncertainty and worry. Previously, investors and traders have used Gold to cover for the market’s insecurities over the economic growth moving forward and these worries can remain in the background, if tensions in Ukraine persist. Military intervention in Ukraine by Russia seems to remain a fact for the time being, yet the financial world is focusing more on the measures other nations are taking against Russia. The European Union and the US, are implementing rules that will be reducing their dependence on Russia for Energy supply, relating to both Oil and Gas. Moreover, Reuters noted in a report that the London Bullion Market Association (LBMA) suspended its authorization of six Russian precious metals refiners, meaning they will no longer be able to sell gold and silver in the London market. However, these actions have led to energy and agriculture commodity prices surging to new multiyear high levels, making the cost of goods even more expensive and subsequently adding to the already heightened market uncertainty. Finally, even though ceasefire talks have made headlines in the media, a swarm of refugees seems to be building up that could be worsening the situation.
Looking forward in the current week, the most significant economic release that can create strong volatility for the Gold market are the US Inflation data coming up on the 10th of March. The CPI and Core CPI rates for February are of major importance for economists and traders. Inflation data seems to motivate traders to stay ready, as Gold’s ability to be used as a counter tool for higher prices may come into play. At the same time and date, we also get the weekly Initial Jobless Claims figure. On the 11th of March we also get the notable Preliminary University of Michigan Economic Sentiment for March.
Technical Analysis
XAU/USD H4
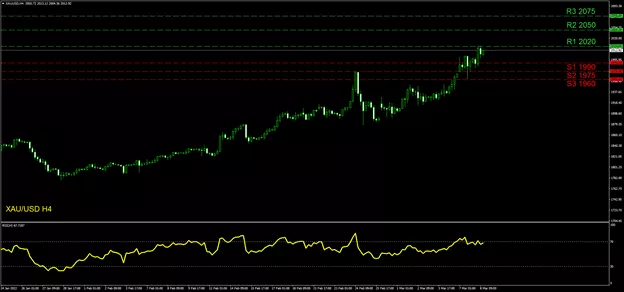
During the most recent trading sessions Gold has elevated and reached our currently noted (R1) 2020 resistance which is a new multiyear high level. In case this level is breached, then we consider this a strong bullish sign that could possibly lead the price action towards the (R2) 2050 hurdle. At the top we also keep the (R3) 2075 level as a target for the bulls as it was the previous all-time high level for the yellow metal. Please note the (R2) and the (R3) levels were last seen in August 2020. On the contrary, if the sellers take over, the price action could be heading lower to test the (S1) 1990 support barrier. This level has been circulated by the price action in the recent sessions making it a possible first stop for the bears. If the selling is intensified, then the (S2) 1975 line could be next from our point of view. Lastly, the (S3) 1960 line can be used as a final support level, which was recognized previously as a resistance by traders. Overall Gold remains in an upward trend line according our personal view. The RSI indicator below our chart continues to run across the 70 level, confirming the buying orders are in excess currently.
USD/CAD Daily Outlook
Daily Pivots: (S1) 1.2823; (P) 1.2862; (R1) 1.2928; More...
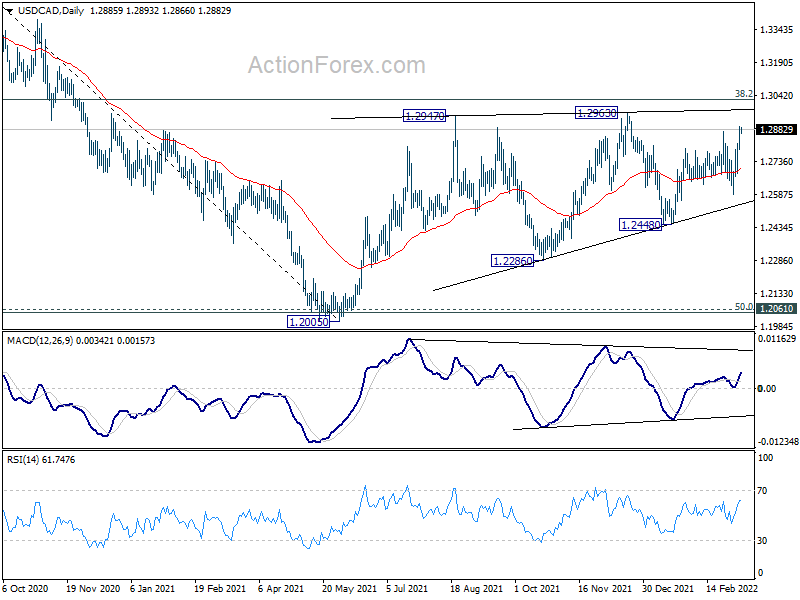
USD/CAD's break of 1.2876 resistance suggests that rise from 1.2448 has resumed, and revives near term bullishness. Intraday bias is back on the upside for 1.2963 resistance first. Break there will target key long term fibonacci level at 1.3022. On the downside, below 1.2794 minor support will turn intraday bias neutral and mix up the outlook again.
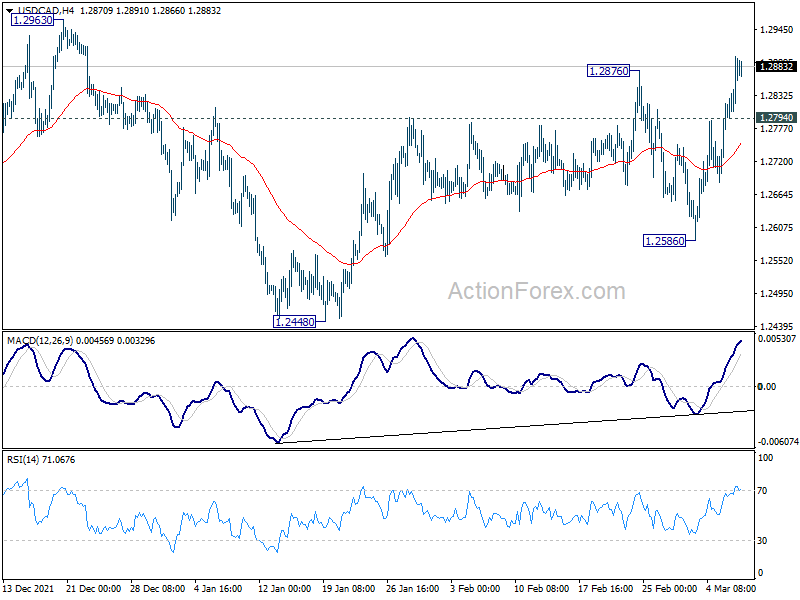
In the bigger picture, focus stays on 38.2% retracement of 1.4667 (2020 high) to 1.2005 (2021 low) at 1.3022. Sustained break there should confirm that the down trend from 1.4667 has completed after defending 1.2061 long term cluster support. Further rise would then be seen towards 61.8% retracement at 1.3650. However, rejection by 1.3022 will maintain medium term bearishness. Break of 1.2005 will resume the down trend from 1.4667 and that carries larger bearish implications too.