

Sample Category Title
Technical Outlook and Review
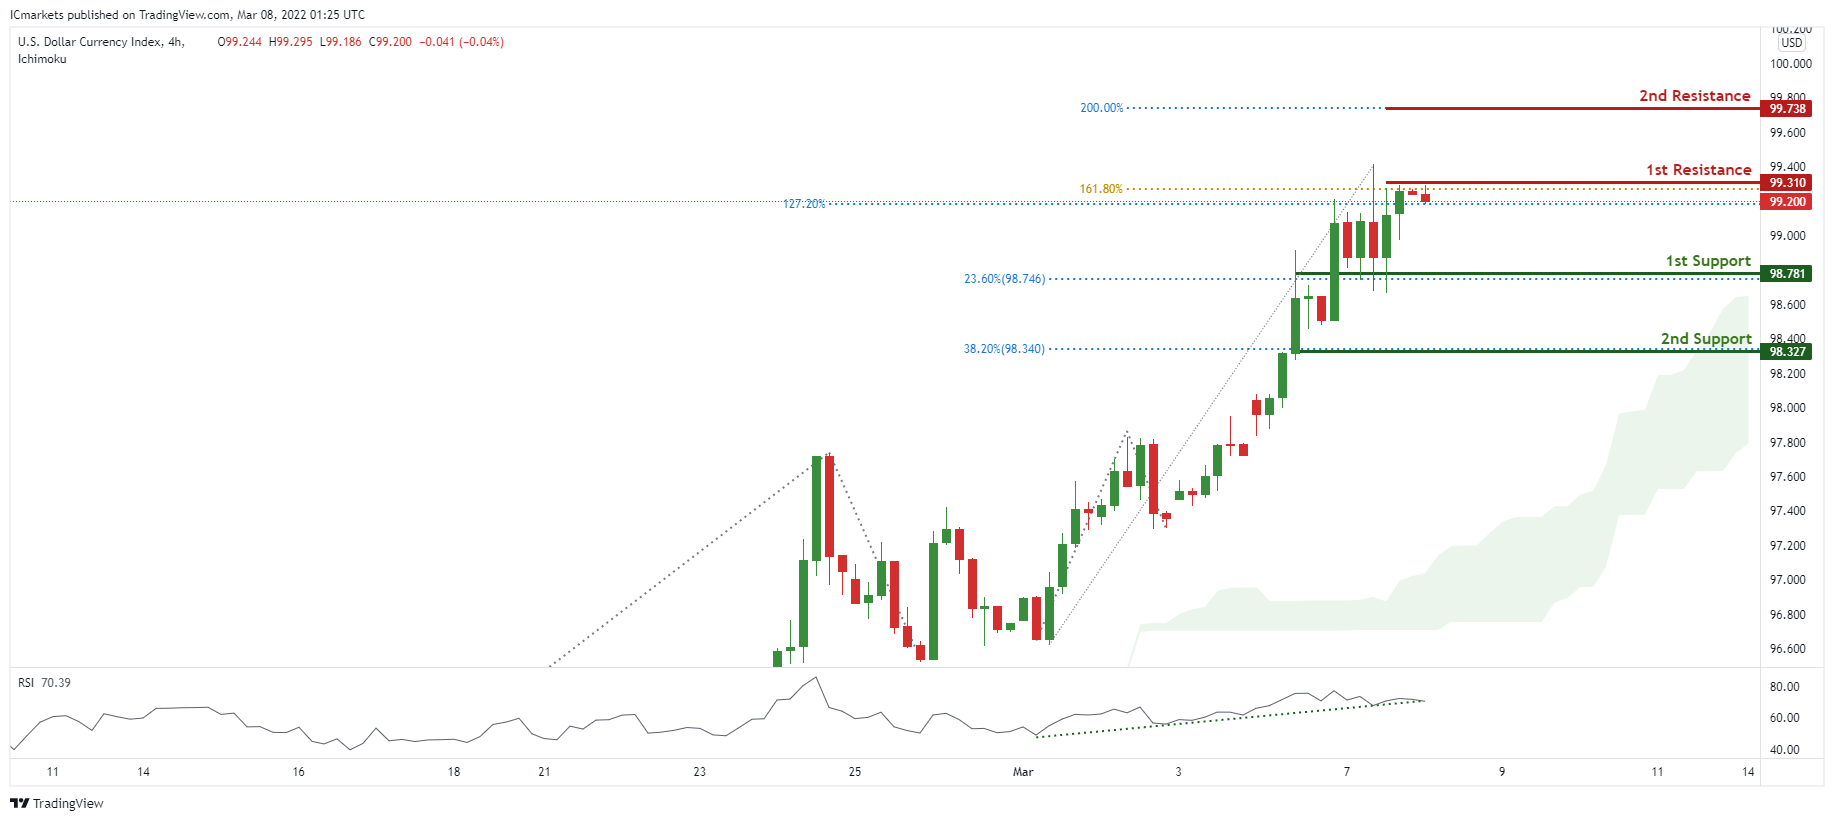
DXY:
On the H4 timeframe, prices are at a recent high and approaching our pivot. We see the potential for a pullback from our 1st resistance at 99.310 in line with 127.2% Fibonacci projection and 200% Fibonacci Projection towards our 1st support at 98.781 in line with 23.6% Fibonacci retracement. RSI is portraying bullish momentum, further supporting our bullish bias.
Areas of consideration:
- H4 time frame, 1st resistance at 99.310
- H4 time frame, 1st support at 98.781
XAU/USD (GOLD):
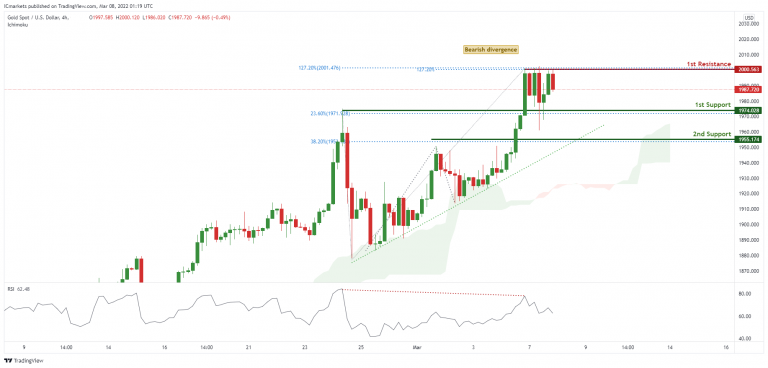
On the H4 chart, prices are on strong bullish momentum and abiding to our ascending trendline support. We see potential for prices to dip from our 1st resistance at 2000.563 in line with 127.2% Fibonacci extension and 127.2% Fibonacci Projection towards our 1st support at 1974.028 in line with 23.6% Fibonacci retracement. Divergence is spotted on RSI, further supporting our bearish bias.
Areas of consideration:
- 4h 1st support at 1974.028
- 4h 1st resistance at 2000.563
GBP/USD
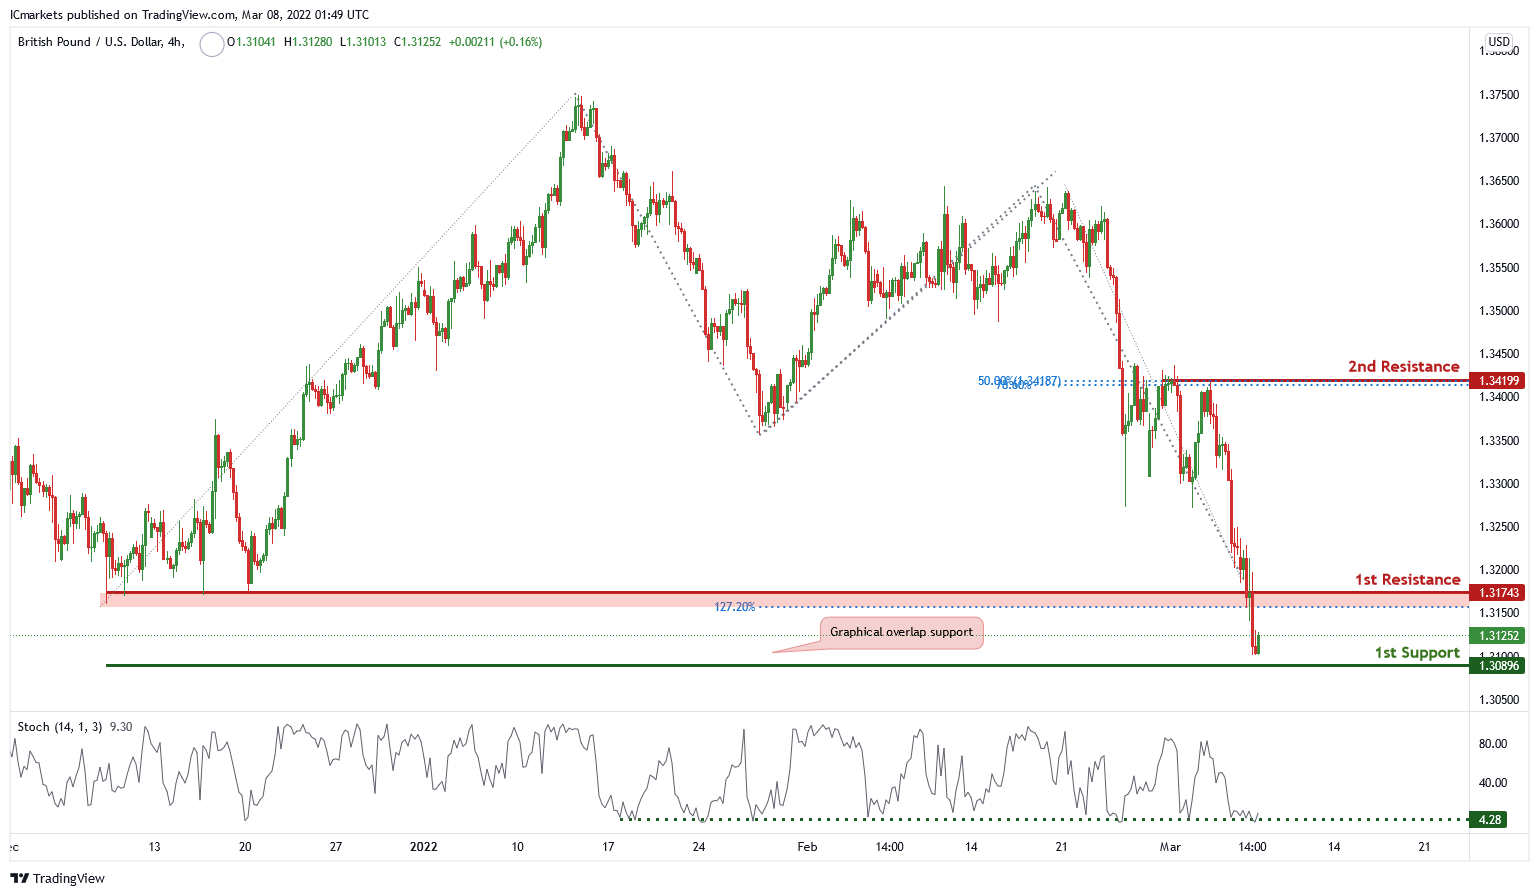
On the H4 chart price is near 1st support level of 1.131743 in line with 127.2% Fibonacci projection and graphical swing low. Price can potentially bounce from 1st support to 1st resistance level of 1.34199 in line with 50% Fibonacci retracement and 78.6% Fibonacci projection. Our bullish bias is supported by stochastic as it is a support level
Areas of consideration
- H4 1st resistance at 1.34199
- H4 1st support at 1.31743
USD/CHF:
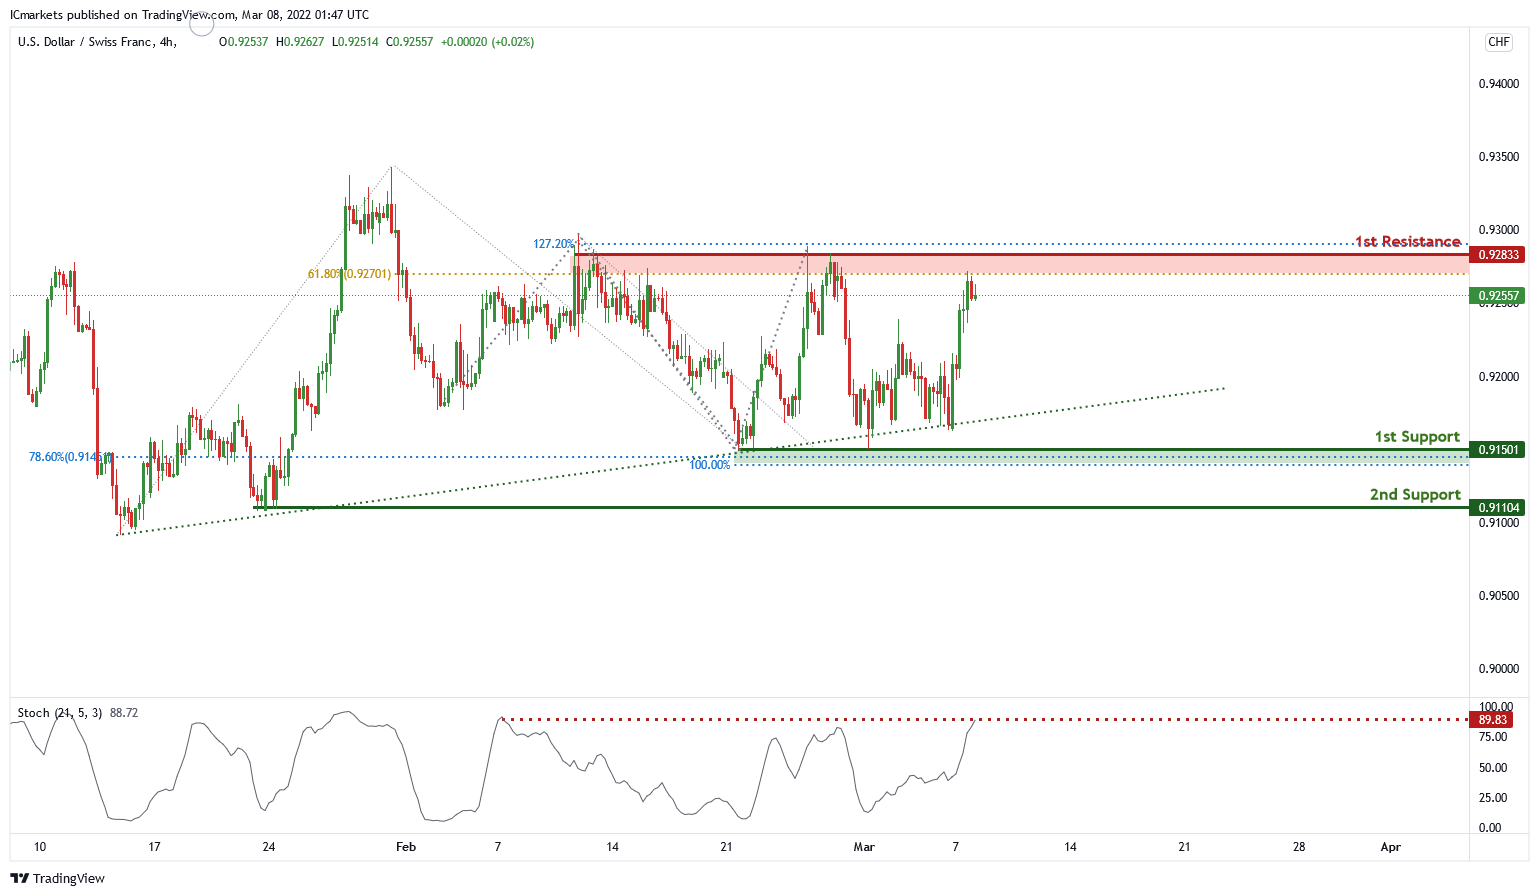
On the H4, price is abiding by an ascending trendline and near 1st resistance level of 0.92833 in line with 127.2% Fibonacci projection and 61.8% Fibonacci retracement. Price can potentially dip to the 1st support level of 0.91501 in line with 100% Fibonacci projection and 78.6% Fibonacci retracement. Our bearish bias is supported by a stochastic indicator as it is near the resistance level.
Areas of consideration
- 1st resistance level at 0.92833
- 1st support level at 0.91501
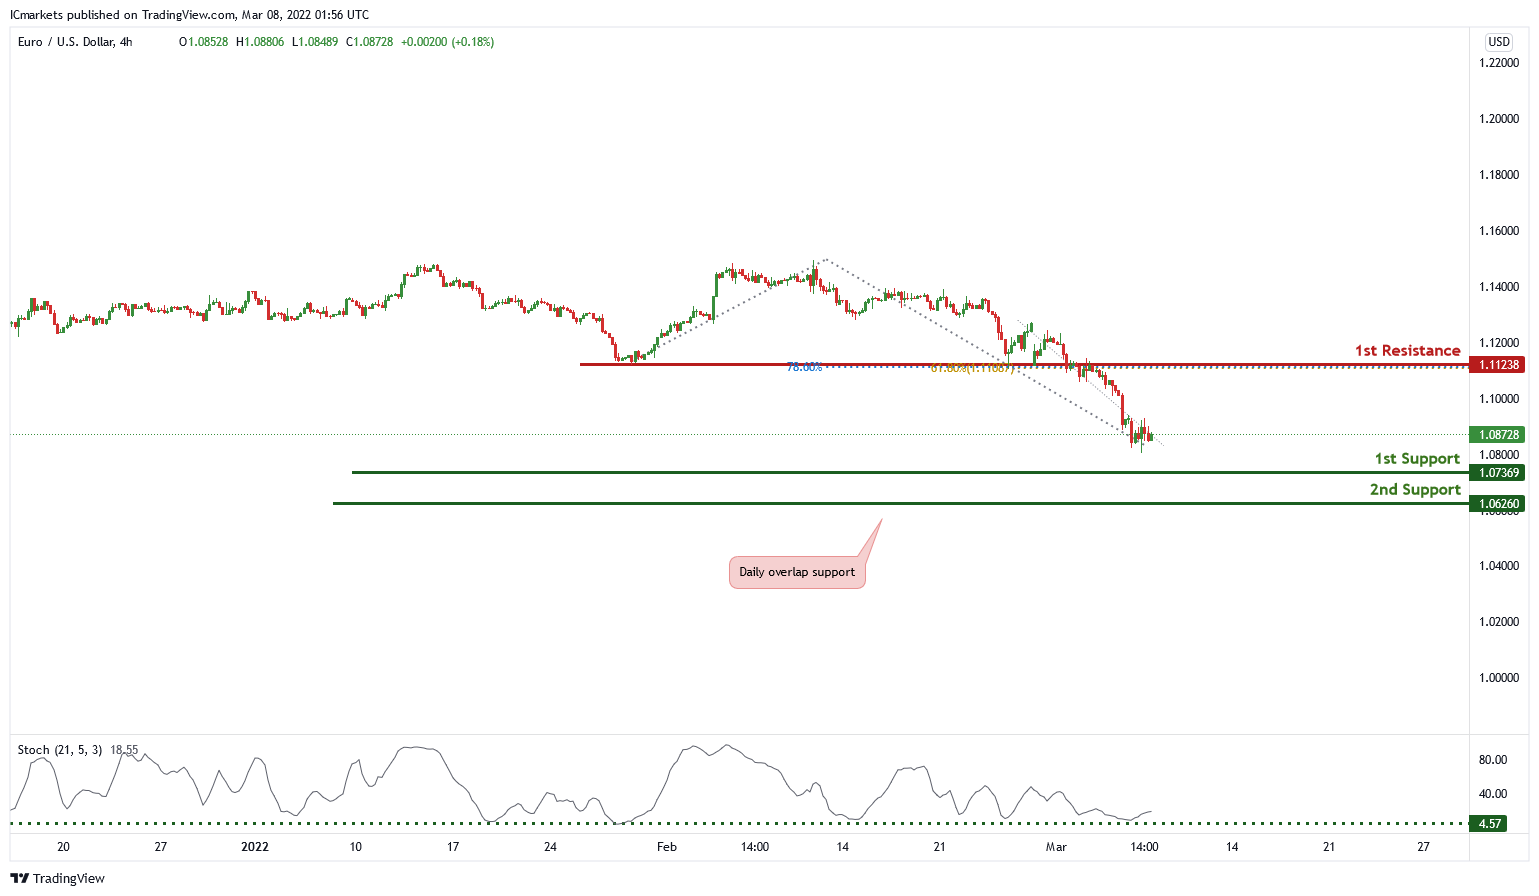
EUR/USD :
On the H4 chart price is near 1st support level of 1.07828 in which is also the graphical overlap support. Price can potentially bounce from this support level to 1st resistance of 1.11241 in line with 78.6% Fibonacci projection and 61.8% Fibonacci retracement. Our bullish bias is supported by the stochastic indicator as it is at support level.
Areas of consideration :
- H4 1st resistance at 1.11238
- H4 1st support at 1.07369
USD/JPY:
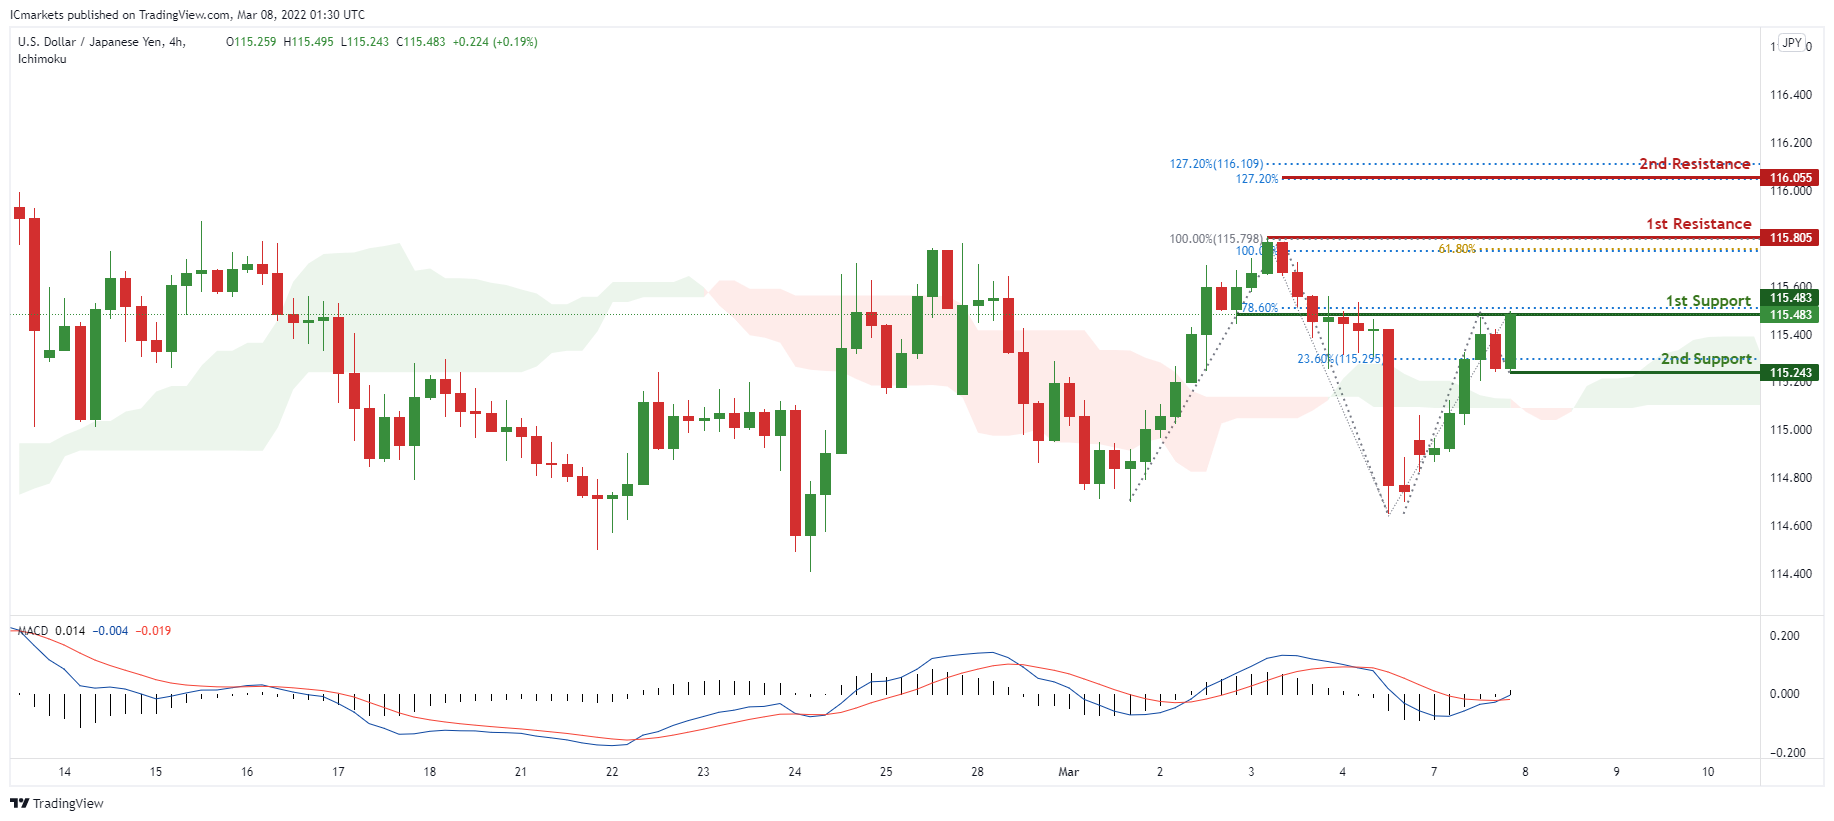
On the H4 timeframe, prices are on bullish momentum. We see the potential for further bullish momentum from our 1st support at 115.483 in line with 78.6% Fibonacci retracement towards our 1st resistance at 115.805 which is an area of fibonacci confluences. Our bullish bias is further supported by prices trading above our ichimoku cloud support and also MacD being on bullish momentum.
Areas of consideration:
- H4 time frame, 1st resistance at 115.805
- H4 time frame, 1st support at 115.483
AUD/USD:
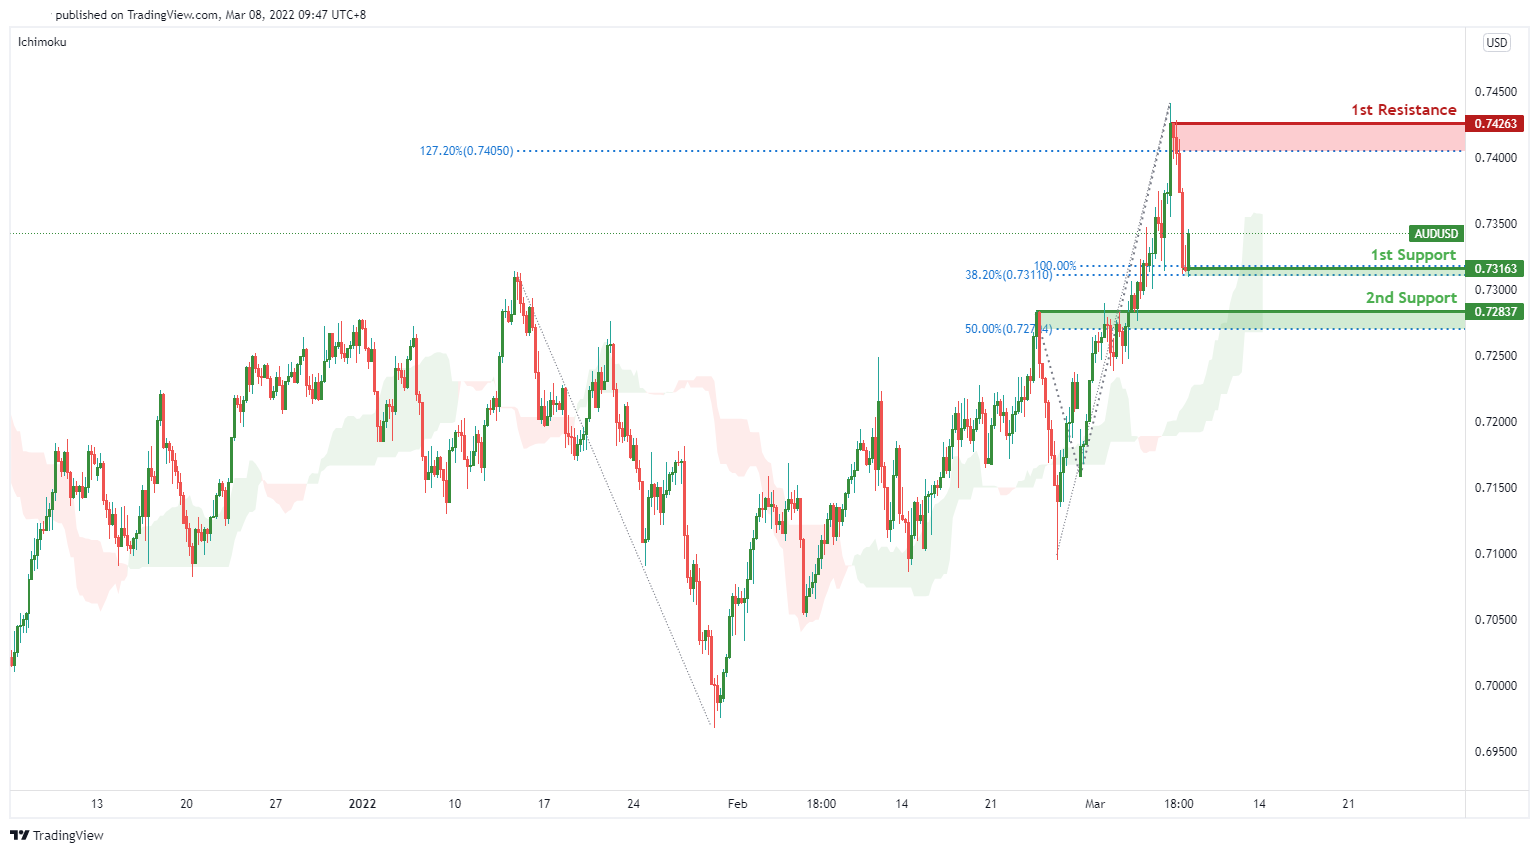
On the H4 timeframe, we see the potential for further bullish momentum from our 1st support at 0.73163 in line with 38.2% Fibonacci retracement and 100% Fibonacci projection towards our 1st resistance at 0.74263. which is in line with 127.20% Fibonacci extension, along with a graphical swing high resistance. Our bullish bias is further supported by prices trading above the Ichimoku cloud. Alternatively, prices from 1st support might dip to 2nd support at 0.72837 in line with 50% Fibonacci retracement.
Areas of consideration :
- H4 1st support at 0.73163
- H4 1st resistance at 0.74263
NZD/USD:
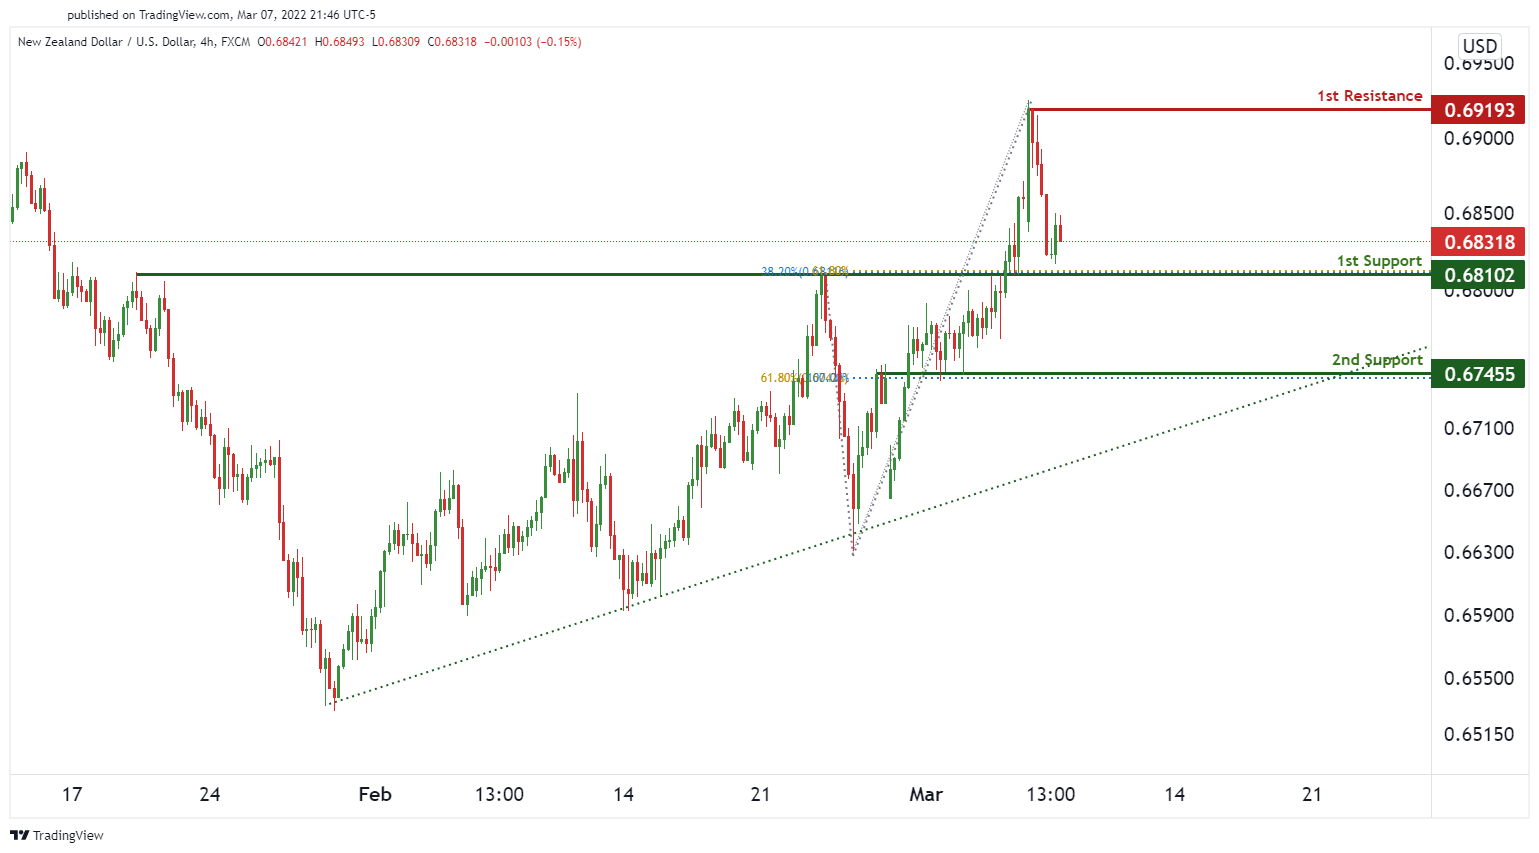
On the H4 chart, prices are on bullish momentum. We see the potential for further bullish momentum from our 1st support at 0.68102 in line with 38.2% Fibonacci retracement and 61.8% Fibonacci projection towards our 1st resistance at 0.69193with a graphical swing high resistance. Our bullish bias is further supported by prices trading above our ichimoku cloud support. Alternatively, prices may dip towards our 2nd support at 0.67455 in line with 61.8% Fibonacci retracement and 100% Fibonacci projection.
Areas of consideration:
- H4 time frame, 1st resistance at 0.69193
- H4 time frame, 1st support at 0.68102
USD/CAD:
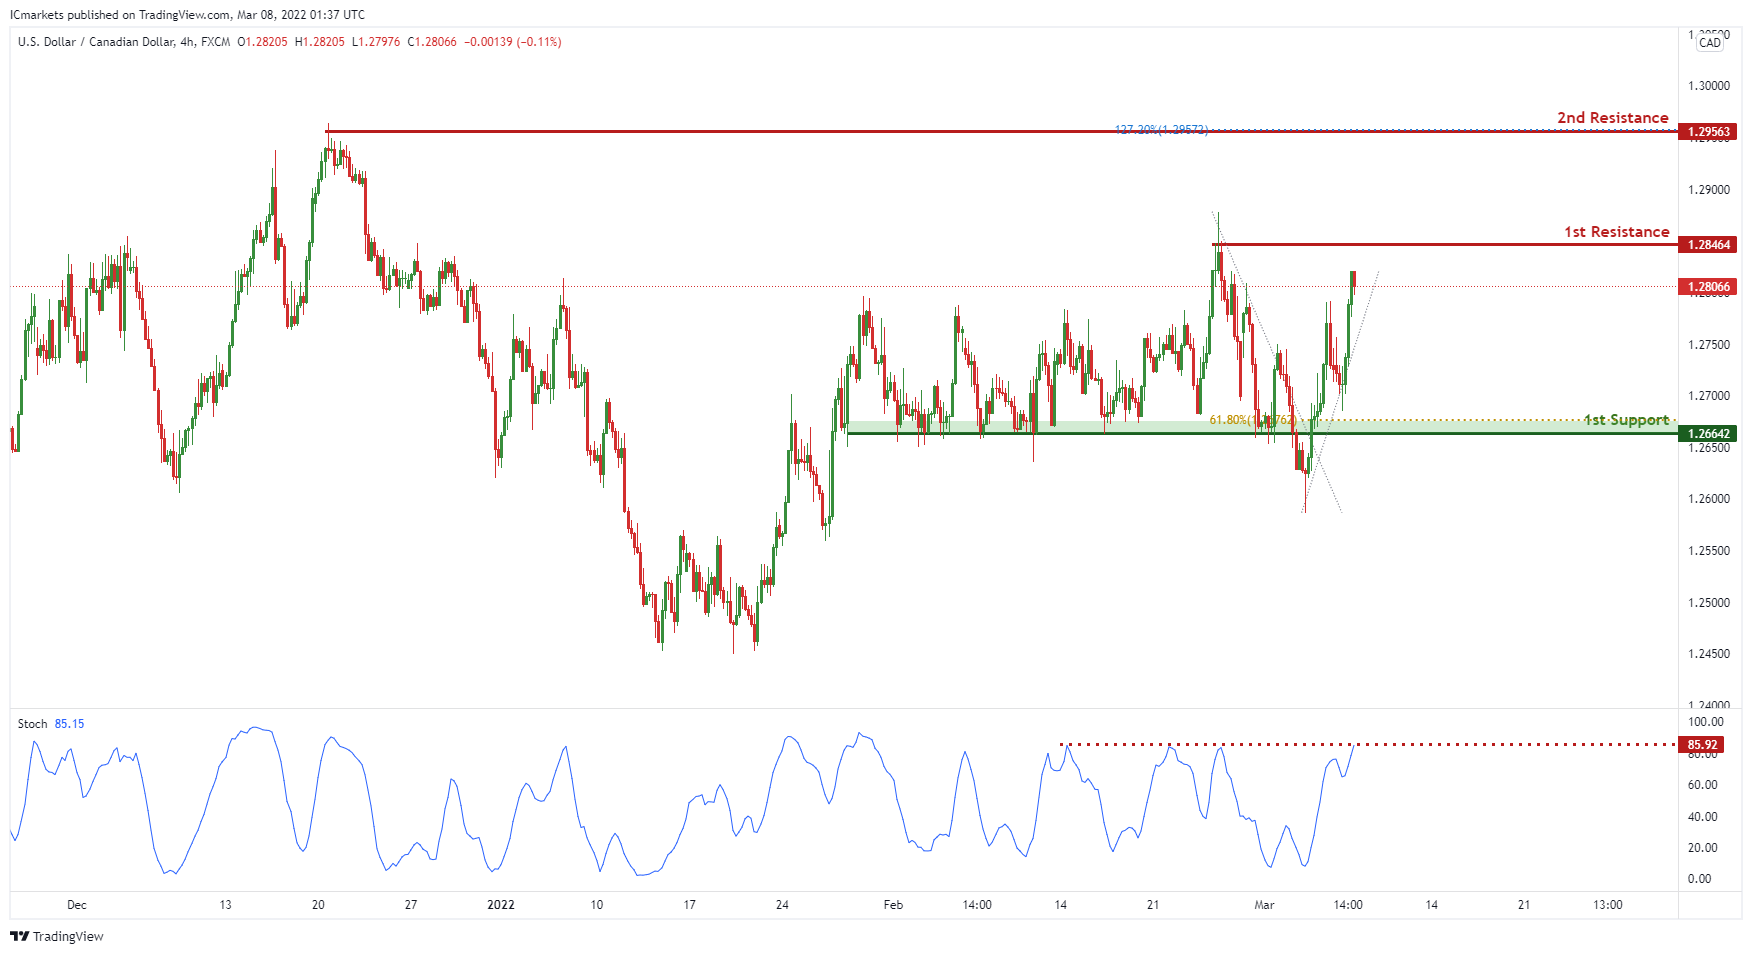
On the H4,with price expected to reverse off the stochastics indicator, we have a bearish bias that price will drop to our 1st support at 1.26642 in line with the 61.8% Fibonacci retracement and horizontal overlap support from our 1st resistance at 1.28464 in line with the horizontal swing high resistance. Alternatively, price may break 1st resistance and head for 2nd resistance at 1.29563 in line with the 127.2% Fibonacci extension.
Areas of consideration:
- H4 time frame, 1st support at 1.26642
- H4 time frame, 1st resistance at 1.28464
OIL:
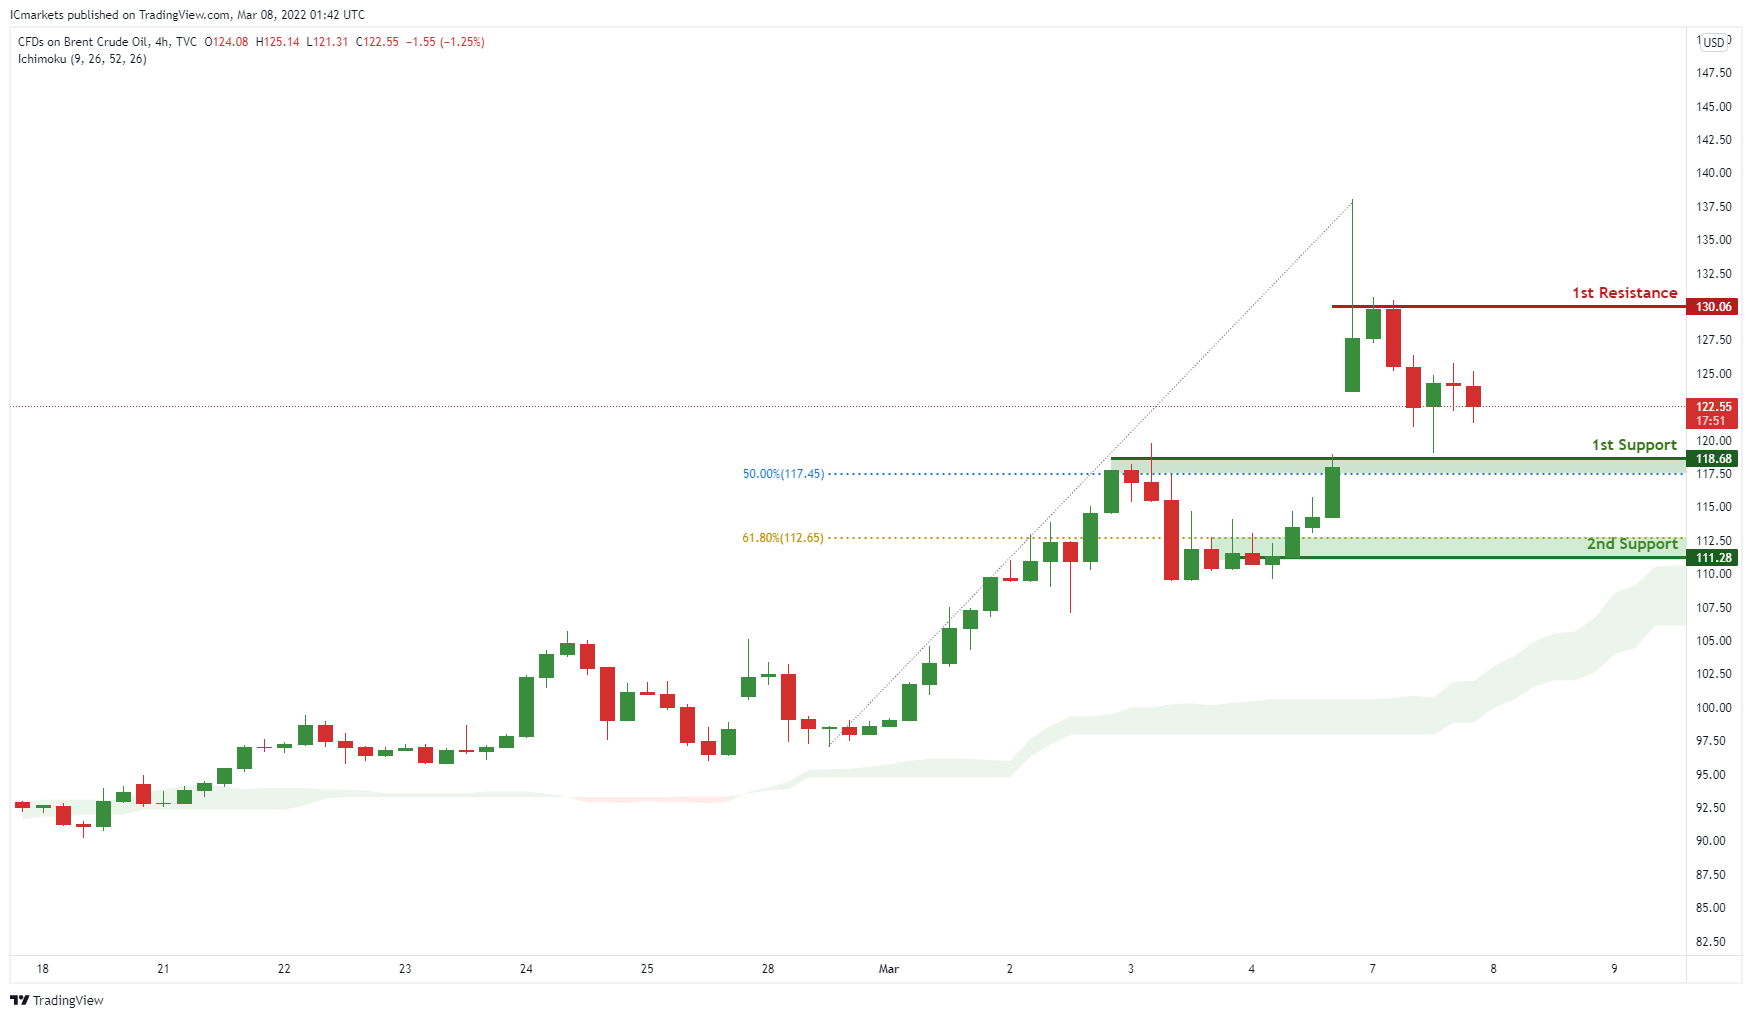
On the H4 timeframe, price is near 1st support level of 118.68 in line with horizontal overlap support and 50% Fibonacci retracement. Price can potentially rise to the 1st resistance level of 130.06 in line with the swing high resistance. Alternatively, price may break 1st support and head for 2nd support at 111.28 where the 61.8% Fibonacci retracement is. Our bullsh bias is supported by how price is moving above the ichimoku cloud.
Areas of consideration:
- H4 time frame, 1st resistance of 130.06
- H4 time frame, 1st support of 118.68
Dow Jones Industrial Average:
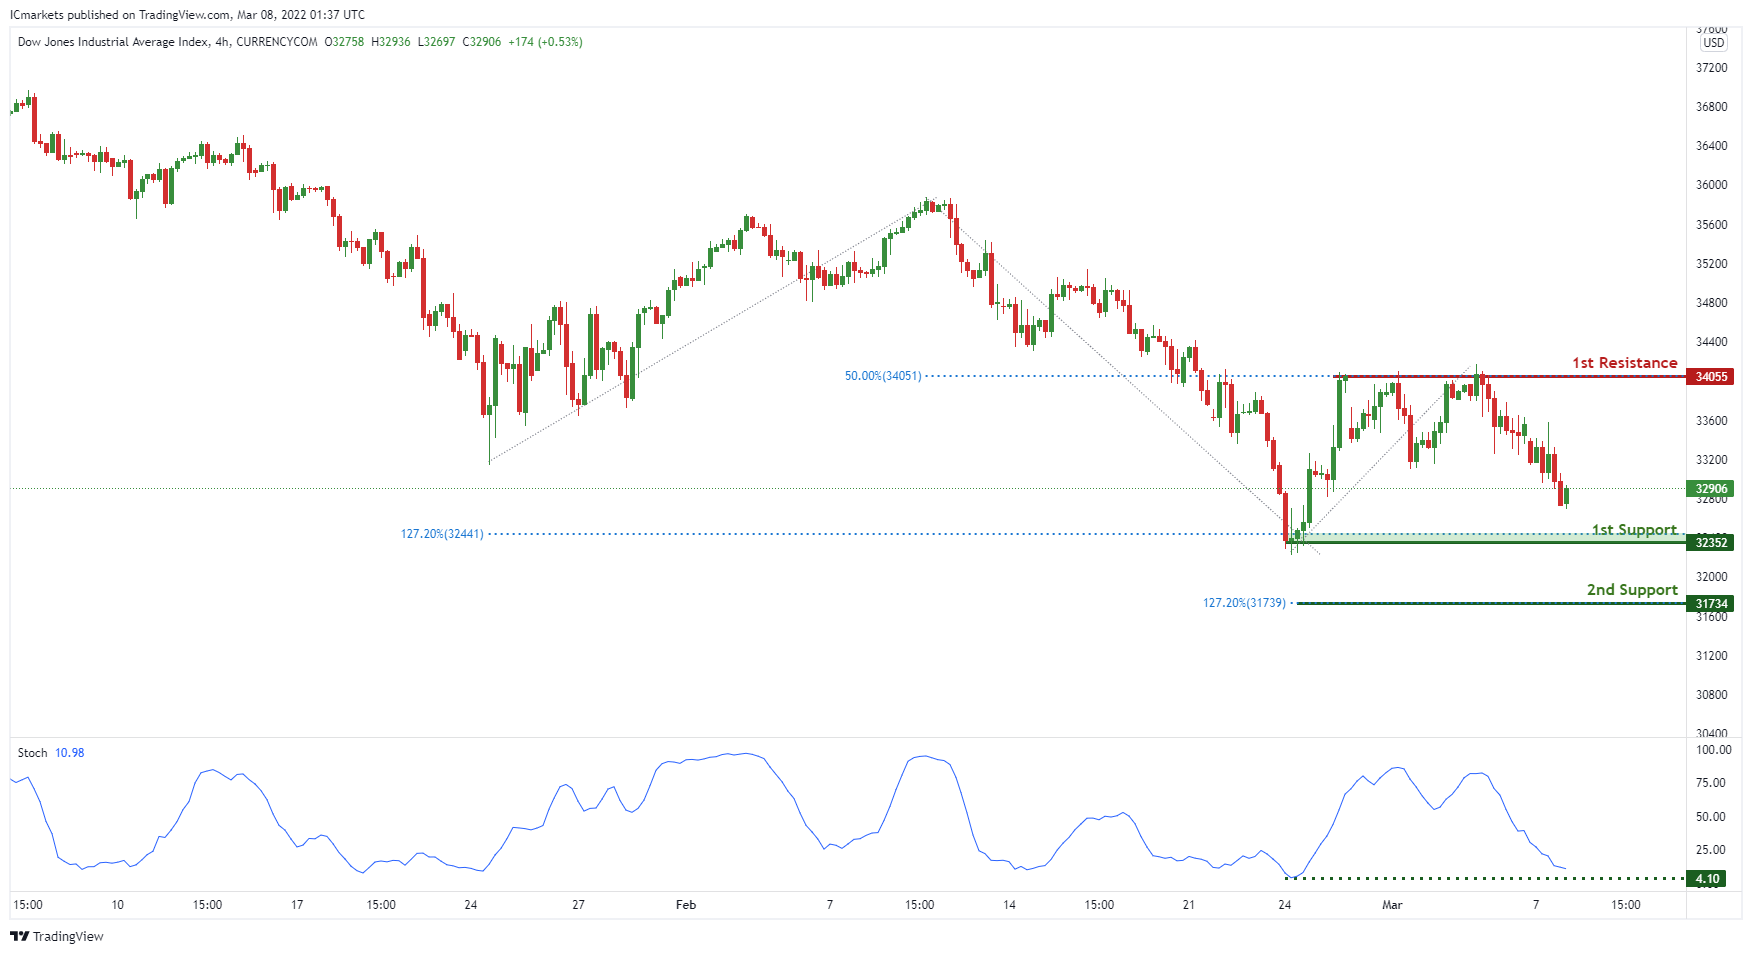
On the H4 timeframe, price is near 1st support level of 32352 in line with horizontal swing low support and 127.2% Fibonacci extension. Price can potentially rise to the 1st resistance level of 34055 in line with the swing high resistance and 50% Fibonacci retracement. Alternatively, price may break 1st support and head for 2nd support at 31734 where the127.2% Fibonacci extension is. Our bullsh bias is supported by how price is expected to bounce off the stochastics indicator.
Areas of consideration :
- H4 1st support at 32352
- H4 1st resistance at 34055
GBP/JPY Daily Outlook
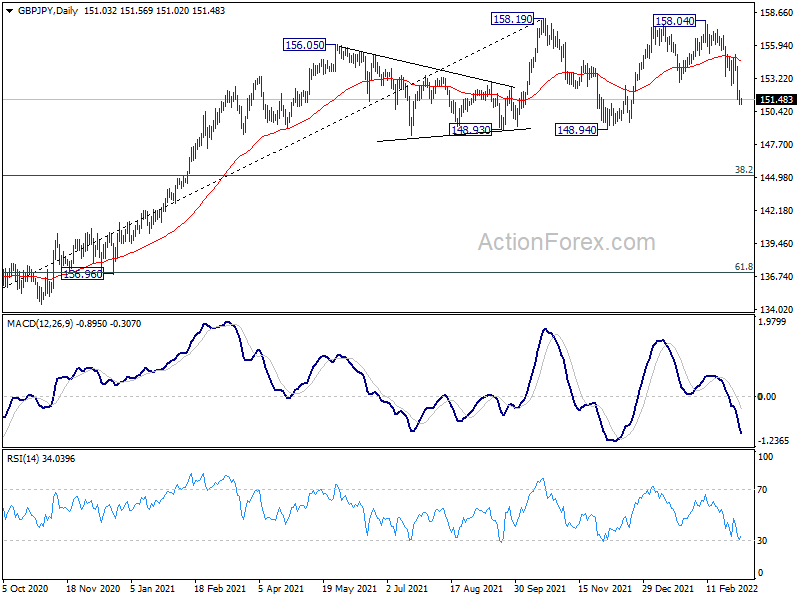
Daily Pivots: (S1) 150.68; (P) 151.46; (R1) 151.87; More...
Intraday bias in GBP/JPY stays on the downside for the moment. Decline from 158.04, which is seen as the third leg of the consolidation pattern from 158.19, should target 148.94 support next. On the upside, break of 155.20 resistance is needed to indicate completion of the decline. Otherwise, outlook will be mildly bearish in case of recovery.
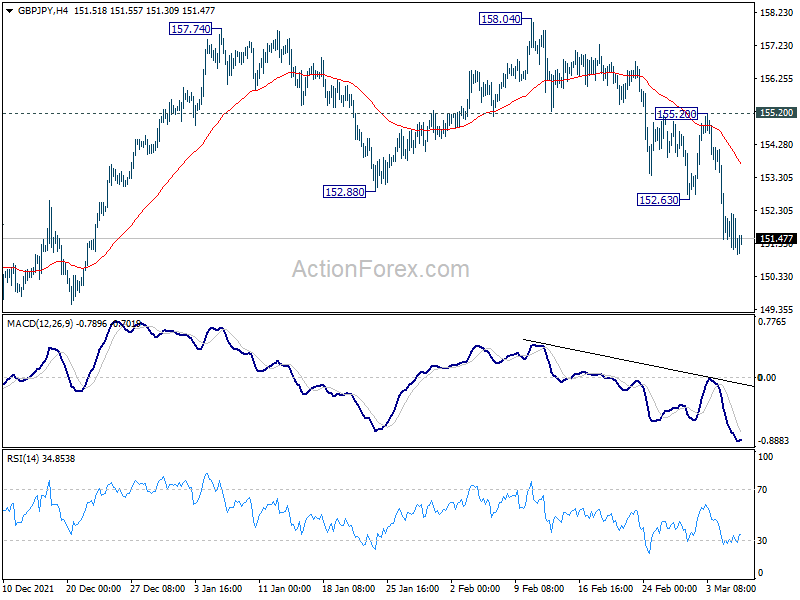
In the bigger picture, price actions from 158.19 are seen as developing into a consolidation pattern to up trend from 123.94 (2020 low). Downside should be contained by 38.2% retracement of 123.94 to 158.19 at 145.10 to bring rebound. Firm break of 158.19 will resume the up trend to long term fibonacci level at 167.93. However, sustained break of 145.10 will raise the chance of trend reversal and target 61.8% retracement at 137.02.
Euro and Pound Consolidate, But Staying Weak
US stocks were hammered again overnight and selling continues in Asia. But major currency pairs and crosses are trading in tight range, digesting recent moves. Euro and Sterling are recovering some grounds while Aussie is paring gains. Gold is consolidating below 2k handle but the retreat is shallow. WTI crude oil is holding firm in consolidation above 120. There is little that suggest a change in overall directions in the markets so far and more downside is still in favor for Euro and Pound.
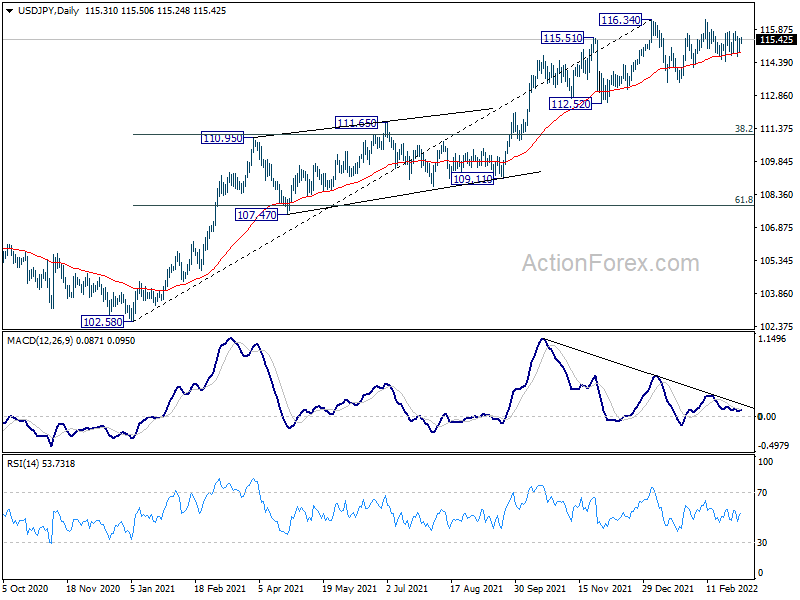
Technically, a major focus to us is USD/JPY would break out from recent range of 114.40/116.33. An upside break out is mildly in favor given that the pair is continuously supported by 55 day EMA. However, once the persistent support was taken out firmly, the selling could be intense, and we might see USD/JPY diving towards 110.95 support in rather quick manner.
In Asia, at the time of writing, Nikkei is down -1.25%. Hong Kong HSI is down -0.45%. China Shanghai SSE is down -1.99%. Singapore Strait Times is down -0.75%. Japan 10-year JGB yield is up 0.0164 at 0.163. Overnight, DOW dropped -2.37%. S&P 500 dropped -2.95%. NASDAQ dropped -3.62%. 10-year yield rose 0.027 to 1.751.
Australia NAB business confidence rose to 13, getting back on track
Australia NAB business confidence rose from 4 to 13 in February. Business conditions rose from 2 to 9. Looking at some details, trading conditions rose from 8 to 10. Profitability condition rose from 2 to 5. Employment condition rose from -1 to 8.
"Overall, the February survey shows that the economy is quickly getting back on track as the Omicron wave recedes," said said NAB Group Chief Economist Alan Oster. "The outlook is fairly strong with supply disruptions and cost pressures now the major challenge facing businesses."
Japan bank lending grew 0.4% yoy in Feb, slowest since 2012
Japan bank lending grew 0.4% yoy in February, below expectation of 0.6% yoy. That's the slowest rate since May 2012. Lending by major banks dropped -1.3% yoy, biggest decline since August 2021. Regional banks' lending rose 1.7% yoy, smallest increase in more than a decade.
"We must keep an eye out on how developments in Ukraine could affect corporate funding through rising crude oil prices," a BOJ official told a briefing.
Also released, labor cash earnings rose 0.9% yoy in January, above expectation of 0.2% yoy. Current account surplus narrowed to JPY 0.19T in January, below expectation of JPY 0.33T.
Looking ahead
Germany industrial production, Italy retail sales and Eurozone GDP will be released in European session. Later in the day, US and Canada will both release trade balance.
GBP/JPY Daily Outlook
Daily Pivots: (S1) 150.68; (P) 151.46; (R1) 151.87; More...
Intraday bias in GBP/JPY stays on the downside for the moment. Decline from 158.04, which is seen as the third leg of the consolidation pattern from 158.19, should target 148.94 support next. On the upside, break of 155.20 resistance is needed to indicate completion of the decline. Otherwise, outlook will be mildly bearish in case of recovery.
In the bigger picture, price actions from 158.19 are seen as developing into a consolidation pattern to up trend from 123.94 (2020 low). Downside should be contained by 38.2% retracement of 123.94 to 158.19 at 145.10 to bring rebound. Firm break of 158.19 will resume the up trend to long term fibonacci level at 167.93. However, sustained break of 145.10 will raise the chance of trend reversal and target 61.8% retracement at 137.02.
Economic Indicators Update
| GMT | Ccy | Events | Actual | Forecast | Previous | Revised |
|---|---|---|---|---|---|---|
| 23:30 | JPY | Labor Cash Earnings Y/Y Jan | 0.90% | 0.20% | -0.20% | -0.40% |
| 23:50 | JPY | Bank Lending Y/Y Feb | 0.40% | 0.60% | 0.60% | 0.50% |
| 23:50 | JPY | Current Account (JPY) Jan | 0.19T | 0.33T | 0.79T | 0.81T |
| 00:01 | GBP | BRC Like-For-Like Retail Sales Y/Y Feb | 2.70% | 4.70% | 8.10% | |
| 00:30 | AUD | NAB Business Confidence Feb | 13 | 3 | 4 | |
| 00:30 | AUD | NAB Business Conditions Feb | 9 | 3 | ||
| 05:00 | JPY | Leading Economic Index Jan P | 104.5 | 104.8 | ||
| 05:00 | JPY | Eco Watchers Survey: Current Feb | 38.1 | 37.9 | ||
| 07:00 | EUR | Germany Industrial Production M/M Jan | 0.50% | -0.30% | ||
| 09:00 | EUR | Italy Retail Sales M/M Jan | 1.10% | 0.90% | ||
| 10:00 | EUR | Eurozone GDP Q/Q Q4 F | 0.30% | 0.30% | ||
| 10:00 | EUR | Eurozone Employment Change Q/Q Q4 F | 0.50% | 0.50% | ||
| 11:00 | USD | NFIB Business Optimism Index (CAD) Feb | 97.5 | 97.1 | ||
| 13:30 | CAD | International Merchandise Trade Jan | -87.5B | -0.1B | ||
| 13:30 | USD | Trade Balance (USD) Jan | -87.5B | -80.7B | ||
| 15:00 | USD | Wholesale Inventories Jan | 0.80% | 0.80% |
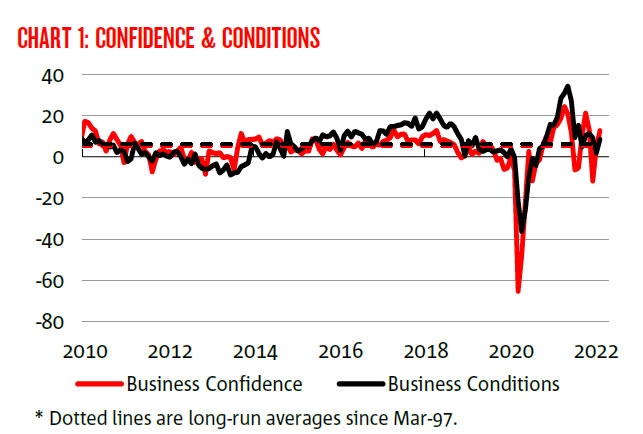
Australia NAB business confidence rose to 13, getting back on track
Australia NAB business confidence rose from 4 to 13 in February. Business conditions rose from 2 to 9. Looking at some details, trading conditions rose from 8 to 10. Profitability condition rose from 2 to 5. Employment condition rose from -1 to 8.
"Overall, the February survey shows that the economy is quickly getting back on track as the Omicron wave recedes," said said NAB Group Chief Economist Alan Oster. "The outlook is fairly strong with supply disruptions and cost pressures now the major challenge facing businesses."
Japan bank lending grew 0.4% yoy in Feb, slowest since 2012
Japan bank lending grew 0.4% yoy in February, below expectation of 0.6% yoy. That's the slowest rate since May 2012. Lending by major banks dropped -1.3% yoy, biggest decline since August 2021. Regional banks' lending rose 1.7% yoy, smallest increase in more than a decade.
"We must keep an eye out on how developments in Ukraine could affect corporate funding through rising crude oil prices," a BOJ official told a briefing.
Also released, labor cash earnings rose 0.9% yoy in January, above expectation of 0.2% yoy. Current account surplus narrowed to JPY 0.19T in January, below expectation of JPY 0.33T.
Australian Economy to Grow by 5.5% in 2022
The Australian economy ended 2021 on a very strong note, expanding by 3.4% in the December quarter – matching the September 2020 outcome, and together the fastest quarterly growth rate since March 1976.
The main driver of that growth was consumer spending which lifted by 6.3% in the quarter as NSW and Victoria reopened following the delta led lock downs of the September quarter when the economy contracted by 1.9%, including a 4.8% fall in consumer spending.
The household savings rate fell from 19.8% in to 13.6% in the quarter. The increased availability of funds ($20bn) provided all the "funding" for the spending. Because household disposable income actually contracted by 0.5% as governments withdrew support payments.
However, the savings rate was still 7.6% above the "normal savings" rate of around 6% indicating that households added another $25bn to excess savings, which had already totalled $250 billion built up on household balance sheets over 2020 and 2021.
A critical determinant of growth in the Australian economy in 2022 and 2023 will be how quickly the savings rate reverts back to "normal" and what households do with their accumulated "war chest" of savings.
We expect that with wages growth lifting to 3.8% and the unemployment rate moving below 4% into "territory" we have not seen since the 1970's households are likely to reduce their savings rate to 6% by end 2022 and to push the rate below the norm in 2023.
Geopolitical developments have now emerged as a headwind to global growth. For Australia the immediate impact of the hostilities has been a huge lift in Australia's terms of trade and nominal incomes due to the surge in energy and base metal prices. On the other hand Russia only represents around 2% of Australia's exports.
A fall in the household savings rate in 2022 to 6% (from 13.6% in December 2021), along with an expected 2.5% lift in household disposable income would see real household spending lift by 8% over the year – directly adding 4.2ppts to annual economic growth and being the key driver behind our forecast of 5.5% for GDP growth in 2022 (unchanged from our December Market Outlook).
That forecast does not take into account the lift in spending that would be associated with households putting their accumulated excess savings to work. But we think there will be some lags in that process. The likely drag from rising global interest rates will be an issue; supply of services is also likely to represent a constraint – international flight traffic will be operating well below full capacity in 2022; supply of hospitality services will be constrained by labour availability; and households will be cautious in the second half of the year as interest rates rise; house prices begin to fall and inflation is well above previous experience.
Those factors will remain prominent in 2023. We expect further limited falls in the household savings rate to below the 6% "norm" although households are likely to seek to maintain most of their excess savings reserve in the face of more uncertainty.
Overall, this profile for the household sector will mean growth in the Australian economy for 2022, is forecast to be a strong 5.5%, further supported by solid business investment as businesses respond to strong growth in nominal GDP; vibrant demand from households; and attractive tax benefits which are available until at least June 2023.
Government spending is expected to continue to provide ongoing support, expanding by a forecast 3.7% – albeit this represents a cooling from the rapid growth of the past two years, 6.4% and 5.6%, as governments responded to the pandemic. State governments have committed to additional public transport initiatives, with the total value of definite projects in this segment jumping from $135bn prior to the pandemic to about $230bn at the end of 2021. This will underpin a material lift in public infrastructure work during 2022 and into 2023. We are optimistic that housing construction (up 8.8%) and renovations (up 10%) are both set to boost the economy in 2022 – with a sizeable pipeline of work, in part a response to the HomeBuilder program.
However, we retain our cautious view about 2023 and 2024. Rising interest rates; falling house prices; and an increase in the unemployment rate (in 2024) will see household spending growth slow to 3.2% (2023) and 2.2% (2024) cushioned by some further easing in the savings rate as households draw on their reserves.
We think these factors will motivate households to retain most of their excess savings as they protect against the uncertainties associated with this stage in the cycle.
Business investment and housing construction will also slow as the weakening household sector weighs on demand.
GBP/USD Extends Decline, Gold Visits $2K
Key Highlights
- GBP/USD followed a bearish path below 1.3280.
- Gold price extended gains and tested the $2,000 resistance.
- Crude oil price surged to $130 before correcting lower.
- AUD/USD and NZD/USD performed better than GBP/USD and EUR/USD.
GBP/USD Technical Analysis
The British Pound started a major decline after it failed to clear 1.3420 against the US Dollar. GBP/USD traded below the 1.3320 support to enter a bearish zone.
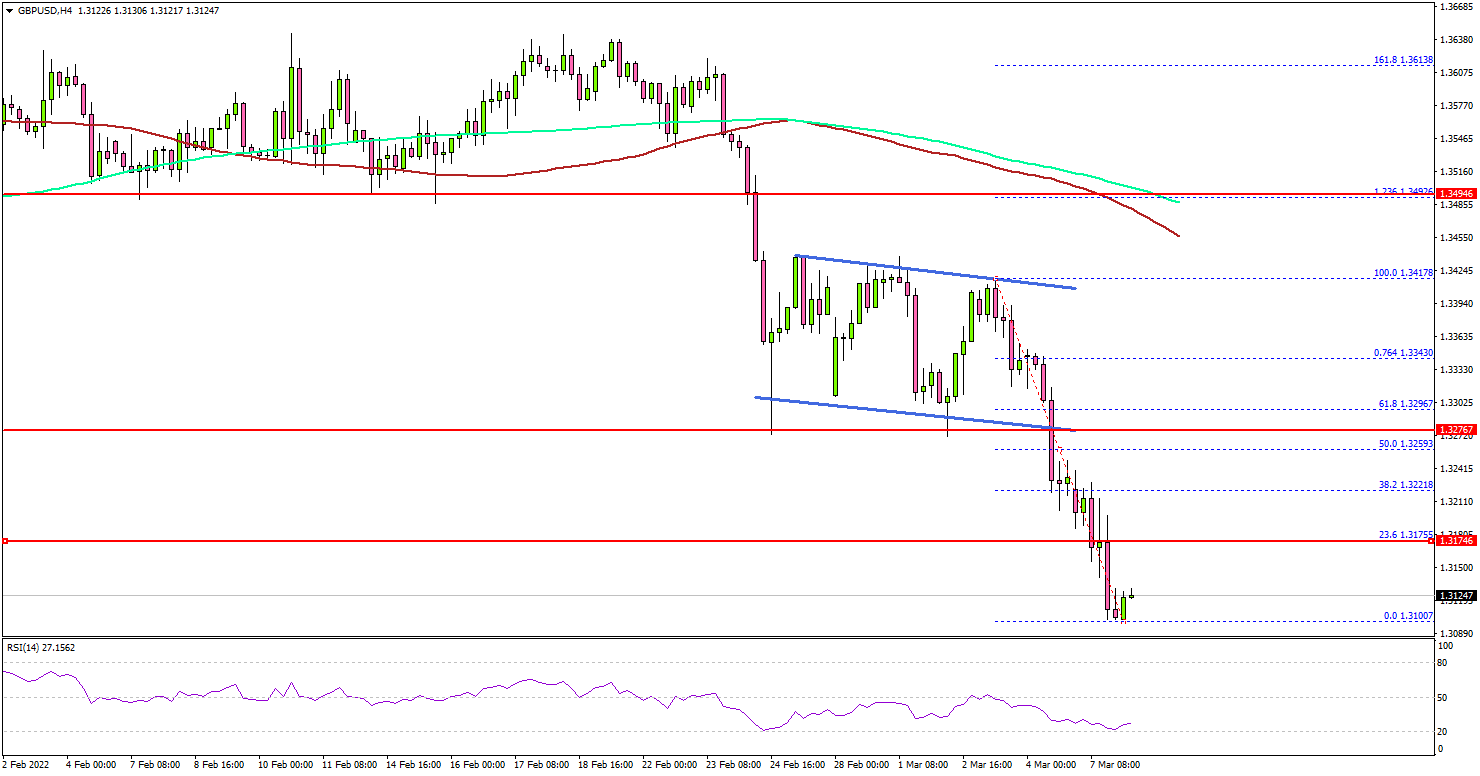
Looking at the 4-hours chart, the pair settled below the 1.3250 level, the 100 simple moving average (red, 4-hours), and the 200 simple moving average (green, 4-hours).
There was a clear move below the 1.3200 support zone. A low was formed near 1.3100 and the pair is now consolidating losses. If there is a recovery wave, the pair could face resistance near the 1.3200 level.
The next major resistance is near the 1.3280 level. A successful close above the 1.3250 resistance might start a steady increase. In the stated case, the pair could rise towards the 1.3400 resistance zone in the near term.
If not, the pair might continue to move down below the 1.3100 support zone. The next key support is near 1.3080 level, below which there is a risk of a move towards the 1.3000 handle.
Looking at EUR/USD, the pair extended decline below the 1.0850 support level. Conversely, gold price rallied to $2,000 and crude oil price spiked to $130 before correcting lower.
Economic Releases
- UK BR Like-for-Like Retail Sales for Feb 2022 (YoY) - Forecast +15.2%, versus +8.1% previous.
- Euro Zone Gross Domestic Product for Q4 2021 (QoQ) - Forecast 0.3%, versus 0.3% previous.
- Euro Zone Gross Domestic Product for Q4 2021 (YoY) - Forecast 4.6%, versus 4.6% previous.
Elliott Wave View: Pullback in Gold Should Remain Supported
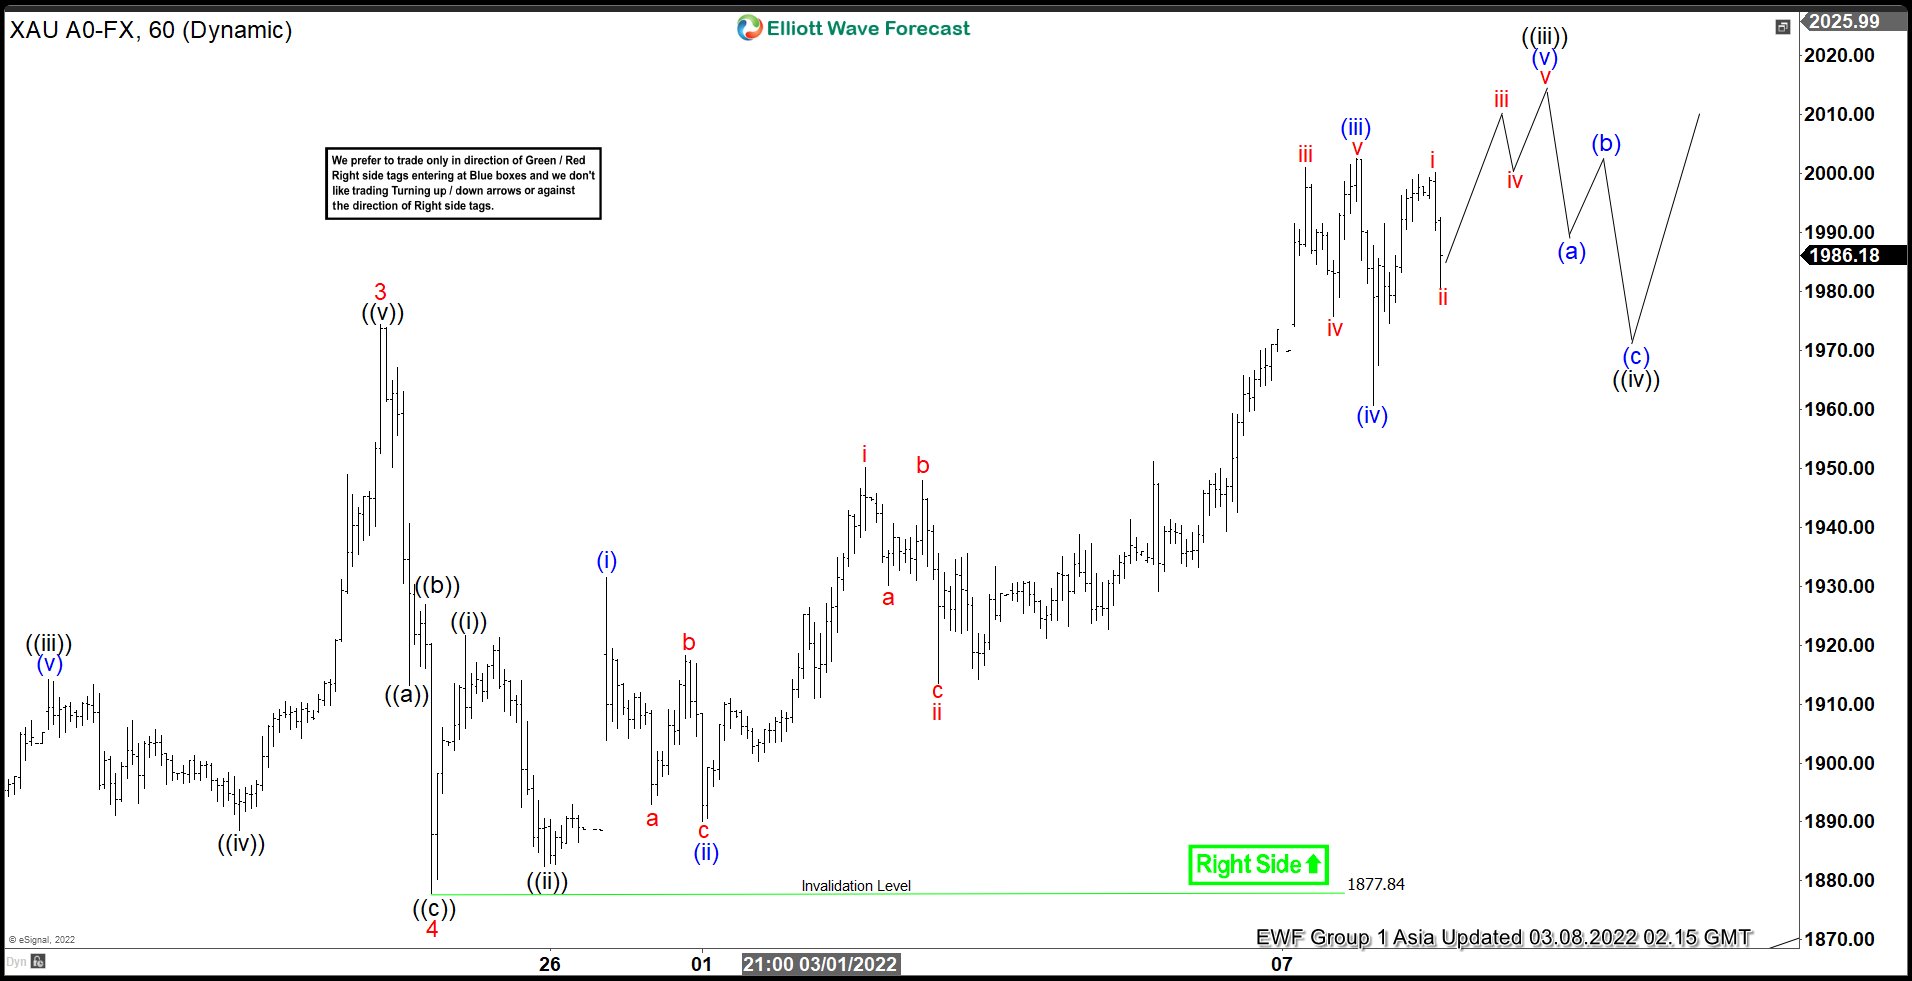
Short Term Elliott Wave View in Gold (XAUUSD) suggests that cycle from September 30, 2021 low is unfolding as a 5 waves impulse Elliott Wave structure. Up from September 30 low, wave 1 ended at 1877.15 and pullback in wave 2 ended at 1753.10. The metal then rallied higher in wave 3 towards 1974.40 and dips in wave 4 ended at 1877.84. Wave 5 higher is currently in progress with subdivision as another impulse in lesser degree.
Up from wave 4, wave ((i)) ended at 1921.59 and pullback in wave ((ii)) ended at 1882.50. Wave ((iii)) is nesting with wave (i) ended at 1931.47 and wave (ii) ended at 1890. The yellow metal then resumed higher in wave (iii) which ended at 2002.57, and wave (iv) pullback ended at 1960.70. Expect the yellow metal to extend higher to end wave (v) and this should complete wave ((iii)) in higher degree. Afterwards, it should pullback in wave ((iv)) before the next leg higher in wave ((v)) of 5. Near term, as far as pivot at 1877.84 low stays intact, expect pullback to find support in the sequence of 3, 7, or 11 swing for further upside.
Gold 1 Hour Elliott Wave Chart
GBP/USD is Down But Not Out
War in Ukraine led GBP/USD to sell off for a third consecutive day on Monday. The pair has dropped by c. 3.26% since the conflict in the Ukraine began on 24 September to recently trade near 1.3106. No doubt exists that price could drop even more substantially in coming days, but a key question is whether GBP/USD can withstand falling below, or potentially completely avoid the 1.30065 price region.
If it does, market confidence in GBP/USD could easily be restored as continuation of the August 2020 trend upwards would look more promising. The 1.30065 region is at the bottom of a downward flag pattern, the type associated with a bullish reversal.
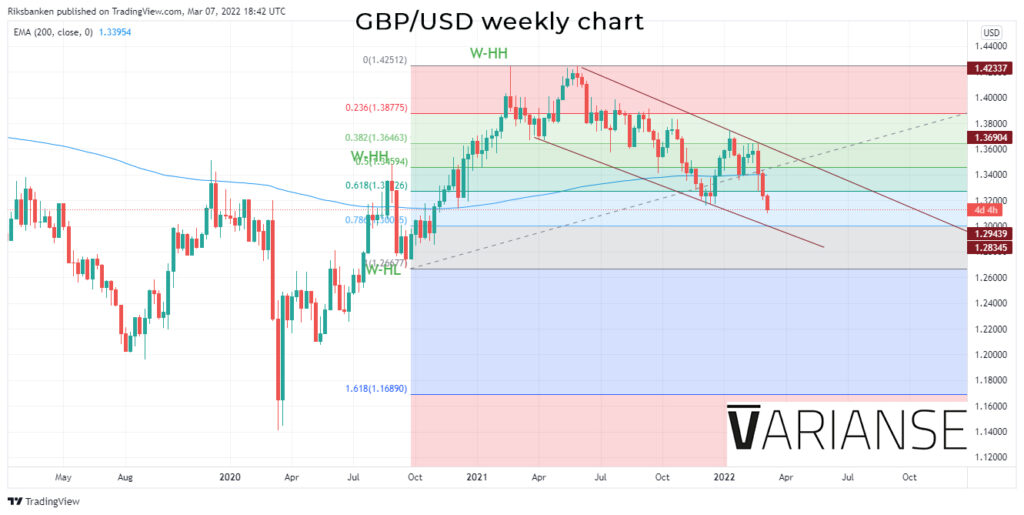
Should GBP/USD fail to hold close to the 1.30065 region, the prospects of a further drop to the 1.2700 region become closer to a reality. Further below, serious support doesn’t appear until the 1.2500 level. Therefore, keep in mind that 1.30065 also acts as an important barometer of future market sentiment. Traders could be swayed on which side GBP/USD ends up.
For the moment, however, the potential for an upside for GBP/USD should give traders food for though that at some point the market will view GBP/USD as cheap and price isn’t all that far away from a potential level. That is certainly different than having no hope of a respite in recent selling.
Eco Data 3/8/22
[php_everywhere instance="1"]