Sample Category Title
BoE Tenreyro: Russia invasion will intensify trade shock and inflation
Referring to Russia invasion of Ukraine, BoE MPC member Silvana Tenreyro said yesterday, "recent developments will intensify the terms of trade shock that we were already experiencing, so will push up inflation and have a negative impact on activity. How exactly? That's the job we will start next week."
Tenreyro added that she had been surprised by the scale of wages growth. However, "when you are talking about spirals, you are talking about explosive dynamics which we haven't seen yet. If anything, we are just starting the first round, so how can you talk about second round (effects)" she said.
Gold Price Rally Could Extend Above $1,950
Key Highlights
- Gold price rallied above the $1,920 and $1,950 resistance levels.
- A major bullish trend line is forming with support near $1,905 on the 4-hours chart.
- EUR/USD extended decline below 1.1120, and GBP/USD retested 1.3280.
- The US ISM Services Index could increase from 59.9 to 61.0 in Feb 2022.
Gold Price Technical Analysis
Gold price started a major increase after it broke the $1,900 resistance against the US Dollar. The price even cleared the $1,920 level to move into a positive zone.
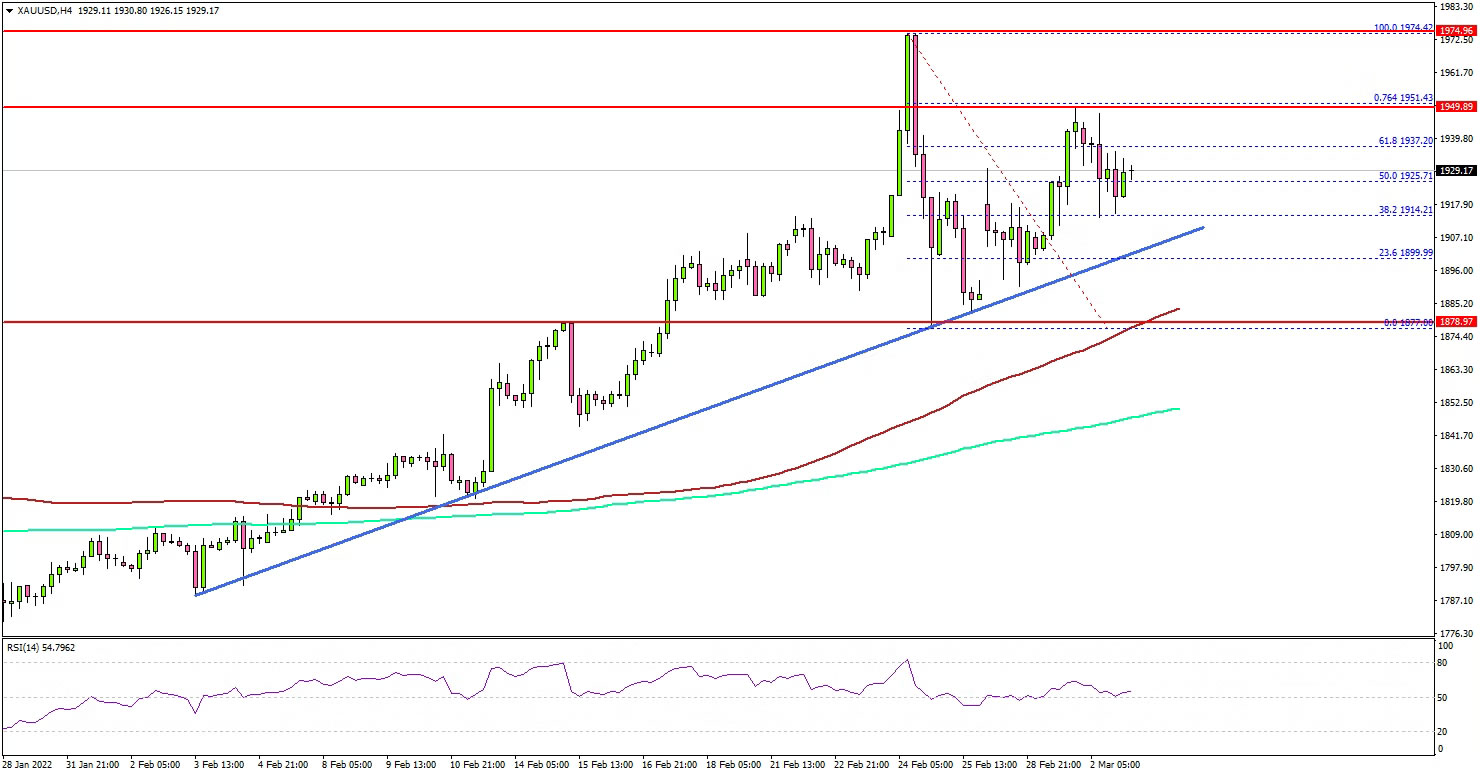
The 4-hours chart of XAU/USD indicates that the price surpassed the $1,950 level. It traded as high as $1,974, and settled above the 100 simple moving average (red, 4-hours) and the 200 simple moving average (green, 4-hours).
Recently, there was a downside correction, but the price was stable above $1,880. It is now back above $1,900 and consolidating.
On the upside, the $1,950 zone is a key breakout zone. A close above $1,950 might set the pace for a move to $1,975. The next major stop for the bulls might be $2,000.
If not, the price might correct lower and trade below the $1,905 level. There is also a major bullish trend line forming with support near $1,905 on the same chart. The next major support is near $1,880, below which the price might decline to $1,865.
Fundamentally, the US ADP Employment Change was released yesterday by the Automatic Data Processing, Inc. The market was looking for an increase of 388K.
The actual result was better than the forecast, as the US ADP Employment increased 475K. The last reading was also revised to 509K.
Looking at EUR/USD, the pair is facing an increase in selling pressure and recently there was a move below 1.1120. Similarly, GBP/USD retested the key 1.3280 support zone.
Economic Releases to Watch Today
- Germany’s Services PMI for Feb 2022 - Forecast 56.6, versus 56.6 previous.
- Euro Zone Services PMI for Feb 2022 – Forecast 55.8, versus 55.8 previous.
- UK Services PMI for Feb 2022 – Forecast 60.8, versus 60.8 previous.
- US Services PMI for Feb 2022 – Forecast 57.5, versus 56.7 previous.
- US ISM Services Index for Feb 2022 – Forecast 61.0, versus 59.9 previous.
Elliott Wave View: S&P 500 (SPX) Rally Expected To Fail
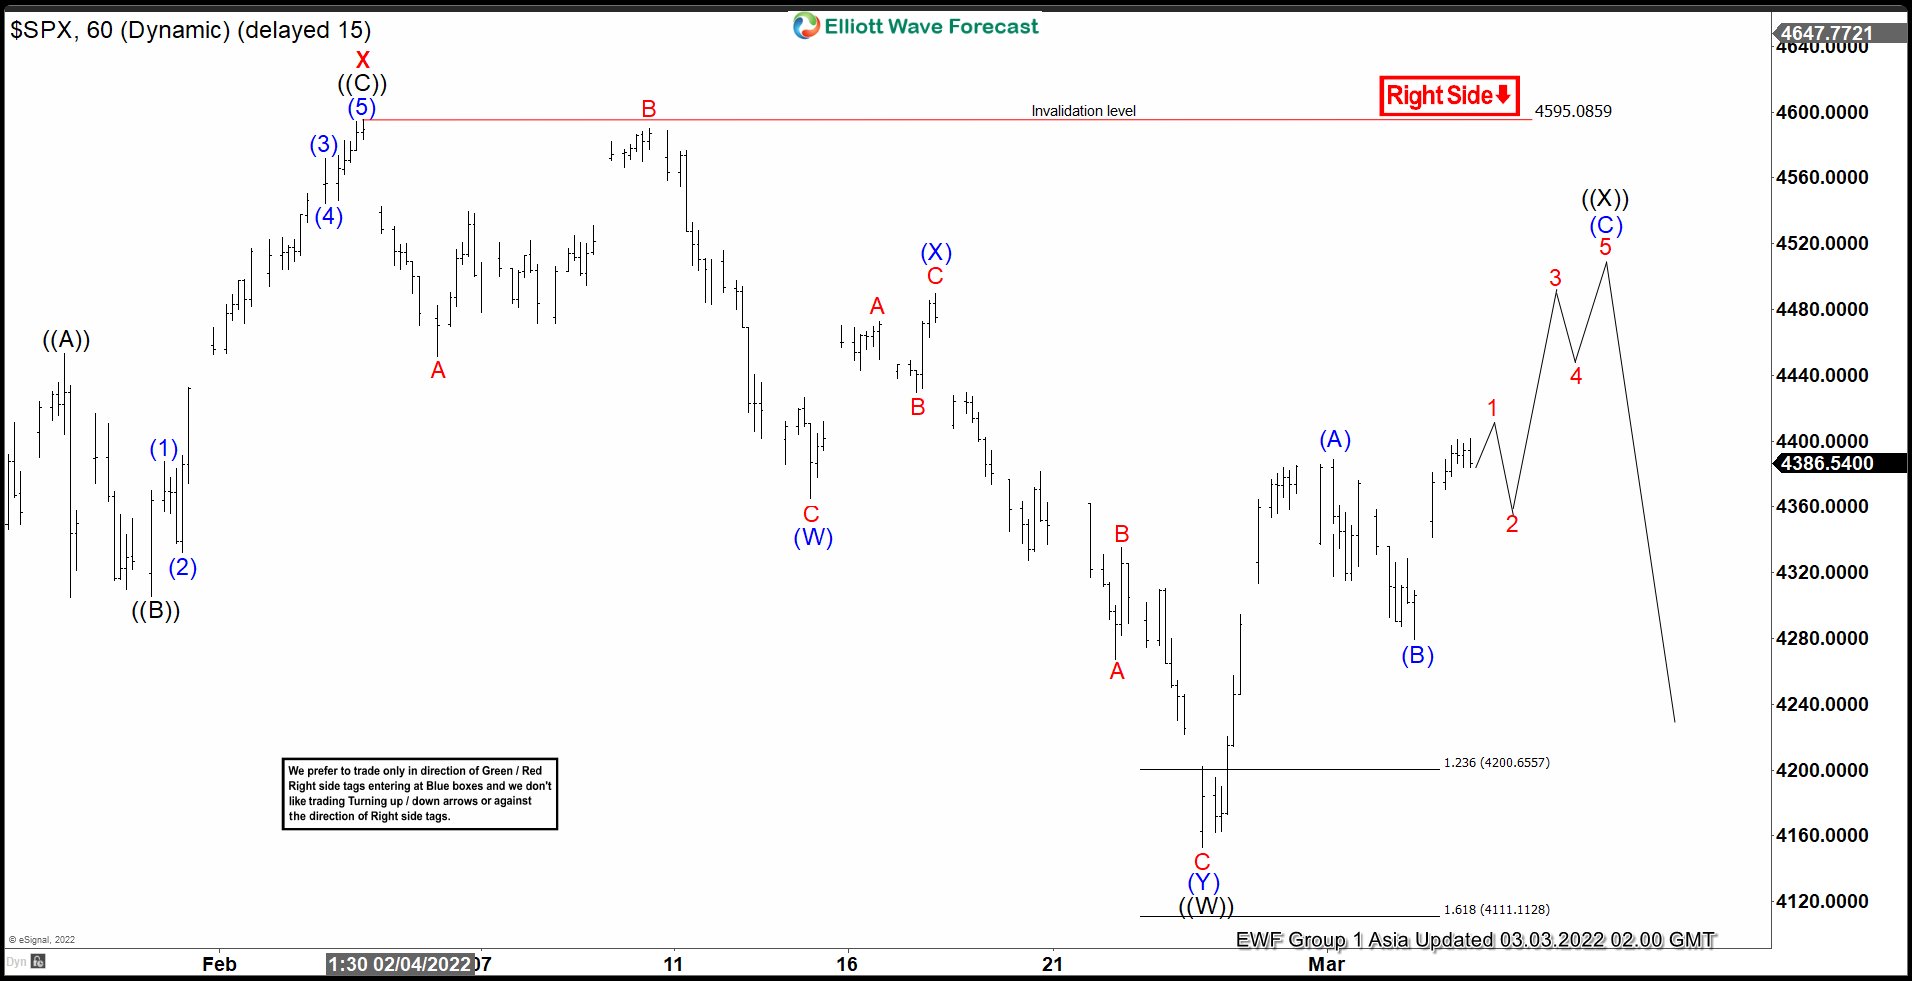
Short Term Elliott Wave View in SPX suggests the decline from January 4, 2022 high is unfolding as a double three Elliott Wave structure. Down from January 4 high, wave w ended at 4222.62 and rally in wave x ended at 4595.31. Index has extended lower and broken below wave w at 4222.62 confirming wave y leg lower has started. Down from wave x, wave ((W)) of y ended at 4153 as a double three structure.
Wave ((Y)) rally is now in progress to correct cycle from February 3 high before the decline resumes. Internal subdivision of wave ((X)) is unfolding as a zigzag Elliott Wave structure where wave (A) ended at 4388.84 and pullback in wave (B) ended at 4279.54. Expect the Index to extend higher in wave (C) with internal subdivision as 5 waves. Afterwards, Index should also end wave ((X)) of y in higher degree and starts turning lower again. Near term, as far as pivot at 4595 high stays intact, expect rally to fail in 3, 7, or 11 swing for further downside. Potential target lower is 100% – 161.8% Fibonacci extension of wave w which comes at 3629 – 3998.
S&P 500 (SPX) 1 Hour Elliott Wave Chart
EUR/JPY – Further Downside to Come?
Or is it due a correction?
It’s been a very volatile start to 2022 and risk aversion has certainly picked up in recent weeks following the Russian invasion of Ukraine.
The shift to safe havens has benefited the usual currencies like the dollar, Swiss franc, and Japanese yen, with the latter making significant gains against the euro.
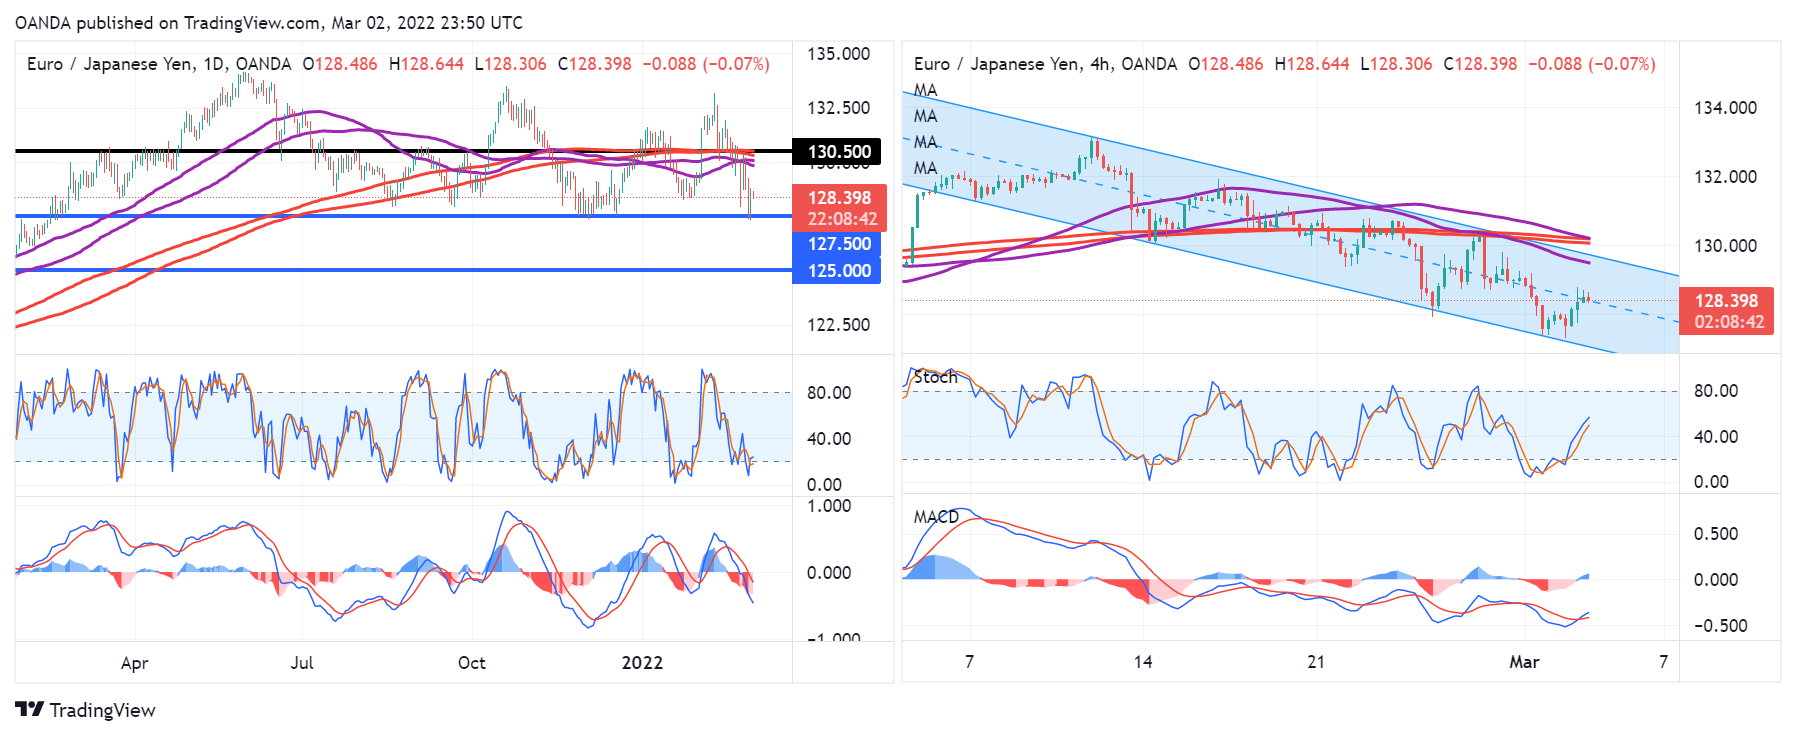
The pair has fallen more than 4% over the last few weeks and despite rebounding a little on Wednesday, looks very vulnerable to a break lower.
And this comes as it is trading around a very important support level, which has proven to be the case multiple times over the last year and was notable prior to that as well.
A break below here could be very significant with 125 being the next major test of support.
As you can see from the 4-hour chart, this would be in keeping with the trend in recent weeks and the momentum indicators don’t suggest that is about to change.
Should divergences form or we see a breakout above the descending channel, we could see a more substantial move to the upside but there’s little to suggest that’s going to happen at the moment.
Of course, this is a very headline-driven market and there’s little to suggest that’s going to change soon.
Eco Data 3/3/22
[php_everywhere instance="1"]
US Dollar Index Outlook: Dollar Continues to Benefit from Risk Aversion
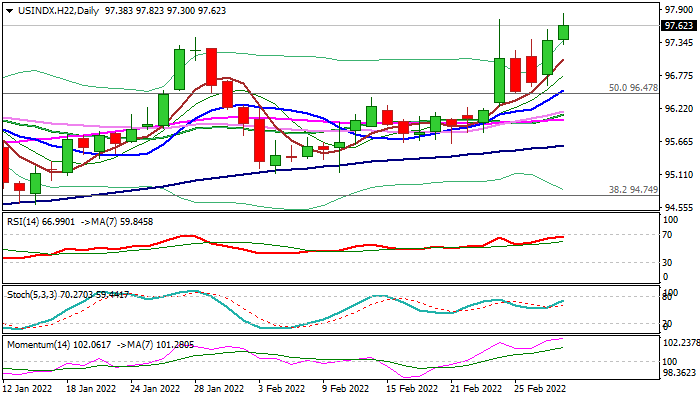
The dollar index remains firm and posted new marginally higher high on Wednesday (97.82, the highest since May 2020) remaining strongly supported by rising uncertainty, as fights in Ukraine extend into seventh day, with no signs of easing and followed by contradicting news, fueling existing risks in global markets.
Also, skyrocketing energy prices, on growing fears that sanctions on Russia would significantly disrupt global energy supply, make investors very cautious.
Fed Chair Jerome Powell, in his remarks to Congress, said the US central bank is now in more difficult position, as sanctions on Russia would slower global economic growth and increase financial stress, but signaled it is still not time to panic.
Such conditions are far from supportive for the Fed’s earlier decision to start tightening its monetary policy as early as March, with strong rise of energy prices being the key component in undermining Fed’s attempts to establish the trend in lifting interest rates and counter raging inflation.
The Fed will join the other global central banks which face the same dilemma in assessing the degree to which the war in Ukraine will damage growth, raise prices and how that might affect their monetary policies.
Res: 97.82; 98.20; 99.31; 100.00.
Sup: 97.30; 96.61; 96.47; 96.15.
Liftoff! BoC Hikes Rate from Lower Bound
- Today’s 25 bp hike was fully expected by analysts
- Near-term inflation will be higher than in January forecast
- “Interest rates will need to rise further”; BoC considering when to start QT
The BoC lifted its policy rate for the first time since 2018, having kept it near zero for nearly two years of the pandemic. The Russian invasion of Ukraine was noted as a major new source of uncertainty, but after a close call not to hike in January, there appeared to be a low bar to raise rates today and recent data easily cleared it. While January’s jobs numbers were disappointing (200,000 jobs lost, unemployment rate +0.5 ppts) the labour market has bounced back quickly from past waves of COVID-19, and falling case counts and easing restrictions suggest the post-Omicron rebound should be equally robust. GDP growth was stronger than expected in Q4 and StatCan’s flash estimate surprisingly suggested the economy didn’t contract in January, lending upside risk to Q1 growth. The bank said recent GDP data “confirms its view that economic slack has been absorbed.” January’s inflation print was in line with the BoC’s forecast but further gains are likely in the near-term given rising food and energy commodity prices related to the Russia-Ukraine conflict.
The BoC will have to weigh additional inflationary pressure brought on by that conflict against two-way domestic impacts (increased revenue for commodity producers, higher prices for consumers) and concerns about the global economic outlook. Central banks would normally look through geopolitically-driven commodity price pressures, but with inflation already so far above target the BoC has said it is more concerned about upside risks to inflation than downside. Indeed, it said “persistently elevated inflation is increasing the risk that longer-run inflation expectations could drift upwards.” In addition to inflation expectations, the bank will be keeping an eye on financial conditions. Government bond yields have fallen amid growth concerns and rising risk aversion, but corporate credit spreads have widened. Other financial channels have been fairly steady—the Canadian dollar has been in a tight range over the past month and the TSX has held up well relative to other equity markets. At this early stage, we don’t think geopolitical developments preclude a follow-up hike in April, nor do they argue for the more aggressive tightening path that markets continue to price.
Consistent with previous guidance, the BoC said it will “be considering when to end the reinvestment phase and allow its holdings of Government of Canada bonds to begin to shrink.” We’ve yet to see a topic for Governor Macklem’s economic progress report tomorrow but think he could use the speech to provide more details on what QT will look like—whether the BoC plans to gradually phase out reinvestment or immediately shift to a smaller share of primary market purchases. Those detail could be followed by an actual QT announcement as soon as April’s meeting depending on how financial conditions evolve in the interim. We’ll of course also be looking for any comments on how the Russia-Ukraine conflict will impact Canada’s economy and the path for monetary policy.
BoC Hikes Policy Rate by 0.25 Percentage Points
As widely expected, the Bank of Canada raised the overnight rate to 0.5%. It also stated that it will continue the reinvestment phase of its balance sheet by maintaining its holdings of Government of Canada bonds.
On the economic outlook, the Bank noted that "economic growth in Canada was very strong in the fourth quarter of last year at 6.7%. This is stronger than the Bank’s projection and confirms its view that economic slack has been absorbed."
On inflation, it stated that "inflation is now expected to be higher in the near term than projected in January. Persistently elevated inflation is increasing the risk that longer-run inflation expectations could drift upwards."
Regarding the impact of geopolitical risks, the BoC stated, "the unprovoked invasion of Ukraine by Russia is a major new source of uncertainty. Prices for oil and other commodities have risen sharply. This will add to inflation around the world, and negative impacts on confidence and new supply disruptions could weigh on global growth. Financial market volatility has increased."
Key Implications
It finally happened. The BoC has lifted its policy rate, likely setting in motion a series of interest rate hikes over the next several months. With employment likely to show a strong rebound next week and inflation continuing to ratchet higher, the need for higher rates is self-evident. See our recent Dollars & Sense for more details on the outlook for rates.
The Bank of Canada's policy path isn't set in stone. The Russia/Ukraine conflict is causing financial conditions to tighten. Should the spillover become more entrenched, further tightening may need to be reassessed.
Financial markets are improving today, with North American equity markets rebounding and yields rising. The Canada 2-year and 10-year yields are up 7 basis points and 4 basis points, to 1.4% and 1.75%, respectively. With the BoC confirming the likelihood of further rate hikes, the loonie is appreciating towards 79 U.S. cents.
USDCAD Wave Analysis
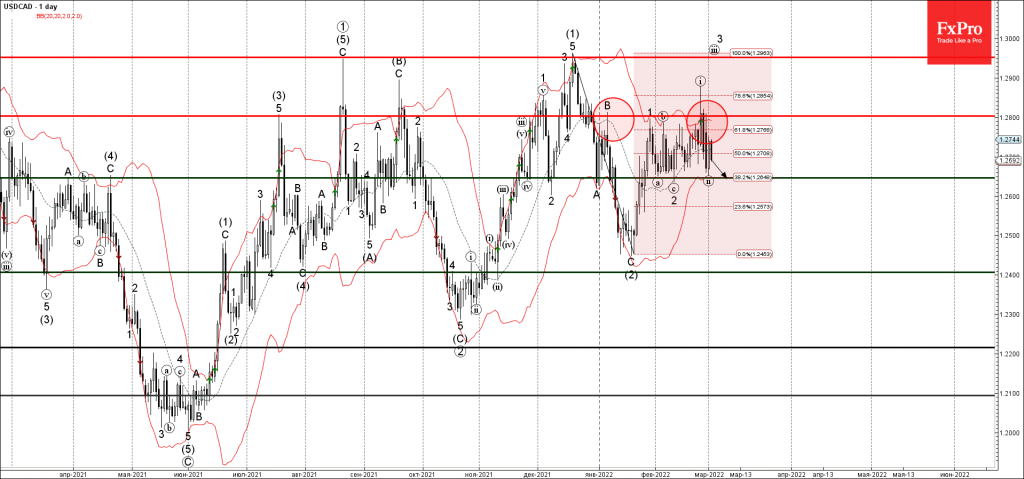
- USDCAD reversed from key resistnace level 1.2800
- Likely to fall to support level 1.2645
USDCAD currency pair recently reversed down from the key resistance level 1.2800 (which has been reversing the pair from the start of January).
The resistance zone near the resistance level 1.2800 was strengthened by the upper daily Bollinger Band and by the 61.8% Fibonacci correction of the previous ABC correction (2) from last December.
Given the strongly bullish CAD sentiment (on oil gains) – USDCAD currency pair can be expected to fall further toward the next support level 1.2645 (which has been reversing the price from the start of February).
WTI Wave Analysis
- WTI broke resistance zone
- Likely to rise to resistance level 110.00
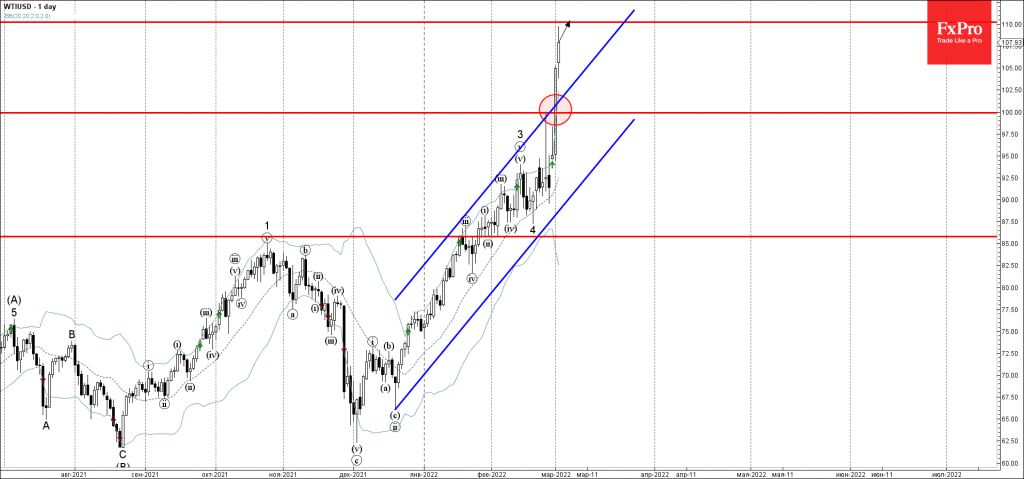
WTI crude oil recently broke the resistance zone lying between the powerful round resistance level 100.00 and the resistance trendline of of the daily up channel from the middle of December.
The breakout of this resistance zone accelerated the active short-term impulse wave 5 of the higher order impulse wave (3) from last year.
Given the overriding daily uptrend – WTI crude oil can be expected to rise further toward the next resistance level 110.00.