

Sample Category Title
AUDUSD Completes Double Bottom Formation; 200-SMA Next in Focus
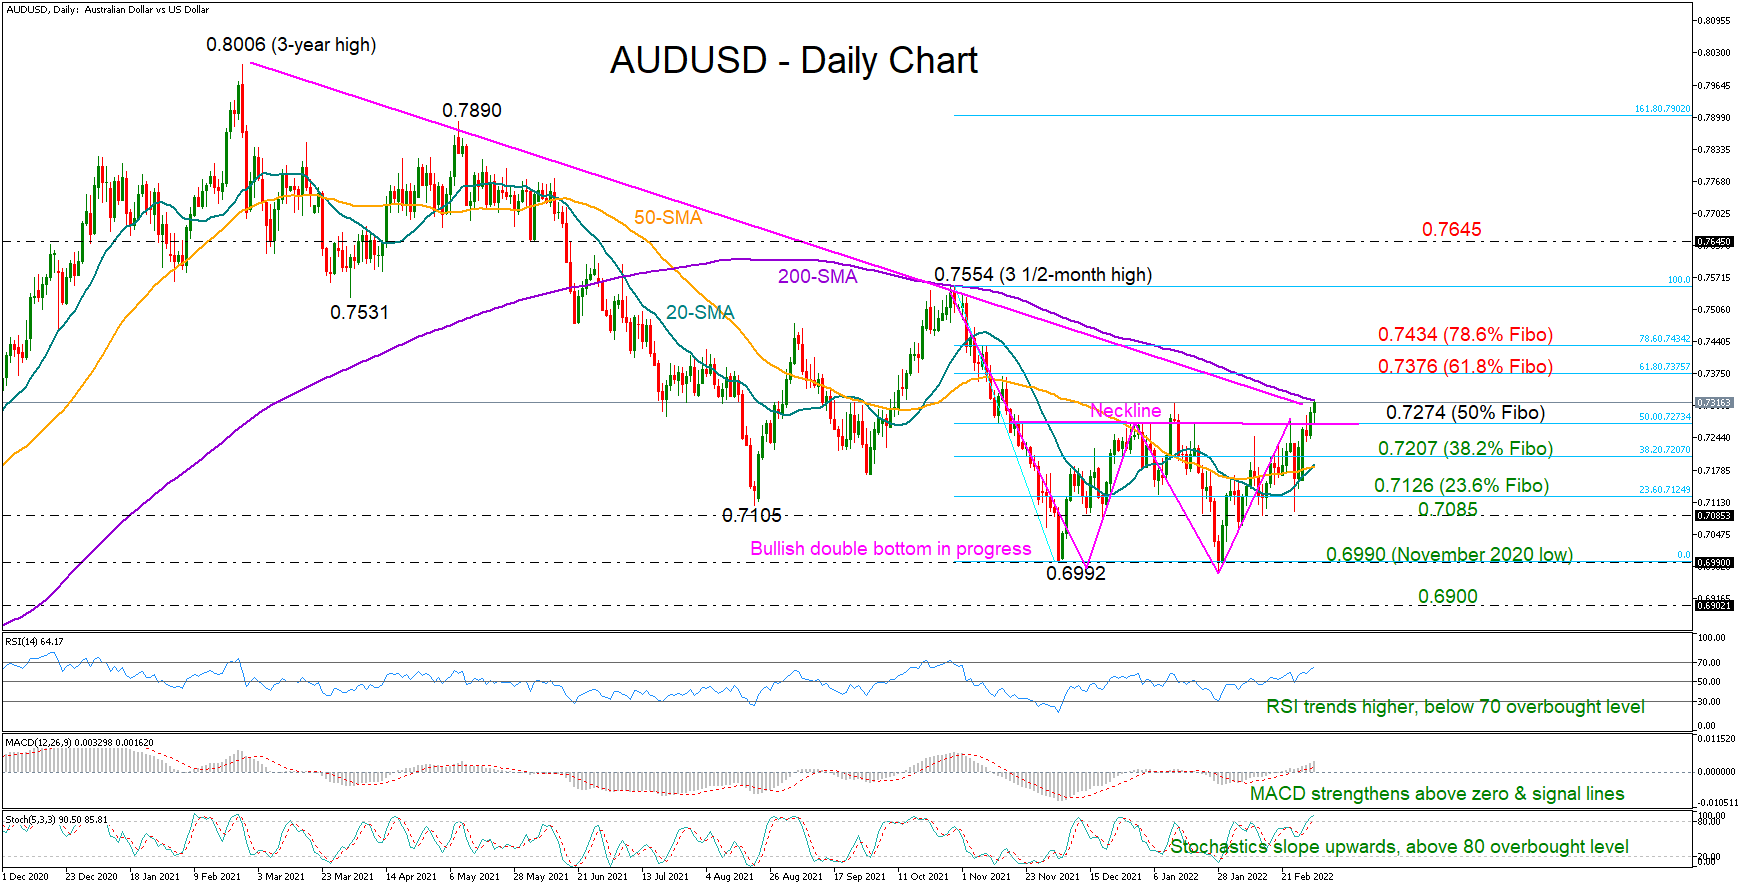
AUDUSD closed above the neckline of the bullish double bottom formation at 0.7274 on Wednesday, and while the price keeps ascending within the 0.7300 territory today, the 200-day simple moving average (SMA) overhead at 0.7320 could still ruin the latest progress in the market as it did in October.
Overbought conditions have not been confirmed yet as the rising RSI is still some distance away 70, while the Stochastics have just crossed above 80 and continue to strengthen. The MACD, which has overcome its previous highs and faces no major resistance levels in sight, is also reflecting a bullish bias for the market. Hence, the base scenario is for the pair to keep gaining ground in the short term.
Should the 200-day SMA give way, the pair could head for the 61.8% Fibonacci retracement of the 0.7554 – 0.6992 downleg at 0.7376. Then, a move beyond the 78.6% Fibonacci of 0.7434 could open the door for October’s high of 0.7554. Further improvement from here would upgrade the medium-term picture from neutral to bullish, shifting the spotlight to 0.7645.
In the bearish scenario, where the price retreats below the 0.7274 neckline, which coincides with the 50% Fibonacci, support could initially come from the 38.2% Fibonacci of 0.7207 and the 20-day SMA. The 23.6% Fibonacci of 0.7126 and the 0.7085 zone could next come to the rescue if selling pressures persist, while lower, the bears may attempt to resume the downward pattern off the three-year high of 0.8006 below the 0.6992 bottom.
Summarizing, AUDUSD has completed a bullish trend pattern above 0.7274, but a sustainable extension above the 200-day SMA is also required before the bulls claim victory.
WTI Futures Fly Sharply above 115.00; Which Level is Next?
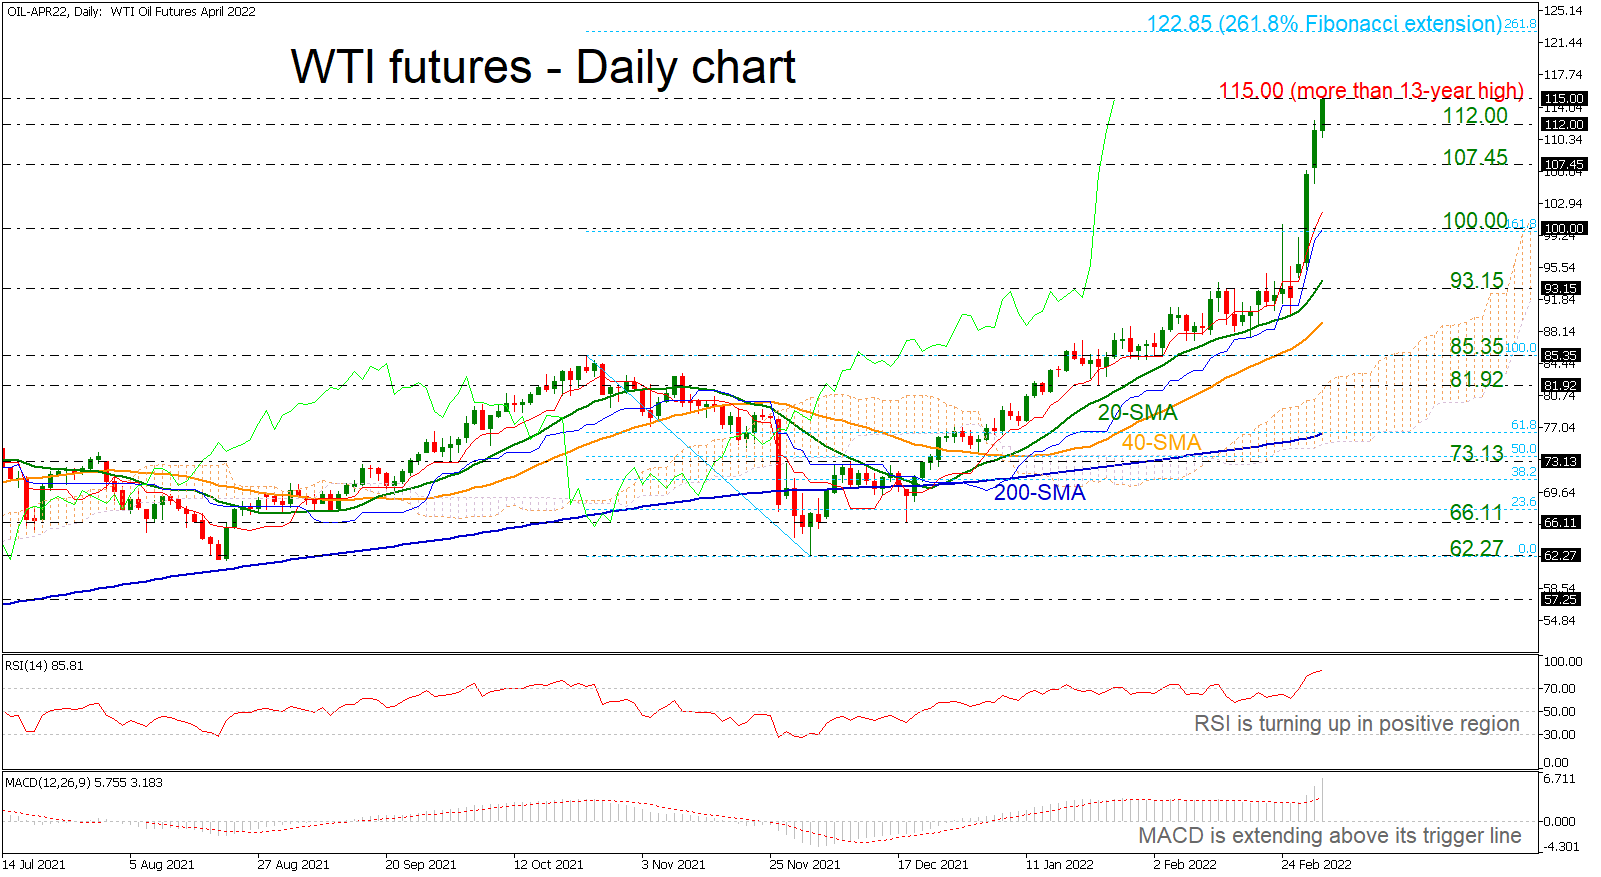
WTI futures are surging with strong momentum towards a fresh more than 13-year high near 115.00. The price recorded two consecutive impressive bullish days, sending the technical indicators into overbought regions. The RSI is holding above its 70 level, while the MACD is strengthening its movement above its trigger and zero lines, both suggesting that the strong upward move may soon come to an end.
If the price retreats and creates a bearish correction, immediate support levels could come from the 112.00 inside swing high from August 2013 ahead of the 107.45 barrier, taken from the peaks in June 2014. Steeper declines may send the market beneath the 100.00 round number, testing the 20-day simple moving average (SMA) at 93.15.
However, in case traders continue to buy oil, the next crucial resistance may come from the 261.8% Fibonacci of the down leg from 85.35 to 62.27 at 122.85. More aggressive advances could open the way for an extension until the 147.00 top, registered in July 2008.
To conclude, WTI futures have been in an impressive rally over the last few days and only a return below the 100.00 may switch the outlook to a negative correction.
Short Bets Against Energy Stocks Increases Risk of Short Squeeze as Oil Rallies, Bitcoin Falls
The possibility of another round of discussion between Russia and Ukraine and Jerome Powell’s more dovish than expected testimony saved the day for equity investors yesterday.
At his testimony before the US policymakers, Powell said he would back a 25-bp hike in the FOMC’s March meeting instead of a 50-bp increase, giving a clear response regarding how the Federal Reserve (Fed) would position itself facing the Ukrainian war, and the prospects of a faster rise in inflation in the coming months – given that the war boosts the energy and commodity prices.
But, as fighting inflation is the top priority of the Fed this year, Powell didn’t/couldn’t rule out the possibility of a larger move later this year, if ‘inflation comes in higher, or is more persistently high’. The higher and the more persistently higher inflation will unfortunately become the new global reality and a headache for many central banks, as they won’t be able to raise the rates sufficiently if the war take a severe toll on the economic recovery, while boosting inflation.
Anyway, the March meeting will likely bring a 25bp hike in the US and equity investors are happy about it.
Nasdaq: death cross formation
The S&P500 rallied 1.86%, while Nasdaq gained 1.62% on Wednesday, but the 50-DMA finally crossed below the 200-DMA confirming a long awaited death cross formation on Nasdaq’s daily chart.
Will we see Nasdaq fall like a castle of cards just because there is a death cross formation? No. But it could add an additional layer of bearishness to this market, on top of the prospects of higher interest rates, worsening supply chain crisis due Covid and the war, and lacking parts that the tech companies are already dealing with.
Short bets in energy stocks rise, increasing the risk of a short squeeze
According to S&P Global Market Intelligence, the short interest against the energy stocks has peaked to the highest levels in more than a year, as the latest rally in global energy stocks ‘may be petering out, even with oil prices surging to their highest levels since 2014’.
Yes, but oil prices will certainly continue their journey to the north making the oil companies more profitable in the coming quarters. Therefore, the rising short bets also means a rising risk of a short squeeze, where investors who have bet for the prices to fall decide to close their positions - and closing a short position involves buying back the stock, which gives a further positive momentum to a market rally as it has been the case for stocks like GameStop and AMC last year.
That concretely means that, if the rally in the energy stocks take the prices high enough to dissuade the short sellers, the rally could extend higher.
Oil to the moon
US and Brent crude continue their jaw-dropping advance this morning. The barrel of US crude just hit $116 mark, as OPEC didn’t announce any additional increase to its production regime, while the war in Ukraine gets clients to abandon the Russian oil and that increases demand for US and Brent crude.
There is no concrete sanction against Russian oil right now – though the US wants to ban the purchases of Russian oil, but businesses prefer finding other solutions as the risk of a sanction increases parallel to the intensity of war in Ukraine. Plus, divesting and cutting exposure to Russian oil will also make it easier for the West to impose sanctions on Russian oil, if the actual sanctions don’t stop Russia from its aggressive attack.
OPEC, a joke?
OPEC+ decided to maintain its production target unchanged at 400’000 extra barrels per day from April. It’s a joke when you think that the Russian oil, which stands for a about 10% of the global supply is being left out, and the global oil consumption is just a touch below 100 mio barrels per day. So the 400’000 barrels don’t do much to ease the growing headache of lacking supply. But OPEC countries say that the current fundamentals and the outlook for the future points ‘to a well-balanced market’. It’s surreal, yes, but it’s the reality. The only way to solve this problem is to decrease the fossil fuel addiction, and to opt for a faster green transition!
What’s safe, what’s not?
Demand in US dollar remains strong. The US dollar is good safe haven play but it’s more of a last resort safe haven, for those who want to get rid of their positions and stay seated on cash waiting for the turmoil to pass.
Before that, there is the option to stay invested and hedge positions with gold, which also performs well since the beginning of the escalation of the Ukrainian tensions.
Bitcoin, on the other hand, becomes a risky safe haven. Even though the Russian money flows into the coin to avoid the Western sanctions, it becomes clearer that the West won’t let Bitcoin mock them and ease the power of their sanctions, and help financing the war for Russians who otherwise see the value of their currency and assets plummet at quite an unbelievable speed. Russian stocks trading in London lost up to 98% of their value in just two weeks!
The latest news is that the US Department of Justice announced a new task force broadly designed to enforce sanctions, which will also target efforts to use cryptocurrency to evade US sanctions,
Even though the liquidity in the cryptocurrency markets and the case of uses remain very limited compared to what has been pulled away with the traditional financial sanctions, the Ukraine war and the Russian money that flows into digital coins will sure accelerate the regulation of the crypto industry and that’s the biggest risk to the cryptocurrency performances right now. That’s even a higher risk than the tightening Fed.
Oil Price Surge Continues
Market movers today
The key driver for markets is still the ongoing Russian invasion of Ukraine and tough Western sanctions. New talks between Russia and Ukraine today. Markets are likely to stay volatile, as long as no peace is in sight.
Besides that it is a quiet day. We receive final PMI service indices from across the world today. Danish and euro area unemployment data are also due out.
Today we also get the ECB minutes at 13:30 CET from the February meeting. While parts of it is outdated given the war, the discussion around the hawkish pivot, in particular in light of the high January inflation print, will be interesting.
Fed Chair Powell's testimony continues today but we do not expect any significant new information.
The 60 second overview
Powell signals 25bp hike in March: Fed chairman Jerome Powell yesterday said "I am inclined to propose and support a 25bp rate hike" in March but adding that "to the extent inflation comes in higher or is more persistently high than that, the we would be prepared to move more aggressively by raising the federal funds rate by more than 25bp at a meeting or meetings". US 2-year yields rose around 20bp on the back of the comments and equities saw a move higher.
Oil shock continues: Oil prices continues to surge and hit USD118 per barrel Brent for a short while overnight. It currently trades at USD117 per barrel. It is a rise of USD50 compared to six months ago adding to the global supply shock from the war in Ukraine. Natural gas prices also jumped higher and is up more than 50% compared to a month ago. OPEC+ yesterday agreed to a rise in output of 400,000 barrels that was scheduled for April. With Russian oil exports of 5 million barrels per day severely curtailed, the increase is hardly enough to cool oil prices and there's a risk the current oil shortage pushes up prices even further. The rise in energy cost is having spill-over to both metals and food prices contributing to the inflationary shock that is set to erode purchasing power and provide a headwind to consumer demand globally.
Russia/Ukraine war: The second-largest Ukranian city Kharkiv is suffering heavy bombardment while Russian troops were supposedly close to seizing the port city of Kherson in the South (see Reuters). The UN General Assembly denounced Russia over Ukraine invasion in a historic vote. 141 of 193 members voted for the resolution. China abstained saying the resolution did not undergo "full consultations with the whole membership" of the assembly and did not take "full consideration of the history and complexity" of the crisis. India also abstained and has chosen a path much similar to China in the crisis.
China "deplores outbreak of conflict": China is trying to strike a middle ground and is probably the most likely candidate for a mediator in the crisis. It is not clear, though, that they have enough influence over Putin to stop the war. China's foreign minister Wang Yi told his Ukranian counterpart Dmytro Kuleba, China is "extremely concerned" about the harm to civilians in Ukraine, in an indication China is leaning further against Putin's war actions in Ukraine. He also said China "deplores the outbreak of a conflict between Ukraine and Russia". Kuleba also said Ukraine was willing to strengthen communication with China and that it looked forward to China's "mediation for the realization of the ceasefire", according to the statement.
Equities: Equities rose yesterday as sentiment improved during the European and US cash trading session. Gains were broad based with the energy sector once again sticking out as oil price took another big step higher (and continuing this morning). Bond markets saw a huge turnaround from Tuesday with yields sharply higher not least at the short end of the curve. This mix of higher yields and rising optimism benefitting cyclicals and partly the banks. In US, Dow +1.8%, S&P500 +1.9%, Nasdaq +1.6% and Russell 2000 +2.5%. Looking at Asians markets this morning, it could look like any given day outside war with some small gains in Asian while futures in Europe and Russia are basically flat.
FI: European rates had a tough day yesterday as core rates sold off 10bp. The BTPs-Bund spread reversed a large chunk of the tightening from Tuesday, illustrating the very volatile market. Amid the record-high inflation print, we saw inflation linked products perform. We also saw the 10y German real rate touching record low of -2.5% during the day (yet it ended at -2.42%). In particular the 2022 fixings are now well above 6% for the coming half year. The high inflation pressure puts ECB in a tough position during next week's meeting amid the uncertain outlook.
FX: EUR/USD moved sideways around 1.11 yesterday. EUR/CHF dipped temporarily below 1.02 yesterday, as CHF benefits in an environment with elevated geopolitical risk. EUR/GBP is now trading marginally below 0.83. Brent oil is now trading above USD117/barrel. Overall, markets seem to wait for news on where the war is heading and whether the West imposes more sanctions on Russia. Without major news over the past couple of days, things seem quieter right now, but this may change out of a sudden if the war eases/worsens.
Credit: The risk sentiment in synthetic credit indices improved slightly yesterday with iTraxx main some 0.9bp tighter and Xover 14.9bp tighter ending the day at 74.7bp and 362bp, respectively. The signals from actual cash bonds are less benign though with IG slightly wider and HY slightly tighter but both still under extreme illiquidity.
Nordic macro
We get service PMI in Sweden and unemployment figures in Denmark.
Technical Outlook and Review
DXY:
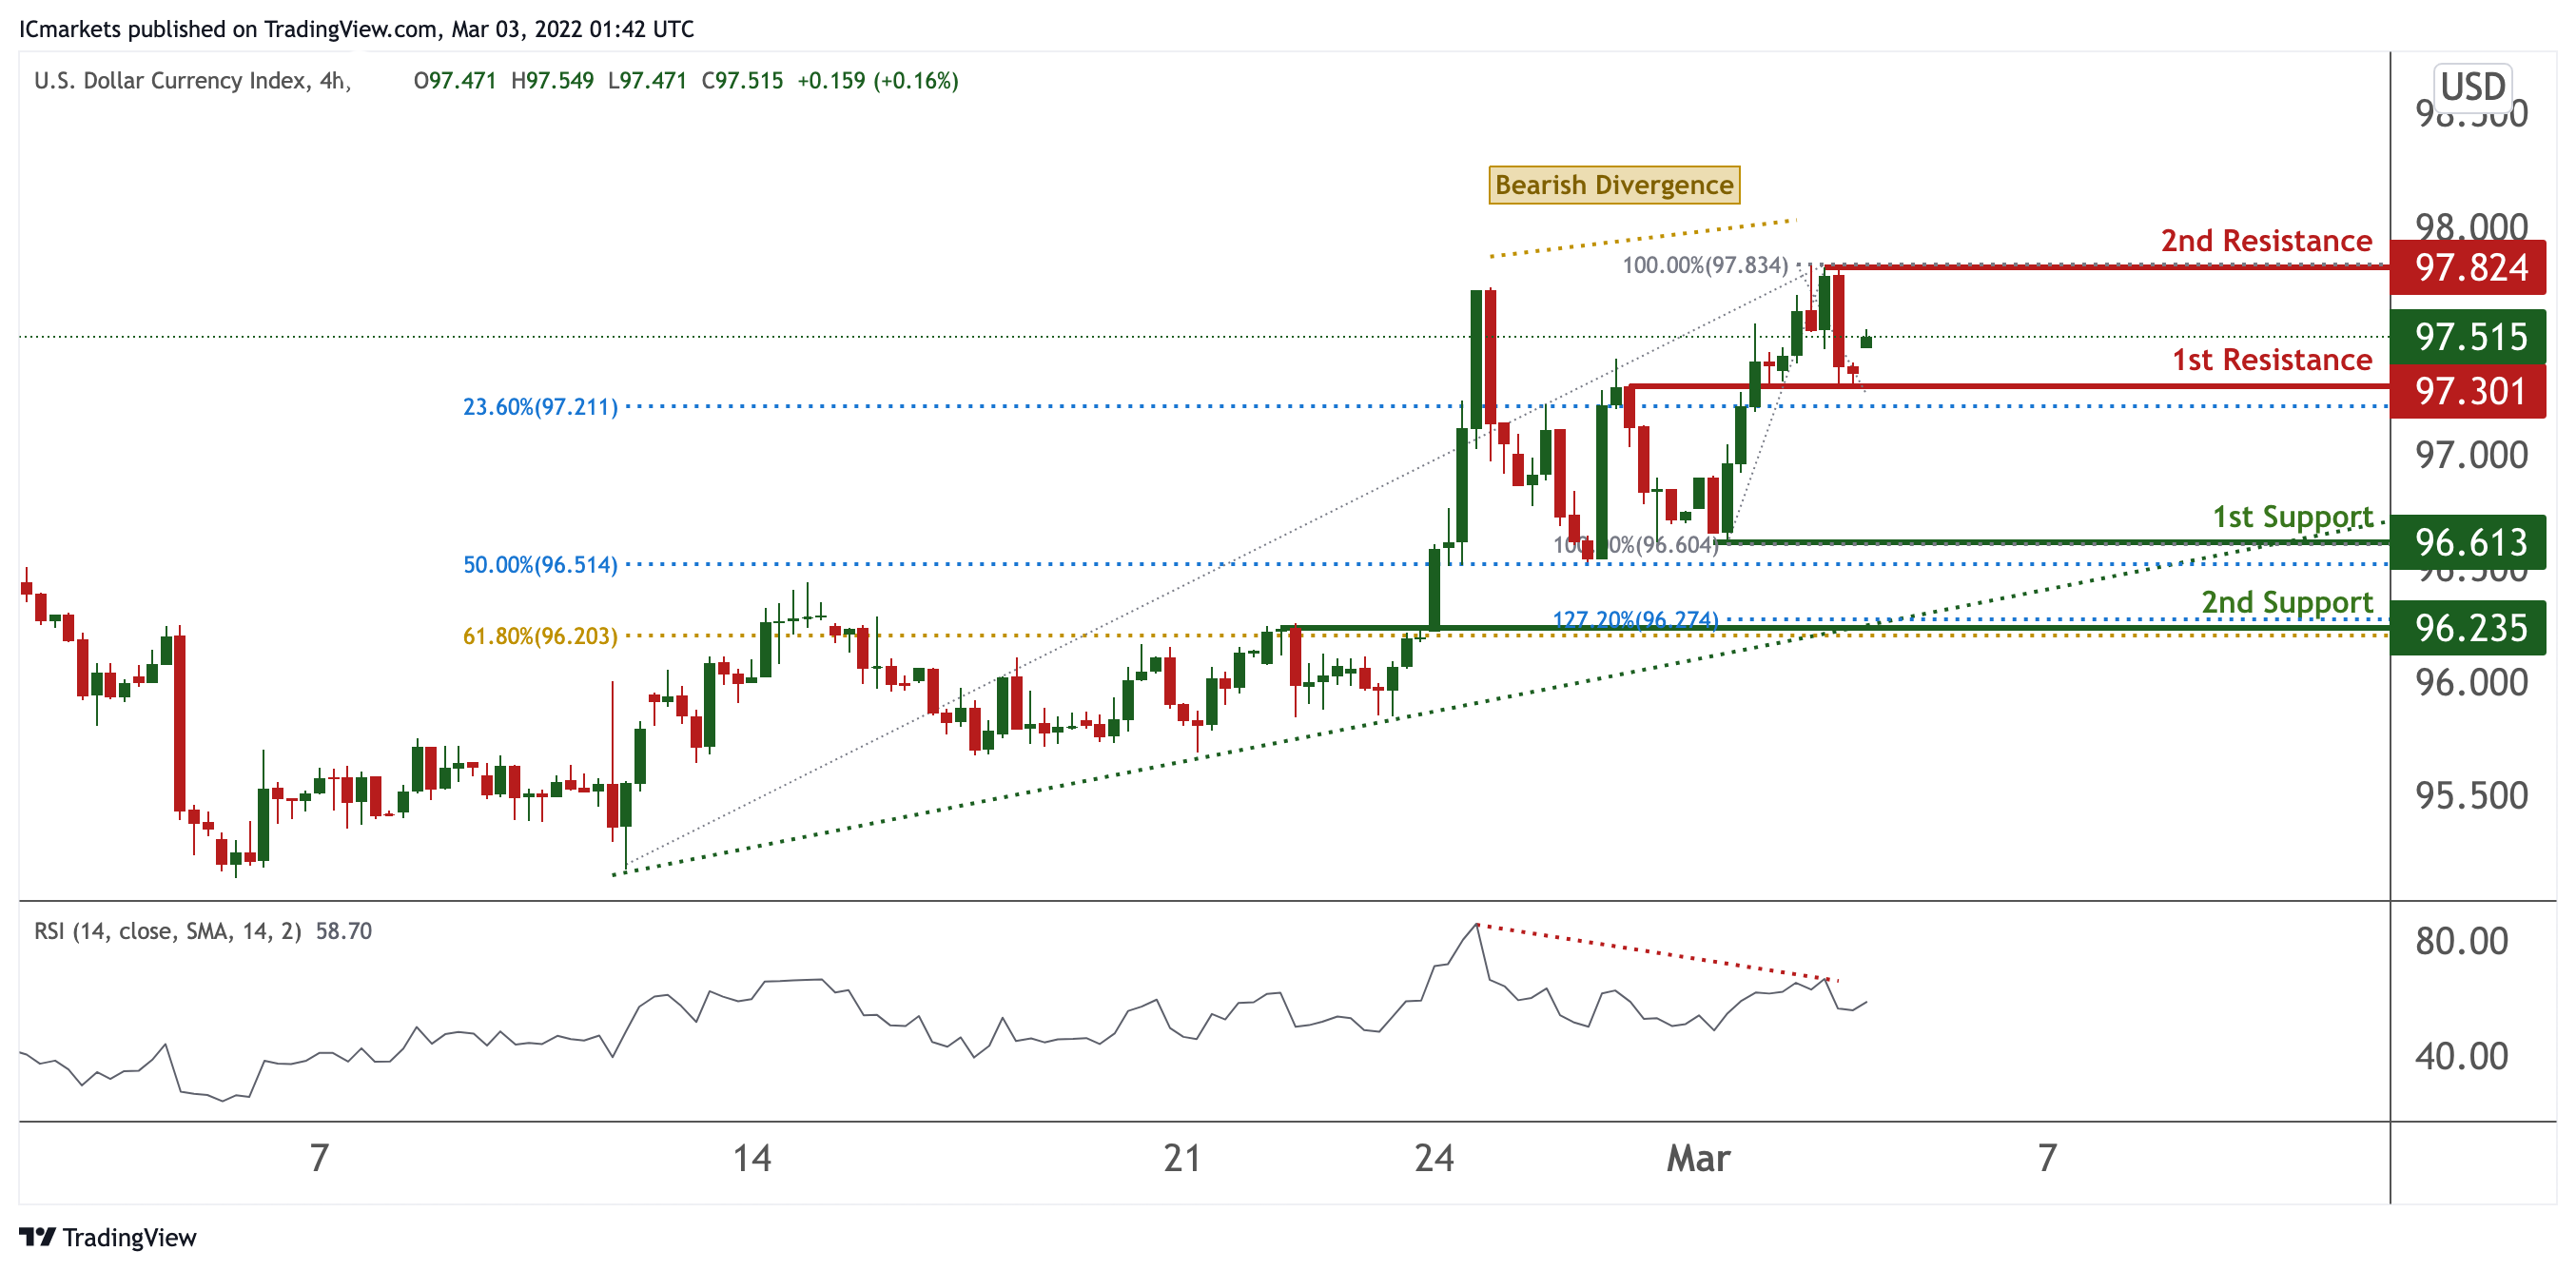
On the H4 timeframe, prices are at pivot and in line with a recent swing high. We see the potential for a dip from our 1st resistance at 97.301 in line with 23.6% Fibonacci retracement towards our 1st support at 96.613 in line with 50% Fibonacci retracement and 100% Fibonacci retracement. Bearish divergence is spotted on RSI, further supporting our bearish bias.
Areas of consideration:
- H4 time frame, 1st resistance at 97.301
- H4 time frame, 1st support at 96.613
XAU/USD (GOLD):
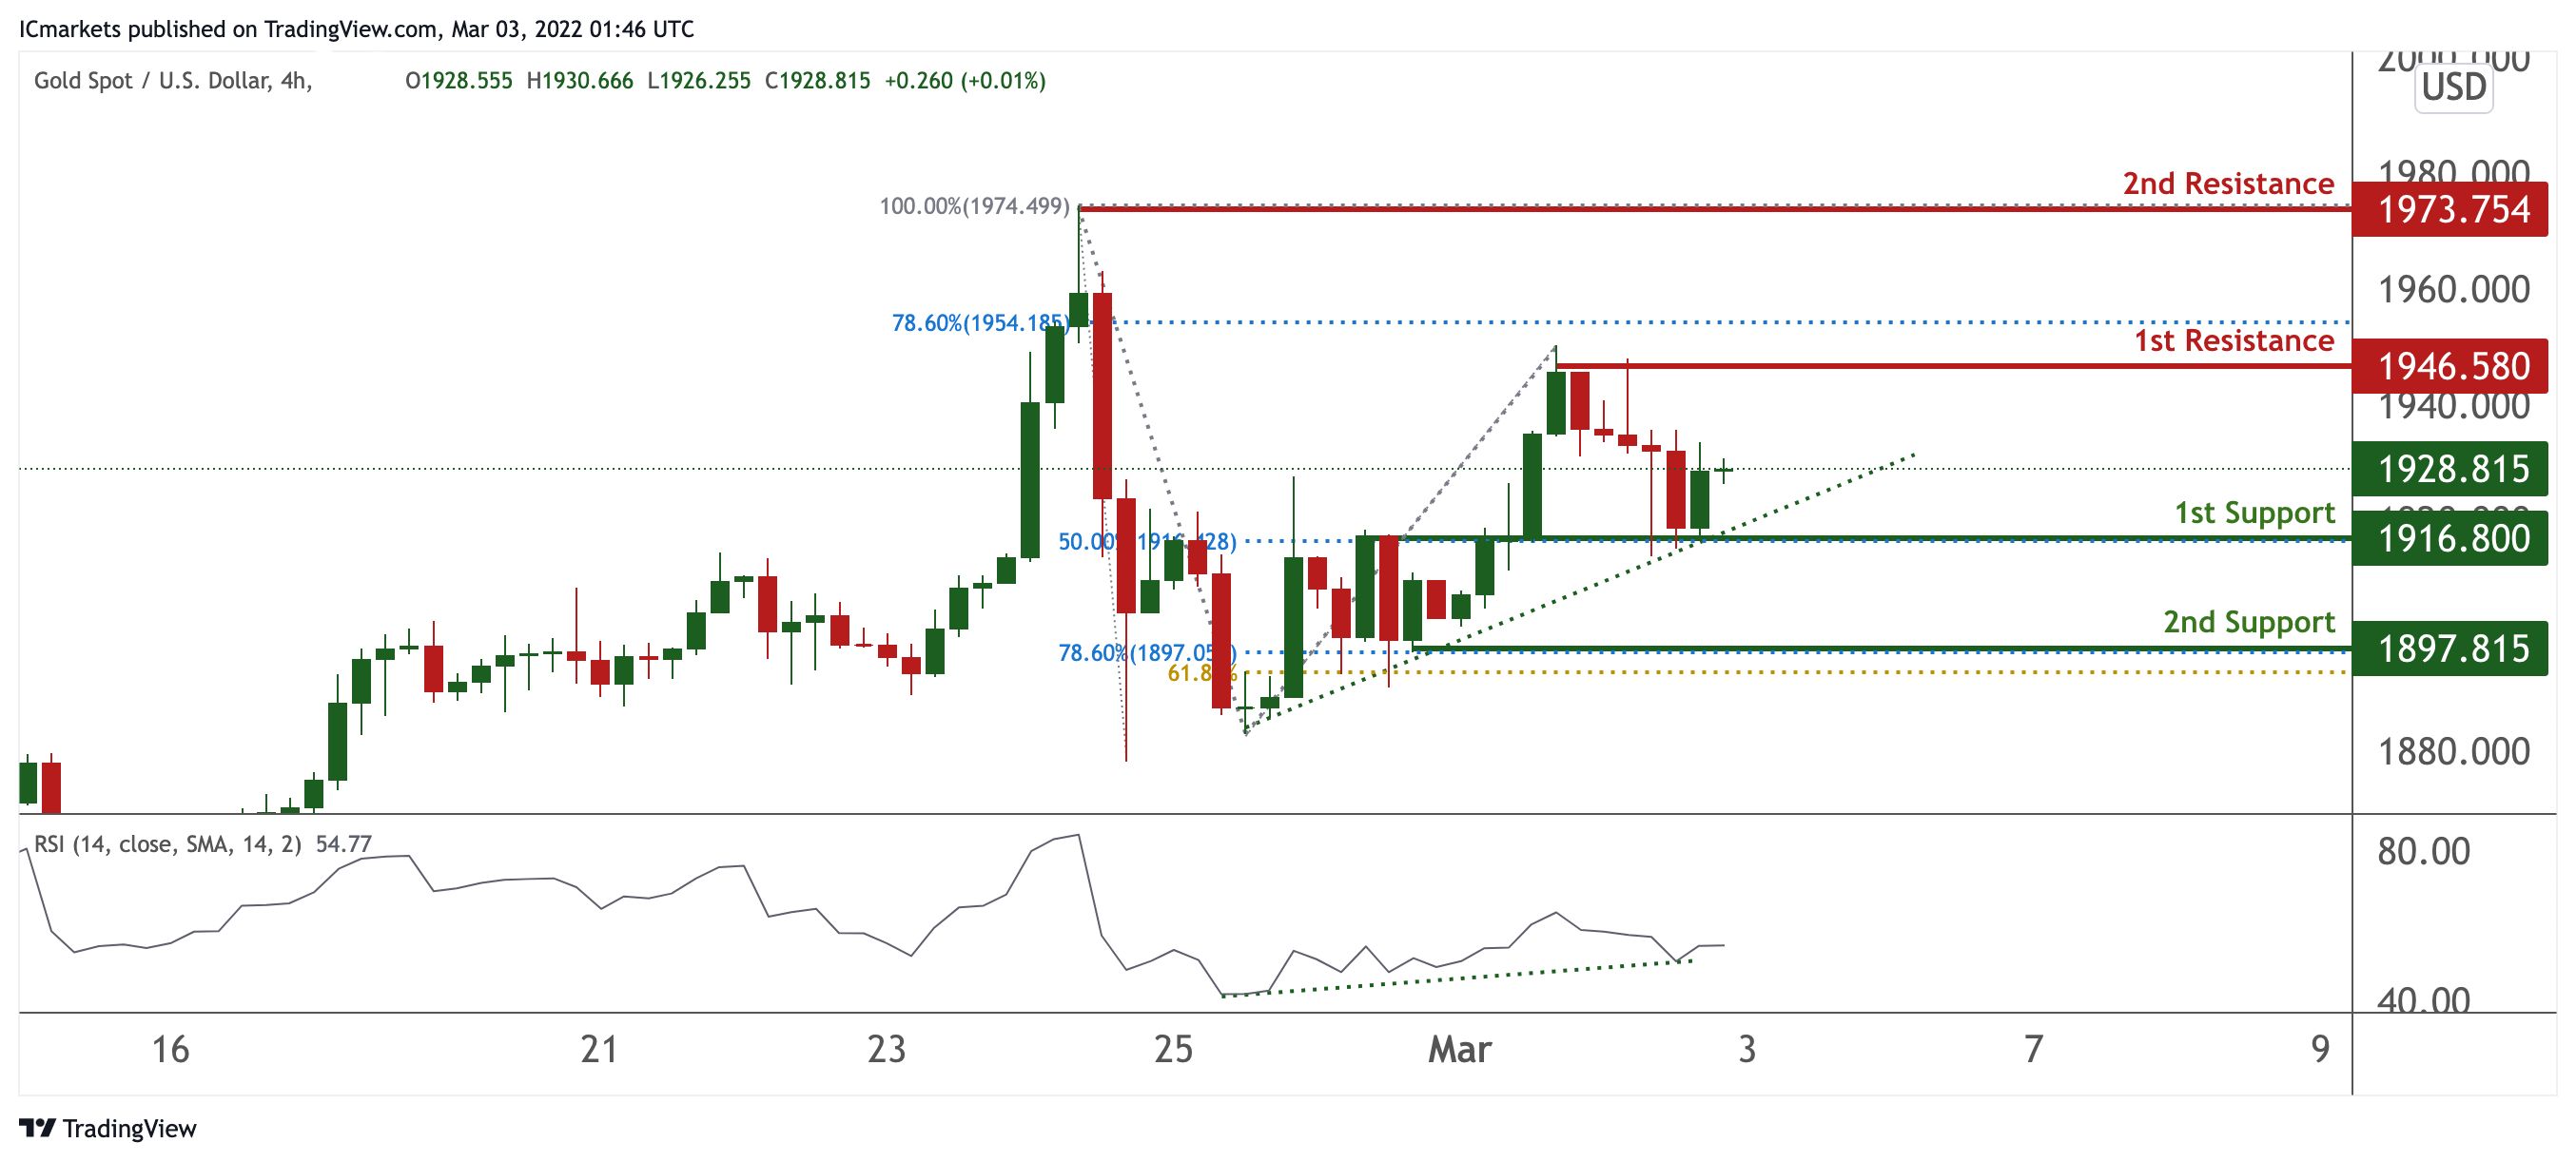
On the H4 chart, prices are on bullish momentum and abiding to our ascending trendline support. We see potential for a bounce from our 1st support at 1916.8 in line with 50% Fibonacci retracement towards our 1st resistance at 1946.580 in line with 78.6% Fibonacci retracement. Our bullish bias is further supported by RSI being on bullish momentum.
Areas of consideration:
- 4h 1st support at 1916.8
- 4h 1st resistance at 1946.580
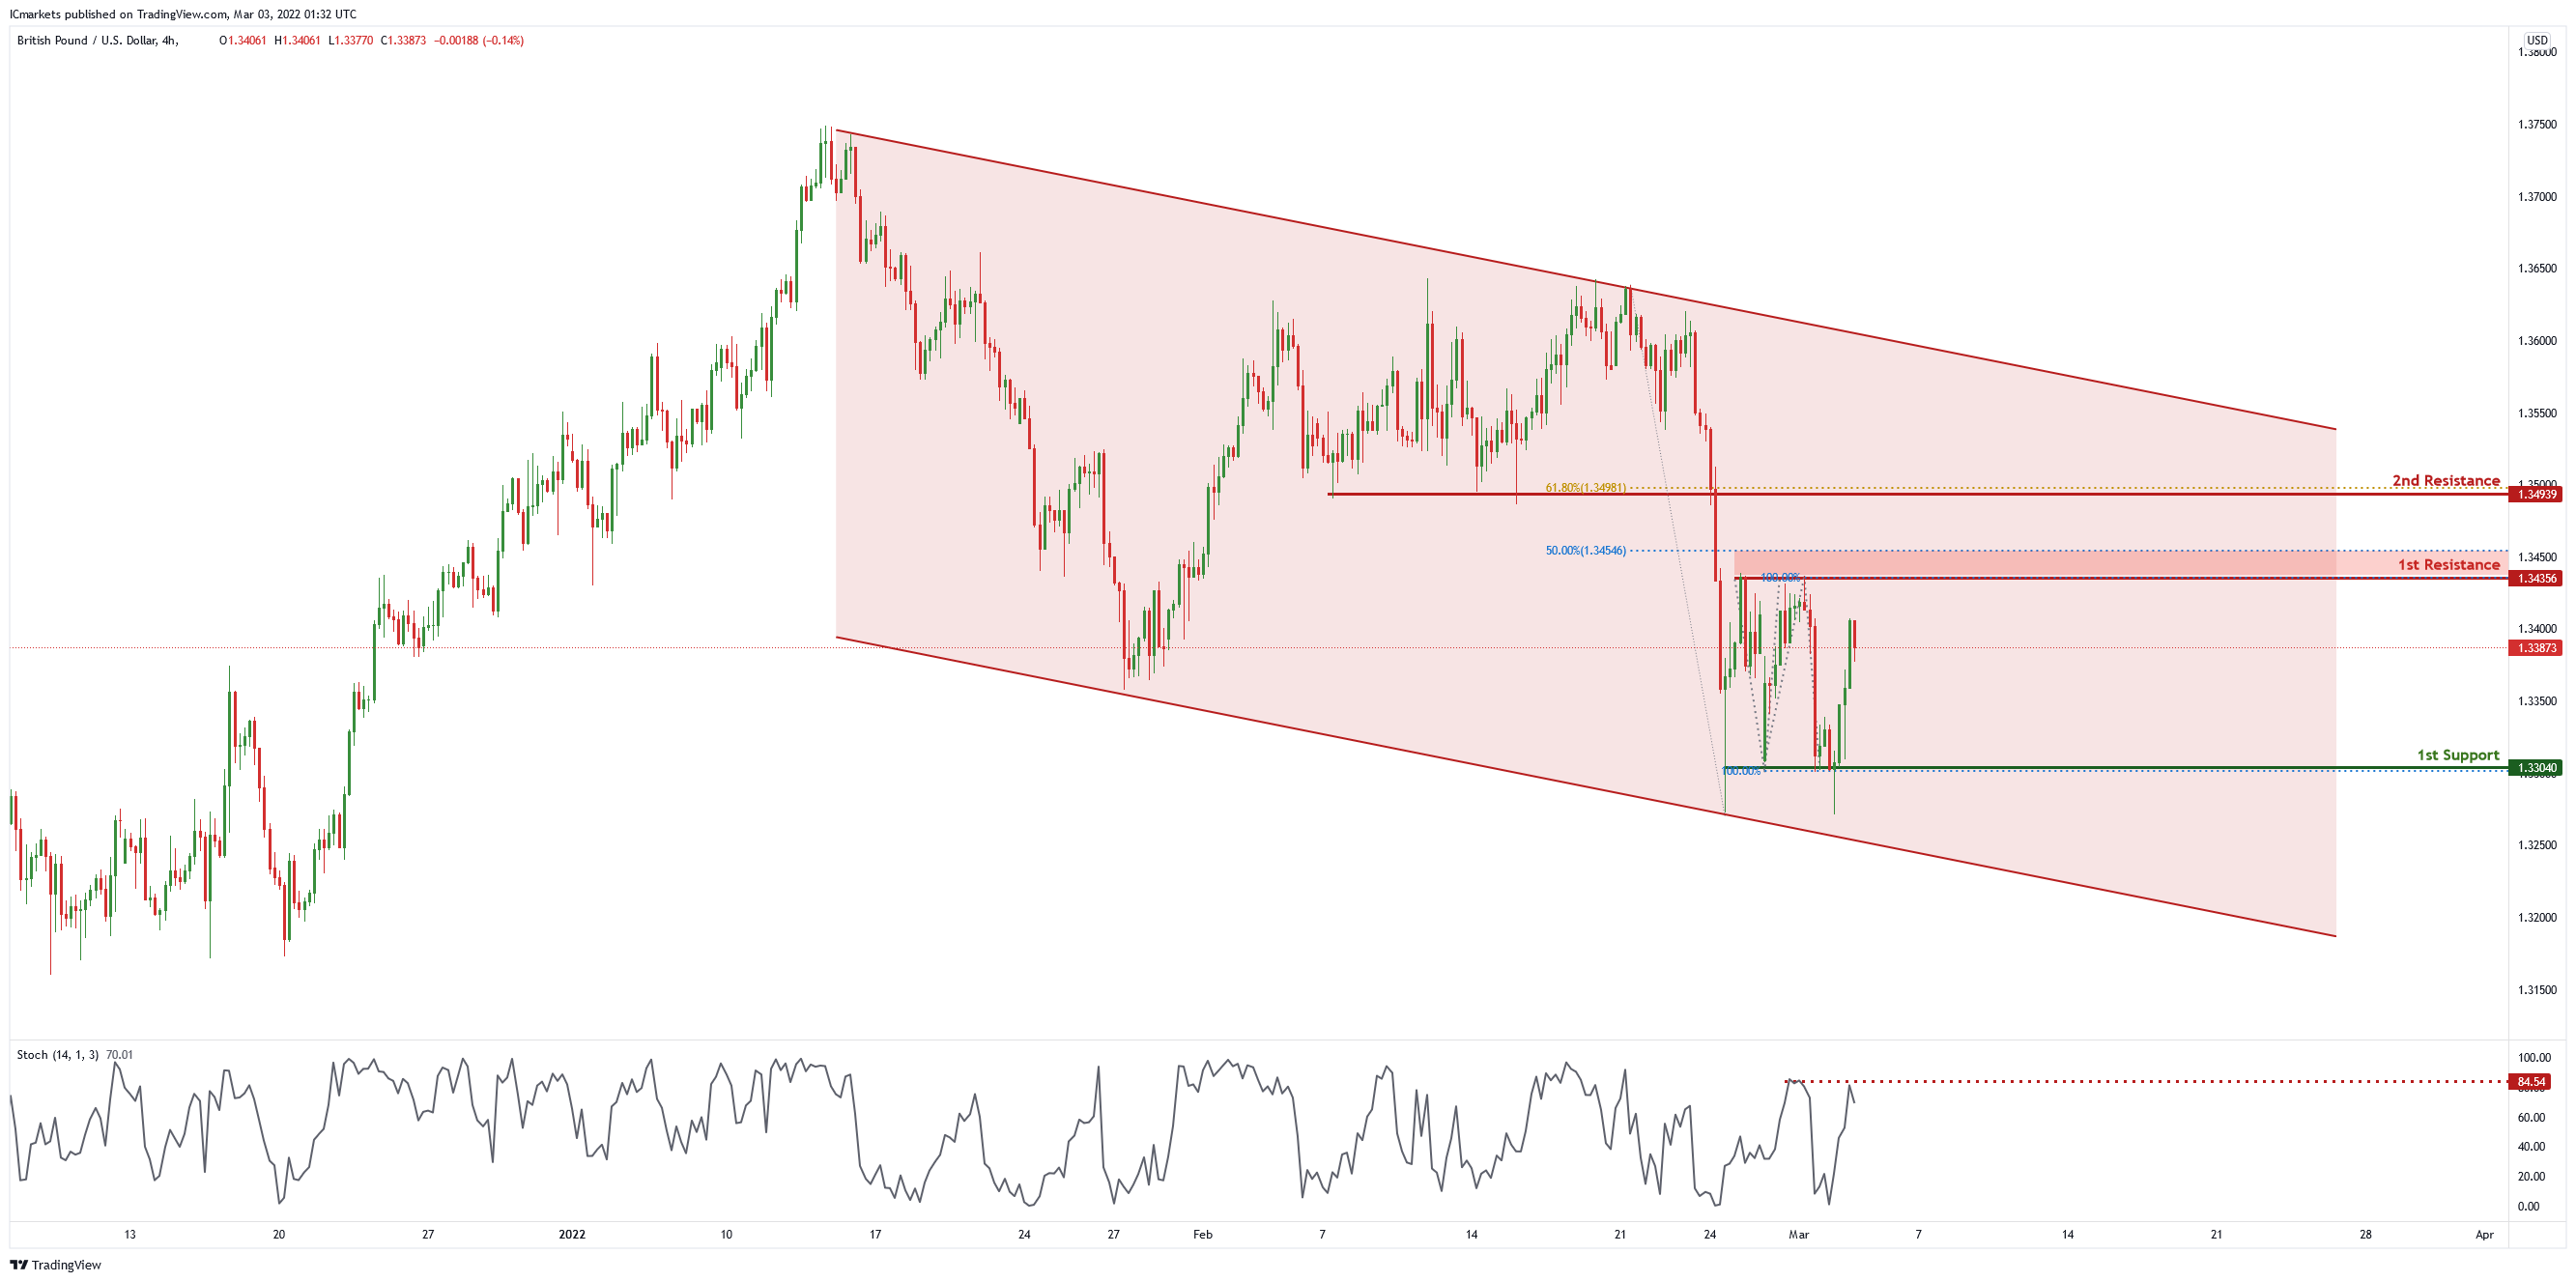
GBP/USD
On the H4 chart , price is trading in a descending channel and near 1st support level of 1.33040 in line with 100% Fibonacci projection. Price can potentially go to the 1st resistance level of 1.34356 in line with 50% Fibonacci retracement and 100% Fibonacci projection. Our bearish bias is supported by the stochastic indicator as it is at resistance level.
Areas of consideration
- H4 1st resistance at 1.34356
- H4 1st support at 1.33040
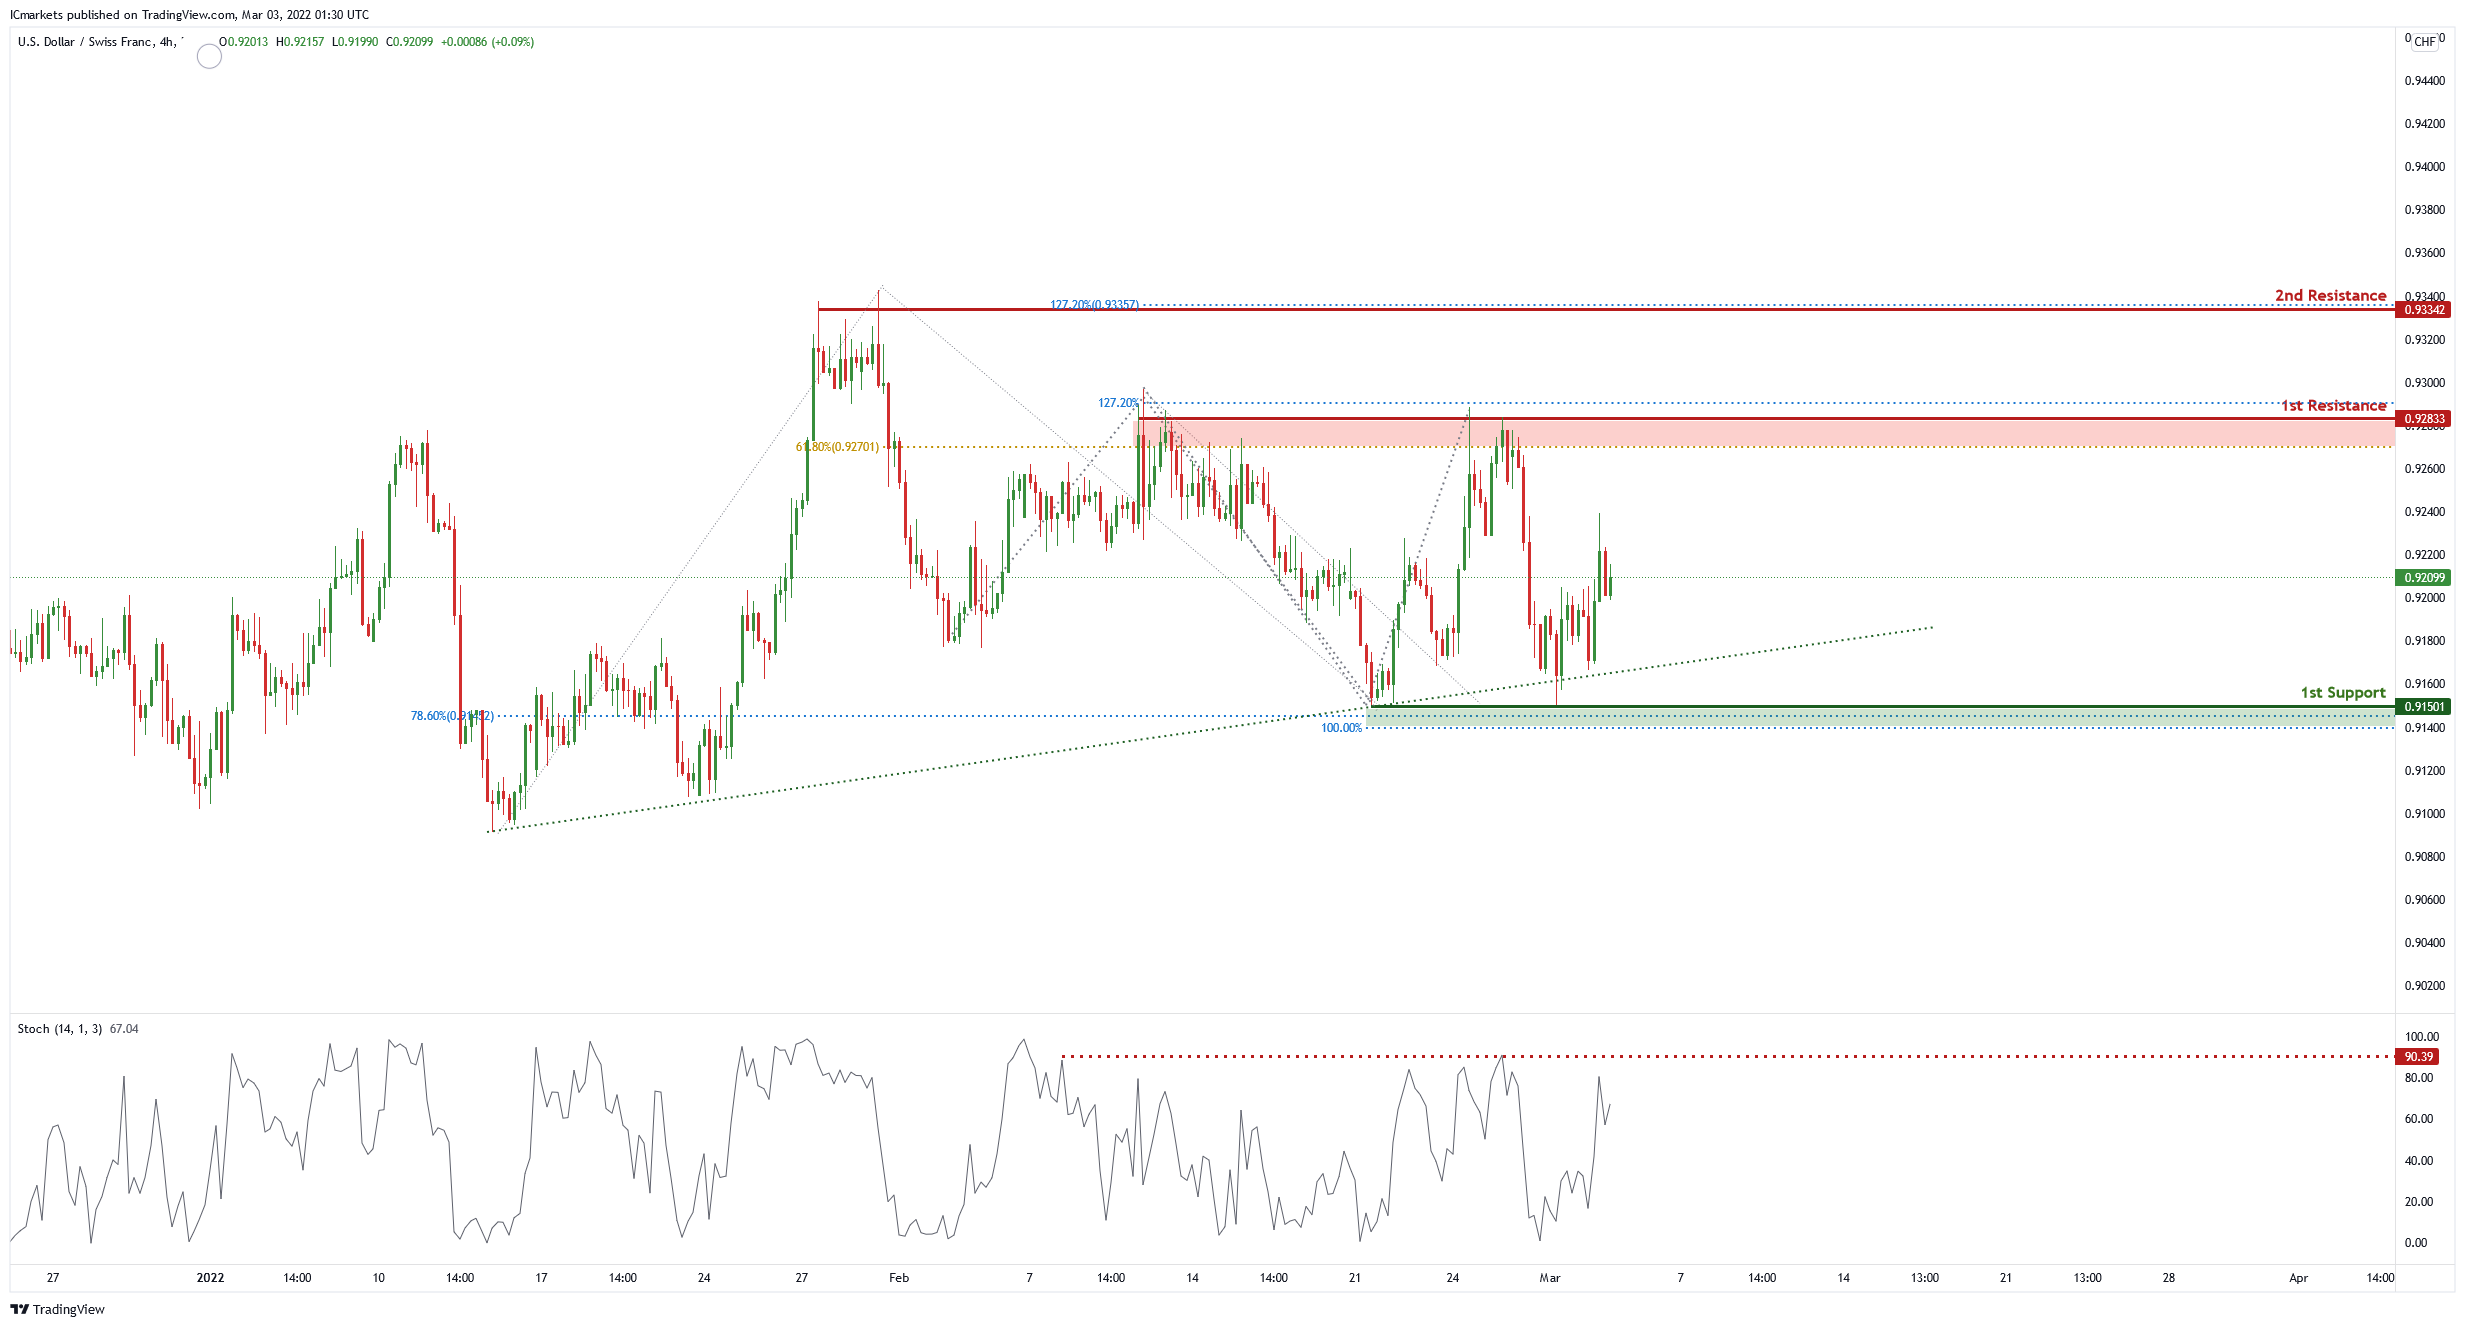
USD/CHF:
On the H4, price is abiding by an ascending trendline and near 1st support level of 0.91663 in line with 78.% Fibonacci projection. Price can potentially bounce to the 1st resistance level of 0.92251 in line with 50% Fibonacci retracement and 100% Fibonacci projection. Our bullish bias is supported by the stochastic indicator as it is at support level.
Areas of consideration
- 1st support level at 0.91663
- 1st resistance level at 0.92251
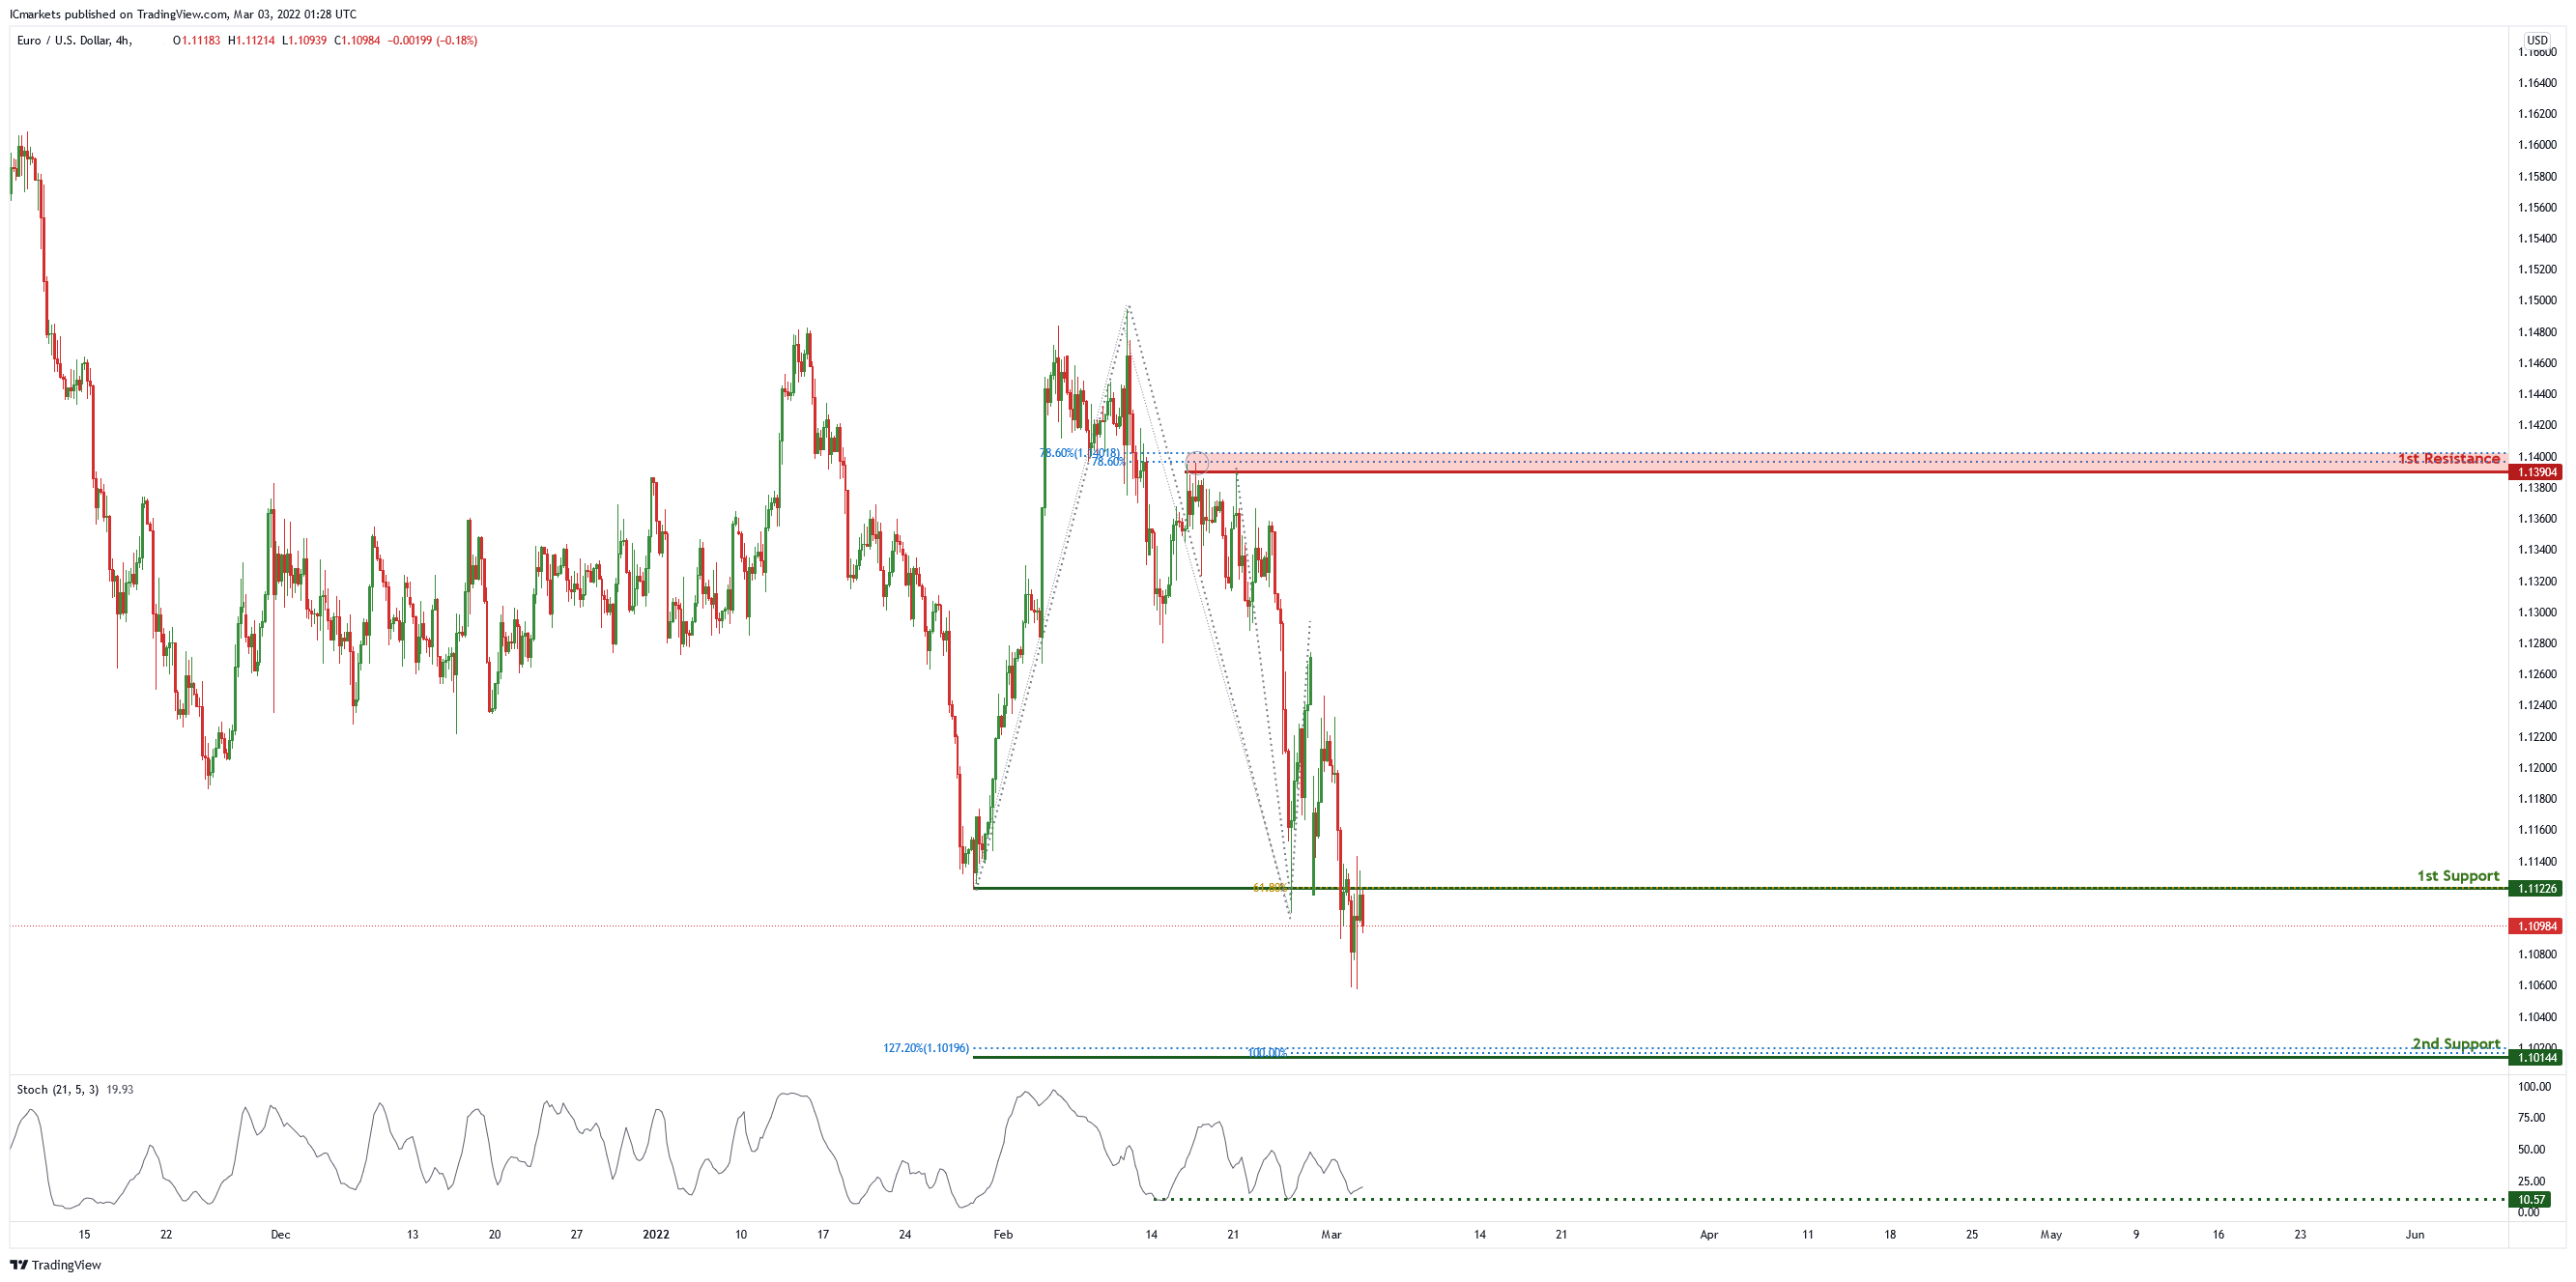
EUR/USD :
On the H4 chart price is near 1st support level of 1.11226 in line with 61.8% Fibonacci projection. Price can potentially go to the 1st resistance level of 1.13904 in line with 78.6% Fibonacci retracement and 78.6% Fibonacci projection. Our bullish bias is supported by the stochastic indicator as it is near support level.
Areas of consideration :
- H4 1st support at 1.11226
- H4 1st resistance at 1.13904
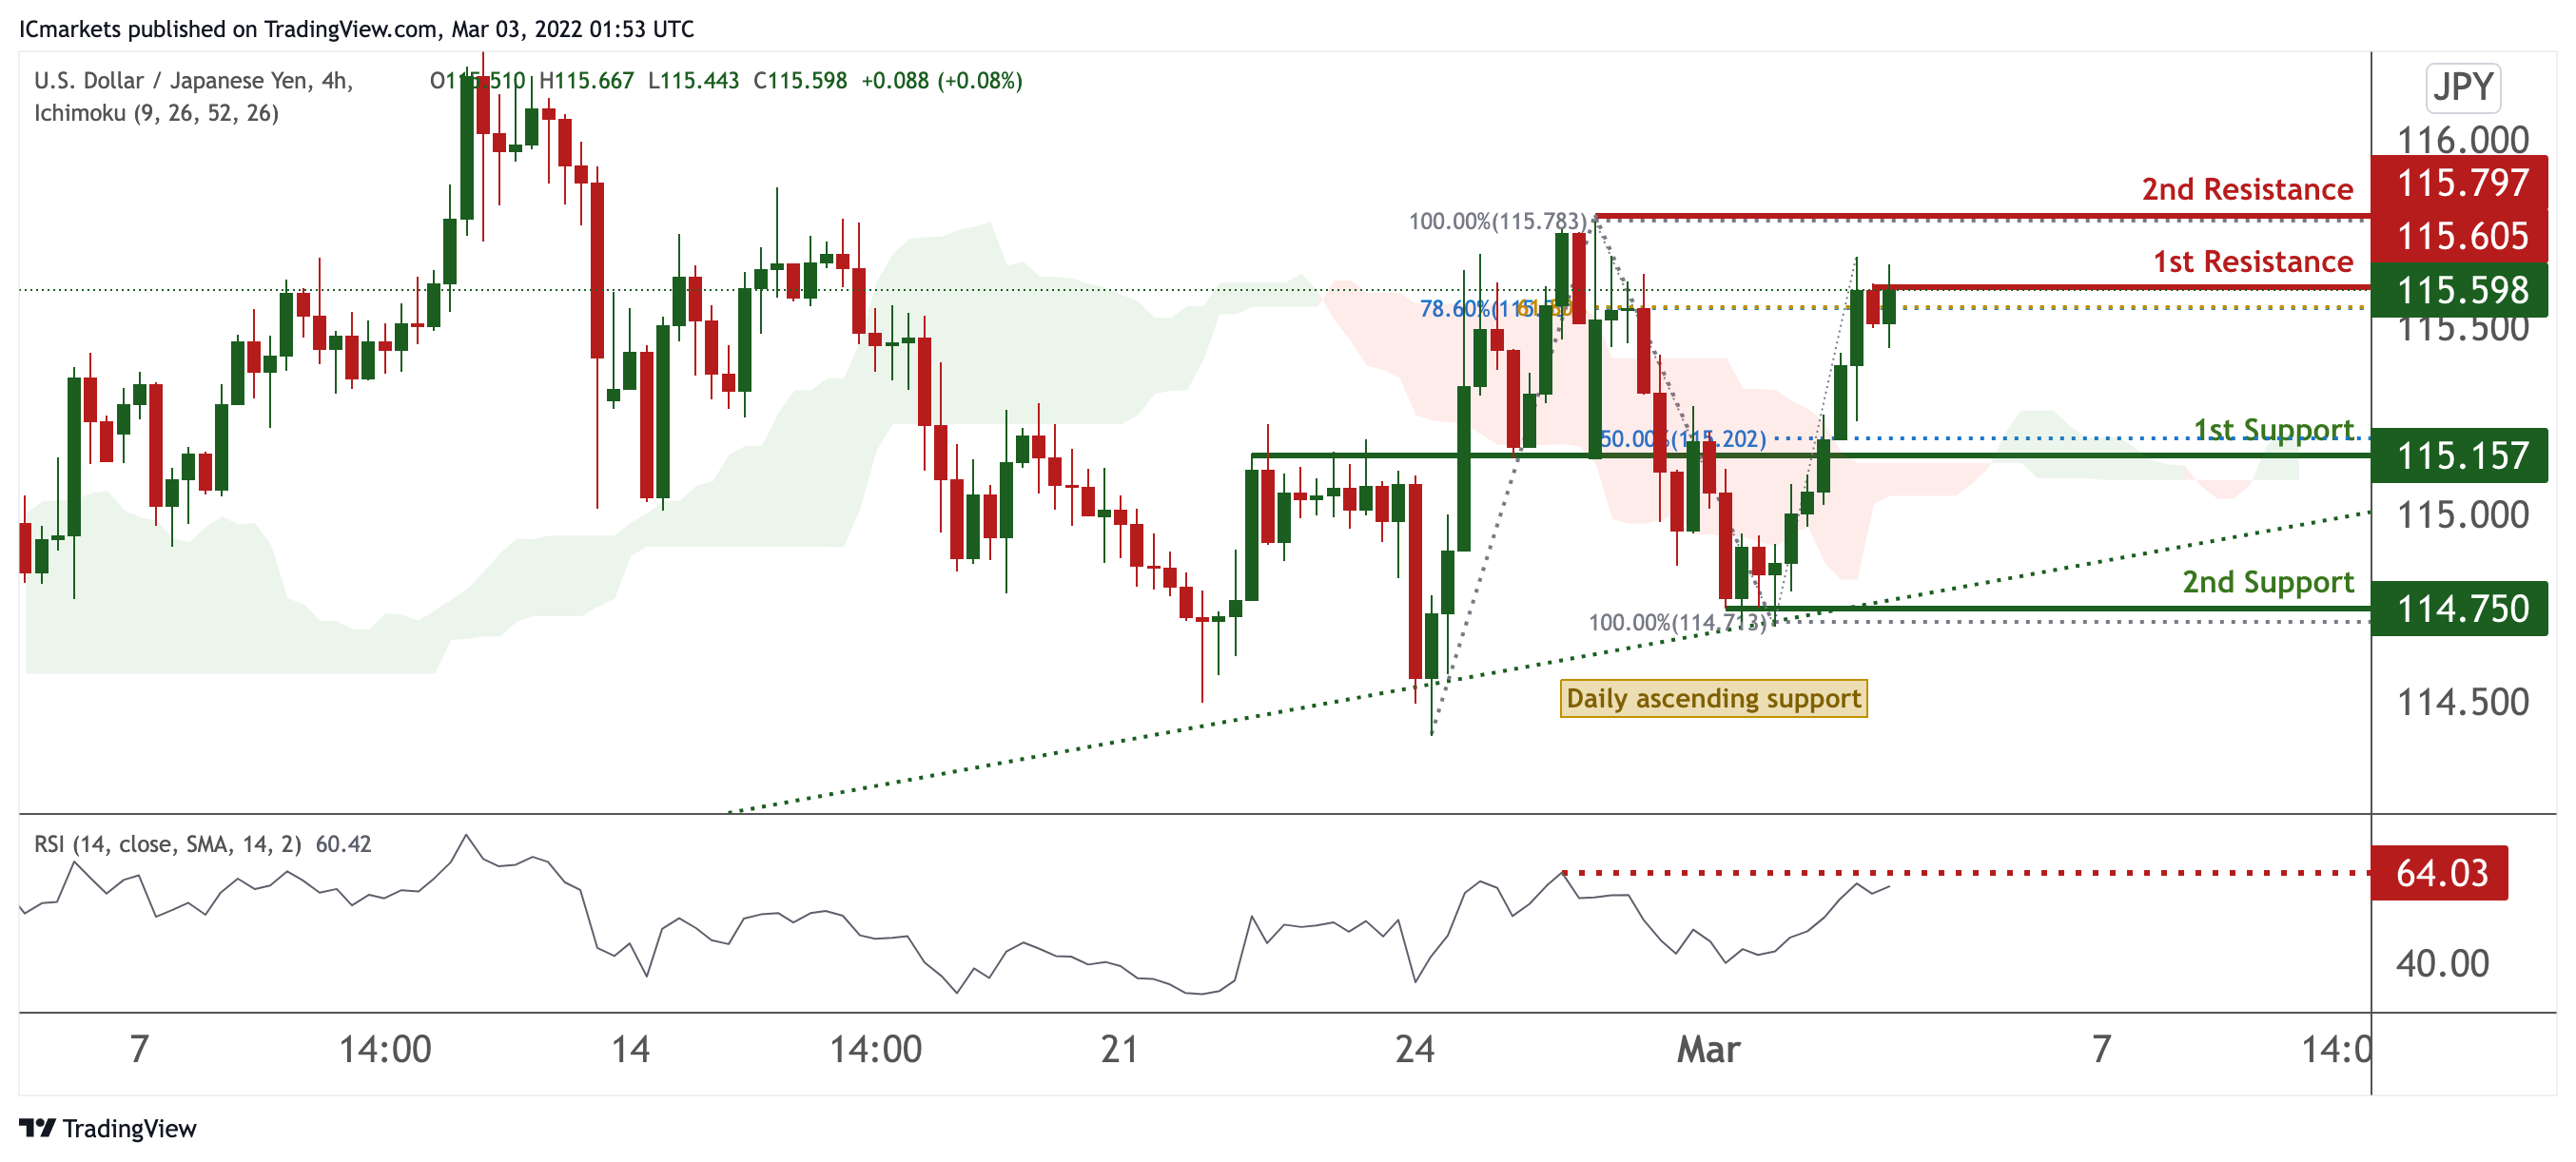
USD/JPY
On the H4 timeframe, prices have recently bounced off a strong graphical overlap and also 1st resistance. We see the potential for further bearish dip from our 1st resistance at 115.605 in line with 78.6% Fibonacci retracement and 61.8% Fibonacci retracement towards our 1st support at 115.157 which is in line with 50% Fibonacci retracement. Our bearish bias is RSI being at levels where dips occurred previously..
Areas of consideration:
- H4 time frame, 1st resistance at 115.605
- H4 time frame, 1st support at 115.157
AUD/USD:
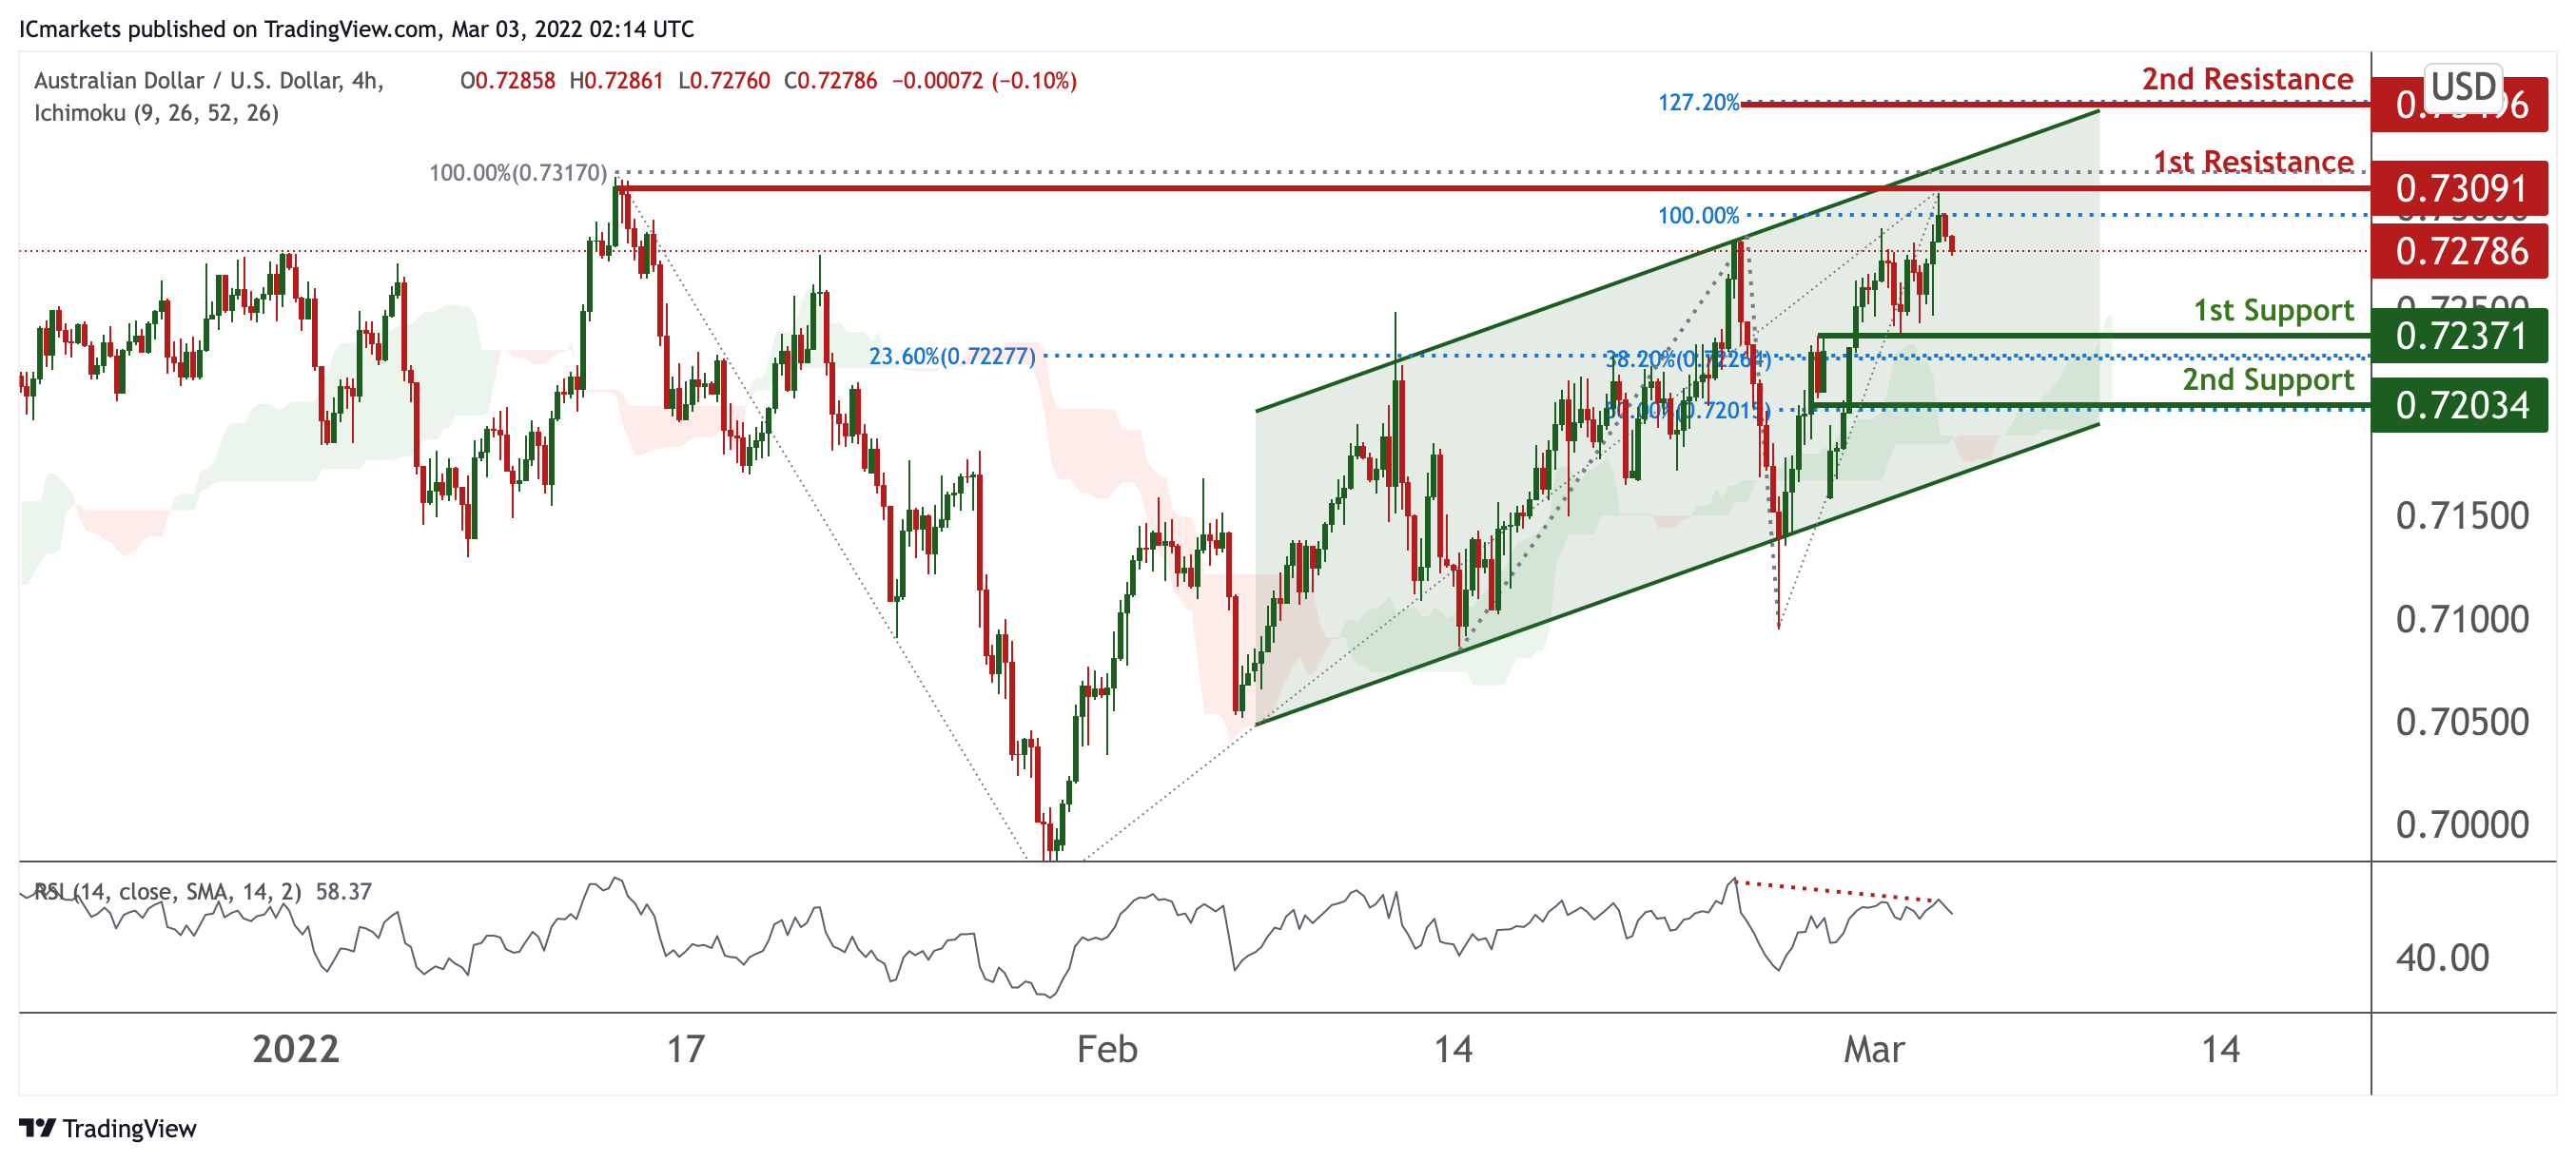
On the H4 chart, prices are consolidating in a parallel channel. We see potential for bearish dip from our 1st resistance at 0.73091 in line with 100% Fibonacci retracement and towards our 1st support at 0.73072 which is in line with 23.6% Fibonacci retracement and 38.2% Fibonacci retracement. Alternatively, price can potentially climb higher to the 2nd resistance level at 0.73496 in line with 127.2% Fibonacci projection. Our bearish bias is further supported by bearish divergence spotted on RSI.
Areas of consideration :
- H4 1st support at 0.73072
- H4 1st resistance at 0.73091
NZD/USD:
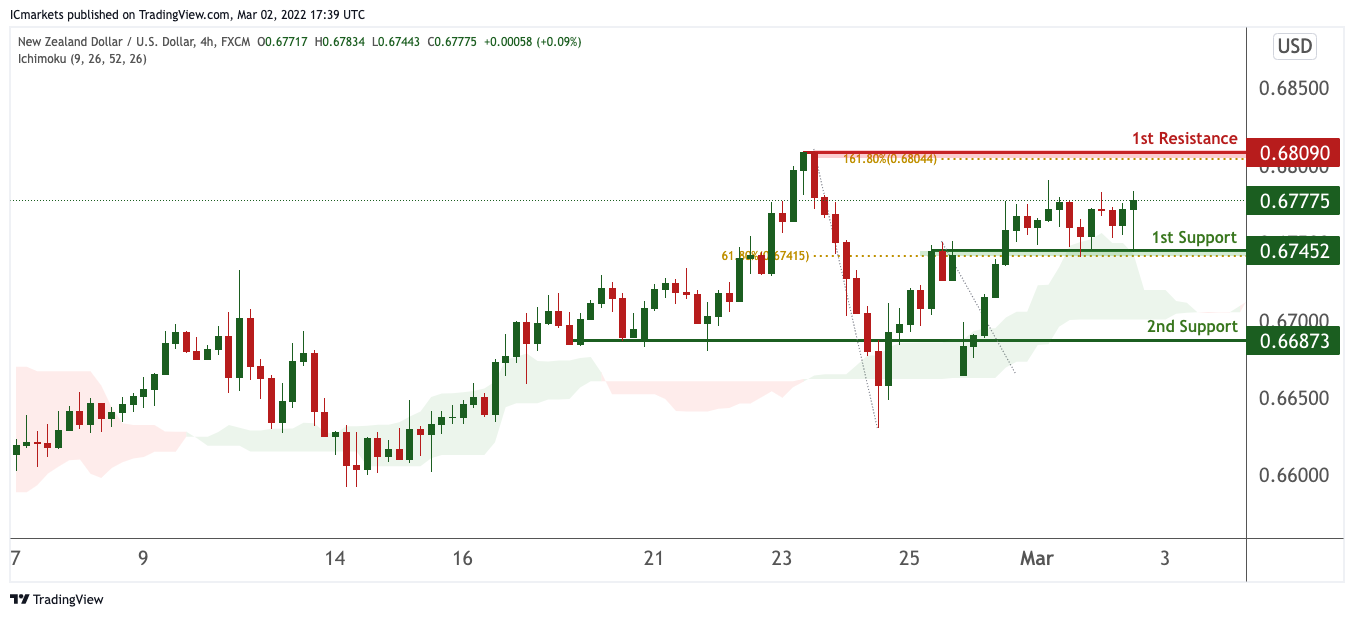
On the H4 chart, price is near 1st support level of 0.67452 in line with horizontal overlap support and 61.8% Fibonacci retracement. Price can potentially rise to the 1st resistance level of 0.68090 in line with the horizontal swing high resistance and 161.8% Fibonacci extension level. Alternatively, price may break 1st support and head for 2nd support at 0.66873. Our bullsh bias is supported by how price is expected to bounce off the support of the ichimoku cloud.
Areas of consideration:
- H4 time frame, 1st resistance at 0.68090
- H4 time frame, 1st support at 0.67452
USD/CAD:
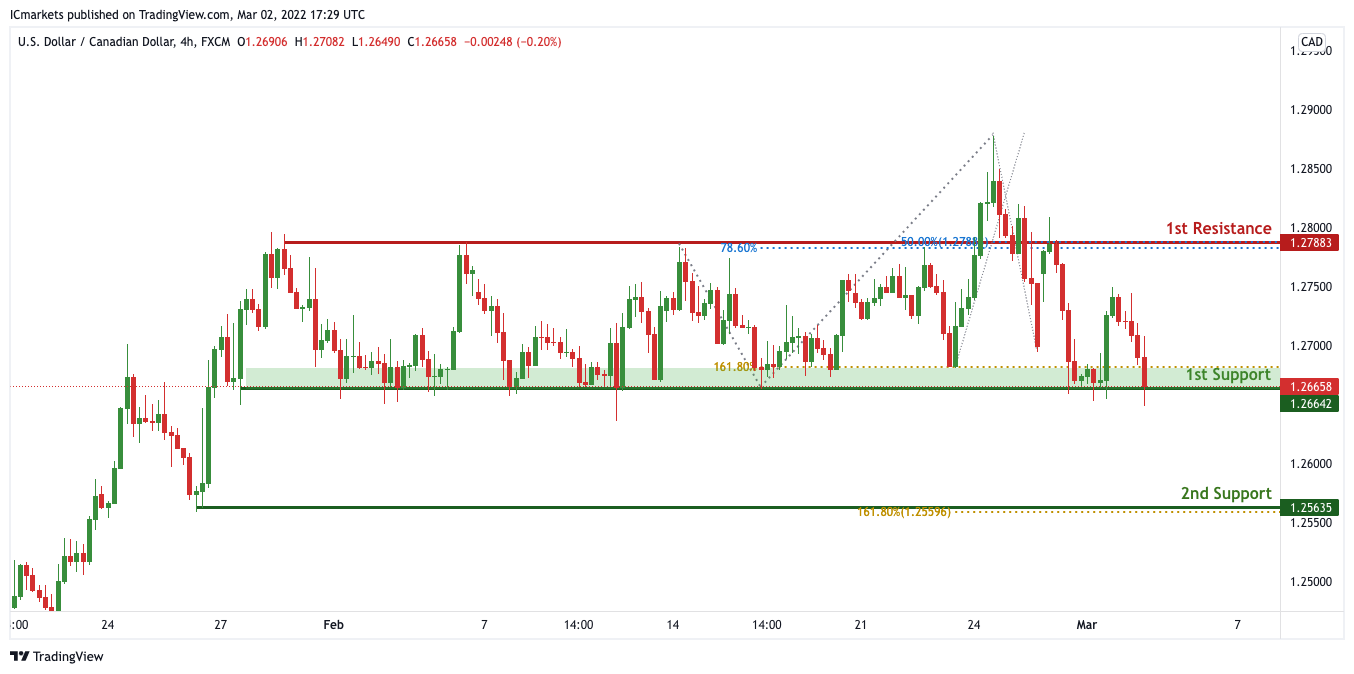
On the H4, price is ranging in between our 1st support and 1st resistance. With no clear indication of where price is heading at this current juncture, We have a bias that price will continue to range within our support and resistance of 1.26642 and 1.27883 respectively.
Areas of consideration:
- H4 time frame, 1st support at 1.26642
- H4 time frame, 1st resistance at 1.27883
OIL:
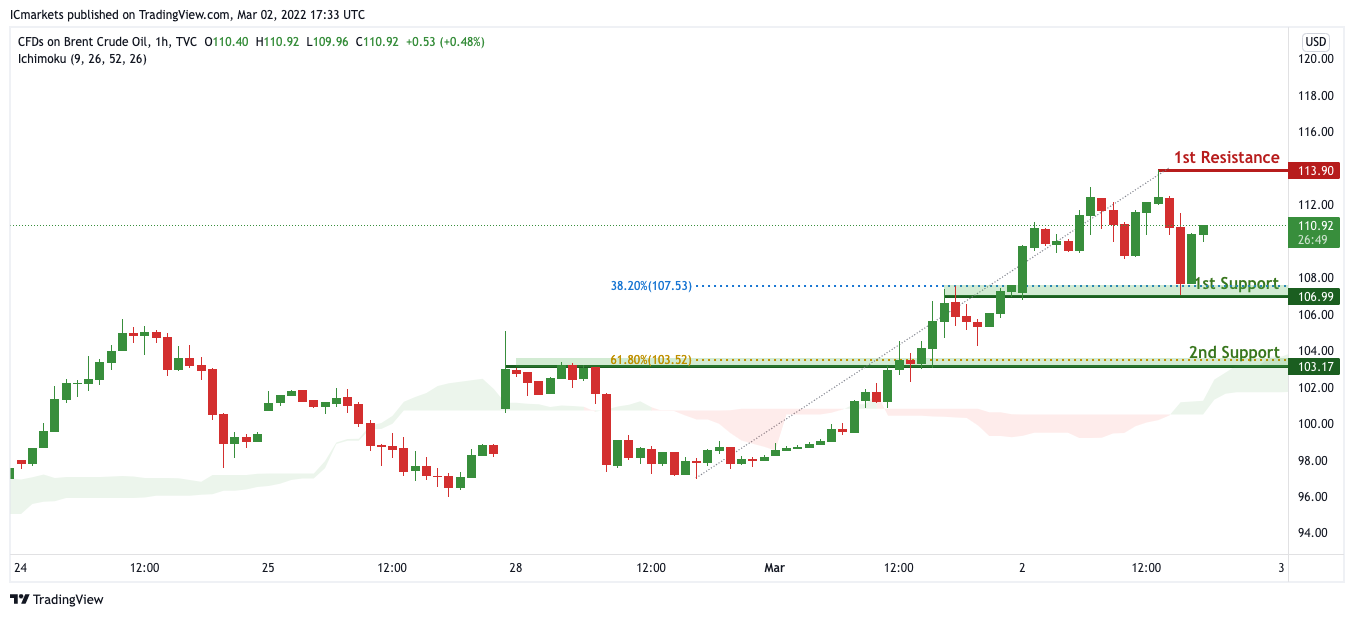
On the H4 chart, price is near 1st support level of 106.99 in line with horizontal overlap support and 38.2% Fibonacci retracement. Price can potentially rise to the 1st resistance level of 113.90 in line with the horizontal swing high resistance. Alternatively, price may break 1st support and head for 2nd support at 103.17. Our bullsh bias is supported by how price is moving above the ichimoku cloud.
Areas of consideration:
- H4 time frame, 1st resistance of 113.91
- H4 time frame, 1st support of 106.99
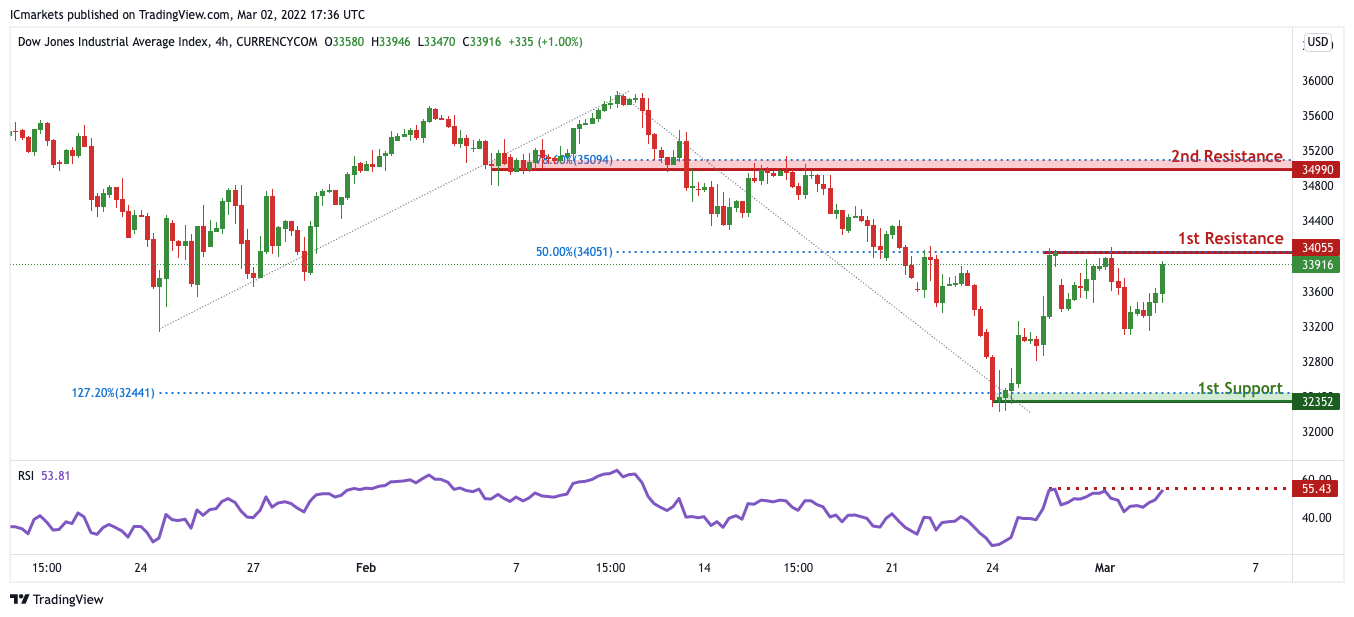
Dow Jones Industrial Average:
On the H4 timeframe, We see the possibility of bearish continuation from our 1st resistance at 34055 in line with horizontal overlap resistance towards our 1st support at 32352 in line with the horizontal swing low support. Alternatively, price may break 1st resistance and head for 2nd resistance at 34990 in line with the 78.6% Fibonacci retracement level. Our bearish bias is further supported by how price is expected to reverse off the RSI indicator.
Areas of consideration :
- H4 1st support at 32352
- H4 1st resistance at 34055
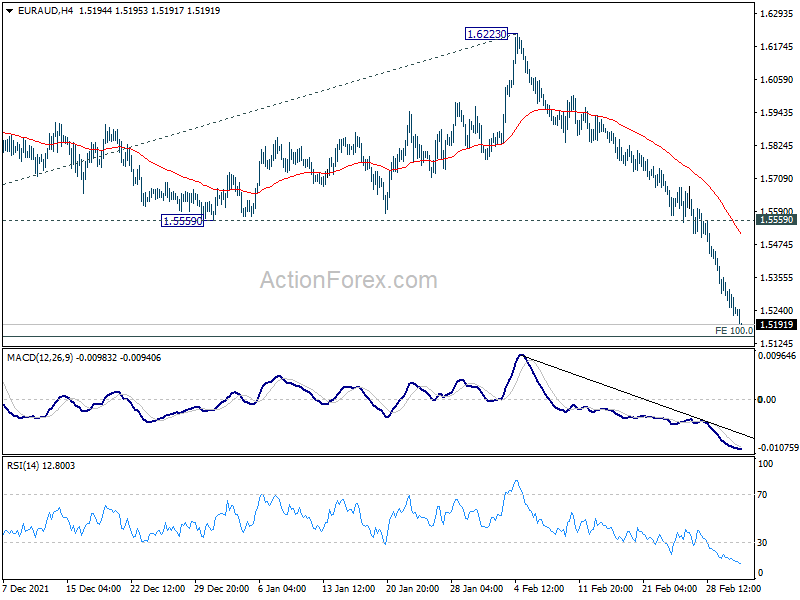
EUR/AUD Daily Outlook
Daily Pivots: (S1) 1.5201; (P) 1.5272; (R1) 1.5317; More...
EUR/AUD's fall continues today and break of 1.5250 low indicates resumption of larger down trend from 1.9799. Intraday bias stays on the downside for 100% projection of 1.6343 to 1.5354 from 1.6223 at 1.5143. Sustained break there will pave the way to 161.8% projection at 1.4476. On the upside, break of 1.5559 support turned resistance is needed to indicate short term bottoming. Otherwise, outlook stays bearish in case of recovery.
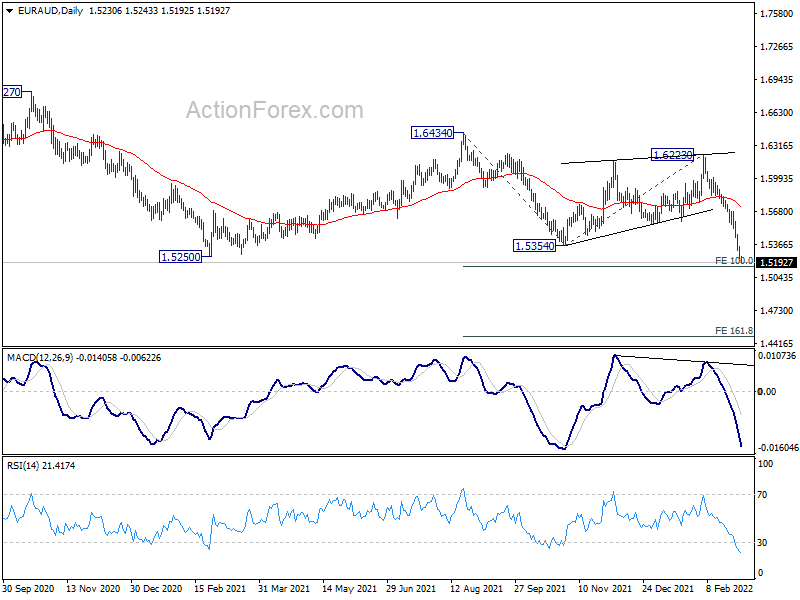
In the bigger picture, break of 1.5250 support indicates resumption of whole down trend from 1.9799 (2020 high). Next target is 61.8% retracement of 1.1602 (2012 low) to 1.9799 at 1.4733 and below. But we'd tentatively look for bottoming sign above 1.3624 long term support, for an interim rebound. Meanwhile, break of 1.6223 resistance is now needed to indicate medium term bottoming. Otherwise, outlook will remain bearish.
Euro Selloff Continues, Oil Extends Powerful Rally
Euro is staying under selling pressure as Russia is continuing its invasion while Ukrainians are holding on defending their country. But selloff in Sterling has eased a little bit. Australia Dollar is extending recent rally as the best performer for the week. Canadian Dollar is following closely with help from BoC's rate hike overnight, and persistent rally in oil prices. Dollar and Yen are mixed while Swiss Franc upside momentum diminished slightly.
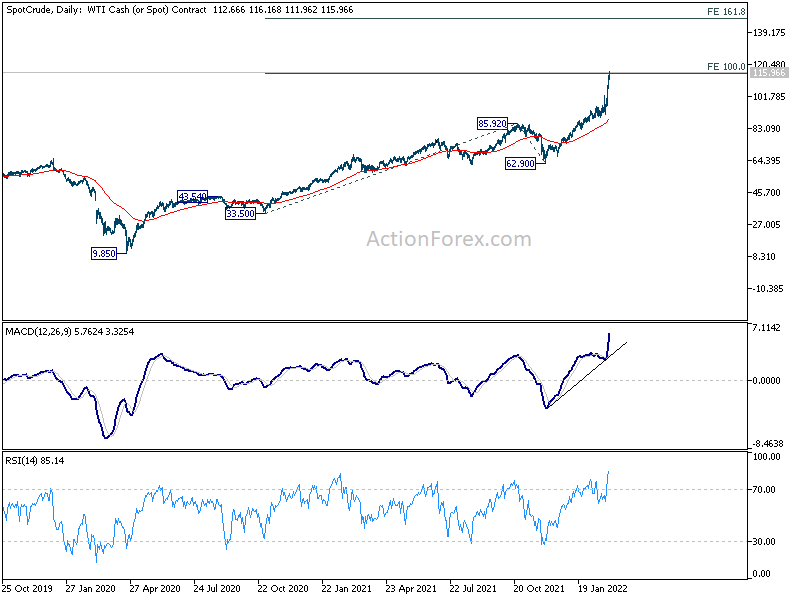
Technically, WTI crude oil has met first medium term target of 100% projection of 33.50 to 85.92 from 62.90 at 115.32 already and there is no sign of stopping yet. It should be noted again that fear-driven moves in commodity markets could be extremely powerful. A clear example was the negative oil price at the start of the pandemic less than two years ago. Sustained break above 115.32 could prompt even more upside acceleration to 161.8% projection at 147.71, in rather quick manner. The implication on inflation, monetary policy, stocks, yields and FX would be rather complicated.
In Asia, at the time of writing, Nikkei is up 0.79%. Hong Kong HSI is up 0.46%. China Shanghai SSE is down -0.20%. Singapore Strait Times is up 0.80%. Japan 10-year JGB yield is up 0.0343 at 0.168. Overnight, DOW rose 1.79%. S&P 500 rose 1.86%. NASDAQ rose 1.62%. 10-year yield rose 0.158 to 1.865.
Fed Powell to Congress: Appropriate to raise interest rate later this month
In the semiannual testimony to Congress yesterday, Fed Chair Jerome Powell said,"with inflation well above 2 percent and a strong labor market, we expect it will be appropriate to raise the target range for the federal funds rate at our meeting later this month."
He reiterated that "federal funds rate is our primary means of adjusting the stance of monetary policy". And, "reducing our balance sheet will commence after the process of raising interest rates has begun, and will proceed in a predictable manner primarily through adjustments to reinvestments.
Powell also said, "the near-term effects on the U.S. economy of the invasion of Ukraine, the ongoing war, the sanctions, and of events to come, remain highly uncertain. Making appropriate monetary policy in this environment requires a recognition that the economy evolves in unexpected ways. We will need to be nimble in responding to incoming data and the evolving outlook."
BoE Tenreyro: Russia invasion will intensify trade shock and inflation
Referring to Russia invasion of Ukraine, BoE MPC member Silvana Tenreyro said yesterday, "recent developments will intensify the terms of trade shock that we were already experiencing, so will push up inflation and have a negative impact on activity. How exactly? That's the job we will start next week."
Tenreyro added that she had been surprised by the scale of wages growth. However, "when you are talking about spirals, you are talking about explosive dynamics which we haven't seen yet. If anything, we are just starting the first round, so how can you talk about second round (effects)" she said.
BoE Cunliffe: Recent events led to abrupt shift in expectations
BoE Deputy Governor Jon Cunliffe said yesterday, "the events of the last few days have led to an abrupt shift in our expectations of the future and an increase in uncertainty."
"The heightened perception of geopolitical risks, and the potential impacts on growth and inflation, can only increase risks around the adjustment away from riskier assets that is already underway," he said.
Cunliffe added, "Russia is a relatively small part of the world economy, accounting for around 2% of world GDP. It accounts however for a much larger share of the world supply of energy and other commodities."
BoJ Nakagawa: Core inflation may briefly hit 2% on energy, food and industrial goods
BoJ board member Junko Nakagawa said "for the time being, inflationary pressure will remain strong, mainly for energy, food and industrial goods." Core consumer prices may "briefly rise close to 2%."
However, "even if that happens, what's important is to scrutinise the factors and whether Japan's economic fundamentals are strong enough to make such price rises sustainable," she said.
"Global financial markets remain jittery due to escalating tensions in Ukraine. We're monitoring changes in developments carefully," she added.
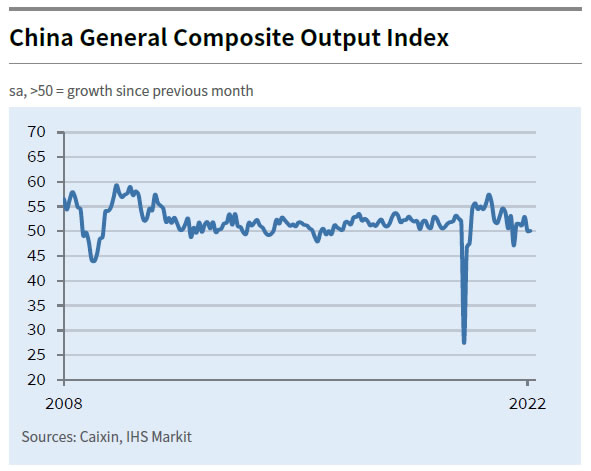
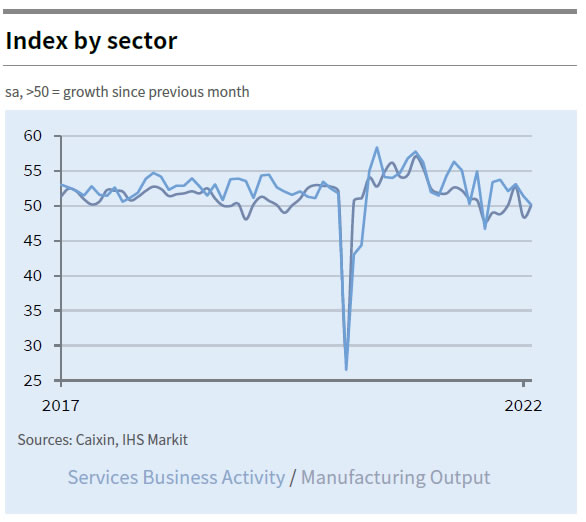
China Caixin PMI composite unchanged at 50.1, still under triple pressure
China Caixin PMI Services dropped from 51.4 to 50.2 in February. PMI Composite was unchanged at 50.1.
Wang Zhe, Senior Economist at Caixin Insight Group said: "Overall, the manufacturing PMI rose in February, while the services PMI fell, but both remained in positive territory. Demand in the manufacturing sector improved, while demand in the services sector was greatly affected by the epidemic....
"Under the "triple pressure" of demand contraction, supply shocks and weakening expectations, the economy's recovery is still not robust. Stabilizing economic growth remains an important focus of the government."
Elsewhere
Australia AiG Performance of Construction rose from 45.9 to 53.4 in February. Building permits dropped -27.9% mom in January, versus expectation of -3.0% mom. Trade surplus widened to AUD 12.89B, above expectation of AUD 9.1B.
Looking ahead, ECB will publish monetary policy meeting accounts. Eurozone will release PMI services final, unemployment rate and PPI. UK will release PMI services final. Swiss will release CPI.
Later in the day, US will release jobless claims, ISM services and factory orders.
EUR/AUD Daily Outlook
Daily Pivots: (S1) 1.5201; (P) 1.5272; (R1) 1.5317; More...
EUR/AUD's fall continues today and break of 1.5250 low indicates resumption of larger down trend from 1.9799. Intraday bias stays on the downside for 100% projection of 1.6343 to 1.5354 from 1.6223 at 1.5143. Sustained break there will pave the way to 161.8% projection at 1.4476. On the upside, break of 1.5559 support turned resistance is needed to indicate short term bottoming. Otherwise, outlook stays bearish in case of recovery.
In the bigger picture, break of 1.5250 support indicates resumption of whole down trend from 1.9799 (2020 high). Next target is 61.8% retracement of 1.1602 (2012 low) to 1.9799 at 1.4733 and below. But we'd tentatively look for bottoming sign above 1.3624 long term support, for an interim rebound. Meanwhile, break of 1.6223 resistance is now needed to indicate medium term bottoming. Otherwise, outlook will remain bearish.
Economic Indicators Update
| GMT | Ccy | Events | Actual | Forecast | Previous | Revised |
|---|---|---|---|---|---|---|
| 21:30 | AUD | AiG Performance of Construction Index Feb | 53.4 | 45.9 | ||
| 00:30 | AUD | Building Permits M/M Jan | -27.90% | -3.00% | 8.20% | 9.80% |
| 00:30 | AUD | Trade Balance (AUD) Jan | 12.89B | 9.10B | 8.36B | 8.82B |
| 01:45 | CNY | Caixin Services PMI Feb | 50.2 | 50.9 | 51.4 | |
| 05:00 | JPY | Consumer Confidence Index Feb | 35.3 | 35 | 36.7 | |
| 07:30 | CHF | CPI M/M Feb | 0.30% | 0.20% | ||
| 07:30 | CHF | CPI Y/Y Feb | 1.80% | 1.60% | ||
| 08:45 | EUR | Italy Services PMI Feb | 48.9 | 48.5 | ||
| 08:50 | EUR | France Services PMI Feb F | 57.9 | 57.9 | ||
| 08:55 | EUR | Germany Services PMI Feb F | 56.6 | 56.6 | ||
| 09:00 | EUR | Eurozone Services PMI Feb F | 55.8 | 55.8 | ||
| 09:00 | EUR | Italy Unemployment Jan | 9.10% | 9.00% | ||
| 09:30 | GBP | Services PMI Feb F | 60.8 | 60.8 | ||
| 10:00 | EUR | Eurozone Unemployment Rate Jan | 6.90% | 7.00% | ||
| 10:00 | EUR | Eurozone PPI M/M Jan | 3.00% | 2.90% | ||
| 10:00 | EUR | Eurozone PPI Y/Y Jan | 26.90% | 26.20% | ||
| 12:30 | EUR | ECB Monetary Policy Meeting Accounts | ||||
| 12:30 | USD | Challenger Job Cuts Y/Y Feb | -76.00% | |||
| 13:30 | USD | Initial Jobless Claims (Feb 25) | 235K | 232K | ||
| 13:30 | USD | Unit Labor Costs Q4 | 0.40% | 0.30% | ||
| 13:30 | USD | Nonfarm Productivity Q4 | 6.50% | 6.60% | ||
| 14:45 | USD | Services PMI Feb F | 56.7 | 56.7 | ||
| 15:00 | USD | ISM Services PMI Feb | 60.5 | 59.9 | ||
| 15:00 | USD | ISM Services Prices Paid Feb | 82.3 | |||
| 15:00 | USD | ISM Services Employment Index Feb | 52.3 | |||
| 15:00 | USD | Factory Orders M/M Jan | 0.50% | -0.40% | ||
| 15:30 | USD | Natural Gas Storage | -138B | -129B |
China Caixin PMI composite unchanged at 50.1, still under triple pressure
China Caixin PMI Services dropped from 51.4 to 50.2 in February. PMI Composite was unchanged at 50.1.
Wang Zhe, Senior Economist at Caixin Insight Group said: "Overall, the manufacturing PMI rose in February, while the services PMI fell, but both remained in positive territory. Demand in the manufacturing sector improved, while demand in the services sector was greatly affected by the epidemic....
"Under the 'triple pressure' of demand contraction, supply shocks and weakening expectations, the economy's recovery is still not robust. Stabilizing economic growth remains an important focus of the government."
BoJ Nakagawa: Core inflation may briefly hit 2% on energy, food and industrial goods
BoJ board member Junko Nakagawa said "for the time being, inflationary pressure will remain strong, mainly for energy, food and industrial goods." Core consumer prices may "briefly rise close to 2%."
However, "even if that happens, what's important is to scrutinise the factors and whether Japan's economic fundamentals are strong enough to make such price rises sustainable," she said.
"Global financial markets remain jittery due to escalating tensions in Ukraine. We're monitoring changes in developments carefully," she added.
BoE Cunliffe: Recent events led to abrupt shift in expectations
BoE Deputy Governor Jon Cunliffe said yesterday, "the events of the last few days have led to an abrupt shift in our expectations of the future and an increase in uncertainty."
"The heightened perception of geopolitical risks, and the potential impacts on growth and inflation, can only increase risks around the adjustment away from riskier assets that is already underway," he said.
Cunliffe added, "Russia is a relatively small part of the world economy, accounting for around 2% of world GDP. It accounts however for a much larger share of the world supply of energy and other commodities."