

Sample Category Title
Gold’s Fresh Rally Takes a Breather Below 1,950 Level
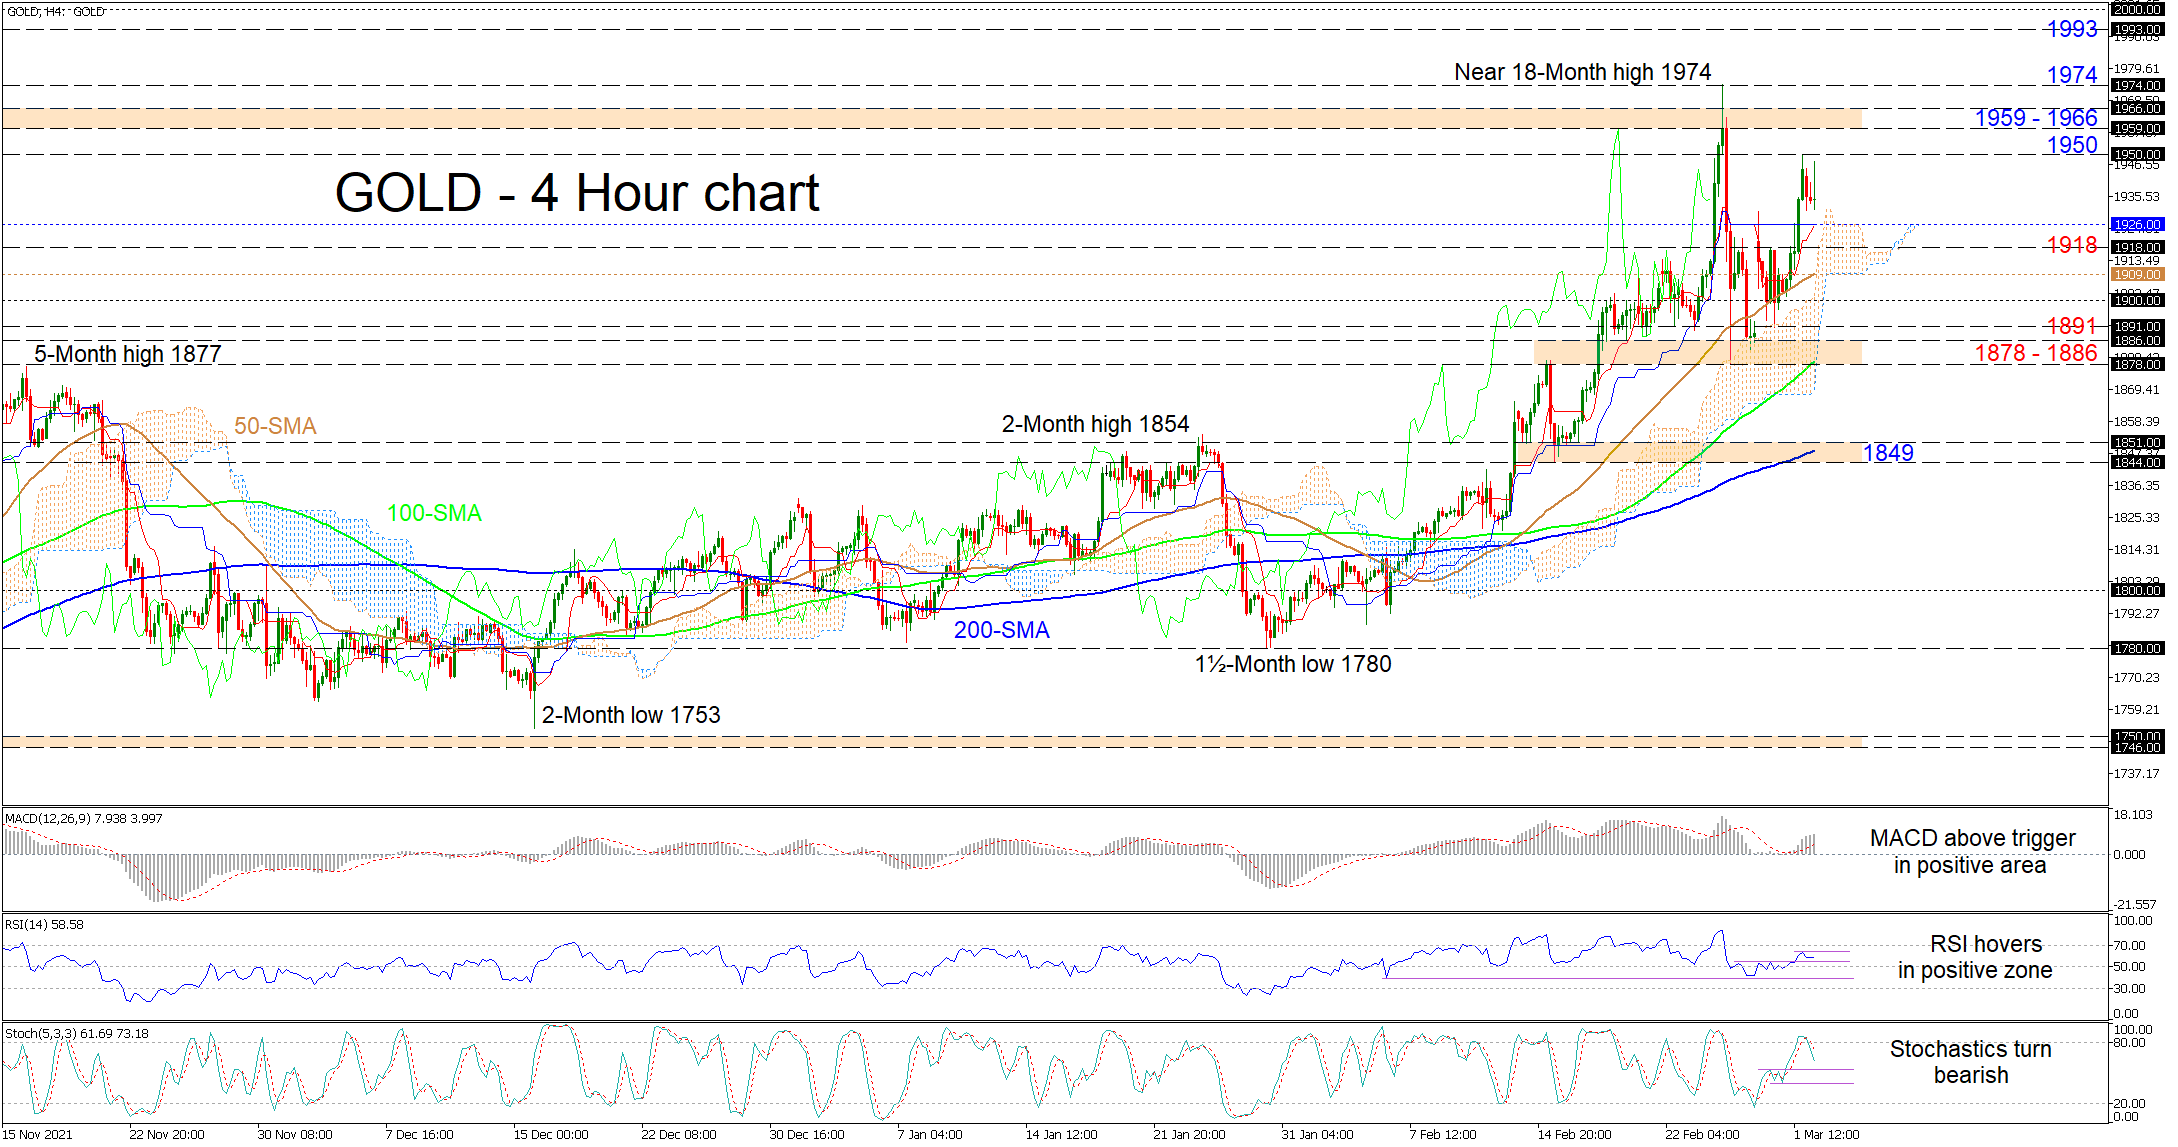
Gold is consolidating slightly beneath its latest high of 1,950 after renewed positive traction from its recent 1,891 trough. The soaring simple moving averages (SMAs) are safeguarding the one-month bullish picture in the precious metal.
The climbing red Tenkan-sen line looks set to complete a positive overlap of the flattened blue Kijun-sen line, which would indicate that bullish forces are intensifying. That said, an upturn in the blue Kijun-sen line would offer additional credence for positive developments in the commodity. Currently, the short-term oscillators are conveying mixed messages in directional momentum. The MACD, in the positive region, is some distance above its red trigger line, while the stochastic oscillator has turned bearish, promoting a price pullback. Meanwhile, the RSI is hovering in bullish territory.
If bullish pressures strengthen, resistance could commence around the 1,950 nearby high. However, should the positive scenario persist, buyers may then meet the 1,959-1,966 resistance band shaped by the rally peaks in November 2020 and January 2021, before confronting the near 18-month high of 1,974. Successfully conquering the one-and-a-half year high may encourage buyers to aim for a zone of resistance between the September 2020 high of 1,993 and the 2,000 handle.
Alternatively, if the positive forces continue to wane, prompt support could transpire from the converged Ichimoku lines at 1,926, which are located around the cloud’s upper band. Slipping further, the 1,918 inside swing high could delay the test of the floor of the cloud, which is in line with the 50-period SMA at 1,909. A price retreat beneath the cloud, which ignores the 1,900 mark as well, could signal growing negative forces that may target the 1,891 trough before pursuing the 1,878-1,886 significant support border.
Summarizing, gold’s bullish bias should remain intact if the price holds north of the 1,918 barrier and the SMAs, and an initial climb above 1,950 could nurture optimism in the yellow metal. Yet, for bearish forces to trigger worries about the positive structure, the price would need to retrace beneath the 1,878-1,886 key base.
Crude Oil Hits $105 as Russian Invasion Intensifies
American equities retreated for the second straight day this week as Vladimir Putin’s attack on Ukraine intensified. The Russian military bombed multiple residential areas on Tuesday, killing hundreds of civilians. At the same time, two of the biggest shipping companies, Maersk and Mediterranean, announced that they will stop picking and dropping cargo in Russia. That will be a major blow to Russia and western countries because it will lead to higher prices. The EU announced that it was reviewing measures to ban VTB and Sberbank from Swift, a measure that will lead to more challenges for the banks.
The price of crude oil and natural gas jumped sharply as investors reacted to new developments in Europe. Analysts expect that there will be a significant demand and supply problem because of the vital role that Russia plays in the industry. In a statement on Tuesday, Saudi Arabia announced that it will stick to the production target set by OPEC+. The challenge is that some countries like Nigeria are struggling to hit their production target in the current deal. Analysts also believe that releasing oil supplies from strategic reserves will not have a major impact on prices.
The economic calendar will have some important events today. In the morning session, the European Union will publish the latest consumer inflation numbers. Analysts expect the data to show that the headline CPI jumped from 5.1% to 5.3% in February. Still, there is an expectation that the Russian crisis will lead to higher prices in March as well. Germany will publish its employment numbers while the Bank of Canada will deliver its second decision of the year. The EIA will publish its inventories data in the American session.
XBRUSD
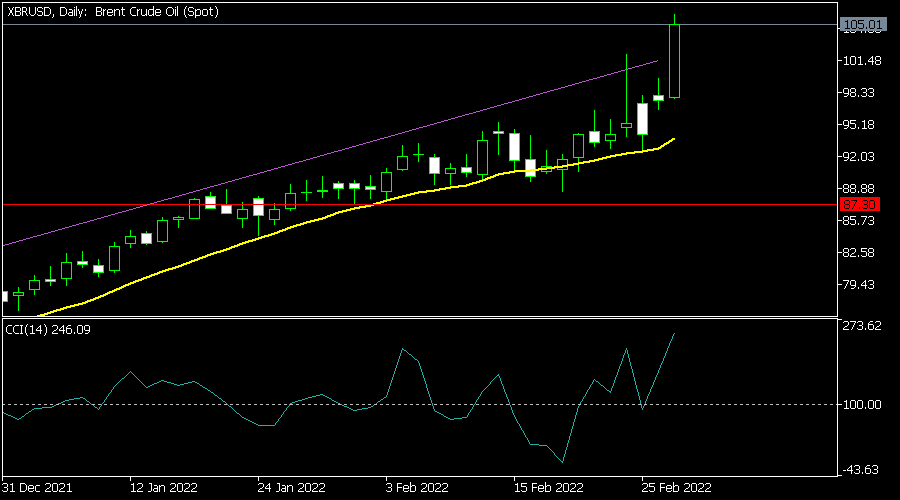
The XBRUSD pair has been in a strong bullish trend in the past few months. The pair jumped to a high of 105p, which was the highest level in more than a decade. It has moved above the 25-day and 50-day moving averages while the MACD and the commodity channel index (CCI) pairs have pointed upwards. Therefore, the path of the least resistance for oil prices is higher as the crisis continues.
EURUSD
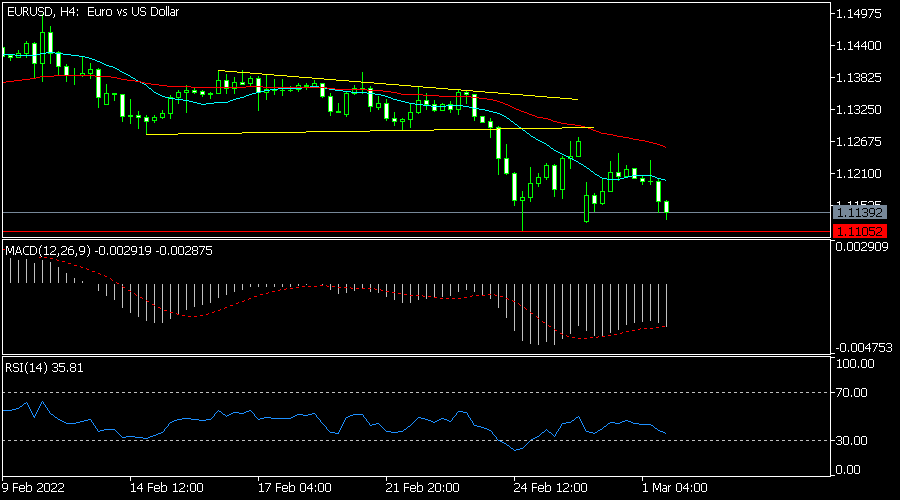
The EURUSD pair retreated as investors rushed to the safety of the US dollar. The pair is trading at 1.1140, which was the lowest level since last week. It has moved below the 25-day and 50-day moving averages while the MACD and the Relative Strength Index (RSI) has moved to the oversold level. The pair will likely break out lower as bears target the next key support level at 1.1100.
USDCAD
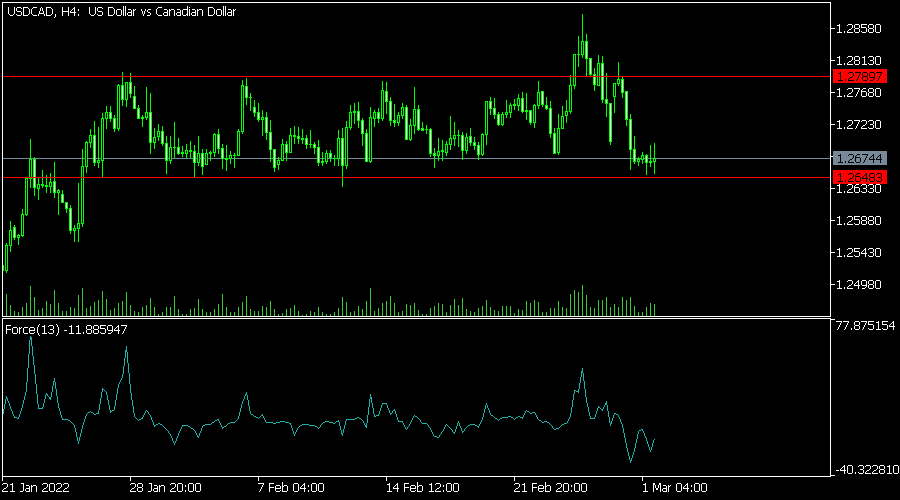
The USDCAD pair retreated in the overnight session as oil prices jumped. The pair is trading slightly above the key support level at 1.2648. It has moved below the 25-day moving average while the Force Index has dropped. It is between the 38.2% and 50% Fibonacci retracement level. Therefore, the pair will likely continue falling as bears target the next key support level at 1.2600.
GBP/USD Started a Major Decline from 1.3620
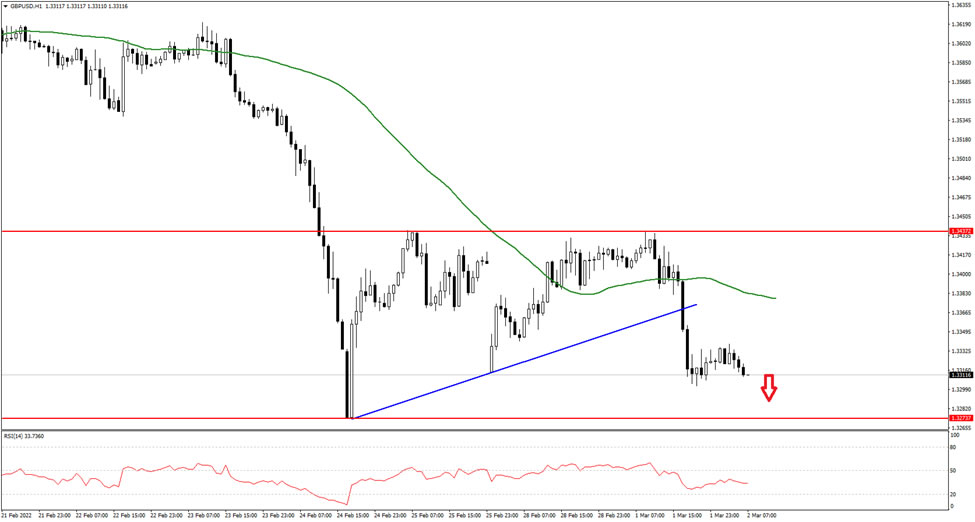
The British Pound started a major decline from the 1.3620 resistance against the US Dollar. The GBP/USD pair declined and traded below the 1.3500 level.
It traded below the 1.3400 level and the 50 hourly simple moving average. The pair traded as low as 1.3272 and it at risk of more downsides. An immediate resistance is near the 1.3320 level.
The next key resistance is near the 1.3380 level and the 50 hourly simple moving average. Any more gains might push the pair towards the 1.3440 level, where the pair might face resistance. The next major hurdle could be 1.3500 on FXOpen.
An initial support on the downside is near the 1.3300 level. The main support is forming near the 1.3280 level. A break below the 1.3280 support could even push the pair below the 1.3250 support.
NZDUSD Jumps Higher But Capped by 38.2% Fibo
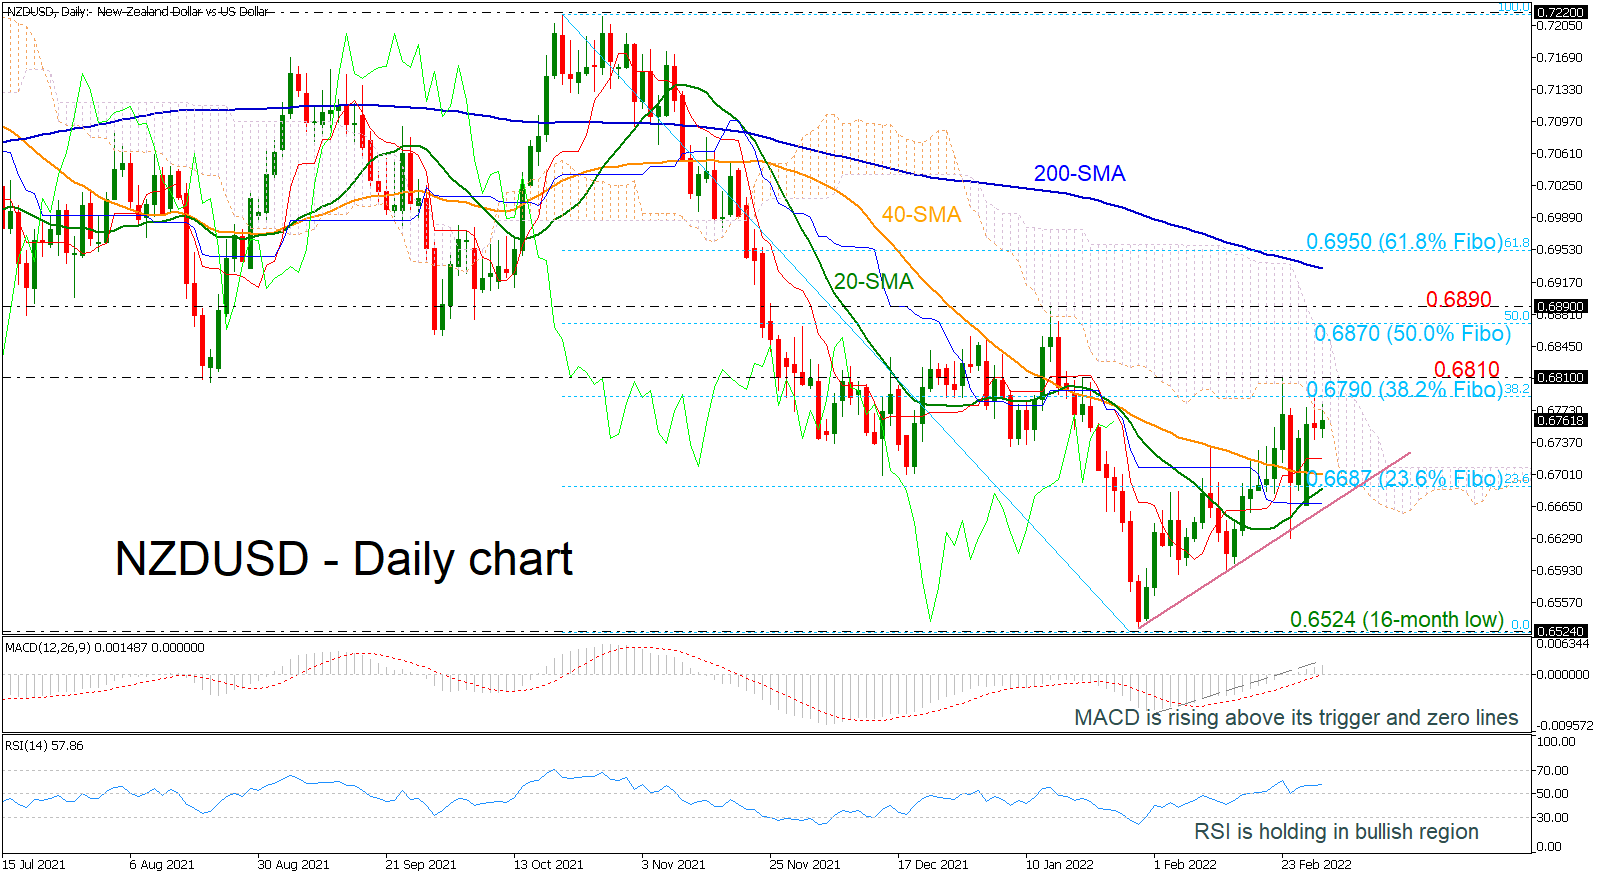
NZDUSD is creating higher highs and higher lows in the short-term, following the rebound off the 16-month low of 0.6524. Currently, the price is failing to surpass the 38.2% Fibonacci retracement level of the down leg from 0.7220 to 0.6524 at 0.6790, with the technical indicators suggesting more bullish actions.
The MACD is strengthening its positive bias above its trigger and zero lines, while the RSI is flattening in the bullish region. In trend indicators, the 20- and 40-day simple moving averages (SMAs) are ready for a positive crossover, signaling greater upside tendency.
If the price climbs beyond the 0.6790 and 0.6810 resistance levels, the next barrier could come from the 50.0% Fibonacci at 0.6870 ahead of the 0.6980 level, taken from the previous highs. Steeper increases could add the optimism for a retest of the 200-day SMA at 0.6930.
On the other hand, a fall below the short-term SMAs and the near-term ascending trend line as well as a daily close beneath the 23.6% Fibonacci of 0.6687 could shift the bias back to bearish testing the 16-month trough of 0.6524 again.
To sum up, NZDUSD has been in a positive bias in the short-term view, while in the long-term, the pair is likely to remain negative until there is a push above the 200-day SMA at 0.6930.
USDJPY Stays Within Bullish Triangle; Outlook Fragile
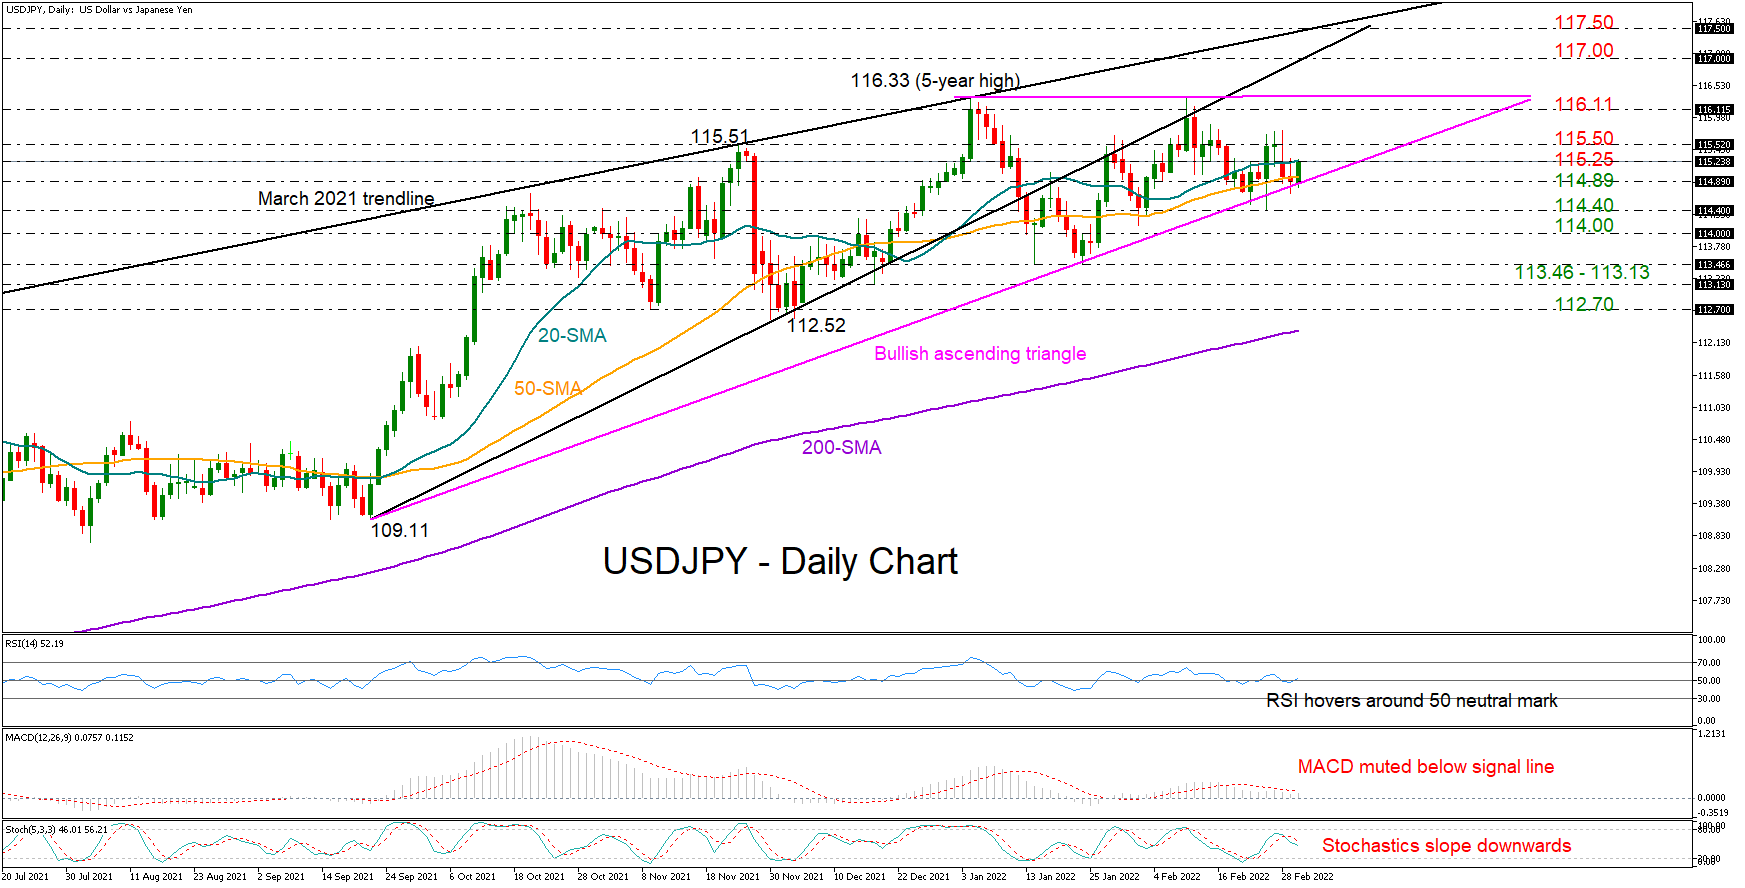
USDJPY is setting another foothold marginally below the 115.00 round level and near the supportive trendline, which now looks to be part of an ascending triangle pattern with an upper boundary at 116.33.
This type of triangle is usually a bullish formation that anticipates an upside breakout, but for that to happen the price will first need to close above the nearby constraining 20-day simple moving average (SMA) at 115.24 and then gear sustainably above the 115.50 tough resistance. Such an action would immediately bring the crucial ceiling of 116.11 – 116.33 under examination. Then, a decisive move higher from here would validate the positive triangle pattern, likely sending the price straight up to the 117.00 – 117.50 region last seen during the 2014 – 2016 period. Two restrictive trendlines are currently adding extra importance to that zone.
The technical oscillators, however, are not very optimistic at the moment, dashing hopes for a meaningful rally as the MACD remains negatively charged below its red signal line, the RSI is moving back and forth around its 50 neutral mark, and the fast-Stochastics are sloping downwards.
Should the bears ruin the bullish trend triangle pattern below the supportive trendline at 114.89, the spotlight will shift to the 114.40 – 114.00 territory. Another negative extension here could see some stabilization around the previous lows registered between 113.46 and 113.13, while deeper, any violation of the 112.70 – 112.52 region would put the broad positive trend at risk, especially if the 200-day SMA gives way after a long time.
In brief, USDJPY is maintaining a neutral short-term outlook within the three-month-old bullish triangle formation. A sustainable rally above the top of 116.33 or a slump below 114.89 could direct the market accordingly.
OPEC+ Likely to Keep with Gradual Stance Amid Ukraine Crisis
- Brent breaks above $110 in fresh seven-year peak
- Markets to watch how OPEC+ interprets Russia risks
- Geopolitical crisis remains primary near-term market driver
- Fed may alter rate hike plans in light of Ukraine crisis
Brent crude oil futures have broken above $110 for the first time since 2014 as OPEC+ prepares to discuss its production plans for April. The virtual OPEC+ meeting today will be dominated by concerns over the threat of Russia’s oil exports being hit with sanctions. Restrictions on banking transactions already mean around 70% of Russia’s oil exports are finding no buyers.
OPEC+ is caught between Russia’s military attacks in the Ukraine, and the looming prospects of more sanctions from the West that specifically target Russia’s oil. Although it is widely expected that OPEC+ will proceed with a modest 400k bpd hike next month, markets will be closely monitoring how OPEC+ digests such supply-side risks. At the same time, the alliance must manage Russian sensitivities, as the country is one of its most influential members.
The Ukraine crisis is only solidifying oil bulls’ resolve in pushing prices higher. Even without the war, and the accompanying threats to strangle Russian oil exports, the oil market structure was pointing to a tightening conditions. Global oil inventories have been falling as supply fails to keep pace with the recovery in demand.
Powell’s position on rate hikes under scrutiny
The Ukraine crisis isn’t just reverberating throughout global financial markets, but also likely forcing a rethink among major central banks in their battle against inflation. Before Russia invaded Ukraine, major economies were already having to contend with inflation reaching multi-decade highs; the Ukraine crisis has only poured more fuel onto the inflation fire.
However, instead of proceeding with the conventional policy response of hiking interest rates, central banks now have to take into account the added risks stemming from Russia’s military actions. The Ukraine crisis has ramped up the prospects of a policy mistake by central banks who now have to tread carefully, between subduing inflation while remaining sensitive to fresh downside risks to the economy.
Set within this context, Fed Chair Jerome Powell’s testimony on Capitol Hill this week will be closely scrutinised for how the FOMC intends to navigate such a precarious policy landscape.
Already, markets have pared back their hawkish bets substantially on rate hikes. At the time of writing, Fed Funds futures have ruled out a 50-basis point hike by the Fed this month, while even a 25-basis point hike is no longer a foregone conclusion. Some segments of the markets think the ever-evolving Ukraine crisis may force the FOMC to sit on their hands this month.
Such a dovish outcome may offer some fleeting relief for global stocks, which have been battered by Europe’s worst security crisis since World War 2. However, as long as fears persist over escalating geopolitical tensions that contribute to stagflation concerns, risk-taking activities are expected to remain muted in the interim.
CRUDE: Russian Invasion Intensifies Oil and Gas Crisis
- Why are oil and gas prices soaring?
- Is there hope for a drop in energy prices?
- What do the charts of WTI and NatGas tell us?
In response to a worsening of geopolitical environment concerning Russia, Ukraine and the West, key commodity prices have been surging, not least crude oil and natural gas. We have also seen wheat and other grains rise sharply, while safe-haven flows into government bonds, gold and silver have sent their prices higher, too. But as Russia is the largest exporter of gas and the second largest exporter of crude oil, it is these markets that have been under the spotlight the most. So, why exactly are energy prices soaring and how should speculators approach and trade these markets?
Sanctions on Russia
Western sanctions on Russia have so far excluded energy shipments, but traders have pushed up oil and coal prices sharply higher anyway, with gas prices also remaining supported. Brent crude surged 9% Tuesday to rise north of $107 a barrel, while WTI jumped to $106.
The crude oil market was already tight, even before the invasion of Ukraine by Russia. But now there are concerns that because of the ongoing situation, foreign refiners are going to be very reluctant to buy crude oil from Russia, with some banks also refusing to finance shipments of Russian commodities. In effect, this is the same as an actual drop in Russian exports of crude oil. Moscow must find ways to continue selling its oil, otherwise there is the risk of an even bigger oil-price shock.
The unthinkable would be if fresh measures are introduced that would directly target oil and gas exports from Russia, or if the latter retaliates by turning off supplies of these commodities to its western neighbours in Europe. An energy-dependant Europe will want to avoid this situation, nearly at all costs. But traders are not taking any chances as fighting in Ukraine intensifies, while international payments to and from Russia become increasingly very difficult with the West’s decision to exclude several Russian banks from the SWIFT global financial messaging system.
Is there any hope for oil prices to fall back?
In short, there is very little hope for a massive oil-price slide in the short-term outlook, and in any case while the Ukraine situation remains perilous. But in the not-too-distant future, there is a possibility we might see prices fall back from these multi-year highs.
Let’s not forget that making the situation worse is the OPEC and its allies, including Russia of course. The group is likely to stick to their existing policy at Wednesday’s meeting of increasing output only gradually, by 400,000 barrels per day every month. The OPEC+ will likely suggest that Russia’s invasion of Ukraine has not affected the OPEC+ deal.
Ignoring the Ukraine-related price movements, until the OPEC releases more crude to the market, the chances of a prolonged period of oil-price weakness remains slim. Indeed, government measures such as Strategic Petroleum Reserve (SPR) releases are not having the intended impact, as we have already seen. The IEA’s decision to release 60 million barrels from reserves on Tuesday was like a drop in the ocean and failed to put a lid on prices.
Another hope for lower oil prices is the potential for Iranian oil to make a return, if there is progress in Tehran’s nuclear talks. But this is a slightly longer-term prospect.
What does the chart say as WTI takes out $100 barrier?
The big rally in oil prices has led to the breakdown of several resistance and psychologically-important levels, repeatedly unravelling the bears’ attempts to catch the top. Shorting oil is akin to playing with fire in this type of market environment and requires a strong set of technical skills and discipline. We would not recommend it for inexperienced traders, especially when prices are making higher highs and higher lows as they have been of late. Buying the dips might feel very uncomfortable at these elevated levels, but that has been the strategy that has undoubtedly worked so far and may continue to do so for a while yet. Only when we see a distinct reversal pattern should traders actively look for sell trades.
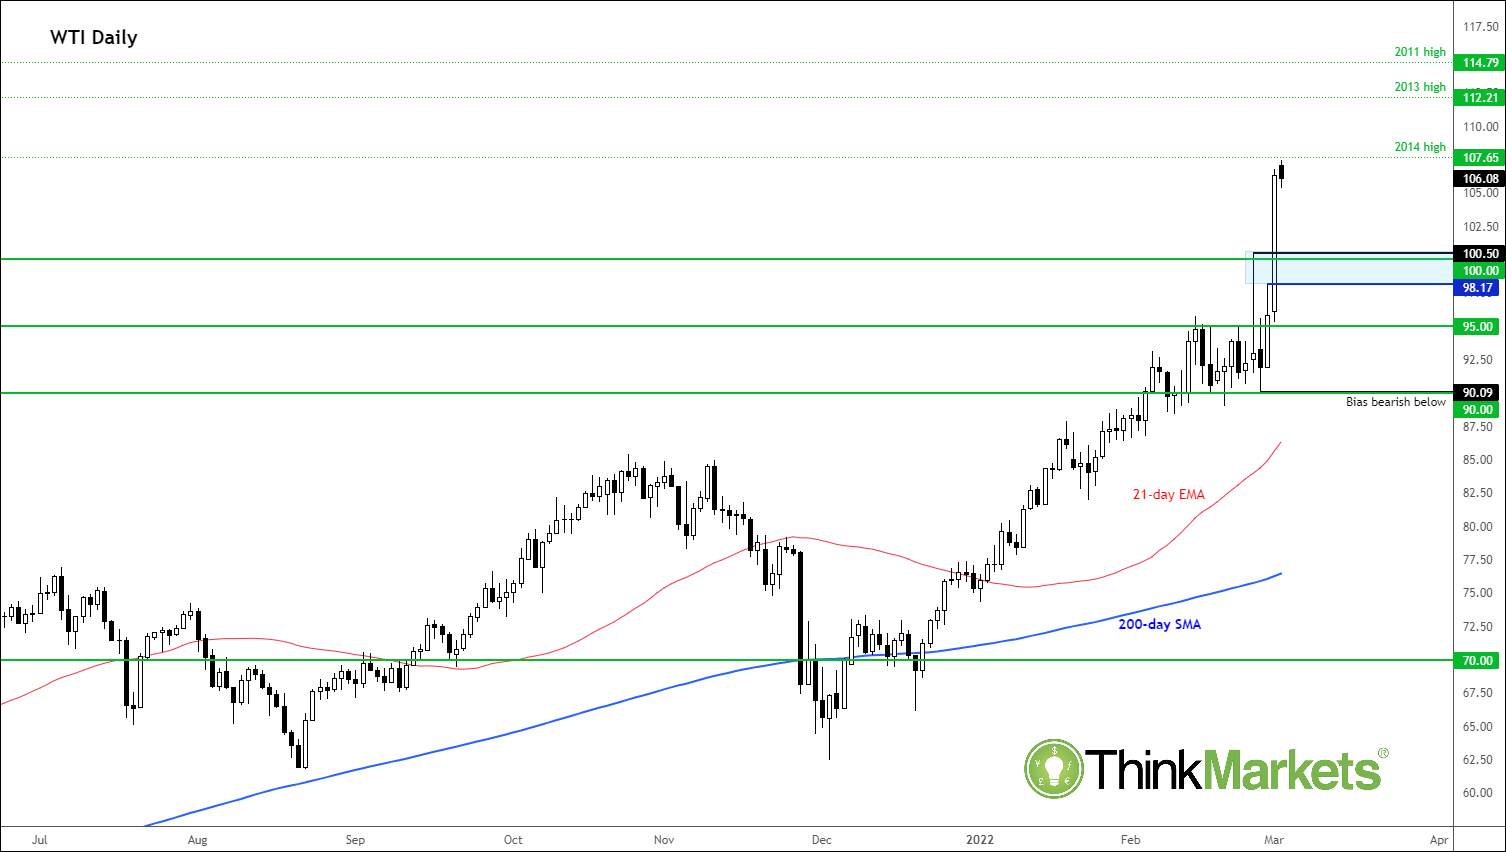
Indeed, with the $100 level broken decisively, the path of least resistance continues to remain to the upside for oil. Bullish traders have their eyes set on levels that had acted as major resistance in the past. Among them, $107.50ish was the high set in 2014, just before when the OPEC-US price war sent crude oil tumbling. Just because this level marks a prior peak doesn’t mean oil prices will find resistance here, as after all the fundamental picture is totally different now.
Above the 2014 peak is the net psychologically-important level of $110, around which we may see some profit taking. Thereafter are the 2013 and 2011 highs at $112.20 and $114.80, respectively, with the latter coming in just shy of the next psychological level of $115.00.
On the downside, levels that had previously offered resistance should offer at least some support, potentially providing bounceable trading opportunities. Some of these levels come in around the $100.50 to $98.00 range. The next level below this zone is at $95.00.
The last major low prior to the latest breakout was made around $90.00. This level is now the line in the sand. For as long as oil prices hold above $90.00, the technical bias would remain bullish. If and when this level is broken, or we see a similar reversal at higher levels first, then one can entertain the idea of shorting crude oil.
NatGas gearing up for a potential break out
Natural gas prices have remained supported amid the energy crunch in Europe and elsewhere, and in light of the invasion of Ukraine by Russia. Like crude oil, the path of least resistance is to the upside for NatGas. Unlike oil though, we haven’t seen a massive break out yet, but may well do, should Russia retaliate to western sanctions by turning off its gas supplies to Europe. The potential is therebefore for a breakout, and we would favour buying dips to support.
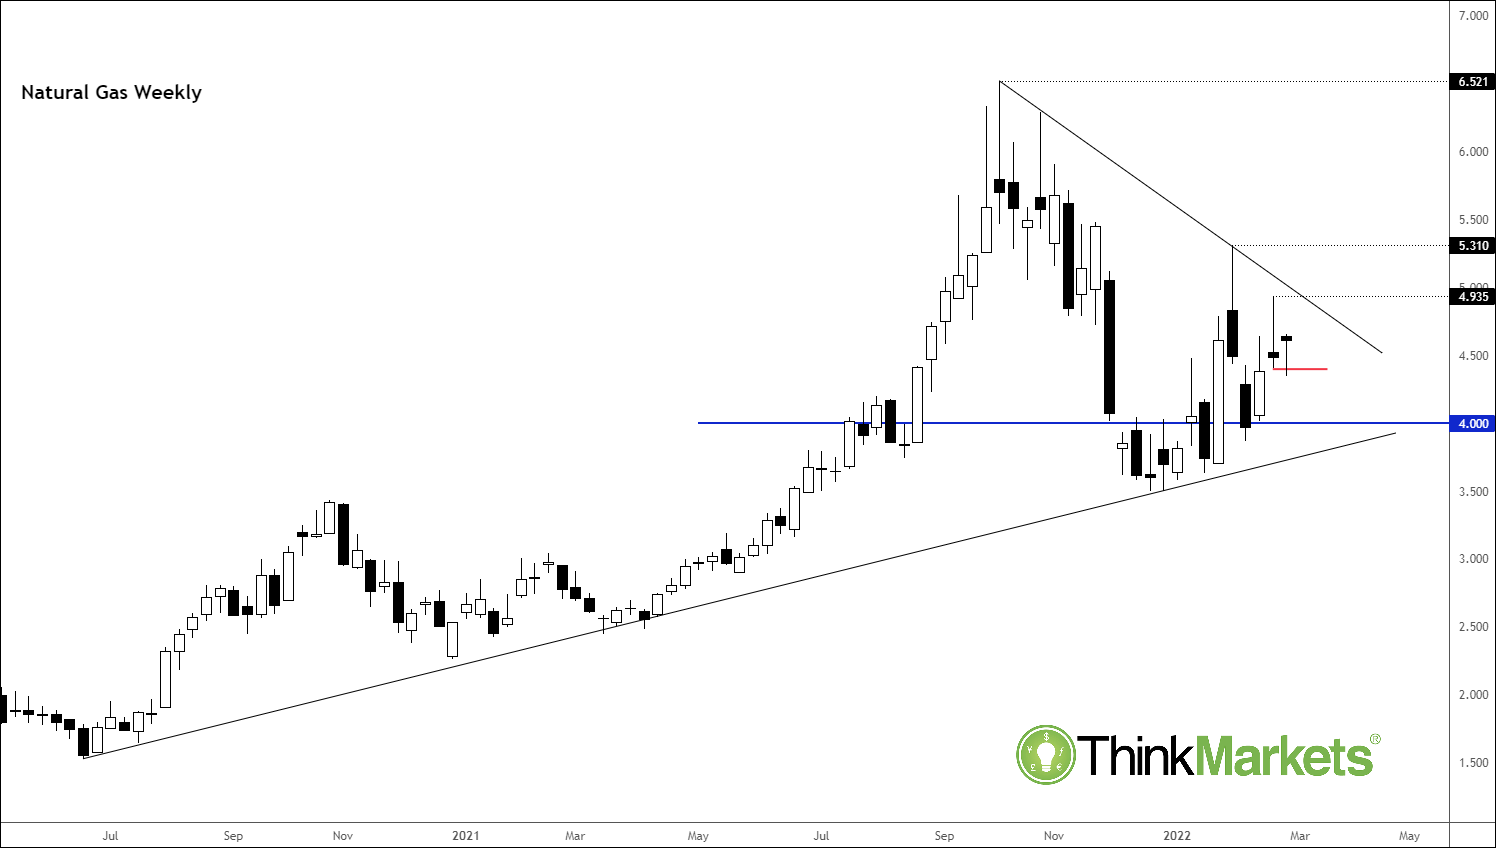
With last week’s inverted hammer candle failing to bring out the bears, it looks like NatGas is set for a short-squeeze rally in the coming days. Thus, any stops that might be resting above last week’s high just below $5.000 could be subject to a raid, leading to further technical buying above that zone. The January high at $5.310 is the next upside target, followed by last year’s peak at $6.521.
On the downside, a potential break below support at $4.500 could clear the way for technical selling towards the next support at $4.000, followed by the range low at $3.500 next.
Elliott Wave View: USDJPY Looking for Further Downside
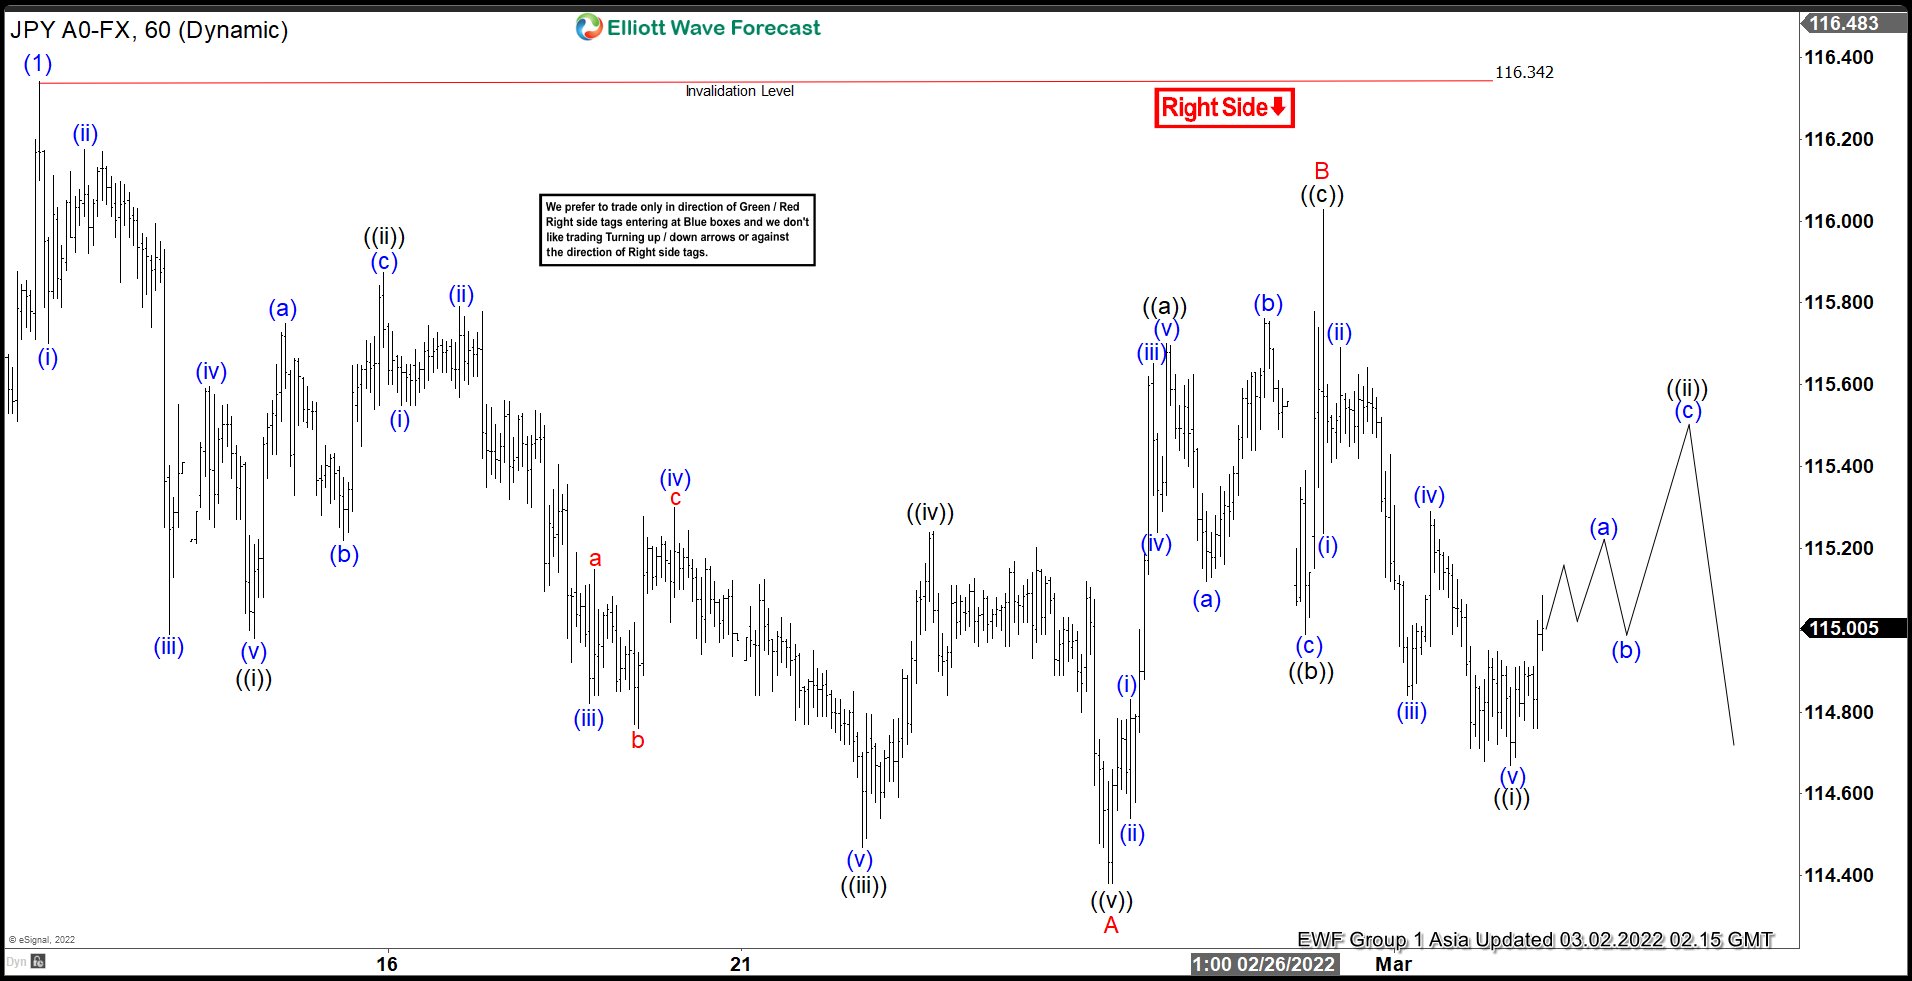
Short Term Elliott Wave View in USDJPY suggests the rally to 116.34 ended wave (1) on February 10, 2022. Pair has since turned lower in wave (2) with internal subdivision as a zigzag Elliott Wave structure. Down from wave (1), wave ((i)) ended at 114.98 and rally in wave ((ii)) ended at 115.87. Pair then resumes lower again in wave ((iii)) towards 114.47, wave ((iv)) rally ended at 115.24, and wave ((v)) lower ended at 114.38. This completed wave A in higher degree.
Wave B rally completed at 115.67 with internal subdivision as a zigzag. Up from wave A, wave ((a)) ended at 115.7, pullback in wave ((b)) ended at 115.07, and wave ((c)) of higher ended at 115.67. This completed wave B in higher degree. Down from wave B, wave ((i)) ended at 114.67. Expect pair now to rally in wave ((ii)) to correct cycle from February 28 high before it resumes lower. Near term, as far as pivot at 116.34 high stays intact, expect rally to fail in the sequence of 3, 7, or 11 swing for further downside. Potential target lower is 100% – 161.8% Fibonacci extension of wave A which comes at 112.8 – 114.
USDJPY 1 Hour Elliott Wave Chart
Euro Probably Becoming Ever More Vulnerable
Markets
The war in Ukraine yesterday again triggered an outright risk-off session. The uncertainty on how far the conflict will go is evidently the first concern. However, from an economic point of view, markets fear a new wave of long-lasting supply chain issues, in sectors like energy and agricultural commodities. Western firms breaking the links with subsidiaries in Russia will also come at cost.
The impact both on growth and on inflation are almost impossible to assess as of yet. Even so, markets are ‘gradually’ captured by some kind of stagflationary fear. A persistent rise in oil and (agricultural) commodities is an obvious visualization of rising costs of the conflict. Oil this morning, jumped north of $110 p/b!! European equities yesterday lost up to 4.0%! US indices lost 1.55% (S&P) to 1.76% (Dow).
Bond markets clearly were occupied with safe have considerations and the negative impact on growth. US yields declined between 12.3 bps (5-y) and 5.6 bps (30-y). As was the case on Monday, the decline was solely due to a collapse in real yields (10-y -17 bps !!!). Inflation expectations rose modestly (7.5 bps). Moves in the European/German market were even more hefty. German yields declined 24.5 bps for the 5-y, 20.5/7 for the 10/2-y sector and ‘only’ 16.5 bps for the 30-y. T
The market clearly concluded that there is a big chance for the ECB to delay/or at least take a wait-and-see approach when communicating at next week’s policy meeting. The market currently sees only limited room for the ECB to frontload policy tightening. A positive deposit rate/policy rate end 2022 now looks quite far away even as inflationary pressures are rising sharply (again upward surprises in Italy 6.2% Y/Y and Germany 5.5% Y/Y). For now we don’t draw any firm conclusions. The US Manufacturing ISM remains solid (58.6 from 57.6), but evidently this was of little importance for trading.
On the FX markets, euro weakness and a further building of pressure on the CE currencies where the most striking features. EUR/USD yesterday evening already filled bids just below 1.11 (close 1.1125). The USD DXY index rallied to close at 97.58 nearing the cycle top of 97.74. Gains in the yen were modest (USD/JPY close at 114.92). A sharp rise in commodity prices evidently isn’t good news for the Japanese economy. The Swiss franc currently is one of the preferred safe havens with EUR/CHF testing the 1.02 area. The forint (close EUR/HUF 376.25) and the zloty (close EUR/PLN (4.75) both touched all-time/multi-year lows against the euro even as both centrale banks indicated they are ready to intervene in the FX market.
This morning, Asian equities mostly remain under pressure (Nikkei -1.6), Korea and Australia being small exceptions. The dollar outperforms (DXY 97.55) with USD/JPY regaining 115.(15). EUR/USD is again testing the 1.11 barrier. US yields continue yesterday’s decline especially at shorter maturities.
Later today, global risk sentiment will remain the main driver for trading. Even so, the calendar is interesting too, with the EMU January preliminary CPI, the ADP labour market report, Fed Powell testifying before the House and the OPEC+ meeting. Fed Powell will reiterate that the Fed will do its job in containing inflation starting hiking rates this month. Question is whether this will slow the safe haven bid for US bonds at this stage. EMU inflation is at risk of beating expectations for a 0.8% M/M and 5.6%, but we doubt it will change the established trend. In this context, the euro probably is becoming ever more vulnerable. A sustained break blow 1.11 could trigger further stop-loss selling with 1.10 a next intermediate reference.
News Headlines
The World Bank is preparing a $3bn support package for Ukraine for the coming months. It includes a fast-disbursing budget support operation for at least $350 million, followed by $200 million in fast-disbursing budget support for health and education. The IMF meanwhile while consider Ukraine’s request for emergency money with little strings attached through the Rapid Financing Instrument as early next week. The Washington-based fund said it is also continuing to work on a review of Ukraine’s 2020 loan of which $2.2bn remains to pay out.
Oil Rallies on Ukraine War, as OPEC Meets
The barrel of US crude jumped more than 11.5% yesterday and soared another 2% to $111 mark this morning, as the cruelty of the Ukrainian war pushes the US to ban the purchase of Russian oil, and to release – with its allies, circa 60 million barrels from their strategic reserves.
But the strategic reserves will help boost oil supply for only some time; it’s not a durable solution. Therefore, today’s OPEC meeting is critical.
So far, the cartel confirmed that they remain committed to the OPEC+ deal with Russia, and they are not expected to change their production boost plans despite the Ukrainian war. f that’s the case, we shall see the positive pressure on oil prices intensify above the $100 per barrel level, and we could see the barrel of US crude advance toward the $125/150 range.
That’s a big problem, globally, that could gather some reaction from the government heads, as Biden for example has been calling OPEC to increase production since months now.
What’s next?
It’s very difficult to predict what will happen, but at some point, OPEC countries may decide to let go of the OPEC+ alliance, if the Russian oil gets significantly banned. Russian oil is already trading with a significant discount to WTI and Brent crude, as refineries and trading houses are turning away from Russian crude purchases in fear and in preparation of future sanctions.
Exxon Mobil has finally announced to shut down production in Russia as well. The company said it will begin a phased withdrawal from the giant Sakhalin offshore oilfield that it has operated since 1995, saying that they ‘deplore Russia's military action that violates the territorial integrity of Ukraine and endangers its people.’ TotalEnergies, which holds stake in Russia’s biggest LNG producers said, on the other hand, that it won’t get out of Russia for now, but they will stop investing in new projects. The announcement didn’t prevent the share price from falling further.
As a result, OPEC will be increasingly under a political pressure, as the Ukrainian war is becoming a global crisis, and the indirect implications are felt all across the world, particularly via the surging oil and commodity prices, and the world leaders will put all their weight behind it.
Fingers crossed for today’s OPEC+ decision, but again, don’t get your expectations up; OPEC won’t magically decide to come to the rescue.