

Sample Category Title
SNB Zurbruegg: Important to keep rate differential to avoid excessive Franc appreciation
SNB Vice Chairman Fritz Zurbruegg said in a l'agefi interview, "Switzerland has always had lower rates than others since the financial crisis. It is very important for us to keep this differential to avoid an excessive appreciation of the Swiss franc."
"As soon as the situation requires it, we'll raise our interest rate," he said. But, "we'll keep this ability to intervene in foreign exchange markets if needed to ensure price stability."
"Experience has shown that having some leeway within the range we associate with price stability has worked well in the past in Switzerland," he added. "We are a small, open economy with capital flows linked to our safe-haven status. We cannot always achieve a precise target and inflation can fluctuate in the short term because we aim for the medium term."
Fed Mester: Russia invasion adding upside risk to inflation, downside risk to growth
Cleveland Fed President Loretta Mester said yesterday that Russia's invasion of Ukraine could push inflation up higher. "The unfolding event has implications for the economic outlook, adding upside risk to inflation even as it puts downside risks to the growth forecast," she said.
"The challenge facing Fed policymakers is how to recalibrate monetary policy, reducing the accommodation from the emergency levels needed earlier in the pandemic in order now to get inflation under control and at the same time sustain the expansion and maintain healthy labor markets," Mester added.
BoE Mann: Embedded inflation becomes a domestic problem
BoE MPC member Catherine Mann said yesterday, "we already have very rapid increase in oil prices... In the U.K., that it becomes embedded by virtue of the institution mechanism of the price cap" on domestic energy bills.
"That embeddedness becomes a domestic inflationary problem that we have to deal with on the monetary policy stage," she said.
"You only get inflation if businesses raise their prices. That's where it comes from. It doesn't come from wage settlements. It comes from businesses' capacity to raise their prices in a systematic way and sustain demand," she said.
BoE Saunders prefers to move rates quite quickly towards neutral
BoE MPC member Michael Saunders said yesterday, "the economy is in significant excess demand, and inflation expectations are not as well anchored as I would like."
"My preference is to move quite quickly towards a more neutral stance in order to prevent the recent trend of higher inflation expectations and rising pay growth from becoming more firmly embedded," he said.
However, he emphasized that his vote for 50bps hike in February "does not necessarily imply that I would vote for a 50 basis-point hike in the event that further tightening is required."
"All else equal, the case for policy to move in a larger step probably is greater when Bank Rate is clearly further away from the approximate level that, if maintained, would return inflation to target and keep it there," he added.
Technical Outlook and Review
DXY:
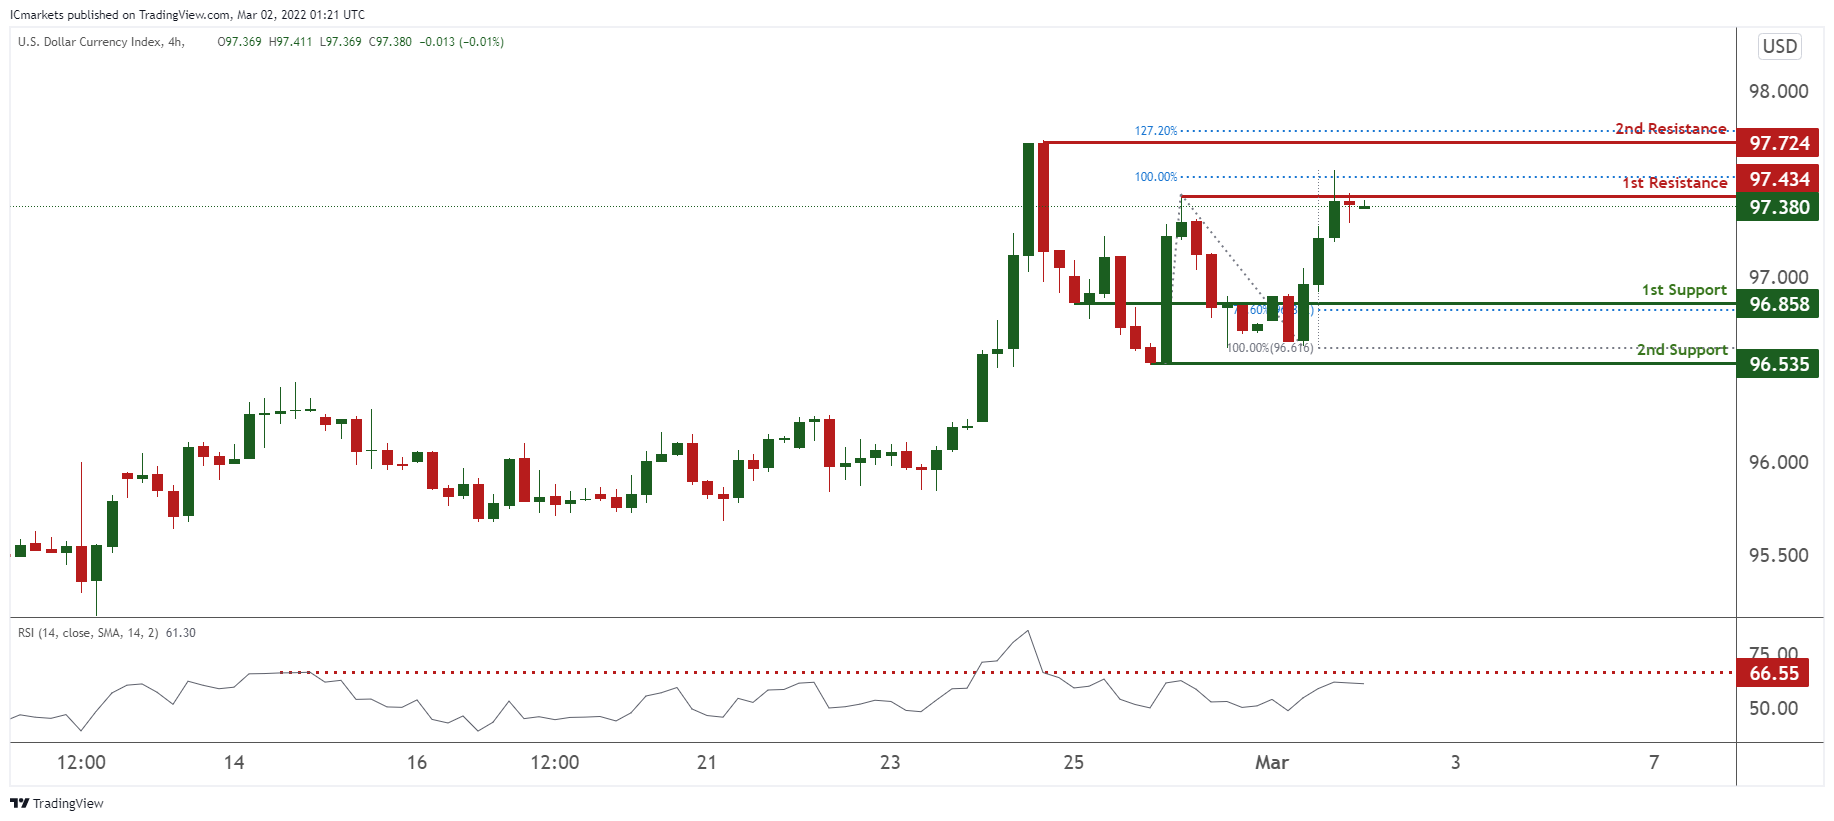
On the H4 timeframe, prices are at pivot and in line with a recent swing high. We see the potential for a dip from our 1st resistance at 97.434 in line with 100% Fibonacci extension towards our 1st support at 96.858 in line with 78.6% Fibonacci retracement. RSI is at a level where dips occurred previously and further supporting our bearish bias.
Areas of consideration:
- H4 time frame, 1st resistance at 97.434
- H4 time frame, 1st support at 96.858
XAU/USD (GOLD):
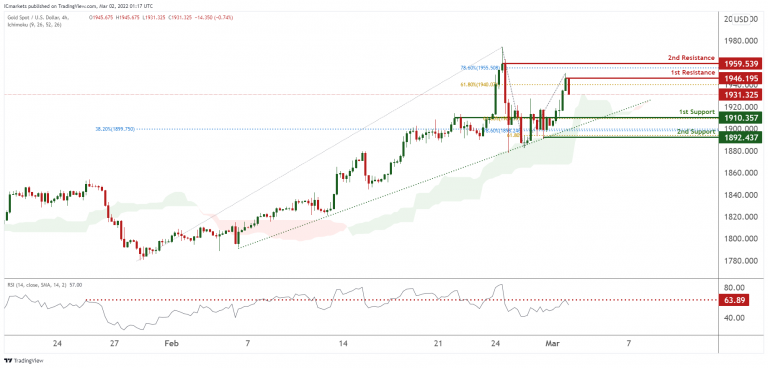
On the H4 chart, prices areon bullish momentum and abiding to our ascending trendline support. We see potential for a slight pullback from our 1st resistance at 1946.195 in line with 61.8% Fibonacci extension towards our 1st support at 1910.357 in line with 61.8% Fibonacci retracement. Our bullish bias is further supported by RSI being at levels where dips occurred previous and ichimoku clouds forecasting bearish momentum.
Areas of consideration:
- 4h 1st support at 1910.357
- 4h 1st resistance at 1946.195
GBP/USD
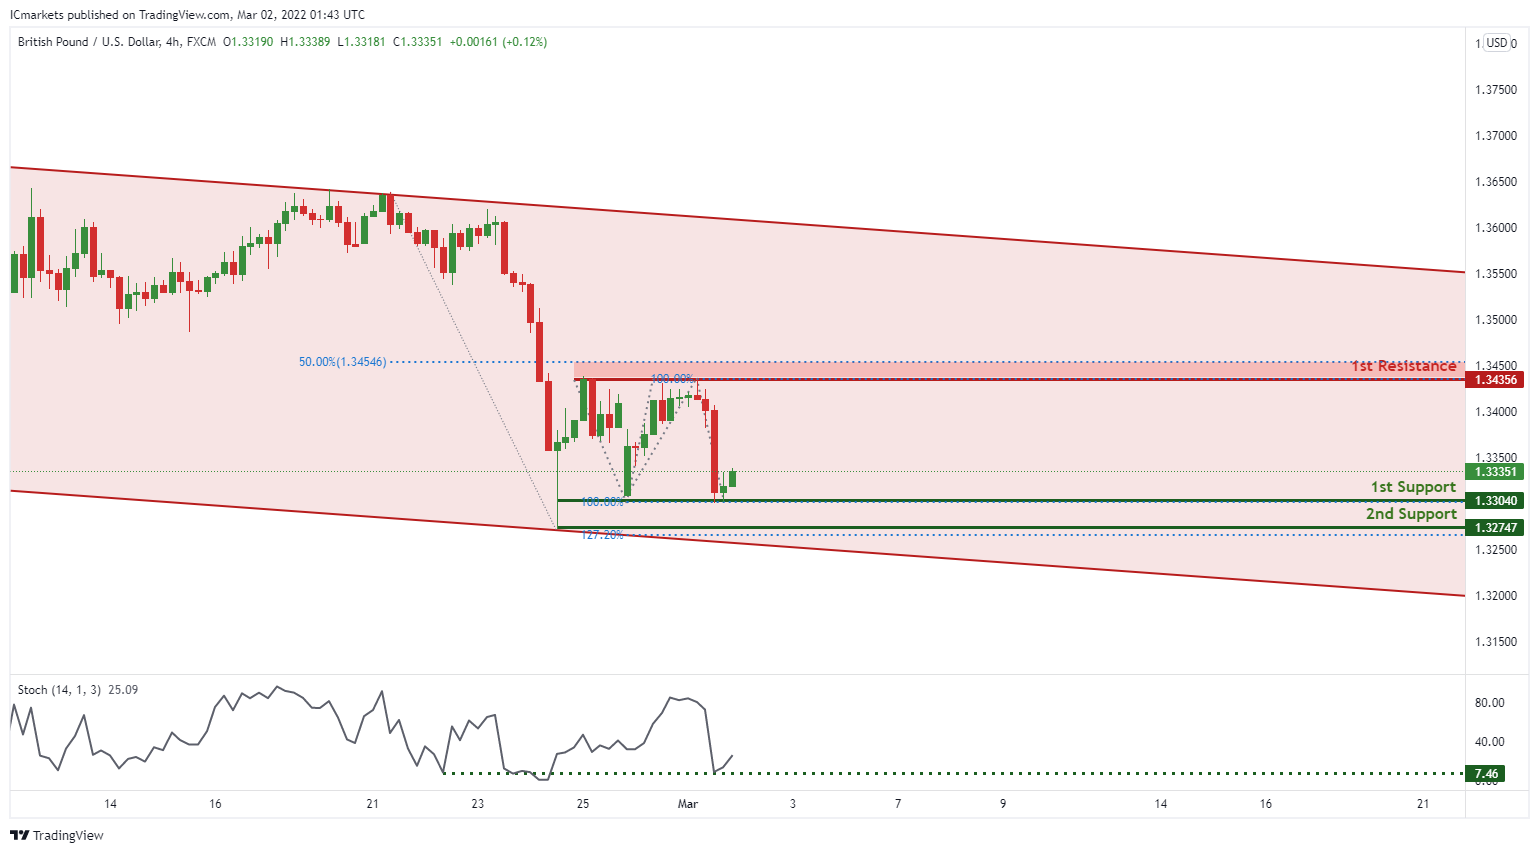
On the H4 chart , price is trading in a descending channel and near 1st support level of 1.33040 in line with 100% Fibonacci projection. Price can potentially go to the 1st resistance level of 1.34356 in line with 50% Fibonacci retracement and 100% Fibonacci projection. Our bearish bias is supported by stochastic indicator as it is nears support level
Areas of consideration
- H4 1st resistance at 1.34356
- H4 1st support at 1.33040
USD/CHF:
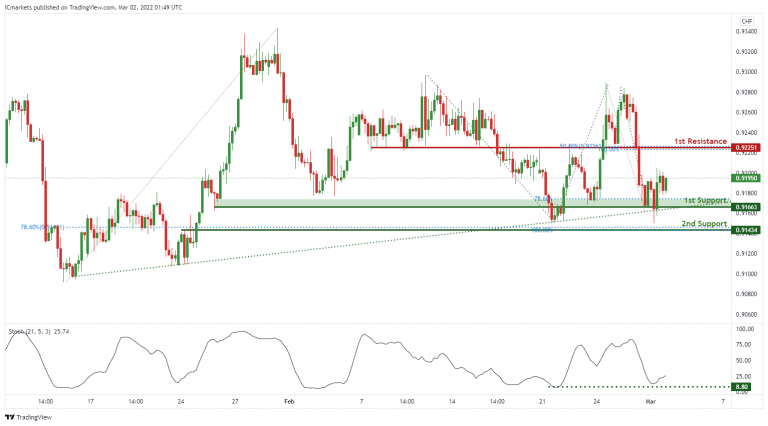
On the H4, price is abiding by an ascending trendline and near 1st support level of 0.91663 in line with 78.% Fibonacci projection. Price can potentially bounce to the 1st resistance level of 0.92251 in line with 50% Fibonacci retracement and 100% Fibonacci projection. Our bullish bias is supported by the stochastic indicator as it is at support level.
Areas of consideration
- 1st support level at 0.91663
- 1st resistance level at 0.92251
EUR/USD :
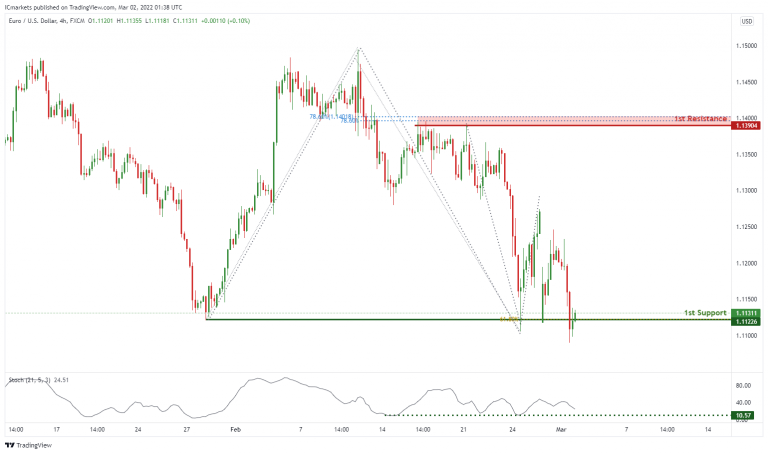
On the H4 chart price is near 1st support level of 1.11226 in line with 61.8% Fibonacci projection. Price can potentially go to the 1st resistance level of 1.13904 in line with 78.6% Fibonacci retracement and 78.6% Fibonacci projection. Our bullish bias is supported by the stochastic indicator as it is near support level.
Areas of consideration :
- H4 1st support at 1.11226
- H4 1st resistance at 1.13904
USD/JPY
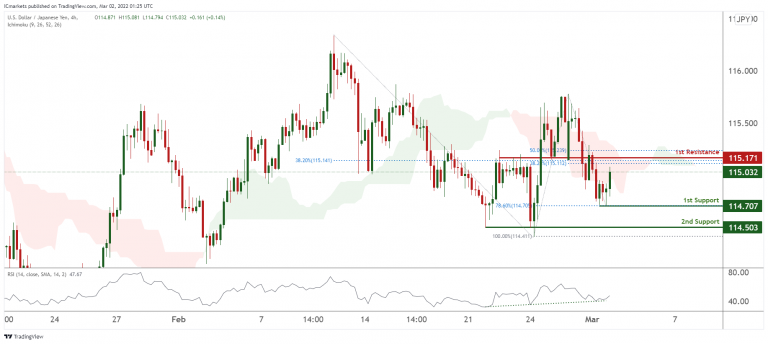
On the H4 timeframe, prices have recently bounced off a strong graphical overlap and also 1st support. We see the potential for further bullish continuation from our 1st support at 115.707 in line with 78.6% Fibonacci retracement towards our 1st resistance at 115.171 which is an area of Fibonacci confluences. Our bullish bias is further supported by ichimoku forecasting green clouds and RSI showing bullish momentum.
Areas of consideration:
- H4 time frame, 1st resistance at 115.171
- H4 time frame, 1st support at 115.707
AUD/USD:
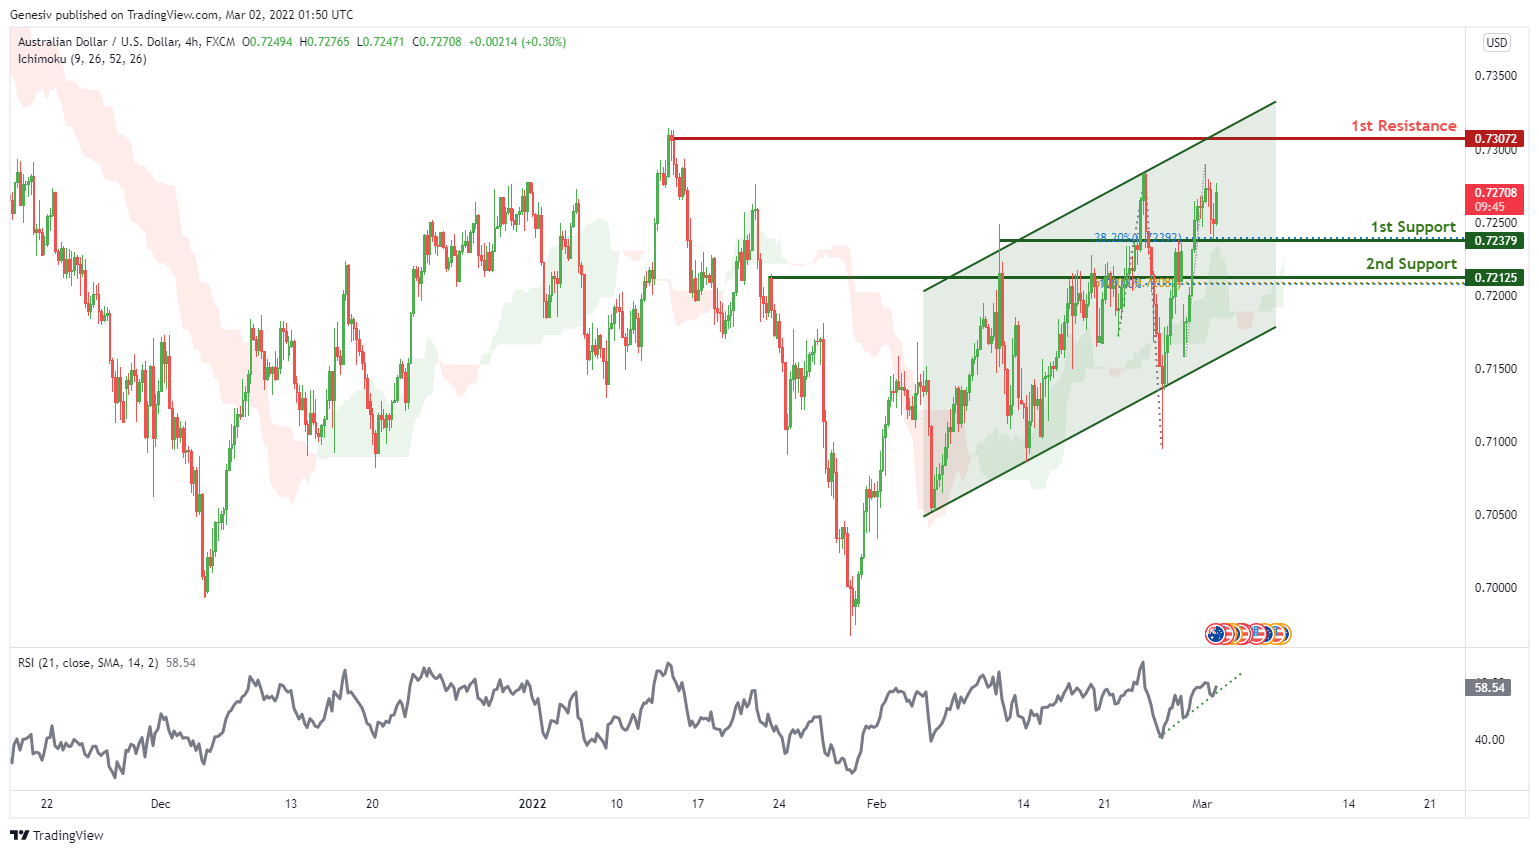
On the H4 chart, prices are moving along the ascending channel. We see potential for a bullish continuation from our 1st support at 0.72379 in line with 38.2% Fibonacci retracement and towards our 1st resistance at 0.73072 which is also the graphical swing high level . Alternatively, price can potentially dip to the 2nd support level at 0.72125 in line with 61.8% Fibonacci retracement and 100% Fibonacci projection. Our bullish bias is further supported by RSI as it is abiding by an ascending trendline thus showing bullish momentum . Moreover our bias is further supported by the ichimoku cloud indicator as price is trading above the clouds.
Areas of consideration :
- H4 1st support at 0.72379
- H4 1st resistance at 0.73072
NZD/USD:
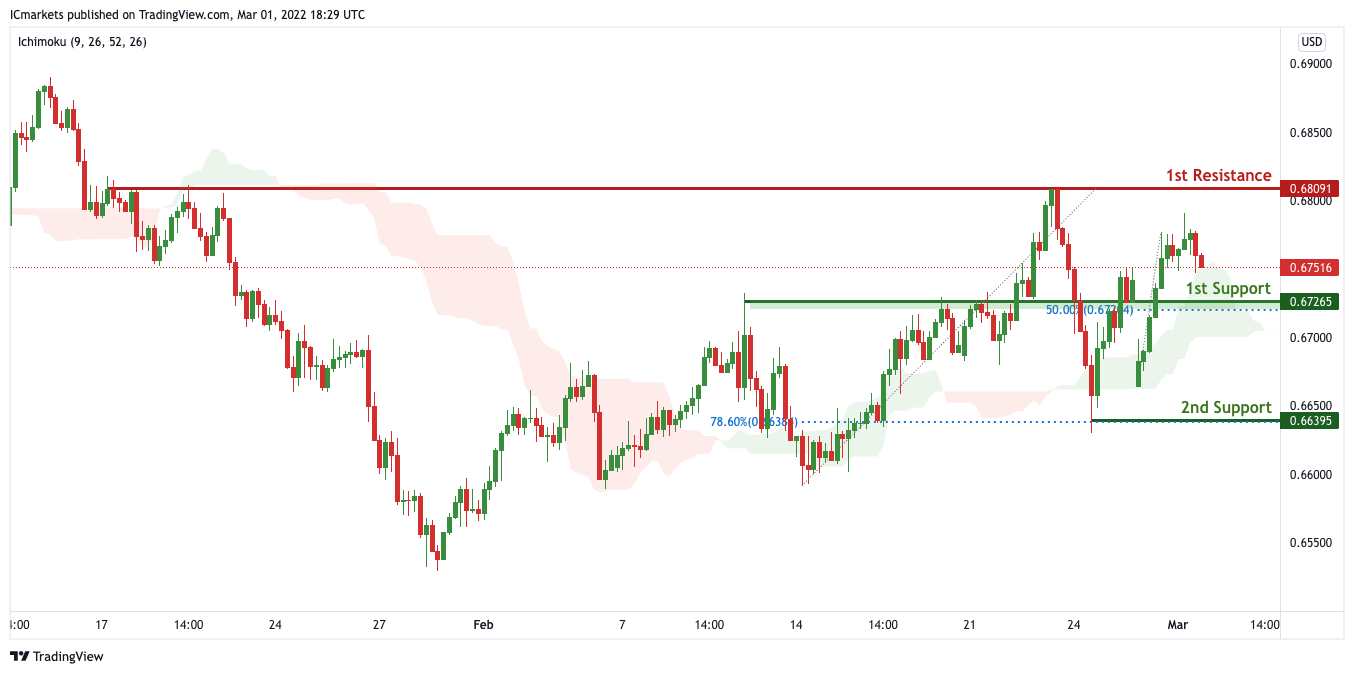
On the H4 chart, price is near 1st support level of 0.67265 in line with horizontal overlap support. Price can potentially rise to the 1st resistance level of 0.68091 in line with the horizontal swing high resistance. Alternatively, price may break 1st support and head for 2nd support at 0.66395. Our bullsh bias is supported by how price is expected to bounce off the support of the ichimoku cloud.
Areas of consideration:
- H4 time frame, 1st resistance at 0.68091
- H4 time frame, 1st support at 0.67265
USD/CAD:
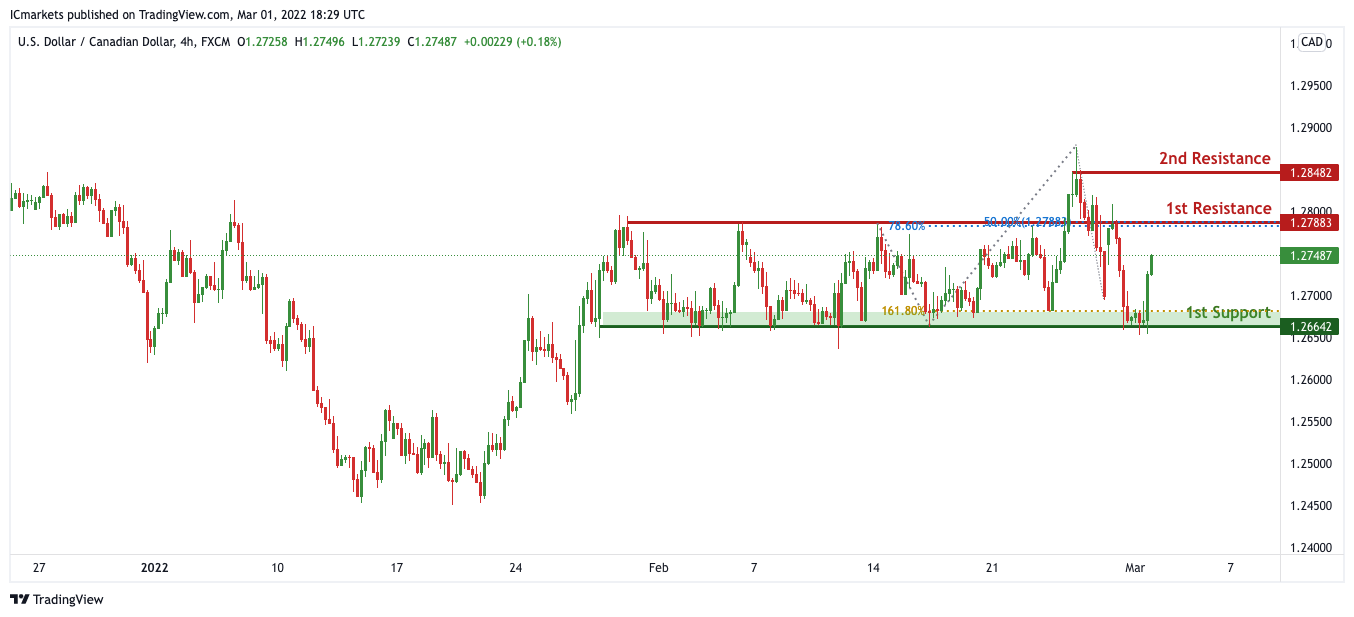
On the H4, price is ranging in between our 1st support and 1st resistance. With no clear indication of where price is heading at this current juncture, We have a bias that price will continue to range within our support and resistance of 1.26642 and 1.27883 respectively.
Areas of consideration:
- H4 time frame, 1st support at 1.26642
- H4 time frame, 1st resistance at 1.27883
OIL:
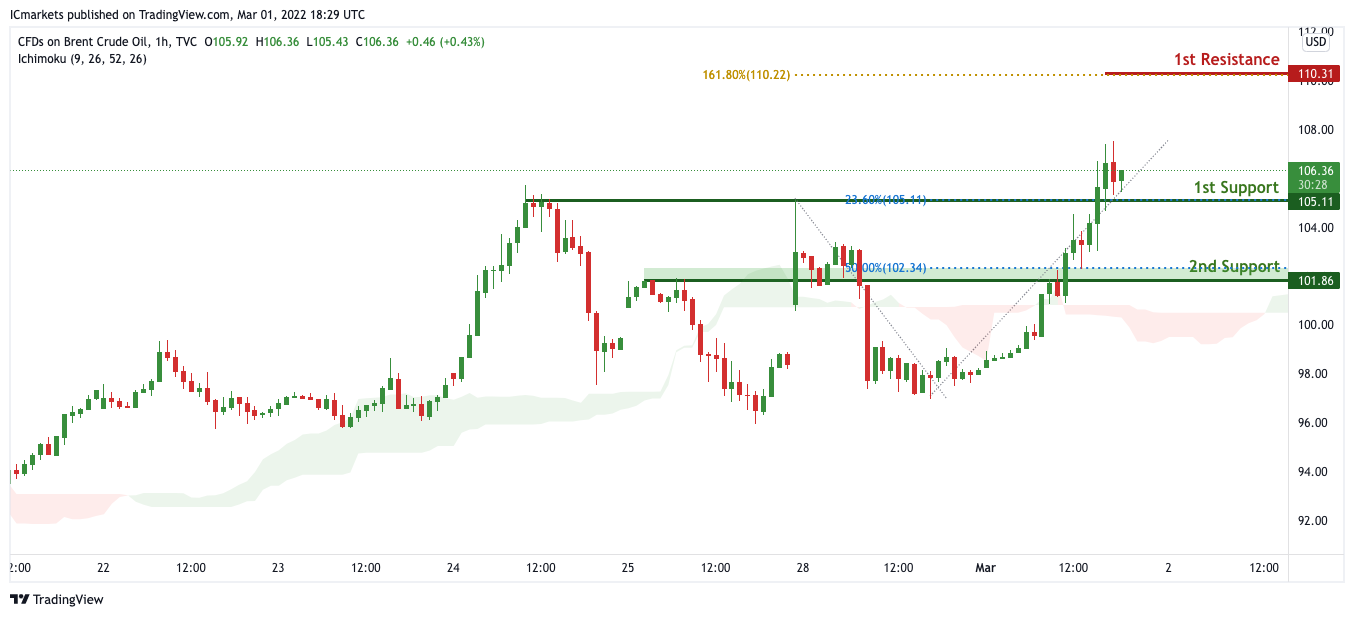
On the H4 chart, price is near 1st support level of 105.11 in line with horizontal overlap support and 23.6% Fibonacci retracement. Price can potentially rise to the 1st resistance level of 110.31 in line with the 161.8% Fibonacci extension level. Alternatively, price may break 1st support and head for 2nd support at 101.86. Our bullsh bias is supported by how price is expected to bounce off the support of the ichimoku cloud.
Areas of consideration:
- H4 time frame, 1st resistance of 110.31
- H4 time frame, 1st support of 105.11
Dow Jones Industrial Average:
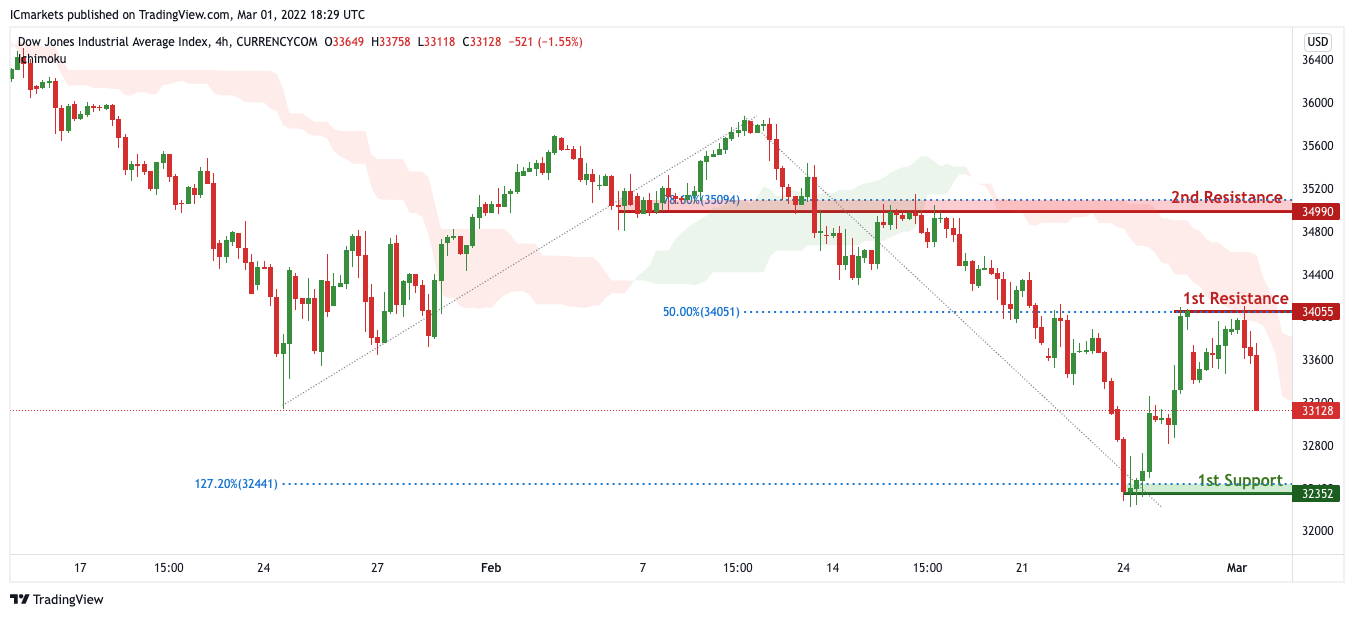
On the H4 timeframe, We see the possibility of bearish continuation from our 1st resistance at 34055 in line with horizontal overlap resistance towards our 1st support at 32352 in line with the horizontal swing low support. Alternatively, price may break 1st resistance and head for 2nd resistance at 34990 in line with the 78.6% Fibonacci retracement level. Our bearish bias is further supported by how price is moving below the ichimoku cloud
Areas of consideration :
- H4 1st support at 32352
- H4 1st resistance at 34055
Crude Oil Price Clears $100, Why Bulls Are Not Done Yet
Key Highlights
- Russia-Ukraine tension pushed oil price above $100.
- It broke a major bearish trend line at $90.00 on the monthly chart.
- EUR/USD is struggling to stay above the 1.1120 support.
- The US ADP Employment could increase 388K in Feb 2022.
Crude Oil Price Technical Analysis
In the past few months, crude oil price saw a major increase above $75.00 against the US Dollar. The price surpassed the $80.00 level to move into a positive zone.
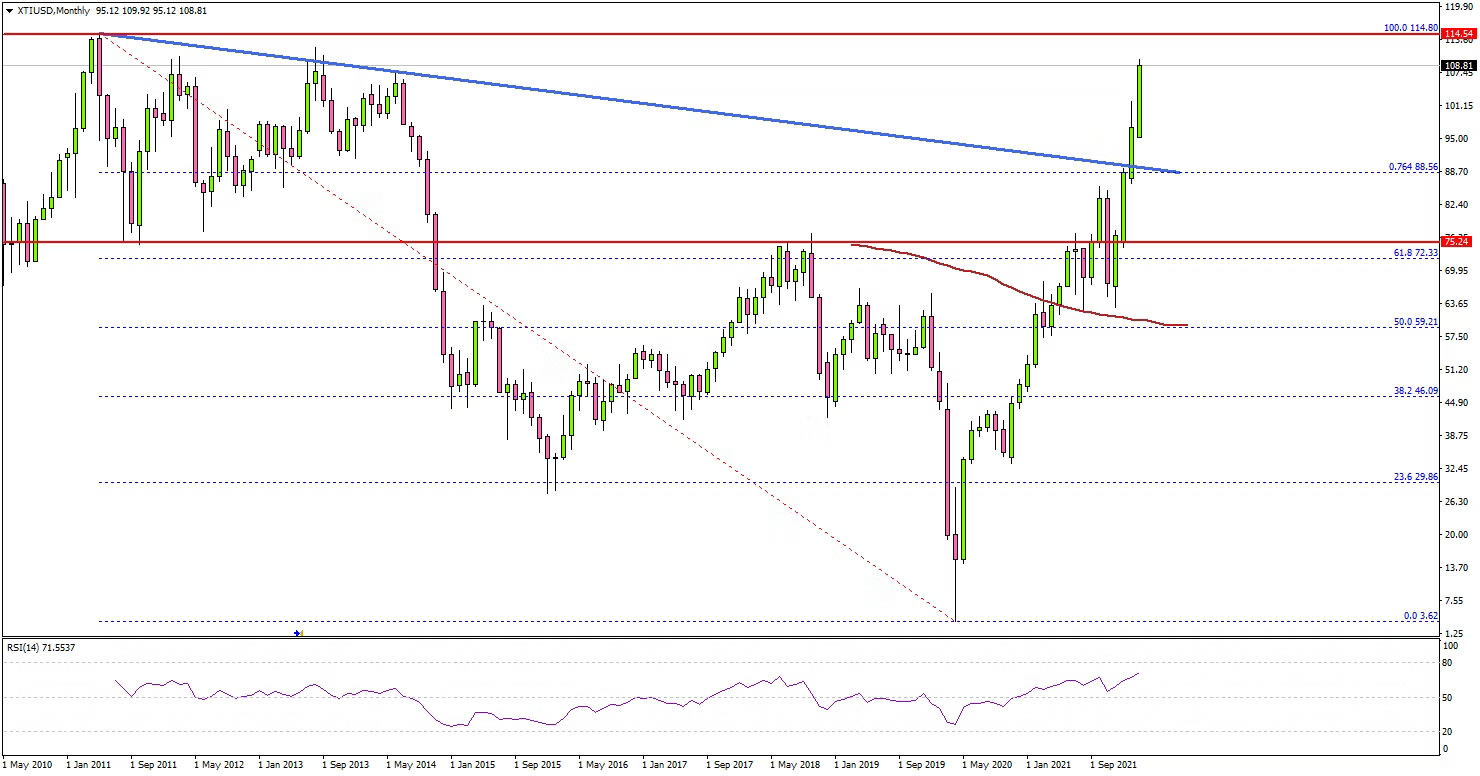
Looking at the monthly chart of XTI/USD, the price settled above the $90.00 level and the 100-month simple moving average (red). There was also a break above a major bearish trend line with resistance at $90.00.
The price gained pace above the 76.4% Fib retracement level of the downward move from the $114.80 swing high (formed in May 2011) to $3.62 swing low.
It even cleared the $100 barrier. It seems like the bulls are now aiming the 2011 high swing high near $114.80. Any more gains might call for a test of the $120.00 level in the near term.
On the downside, $98.00 level is a short-term support. The main trend support seems to be forming near the $75.00 level on the monthly chart, where the bulls might continue to take a stand.
Looking at EUR/USD, the pair extended decline in the past few days and the bulls are now struggling to protect the 1.1120 support.
Economic Releases to Watch Today
- Germany’s Unemployment Change for Feb 2022 - Forecast -23K, versus -48K previous.
- Germany’s Unemployment Rate for Feb 2022 – Forecast 5.1%, versus 5.1% previous.
- US ADP Employment Change for Feb 2022 - Forecast 388K, versus -301K previous.
- BoC Interest Rate Decision – Forecast 0.5%, versus 0.25% previous.
Bank of Canada to start rate hike cycle
Despite the geopolitical mess across the Ukrainian borders and growing fears about its global economic impact, the Bank of Canada (BoC) is expected to hike its benchmark interest rate on Wednesday at 15:00 GMT. Local developments could well justify the much-awaited rate increase, though a hawkish communication is more likely to trigger a new bullish wave in the Canadian dollar than an aggressive boost in rates.
A March rate hike looks to be a done deal
The BoC defied rate hike expectations in January, keeping its borrowing costs stable at a record low of 0.25% in the face of the omicron uncertainty. Its communication, however, was quite directional, with the governor Tiff Macklem expressing the view that a rate increase is inevitable in the coming months in an economy which operates at full capacity. Having removed its rate guidance as well, there is little doubt the central bank could hold back this time.
While the world learns to live with the pandemic, the Russian-Ukrainian political tensions opened out of the blue a new, more depressing chapter in global history. The nonstop exchange of sanctions and countermeasures between Russia and Ukraine’s West allies following Moscow’s invasion in Ukraine last week is getting more intense day by day, raising alarms about the already heightened inflation and boosting fears for another bitter global economic shock as Russia is a key source of grains, energy, and metals.
An aggressive rate hike may not happen
Hence, global economic uncertainties will come once again to debate the central bank’s tightening plans this week given Canada’s dependence on international trade. Policymakers, however, may not push back this time. Actually, domestic factors could overshadow external risks as inflation sits at a three-decade high of 5.1% y/y as of January, more than twice the central bank’s 2.0% midpoint target, and could sail further up as the geopolitical noise across the Ukrainian borders could add to the supply chain issues. Home prices followed higher too in the same month, and rising energy prices could even be beneficial for Canadian oil exporters as long as the energy sector is not drastically involved in the Ukrainian crisis.
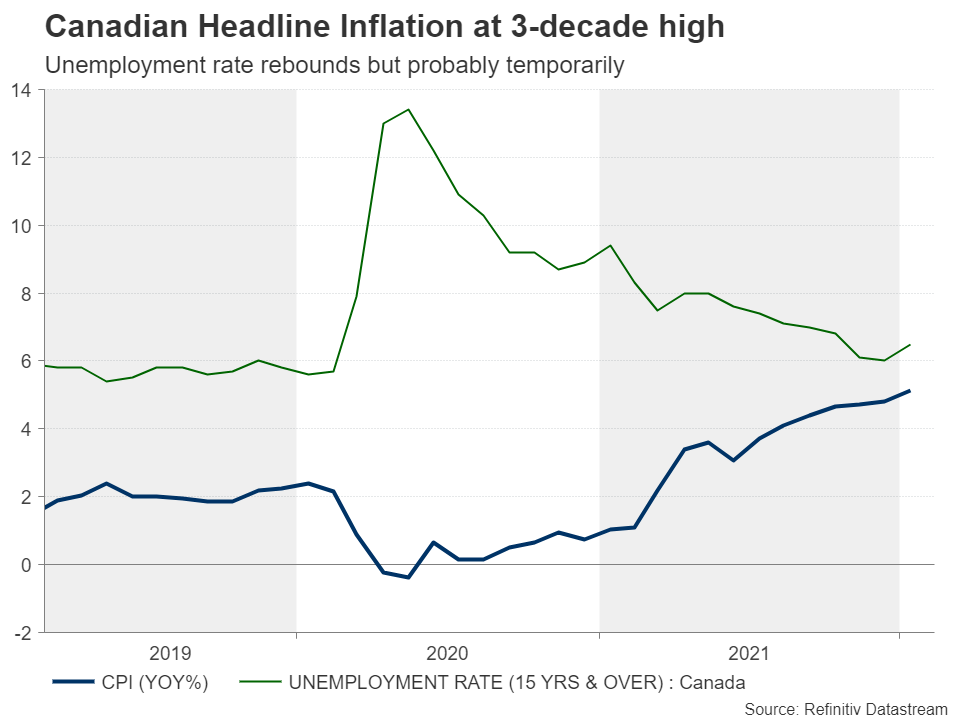 Of course, the rebound in the unemployment rate, which edged up to 6.5% in January - the highest since November –, and the loss of 200k job positions have upset investors, though that hiccup in the labor market is probably an outcome of the latest omicron restrictions, which have already been scaled down.
The above is justifying investors’ forecast for a 25 bps rate hike, which futures markets fully price in. There is a minority of investors who are betting for a more aggressive 50bps rate increase, though given the uncertain geopolitical developments, the BoC will probably decide to play it safe for now and start its rate hike cycle with a normal rate increase to 0.50% from 0.25%.
Loonie outlook
Turning to FX markets, the loonie has survived the Ukrainian crisis with softer injuries relative to European currencies, and higher oil prices continued to defend it against the US dollar's strength.
Investors are certain about the rate announcement, therefore the policy decision itself may not boost the loonie unless the central bank reiterates it will forcefully adjust “monetary policy if needed to address whatever situation arises” as BoC debuty governor Tim Lane stated two weeks ago. If such comments endorse the six rate hike scenario priced in markets for this year, the loonie could drift higher.
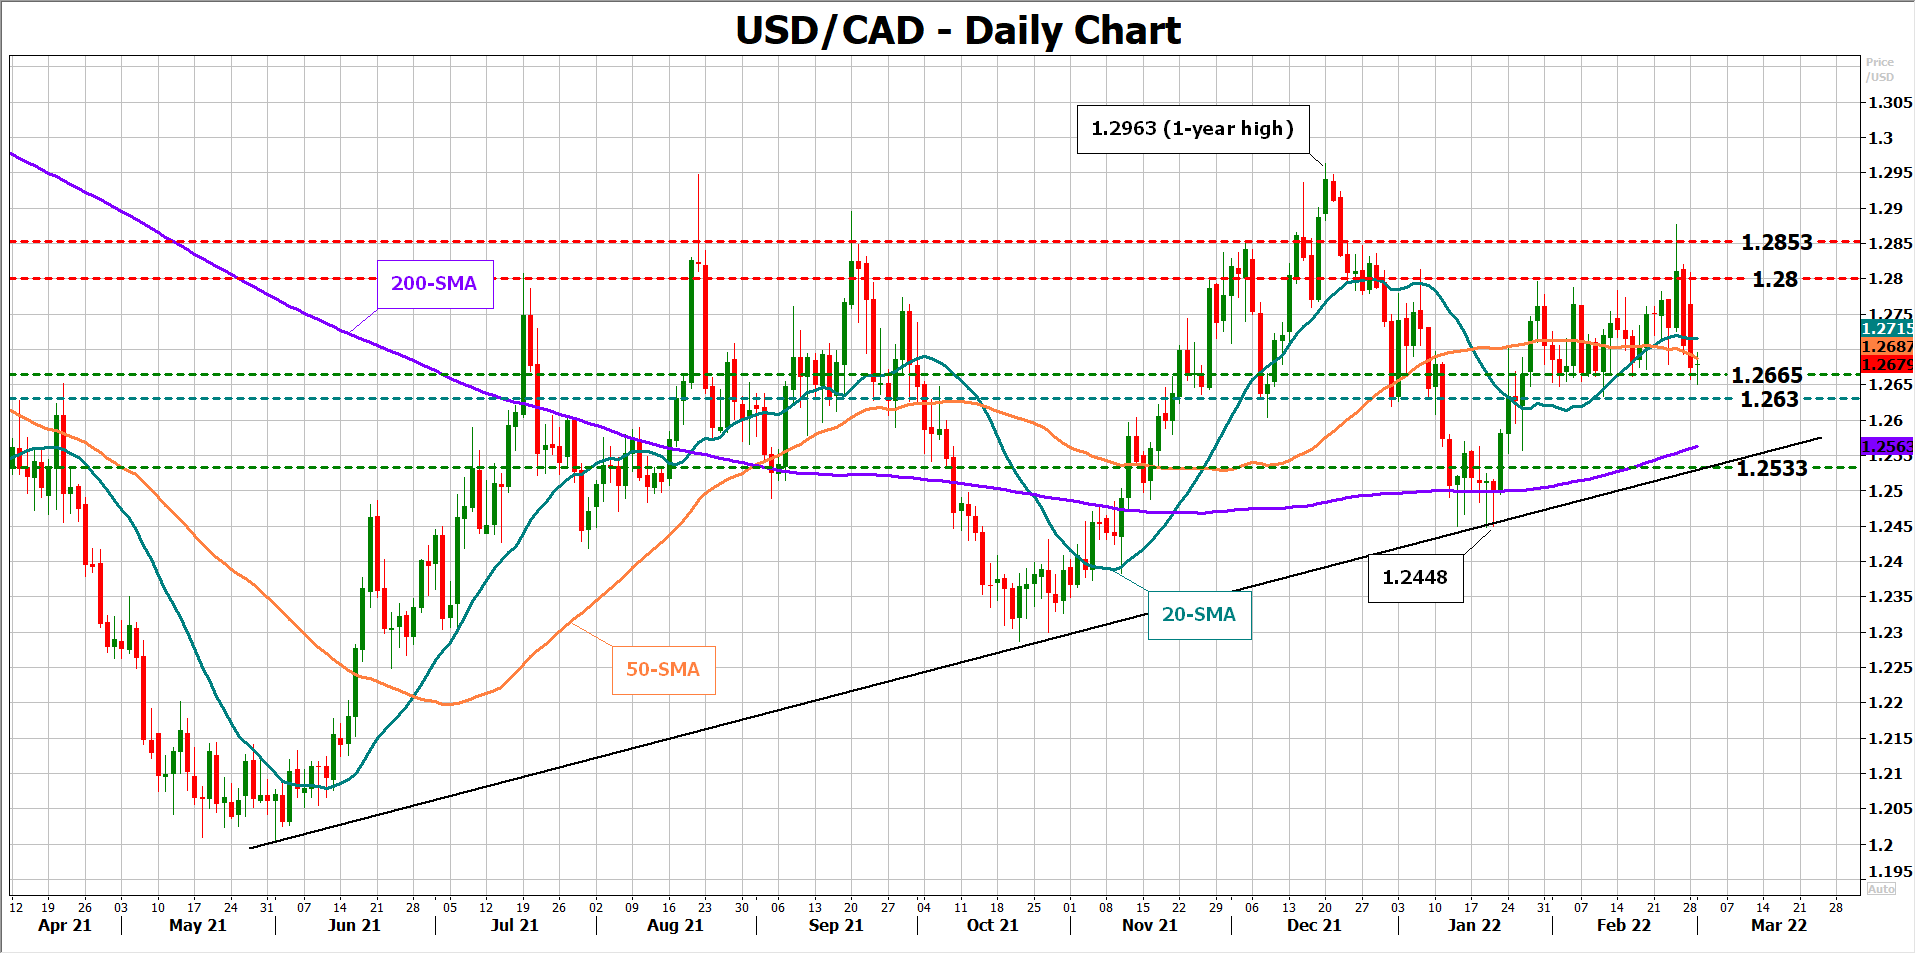
Notably, policymakers also revealed during January’s gathering that they are considering to start selling government bonds (quantitative tightening) once the first rate hike is delivered . Therefore, any positive guidance on that could further power the loonie given that the BoC has never attempted to shrink its balance sheet before. If that turns out to be the case, it would be interesting to see whether the key support region of 1.2665 – 1.2630 in dollar/loonie can collapse, clearing the way towards the 200-day simple moving average (SMA) at 1.2560 and the ascending trendline at 1.2550.
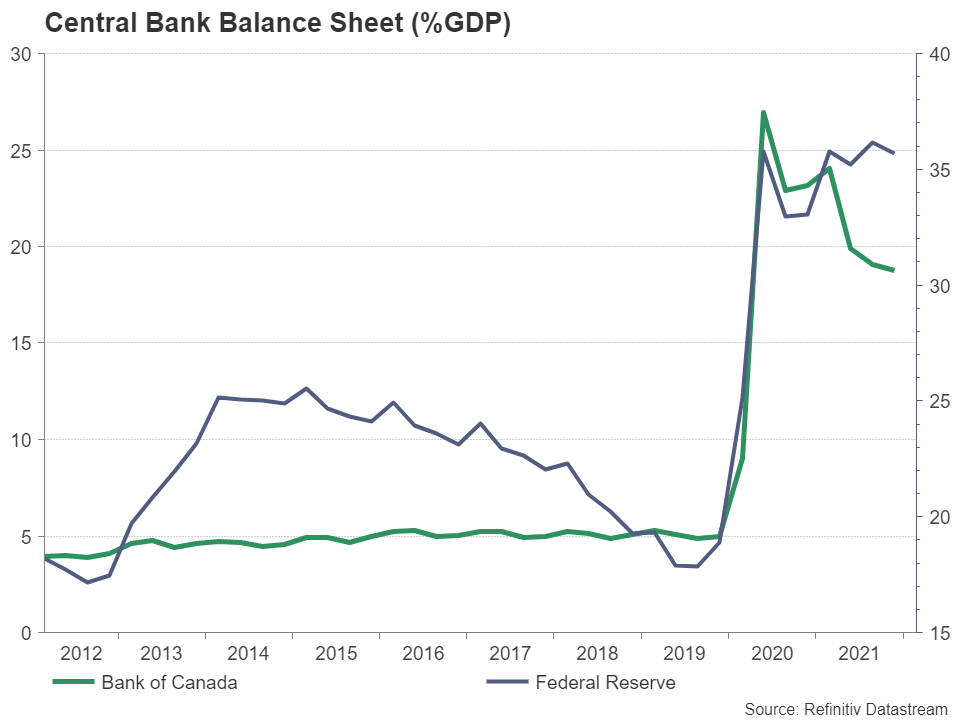 Alternatively, if the BoC rate hike is accompanied by a more conservative communication style, which questions the aggressive rate hike pricing and postpones quantitative tightening ahead of the Fed meeting, the pair may head for another test near the tough resistance of 1.2800. A steeper increase above 1.2853 could then open the door for the one-year high of 1.2963.
First Impressions: Australian Q4 GDP
Output +3.4%, meeting expectations. Conditions rebound strongly from delta lockdowns, led by the consumer, +6.3%, as people adapt to the challenges of the pandemic.
The Australian economy expanded by 3.4% in Q4, on the reopening from delta lockdowns (which were centred in NSW, Victoria and the ACT). This follows a 1.9% contraction in Q3.
The outcome met expectations, Westpac forecast +3.3% and market median +3.5%.
The result represents a relatively rapid rebound from delta disruptions, evidence that households and businesses are continuing to adapt to the challenges of the pandemic.
Annual growth edged up from 4.0% to 4.2% and the level of activity in Q4 2021 is 3.4% above that at the end of 2019, prior to the pandemic.
GDP, three measures: the GDP headline is an average of three measures: expenditure, income and production. GDP (E) printed at 3.6% qtr, GDP (I) 3.4% and GDP (P) was 3.3%.
Hours worked: The National Accounts estimate that hours worked increased by 4.3% in Q4, following a 4.8% decline in Q3.
These movements are more pronounced than reported in the Labour Force survey. Hours worked in the Labour Force Survey printed -3.2% for Q3 and +2.4% for Q4. For NSW, hours worked (in the LFS) was -9.0% for Q3 and +7.8%. for Q4. However, for Victoria, with various lockdowns and a later delta lockdown and reopening, hours worked contracted in Q4, down by -1.2% after a +0.2%.
State demand: NSW rebounded strongly on the reopening, with state demand up by 6.7% in Q4, reversing a sharp decline in Q3. For Victoria, state demand grew by 3.7% in Q4. Nationally, domestic demand increased by 2.9% - with subdued results in the other states (Qld flat, WA +0.1%, SA 0.3% and Tasmania -1.5%).
Key surprises: Spending by households came in above our expectations, driving the upside surprise on the GDP expenditure estimate. The consumer surprised to the upside across the board in Q4, all major spending categories outstripping expectations and incomes also posting a better than expected result.
The consumer: Total consumer spending increased by 6.3% in Q4, more than reversing a 4.8% fall in Q3. We had anticipated a rise of 5.0%.
This snap back in spending differs from the 2020 experience, when the rebound in consumer spending in Q3 (7.6%) only partially reversed the plunge in Q2 associated with the initial lockdown (-12.1%). As noted above, this is further evidence of adaptation to the challenges presented by the pandemic.
Within the spending detail, there are very large swings associated with the lockdown and reopening. For Q4: recreation & culture, +17.1%; hospitality, +41.6%; operation of vehicles +13.9%; and clothing & footwear, +41.6%.
Household saving ratio: Understandably, with the reopening, the household saving ratio moderated, to be at 13.6% in Q4, after spiking to 19.8% in Q3 (boosted by government payments and by reduced consumer spending). That is up from 11.8% in Q2 2021. Recall that the saving ratio spiked to 23.7% in Q2 2020, associated with the initial nationwide lockdown.
The saving ratio remains elevated (with an “equilibrium rate” in the order of 5%).
Over the two years of the pandemic, a sizeable household savings buffer has been accumulated. This can be drawn upon to help fund future spending – thereby supporting what is likely to be a strong economic recovery in 2022 (associated with high vaccination rates).
Expenditure detail:
Consumer spending and an inventory rebuild were the growth drivers in Q4.
Elsewhere spending was on the softer side.
Home building activity declined by -2.2%, including a -4.4% fall in renovations work. Recall that the Construction Work Survey indicated that work in the sector was led lower in the period by Victoria.
Business investment edged lower, -0.3%. This included a decline in equipment spending, -1.5%. Recall that the Capex survey indicated that while equipment spending did rebound in NSW and Victoria, falls were recorded elsewhere.
Public demand paused, edging -0.4% lower. That follows rapid growth of late, notably a 3.5% rise in Q3, boosted by the response to the delta outbreak. Annual growth is still brisk, at 5.6%, down from 7.3%.
Net exports a small negative, -0.2ppts, led by a decline in export volumes, -1.5%.
Total inventories added to growth, 0.9ppts, led by private non-farm business inventories, +1.0ppt, with an inventory rebuild as the economy reopened. Other inventories were a small negative, -0.1ppt (farm -0.3ppts and public authorities +0.2ppts).
Gold Report: Geopolitical Uncertainty Captures the Scene
Gold prices spiked to a new yearly high price in the previous week, but ended the full session in red territory breaking the winning streak it had performed in February. We must note that Gold’s price action was impressive and presented opportunities for traders, as was expected and considering the current happenings around the world. In this report we will provide the key fundamentals behind Gold’s price action, adding to it our personal views and conclusions. We will also briefly explain what traders can focus on in the days ahead and close the report with our technical analysis pointing out price levels that are worth keeping in mind.
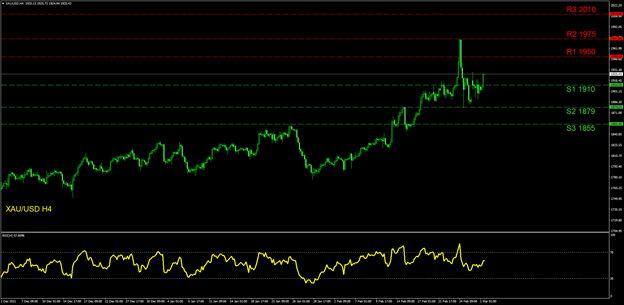
Market participants continue to carefully follow the developments currently taking place in Ukraine. We must note that the Gold market spiked upon news that Russian military forces officially attacked a number of sites in Ukraine’s territory and the price reached $1975, a level that was last seen back in September 2020. Yet, the price action for the time being has returned to lower grounds possibly implying traders may be waiting for more information on how the matter could play out. It is our opinion that in the scenario of worsening tensions, traders will not hesitate to apply buying pressure to Gold’s price. An example of the situation worsening could be other countries taking sides and carrying out military attacks, or the use of advanced weapons magnifying the matter even further. Some media sites highlight the dangers that the days or weeks ahead may hold. Finally, if sanctions and sanction retaliations deepen, the effects could hit the global economy in different ways which can ultimately increase economic risk. Sanctions even though a peaceful measure against actions of war, can destabilize demand and supply strings and threaten to worsen already very high inflationary pressures felt on an international basis. In this case investors can turn to Gold which tends to act as a safe haven instrument in times of geopolitical uncertainty.
In the days forward, traders and market participants have a number of important economic releases and events from the US to work with. On the 2nd of March, in the US session we get the important semiannual monetary policy testimony of the Federal Reserve Chair Jerome Powell before the House’s Financial Services Committee. On the 3rd of March, we get the weekly Initial Jobless Claims figure, the January Factory Orders rate and the February ISM N-Mfg PMI figure. Later in the US session we have another monetary policy testimony by Federal Reserve Chair Jerome Powell, this time before the Senate Banking Committee. On the 4th of March we get the key event of the week with the US employment report for February. Please note analysts and traders will have their attention fixed to this event as its results can determine a whole lot for Federal Reserve’s future steps in terms of interest rate hikes. As noted very clearly by FOMC Governor Christopher J. Waller in a speech that took place on February the 24th if the PCE inflation report for January, and jobs and CPI reports for February indicate that the economy is still running exceedingly hot, a strong case can be made for a 50-basis-point hike in March. Such a scenario can move Gold prices abruptly. If the NFP report indicates the job market remains strong then the USD could strengthen and subsequently send Gold prices lower. On the other hand, we also allow room for a general positive outlook for the US economy to create optimism among traders that could be expressed with a risk on sentiment. In this case Gold prices could soar along with the US stockmarkets. Finally, with Oil prices persisting nearby multiyear high levels pressure on the largest economies of the world including the US, China, UK, Japan and the Eurozone could be mounting as energy costs could be pushing good prices much higher making Gold very attractive. We could say that at the moment Gold and Oil prices keep a positive correlation between them. Thus traders should be mindful of this relationship and should Oil prices break to new highs Gold may advance further.
XAU/USD H4
Gold’s price action has stabilized above 1900, a rather bullish sign for the metal in the short term. As Gold is currently moving nearby 1920, we tend to note the next resistance higher to be found at the (R1) 1950 level. If the upward momentum is extended then the (R2) 1975 level can be attended which is also the highest level Gold has reached since September 2020. This is a rather challenging level for Gold to reach and a breach above it will only confirm the bulls continue to be in charge. Under these circumstances, a move to the (R3) 2010 line, our highest resistance for this report could also prevail. In the opposite direction a move downwards can send the price action to the (S1) 1910 level where considerable price action has been carried out in the most recent sessions. Lower, the (S2) 1879 level was visited only once in the past week making it the lowest level Gold has fallen too very recently. In our view the (S2) is of particular importance from a selling perspective and a breach below it can change Gold’s bias to a selling one. We must also note the (S3) 1855 level that was tested various times and withstood its ground from the 11th to the 16th of February. The RSI indicator remains above 50 at the moment implying some bullish appetite is on the move. Our personal outlook for Gold remains sideways with bullish tendencies.
Dollar Awaits Nonfarm Payrolls as Geopolitics Dominate
The US dollar has been trading entirely as a safe haven asset since Putin rolled into Ukraine, but traders could turn their attention back to economics this week. The Fed Chairman will testify before Congress on Wednesday ahead of the all-important US employment report on Friday. Can the dollar continue to bulldoze its way through the FX complex?
Markets trade geopolitics
With the war in Ukraine still raging, global markets have been left hostage to geopolitical headlines. Demand for hedging has turned into the most important variable, overshadowing expectations around Fed policy as investors prioritize protection.
Naturally, the dollar has performed well in this environment. It has benefited both from its status as the world’s reserve currency and from a weaker euro as the Ukraine crisis will inflict much greater damage on Europe, both by crippling the banking sector and by pushing energy prices higher. America has neither problem as its banks aren’t exposed to Russia and it is energy independent.
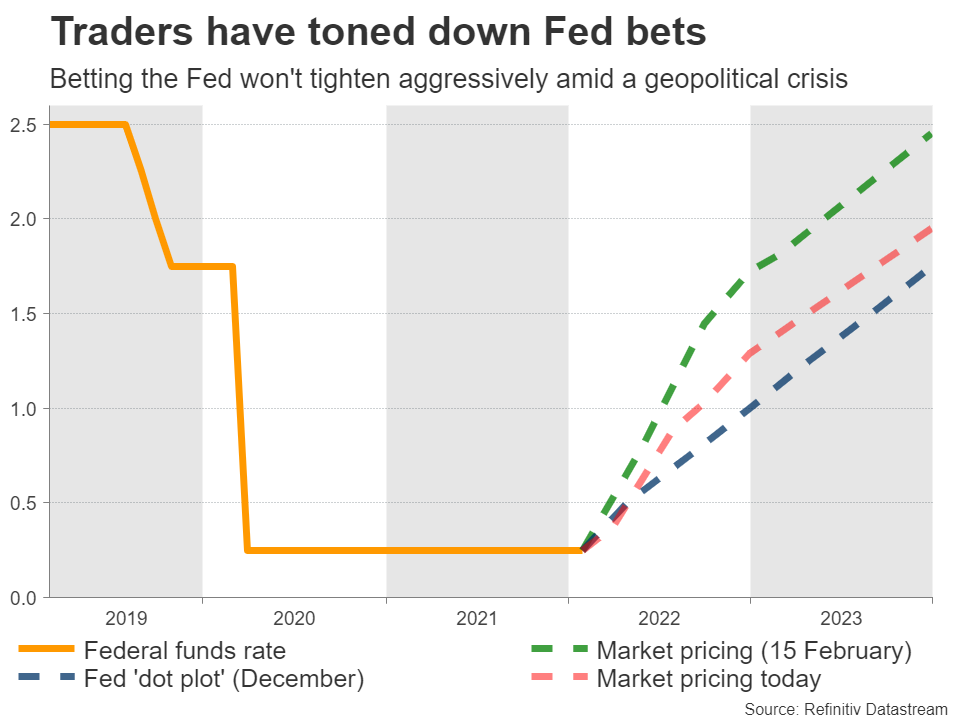
But there will still be some effects on the US economy. With global energy prices charging higher, the concern is that inflation will remain elevated for longer. Some even speculated that the Fed would be forced to respond with faster rate increases.
However, traders have been betting on the opposite lately. Market participants have dialed back their bets for rate hikes in recent sessions, now pricing in roughly five rate increases for the year, down from six before the Ukrainian invasion.
Investors are essentially saying the Fed won’t dare to tighten aggressively in the middle of a geopolitical crisis and risk choking economic growth, even if that means a period of higher inflation.
Crucial events
We’ll find out whether the Fed truly believes that when Chairman Powell testifies before Congress on Wednesday. Then on Thursday, the ISM services survey for February will be released. But the main event will probably be on Friday, when the latest US employment report hits the markets.
Nonfarm payrolls are forecast to have risen by 438k in February, roughly as much as the previous month. That’s expected to have pushed the unemployment rate down by one tick to reach 3.9%.
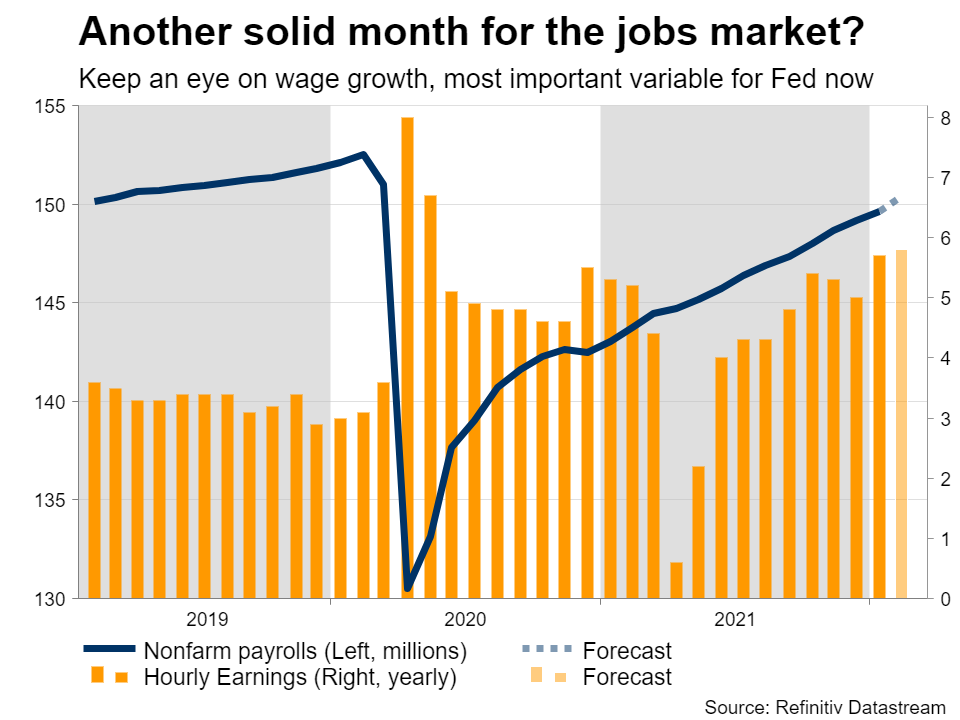
Of course, the metric that markets will focus the most on is wage growth, which is projected to have accelerated a little in yearly terms. The Fed sees wage growth as an early indicator of inflationary pressures, so it is crucial for monetary policy.
As for potential surprises, most labor market indicators that have been released so far point to a solid report. The Markit composite PMI for the month showed that US businesses increased their employment levels at the strongest pace since May, while jobless claims fell during the week the jobs survey was conducted.
Can the dollar keep going?
As for the dollar, with so much demand for safe-haven assets right now and the geopolitical picture turning against the euro, the rally could continue. Technically speaking, euro/dollar is at a crucial crossroads. The pair has been trading sideways since November essentially and it is now testing the lower boundary of that range near 1.1120.
This week’s US events will likely decide whether we see the break. In case of a strong batch of data that forces traders to price in more aggressive Fed rate increases, the pair could pierce below that level and aim for the 1.1020 region afterwards.
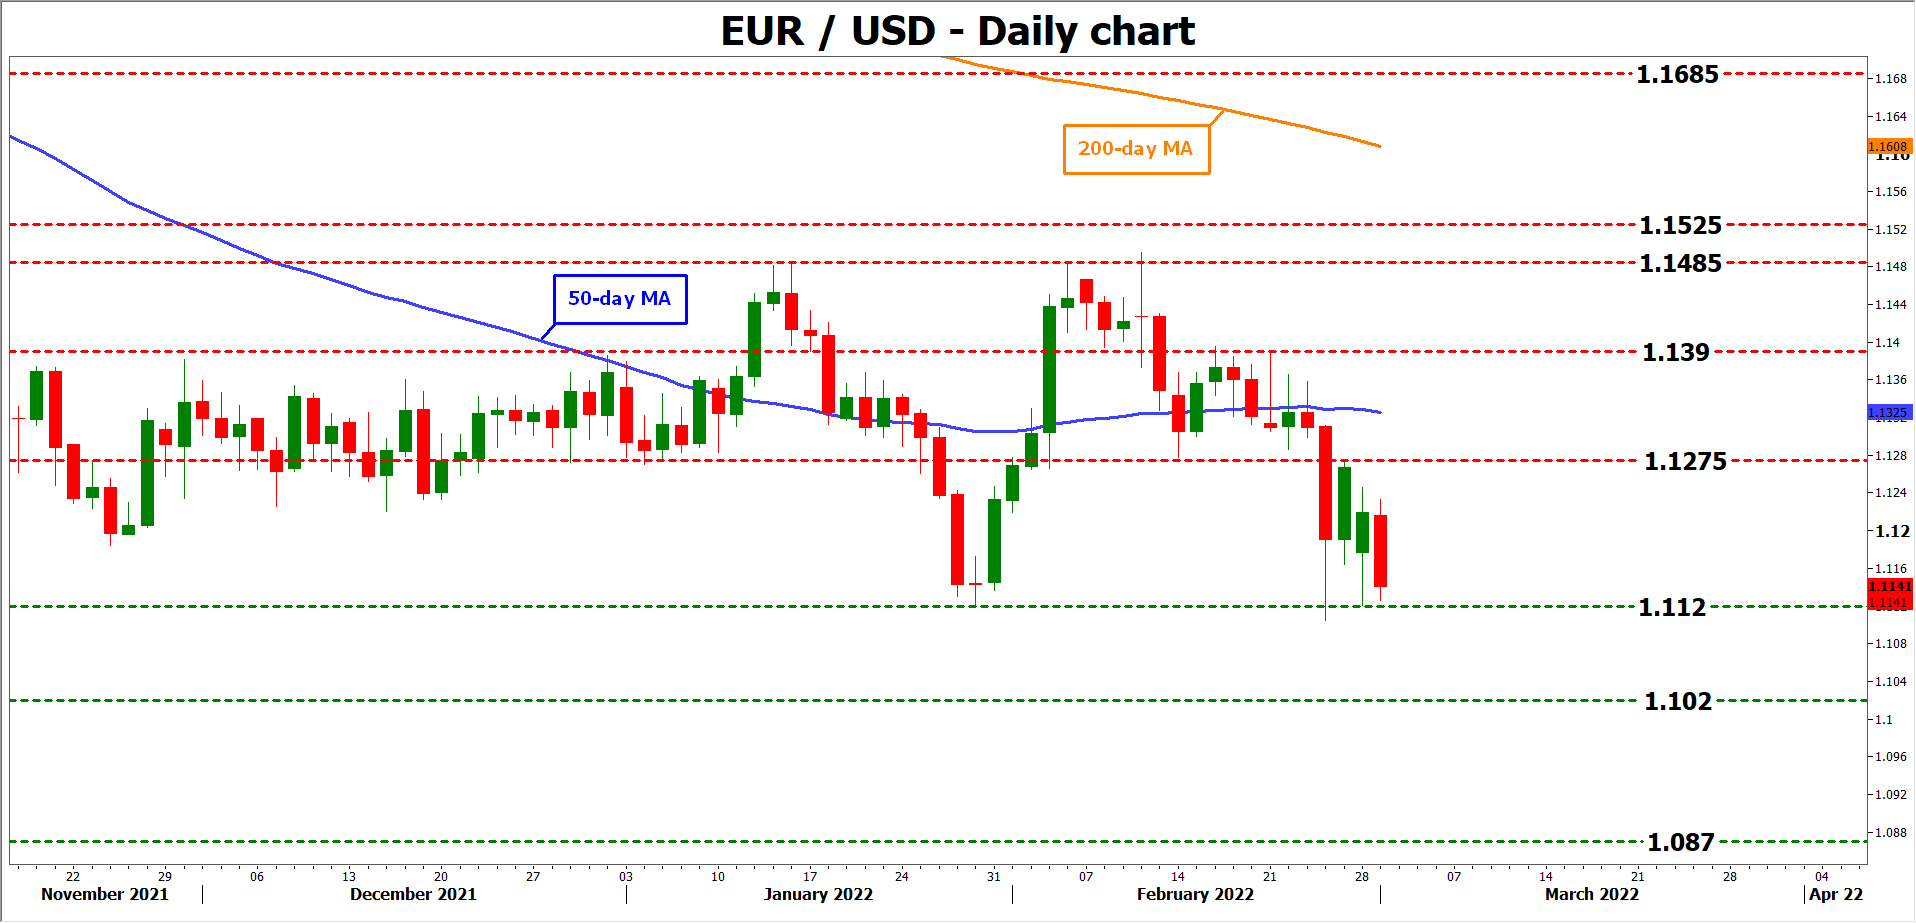
On the other hand, a disappointment could dampen Fed rate hike bets even further, setting the stage for a rebound. If euro/dollar manages to break above 1.1275 again, the next target may be the 50-day moving average currently at 1.1325.
All in all, this is a very volatile market and making long-term predictions seems pointless. For now, everything depends on geopolitics and whether there’s a ceasefire in Ukraine soon. Economics could play a secondary role until then.