Sample Category Title
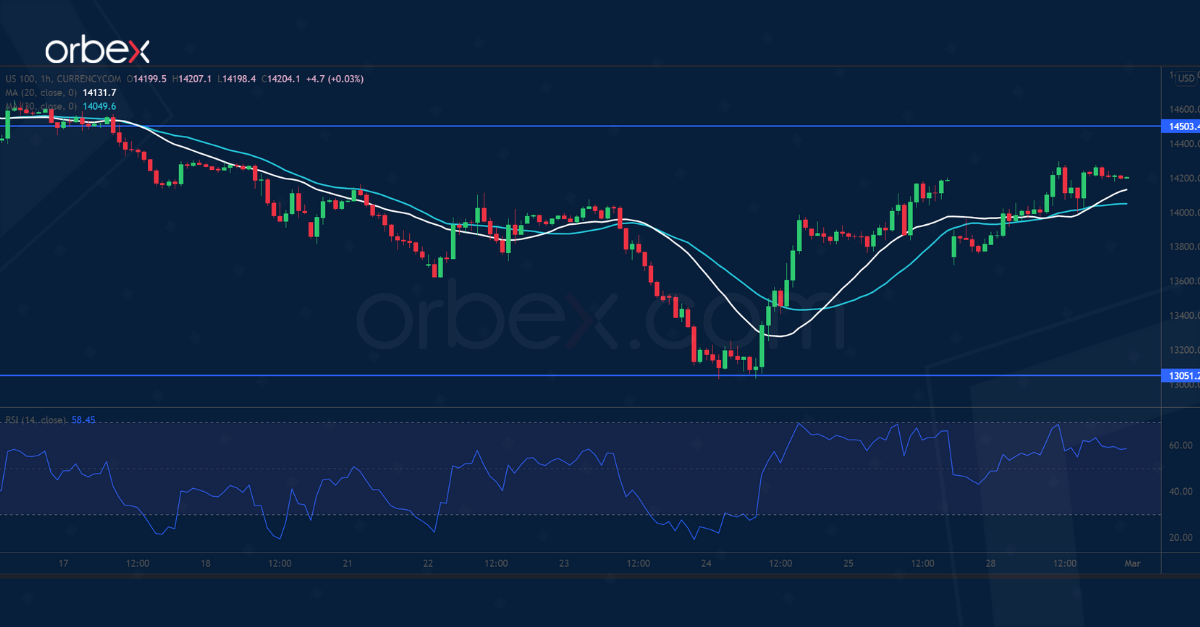
Nasdaq 100 to Test Key Resistance
The Nasdaq 100 bounces as Russia and Ukraine meet for peace talks.
The index saw bids near last May’s lows (13050), an important floor to prevent further bleeding. A rebound above 14050 has prompted some sellers to take profit, easing the downward pressure for the moment.
Price action is heading to the next resistance at 14500 which sits on the 30-day moving average, and high volume could be expected in this area of interest. A bullish breakout could boost sentiment in the short term and extend gains to 15280.
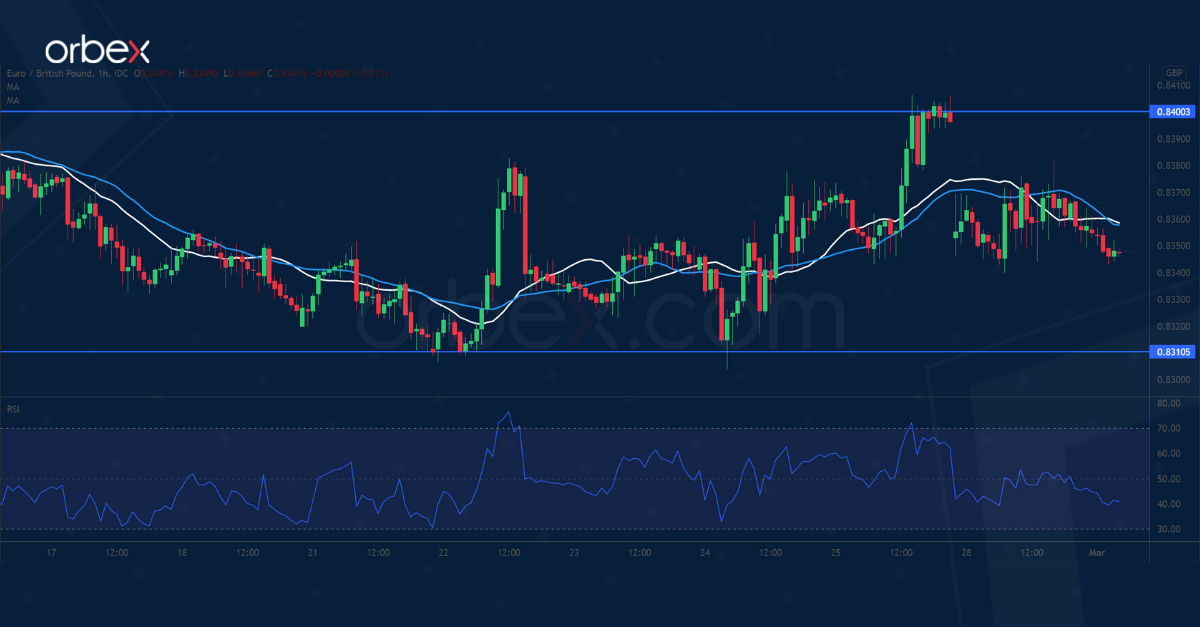
EUR/GBP Attempts to Rebound
The euro struggles amid escalation in Western sanctions.
A bullish attempt above 0.8400 indicates an upward bias as sellers cover their positions. 0.8310 has been solid support. And the market mood may become increasingly upbeat if buyers succeed in holding above this level.
An extended rally may send the single currency to the daily resistance at 0.8475, where a breakout may cause a bullish reversal in the weeks to come. On the downside, a fall below the said demand zone may send the euro to 0.8260.
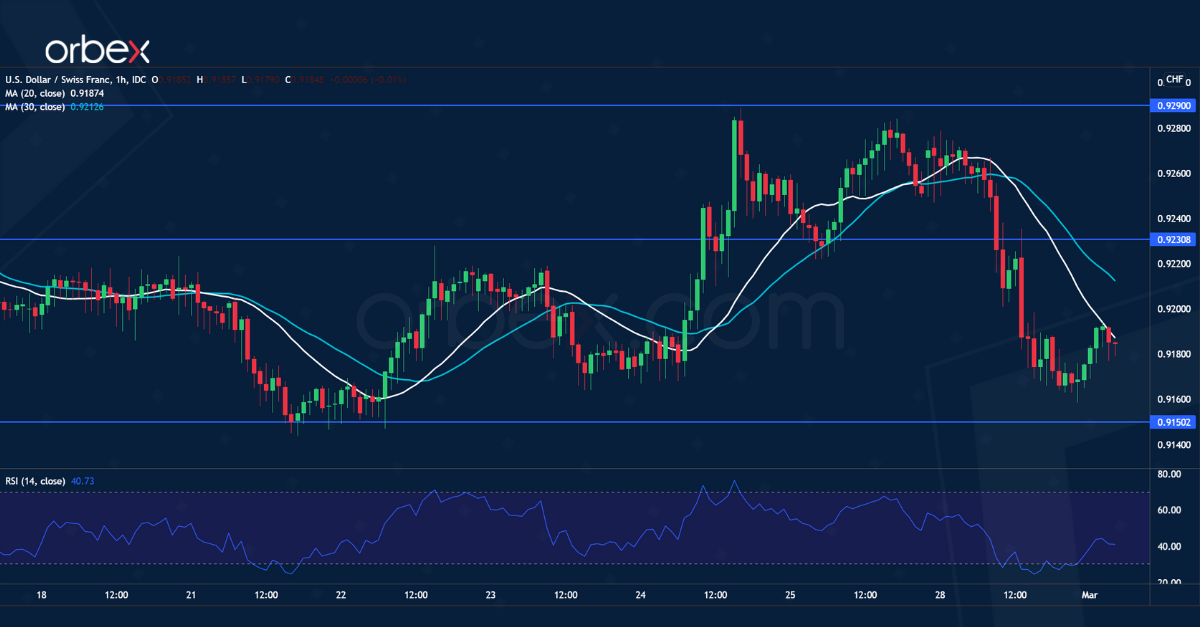
USD/CHF Struggles for Support
The Swiss franc rallies as new sanctions against Russia trigger a flight to safety.
The pair has met stiff resistance in the supply area (0.9290). Then a drop below 0.9220 and 0.9170 suggests that sentiment remains cautious and buyers are hesitant. 0.9150 is a key level to safeguard the greenback’s latest bounce.
A bearish breakout could send the pair to the daily support at 0.9110. An oversold RSI may attract some buying interest. The bulls need to reclaim 0.9230 before they could hope for a turnaround.
GBPUSD Heals its Wounds as Bearish Bias Remains Present
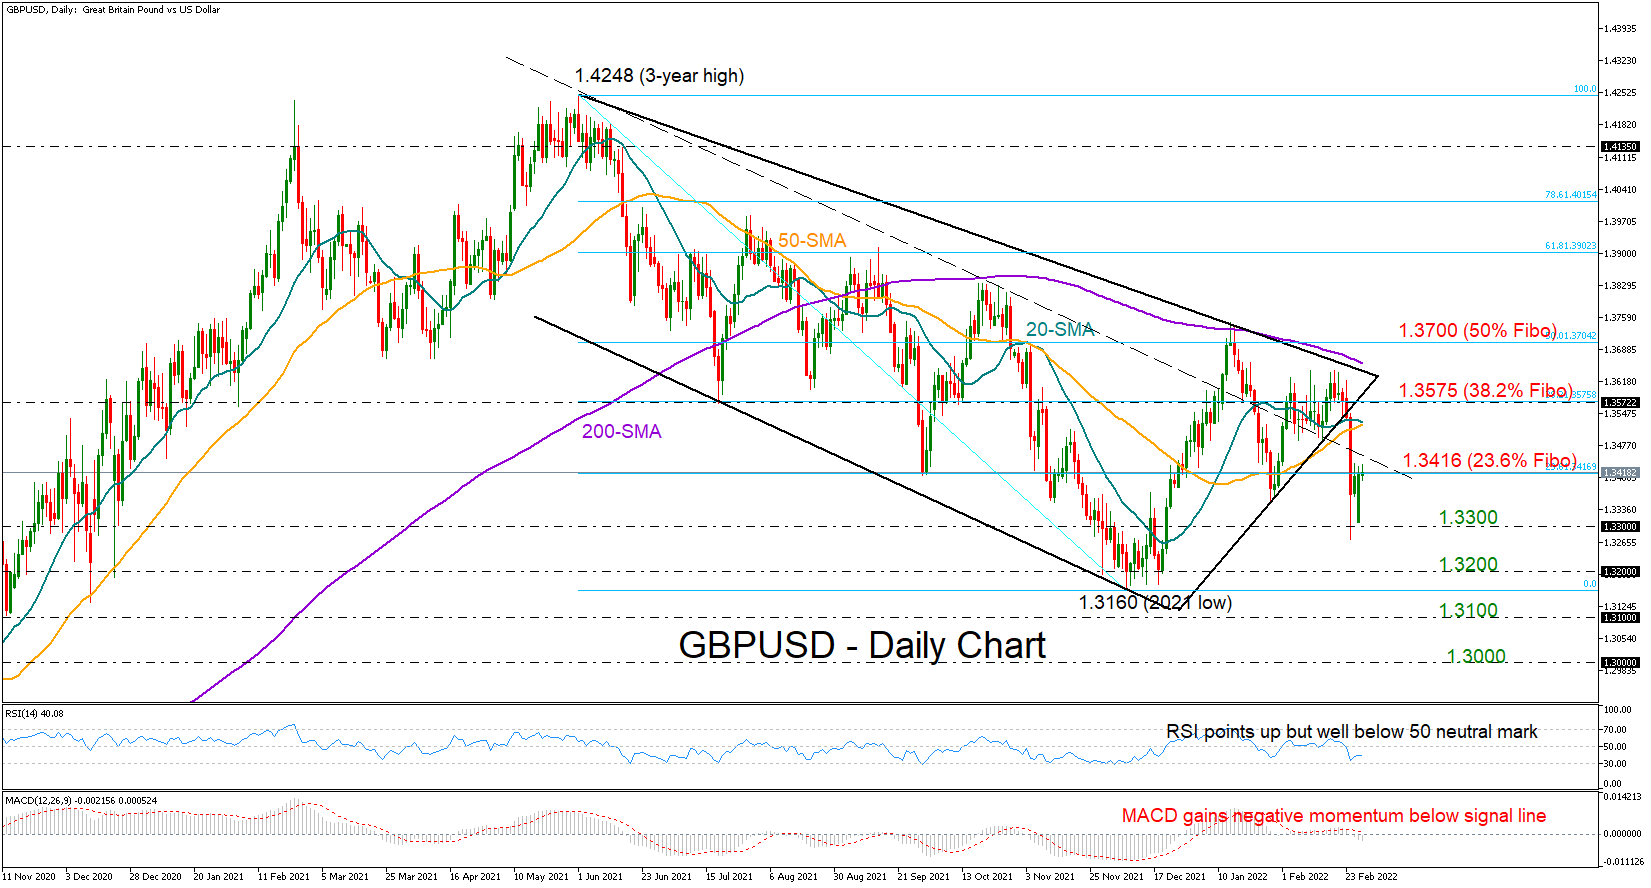
GBPUSD switched to a bullish mode after last week’s crash ceased at a two-month low of 1.3279. That said, the pair is still some way below February’s highs and downside risks keep lingering in the background as the MACD is strengthening its negative momentum below its zero and signal lines, and the RSI, although pushing for some recovery, is still comfortably dipped beneath its 50 neutral mark.
The 23.6% Fibonacci retracement of the 1.4248 – 1.3160 downleg continues to block upside movements for the third consecutive day at 1.3416, while within breathing distance, the (dashed) descending trendline, which has been acting both as support and resistance since mid-2021, will also be closely watched around 1.3450 in the coming sessions. If the bulls violate those boundaries, the rally could pick up steam towards the 38.2% Fibonacci and the broken supportive trendline, both around 1.3578, while slightly lower, the 20- and 50-day simple moving averages (SMAs) could be another hurdle. Yet, a tougher battle could take place somewhere between the 200-day SMA, which overlaps with the tentative descending trendline drawn from the 1.4248 top, and the 50% Fibonacci of 1.3700.
Alternatively, a resumption of the latest downfall beneath 1.3300 may motivate fresh selling towards the 1.3200 round level and the 2021 low of 1.3160. Failure to bounce above the latter could initially test the 1.3100 mark and then the 1.3000 number.
In brief, GBPUSD remains exposed to bearish reversals despite its bounce off from recent lows. A clear close above 1.3450 could activate another bullish round, while a drop below 1.3300 is expected to trigger the next selling phase.
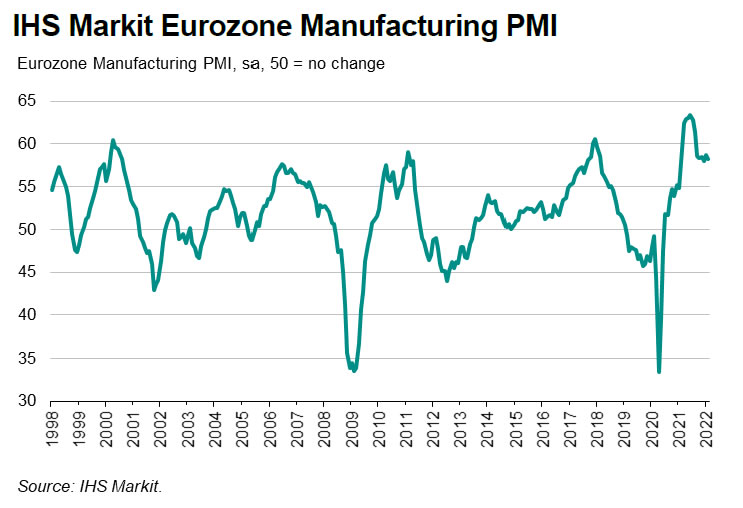
Eurozone PMI manufacturing finalized at 58.2 in Feb, a largely positive month
Eurozone PMI Manufacturing was finalized at 58.2 in February, down slightly from January's 58.7. Markit said demand for Eurozone goods rose at fastest rate since last August. Supplier delivery times lengthened to weakest extent for over a year, but inflation remained steep.
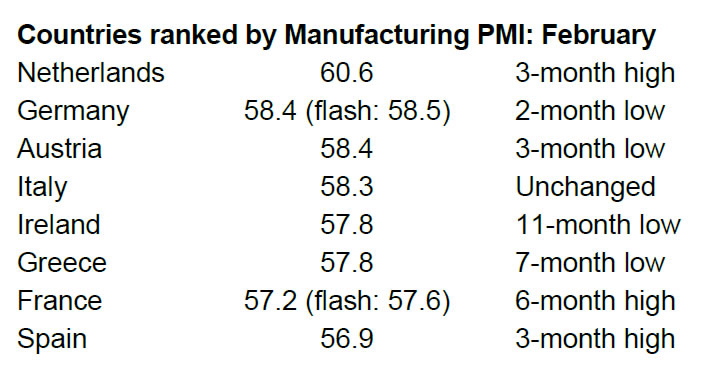
Looking at some member states, the Netherlands rose to 3-month high at 60.6. Germany dropped to 58.4 while Austria dropped to 58.4. Italy was unchanged at 58.3. Ireland dropped to 11-month low at 57.8. Greece dropped to 7-month low at 57.8. France rose to 6-month high at 57.2. Spain rose to 3-month high at 56.9.
Joe Hayes, Senior Economist at IHS Markit said: "Don't let the drop in the headline PMI distract from what should be viewed as a largely positive month for the euro area manufacturing sector in February. Demand for goods is trending higher, with the rate of expansion accelerating to a six-month high. Underlying sales conditions are clearly strengthening as Europe overcomes the Omicron wave of COVID-19 and businesses step up their recovery efforts."
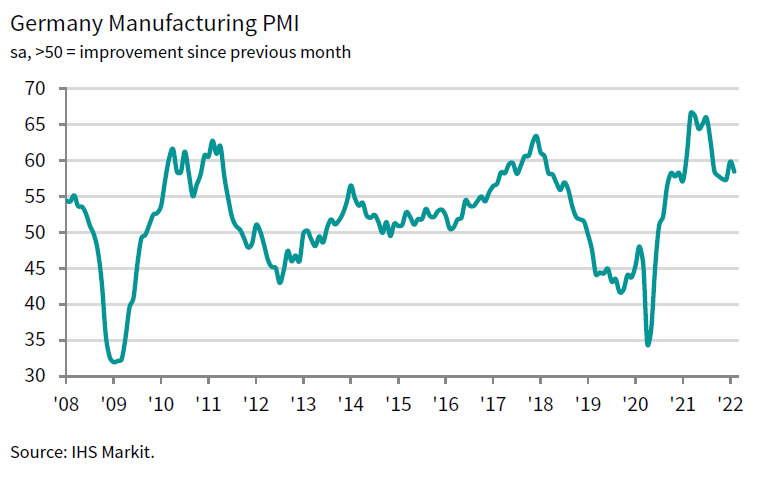
Germany PMI manufacturing finalized at 58.4 in Feb, underlying demand strong
Germany PMI Manufacturing was finalized at 58.4 in February, down from January's 59.8. Markit said there were sharp rise in backlogs as growth in the new orders outstripped output. Factory cost inflation slipped further from recent highs. Incidence of supply delays was lowest since November 2020.
Phil Smith, Associate Economics Director at IHS Markit, said:
"Underlying demand for German manufactured goods was strong in February, with new order growth accelerating and the survey showing rising sales both domestically and internationally.
"Production continued to rise, but staff absences linked to the Omicron wave of the pandemic were a constraint on output and added to already stretched capacity, thereby contributing to a sharp rise in backlogs of work. However, with COVID cases in the country looking like they might have already peaked, this particular headwind will hopefully be only temporary. Furthermore, the pace of factory job creation remained rapid as manufacturers looked to address capacity shortfalls.
"Supply constraints showed further tentative signs of easing in February, and one of the positives from this was a fall in the rate of input cost inflation to an 11-month low. "When the survey was conducted, firms were hopeful of further progress in the supply situation and were highly optimistic about the outlook. With the escalation of the situation in Ukraine since February's survey, and the surge in oil and gas prices that's come with it, downside risks to the sector's performance in 2022 have increased."
France PMI manufacturing finalized at 57.2, six-month high
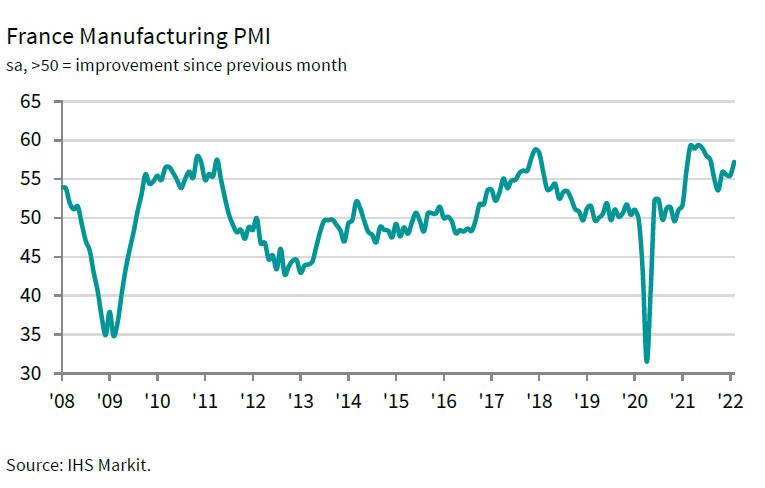
France PMI Manufacturing was finalized at six-month high of 57.2 in February, up from January's 55.5. Markit said manufacturing output increased at fastest rate since last July. Demand for goods improved despite steep output price inflation. Capacity pressures intensified as supply issues persisted.
Joe Hayes, Senior Economist at IHS Markit, said:
"Against the immense supply chain struggles that manufacturers have had to contend with over the last few months, the latest survey data show some promising signs of resilience as goods production increased at the fastest rate since last July. What is also encouraging to read is the anecdotes from our survey members which suggest that the trend in demand for goods is gaining momentum and many expect this trend to continue. Additional workers were recruited in February (some on a short-term basis to cover staff isolating with COVID-19), and business confidence strengthened.
"There were also some cautious signs of optimism in supply chain data, with input lead times lengthening to the weakest extent for almost a year. According to panel members, the availability for certain raw materials had improved. It's important not to get too carried away though as there still needs to be a considerable catch-up here.
"Less positive remains the inflation story and the persistence of rising costs and output prices. Suppliers continue to raise their fees as demand for inputs remains strong, but it appears that many businesses are simply paying these prices and passing the burden onto their clients. Given the causes of inflation seem sticky, policymaker intervention may well be required to bring inflation under control."
Daily Technical Analysis
EUR/USD
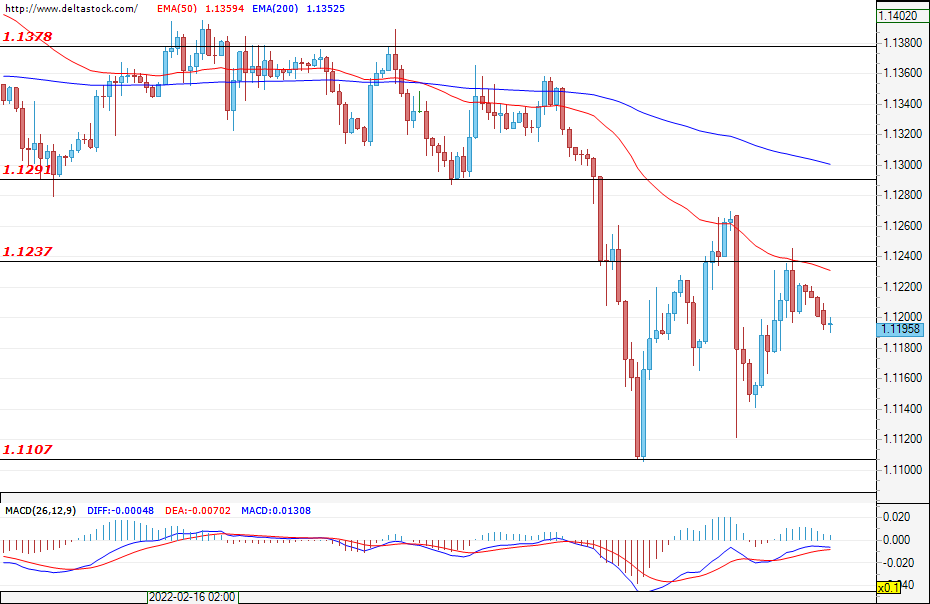
The euro managed to recover half of its Monday losses against the U.S. dollar. The main news is that Russia and Ukraine have agreed to negotiate on the border with Belarus. However, the recovery is too weak and the movement of the currency pair was limited below the resistance level of 1.1237. This shows that the downward movement is not over and the pair is therefore projected to move towards a new test of the support at 1.1107. Volatility will remain high during the week due to the ongoing war, as well as due to the important economic data for the United States, which will be released at the end of the week and which we have already mentioned in yesterday’s analysis.
USD/JPY
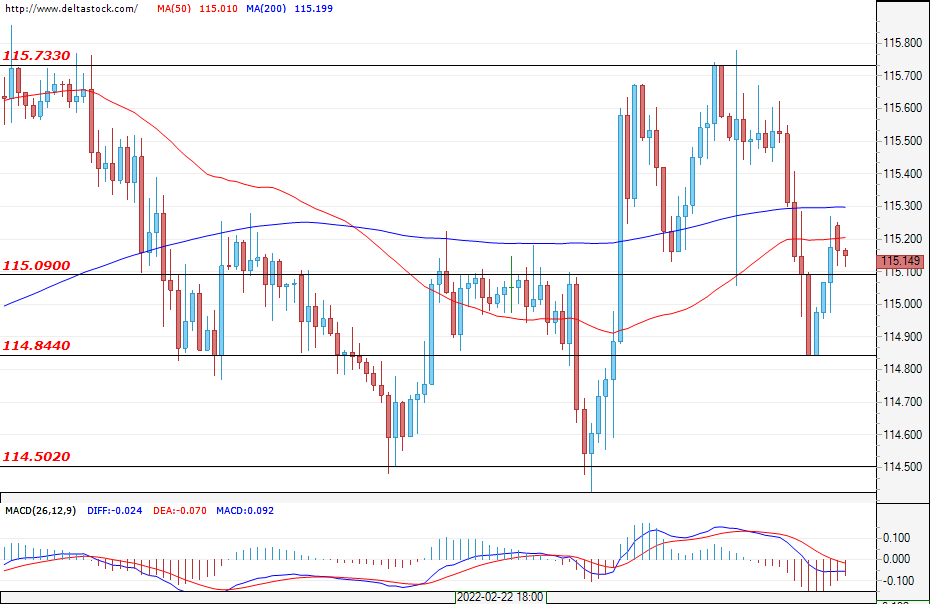
Over the past session, the dollar lost ground against the yen and turned towards the support at 114.84. A possible breach of the next level at 114.50 would give the bears a more serious advantage, but this support is more likely to hold and the currency pair is to return to the upper border of the formed range between 114.50 and the resistance at 115.70.
GBP/USD
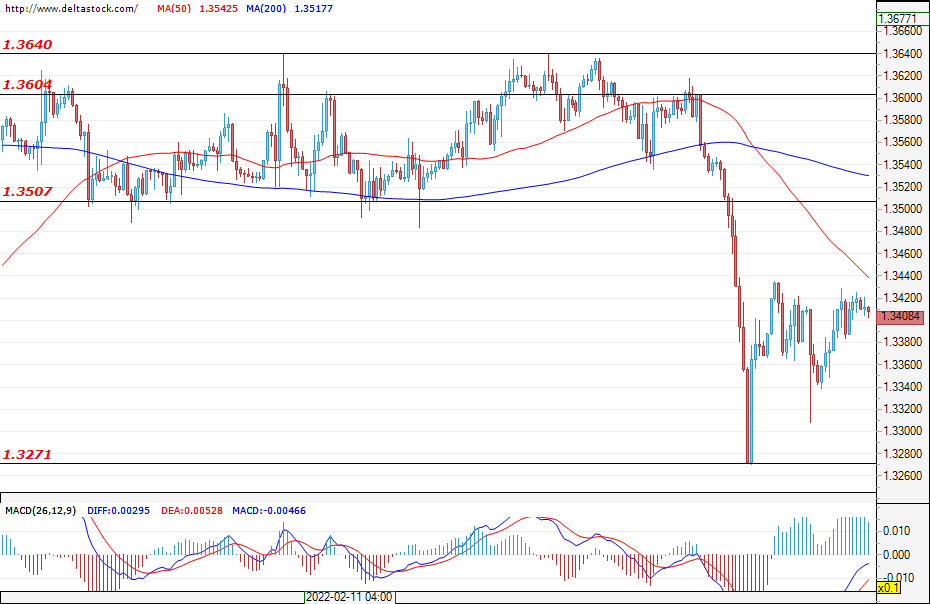
The Cable recovered everything it lost against the dollar in the past session and turned towards the resistance at 1.3500. In case the currency pair breaches this level and manages to stay above it, then this would clear the way for the bulls towards the next resistance at 1.3600. If this scenario does not happen, then the negative trend, indicated by the longer time frames, will continue and the bears are likely to prevail once more, storming the support at 1.3366.
EUGERMANY40
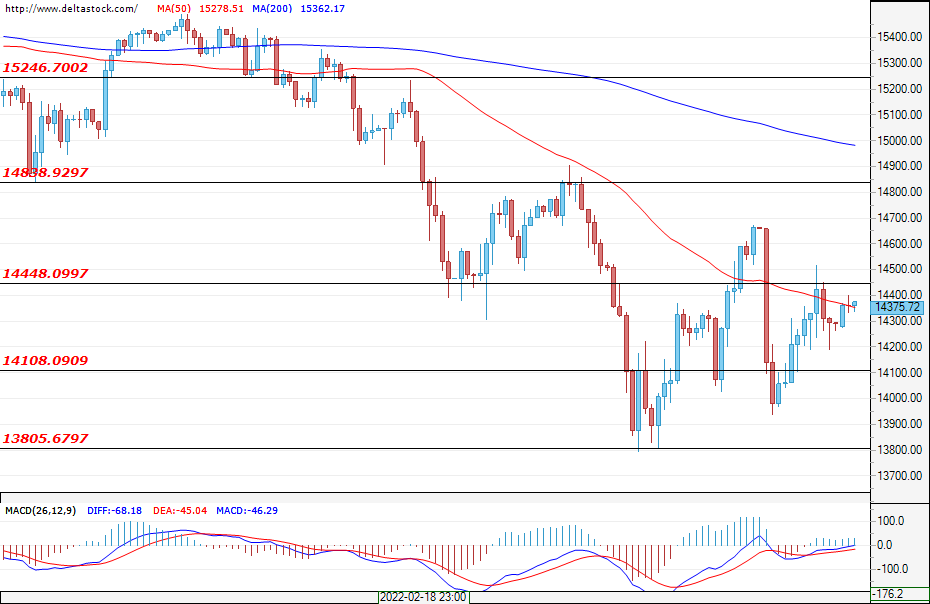
The optimism that had stemmed from the news about the negotiations between Russia and Ukraine was temporary for the German index and it lost half of what it gained during the day. The great uncertainty caused by the war, and its negative effects on the European economy, have greatly impacted its volatility. A possible breach above the level of 14450 could pave the way for the bulls towards the next resistance level at 14840, but if the situation does not improve, then the bears might once again prevail and push the index towards the support at 13800.
US20
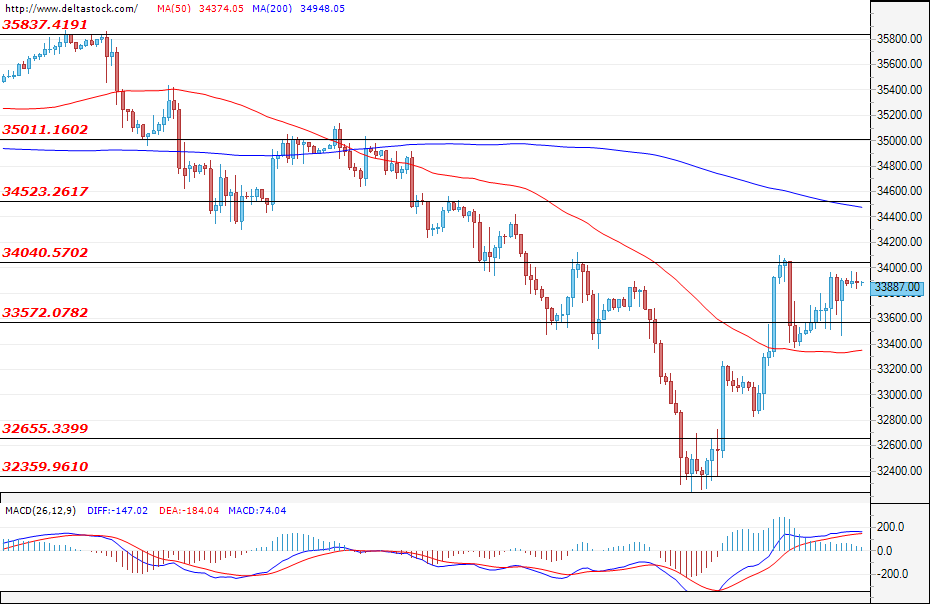
The U.S. index recovered most of its losses it had suffered at the opening bell on Monday, but only a breach and a consolidation above the level at 34040 could be considered a signal for a possible rise towards the next resistance at 34523. The trends remain negative and a breach of the zone at 33572 would likely allow the bears to advance towards the next support zone at around 32350. Negotiations between the warring parties and the upcoming important economic data for the United States remain the leading factors that will determine the future direction of the index.
Elliott Wave View: USDCAD Near Support Area
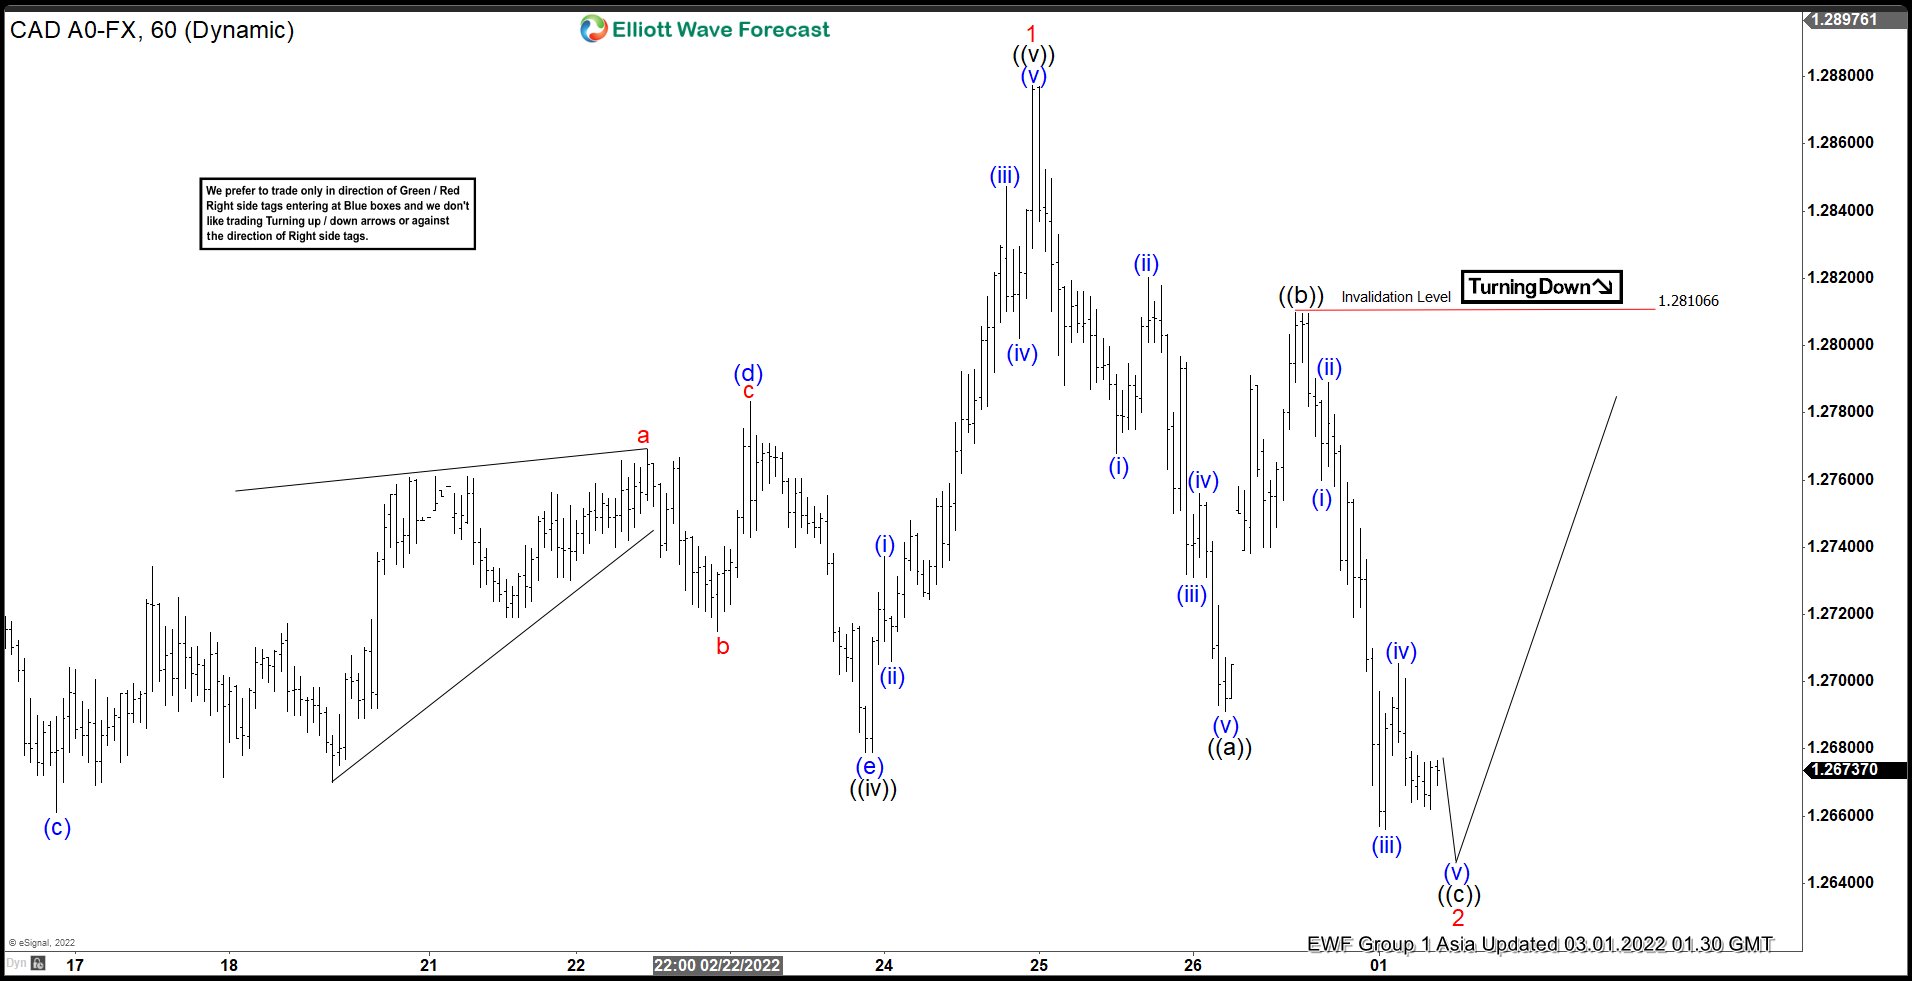
Short Term Elliott Wave View suggests the rally from January 19 low ended wave 1 at 1.28775. Internal subdivision of wave 1 unfolded as a 5 waves impulse structure. Up from January 19 low, wave ((i)) ended at 1.2702 and pullback in wave ((ii)) ended at 1.2556. Pair resumes higher again in wave ((iii)) towards 1.2796, and wave ((iv)) ended at 1.2679 as a triangle. Final leg higher wave ((v)) ended at 1.28775 which also completes wave 1. Pullback in wave 2 is in progress as a zigzag Elliott Wave structure.
Down from wave 1, wave (i) ended at 1.2768 and rally in wave (ii) ended at 1.282. Pair resumes lower in wave (iii) towards 1.273, rally in wave (iv) ended at 1.2756, and move lower wave (v) ended at 1.269 which completes wave ((a)). Rally in wave ((b)) ended at 1.281, and pair has resumed lower. Down from wave ((b)), wave (i) ended at 1.276 and rally in wave (ii) ended at 1.2789. Pair resumes lower in wave (iii) towards 1.2656 and rally in wave (iv) ended at 1.27055. Pair can still see another leg lower in wave (v) to end wave ((c)) zigzag and also wave 2 in higher degree. Afterwards, expect pair to resume higher.
USDCAD 1 Hour Elliott Wave Chart
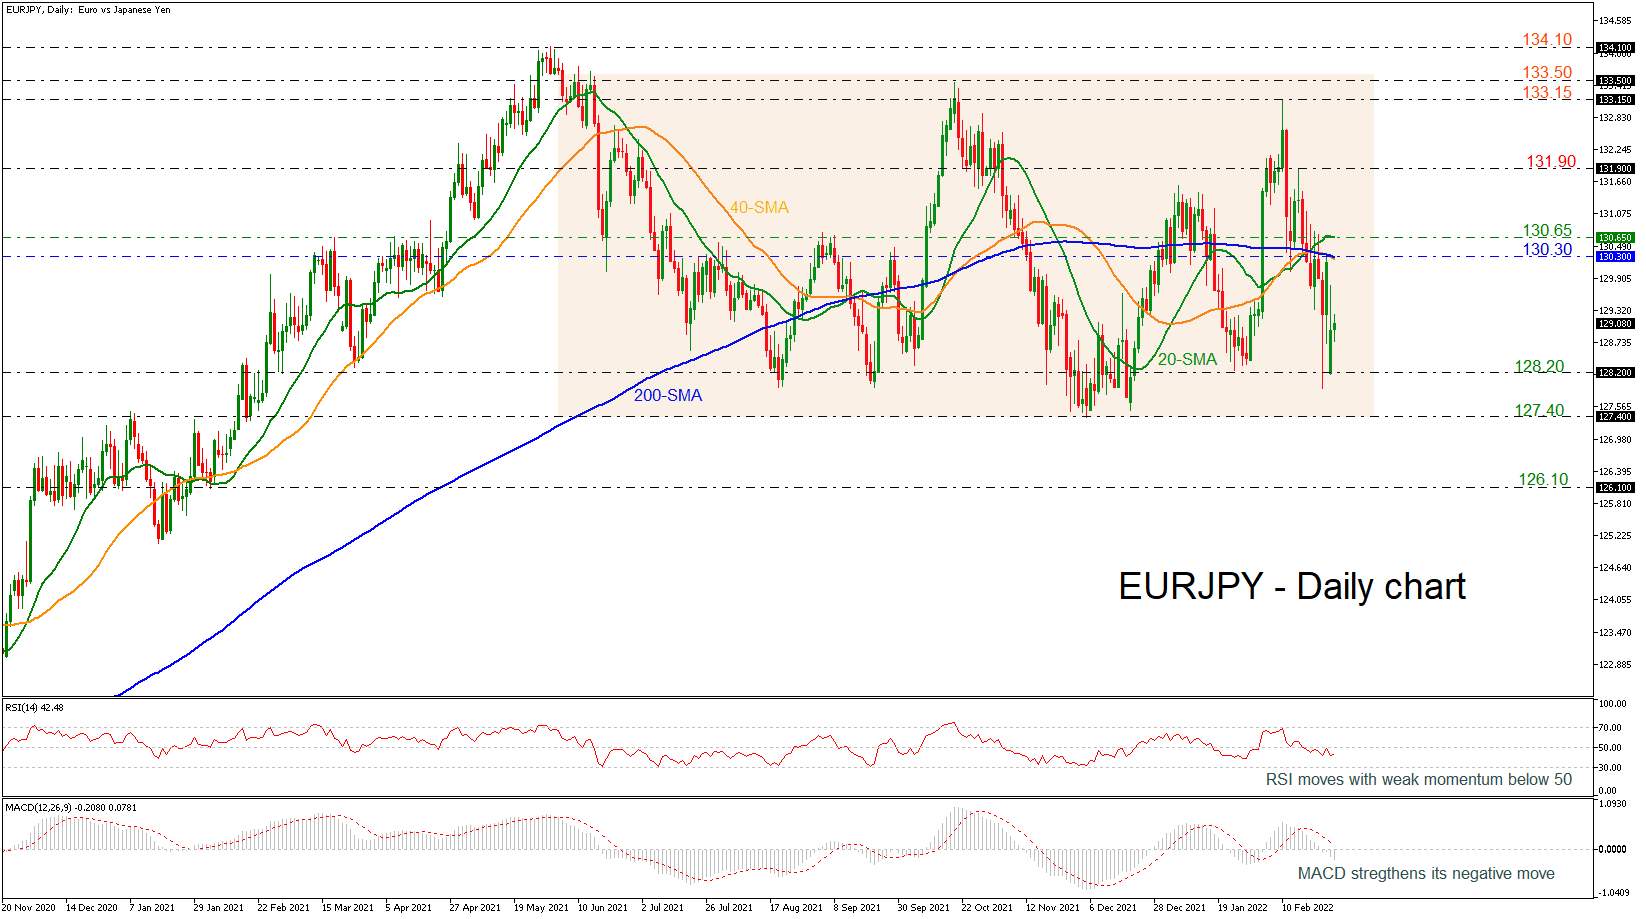
EURJPY Recovers the Gap, But Negative Risks Not Faded Yet
EURJPY ended Monday in the green, recovering the negative gap and is now challenging the 129.00 psychological level. The pair has been in a descending movement in the short-term timeframe after the pullback of the 133.15 resistance level, but in the broader picture the price has been in a sideways move since June 2021.
Regarding the technical indicators, the RSI is moving with weak momentum in the negative region, while the MACD is strengthening its movement below its trigger and zero lines.
In case the pair changes its short-term direction to the upside, the bulls will probably challenge the 200-day simple moving average (SMA) at 130.30, which is overlapping with the 40-day SMA ahead of the 20-day SMA at 130.65, which provided both support and resistance in the past. A break higher, could last until 131.90 and 133.15 could be another potential obstacle for upward movements.
Alternatively, additional declines may drive the price towards the 128.20 barrier before 127.40 comes into view. Beneath the latter, the 126.10 barrier could be another level in focus, taken from the low in February 2021.
Turning to the long-term picture, the pair switched to neutral mode after the rally off 133.15. The moving averages continue to head south and given that the technical indicators are moving lower too, the market’s outlook might get worse in the short-term as well.