Sample Category Title
(RBA) Statement by Philip Lowe, Governor: Monetary Policy Decision
At its meeting today, the Board decided to maintain the cash rate target at 10 basis points and the interest rate on Exchange Settlement balances at zero per cent.
The global economy is continuing to recover from the pandemic. However, the war in Ukraine is a major new source of uncertainty. Inflation in parts of the world has increased sharply due to large increases in energy prices and disruptions to supply chains at a time of strong demand. The prices of many commodities have increased further due to the war in Ukraine. Bond yields have risen over the past month and expectations of future policy interest rates have increased.
The Australian economy remains resilient and spending is picking up following the Omicron setback. Household and business balance sheets are in generally good shape, an upswing in business investment is underway and there is a large pipeline of construction work to be completed. Macroeconomic policy settings remain supportive of growth.
The resilience of the economy is evident in the labour market, with the unemployment rate at a 14-year low of 4.2 per cent. Underemployment is also around its lowest level since 2008. Hours worked declined significantly in January due to the Omicron outbreak, but the decline in infection rates and high numbers of job vacancies point to a strong bounce-back over the months ahead. The RBA's central forecast is for the unemployment rate to fall to below 4 per cent later in the year and to remain below 4 per cent next year.
Wages growth has picked up but, at the aggregate level, is only around the relatively low rates prevailing before the pandemic. A further pick-up in wages growth and broader measures of labour costs is expected as the labour market tightens. This pick-up is still expected to be only gradual, although there is uncertainty about the behaviour of labour costs at historically low levels of unemployment.
Inflation has picked up more quickly than the RBA had expected, but remains lower than in many other countries. The central forecast is for underlying inflation to increase further in coming quarters to around 3¼ per cent, before declining to around 2¾ per cent over 2023 as the supply-side problems are resolved and consumption patterns normalise. The CPI inflation rate will spike higher than this due to the higher petrol prices resulting from global developments. How long it takes to resolve the disruptions to supply chains is an important source of uncertainty regarding the inflation outlook, as are developments in global energy markets.
Financial conditions in Australia continue to be highly accommodative. Interest rates remain at a very low level, although some fixed rates have risen recently. The Australian dollar exchange rate is around its lows of the past year or so. Housing prices have risen strongly, although the rate of increase has eased in some cities. With interest rates at historically low levels, it is important that lending standards are maintained and that borrowers have adequate buffers.
The Board is committed to maintaining highly supportive monetary conditions to achieve its objectives of a return to full employment in Australia and inflation consistent with the target. The Board will not increase the cash rate until actual inflation is sustainably within the 2 to 3 per cent target range. While inflation has picked up, it is too early to conclude that it is sustainably within the target range. There are uncertainties about how persistent the pick-up in inflation will be given recent developments in global energy markets and ongoing supply-side problems. At the same time, wages growth remains modest and it is likely to be some time yet before growth in labour costs is at a rate consistent with inflation being sustainably at target. The Board is prepared to be patient as it monitors how the various factors affecting inflation in Australia evolve.
Technical Outlook and Review
DXY:
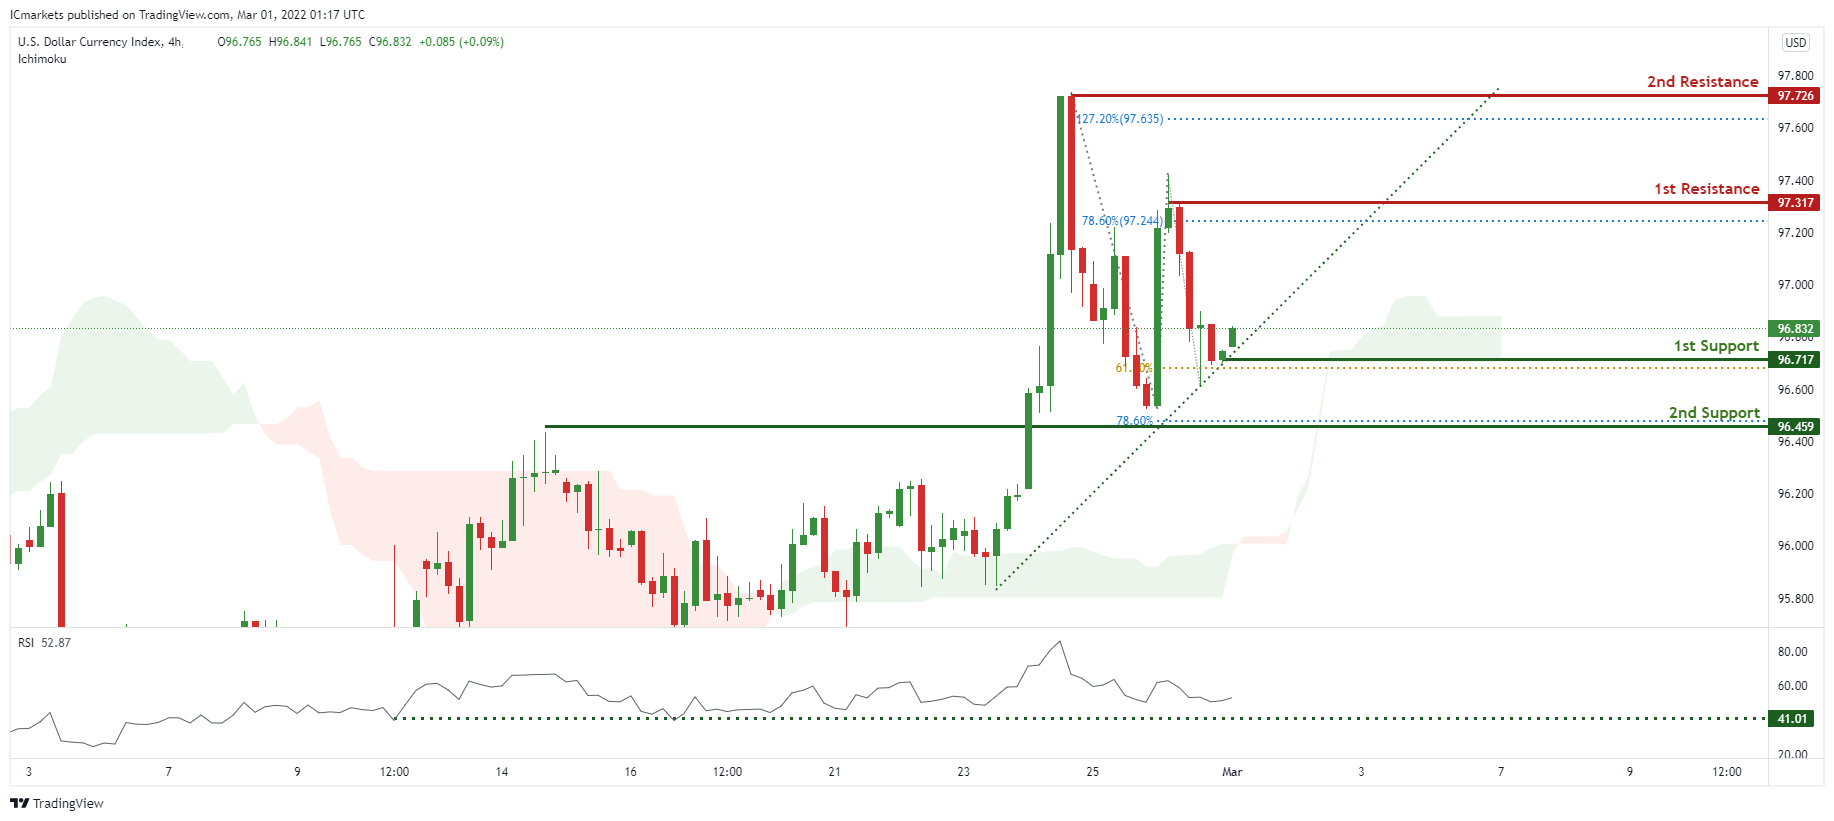
On the H4 timeframe, prices are on bullish momentum and abiding to a new ascending trendline. We see the potential for bullish bounce from our 1st support at 96.717 in line with 61.8% Fibonacci extension towards our 1st resistance at 97.317 in line with 78.6% Fibonacci extension. RSI is at a level where bounces occurred previously and also ichimoku is forecasting green clouds, further supporting our bullish bias.
Areas of consideration:
- H4 time frame, 1st resistance at 97.317
- H4 time frame, 1st support at 96.717
XAU/USD (GOLD):
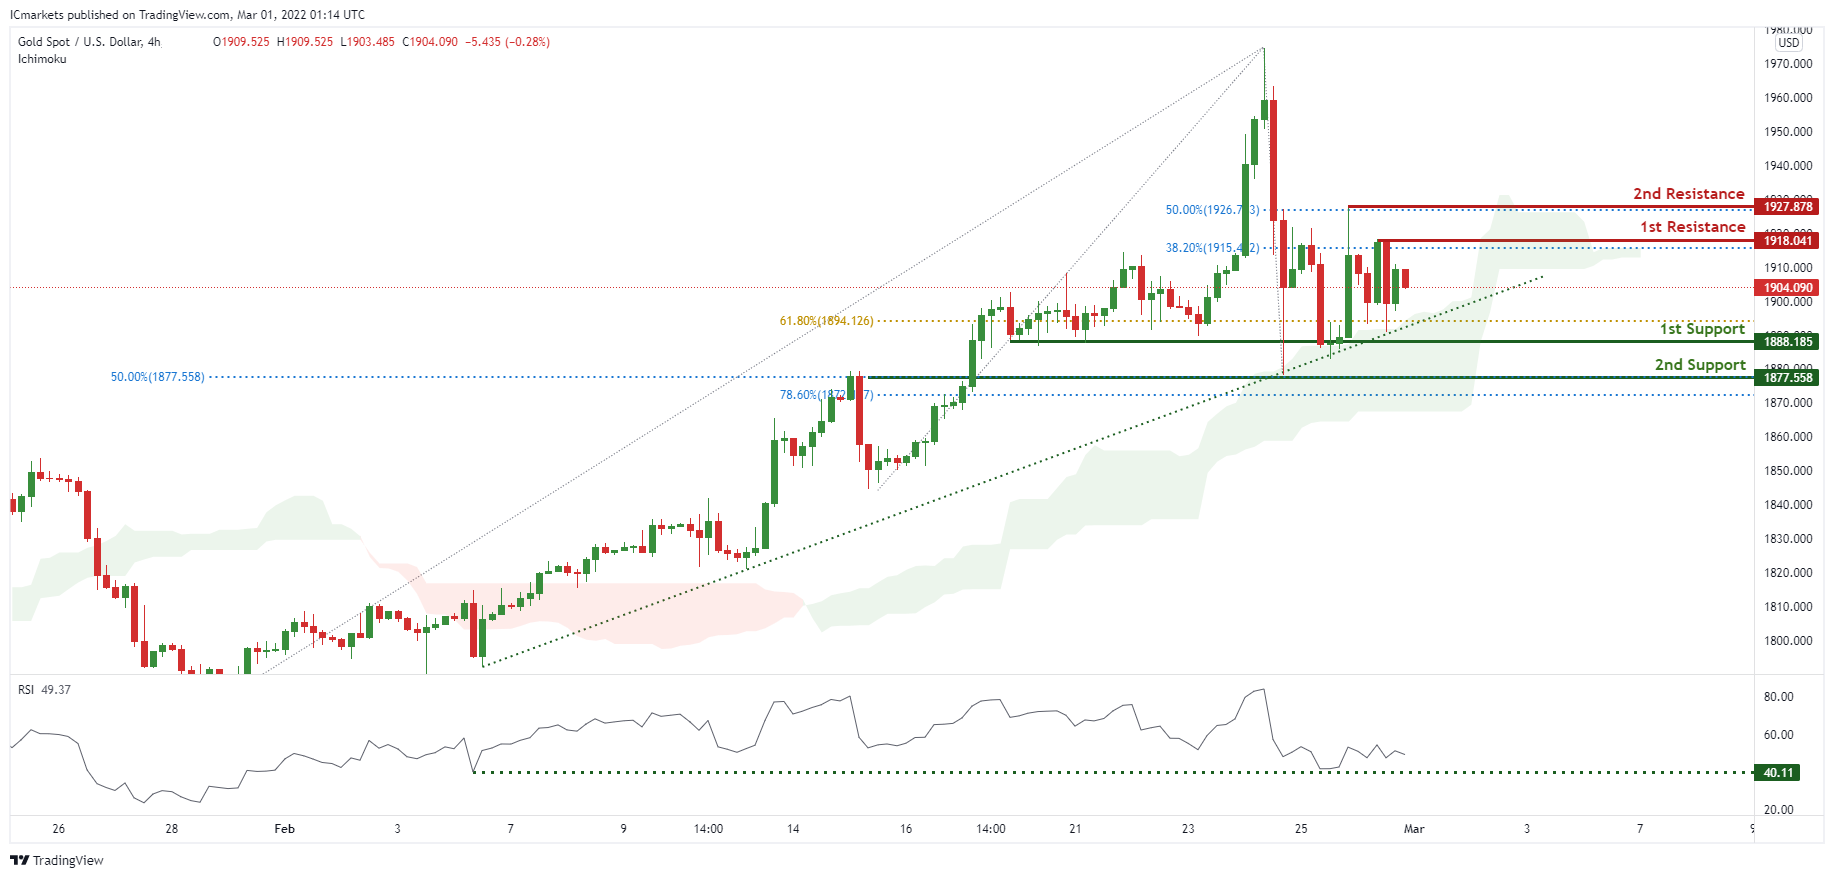
On the H4 chart, prices areon bullish momentum and abiding to our ascending trendline support. We see potential for further bullish continuation from our 1st support at 1888.185 in line with 61.8% Fibonacci extension towards our 1st resistance at 1918.041 in line with38.2% Fibonacci retracement. Our bbullish bias is further supported by RSI depicting bearish momentum and prices trading above our ichimoku clouds.
Areas of consideration:
- 4h 1st support at 1888.185
- 4h 1st resistance at 1918.041
GBP/USD
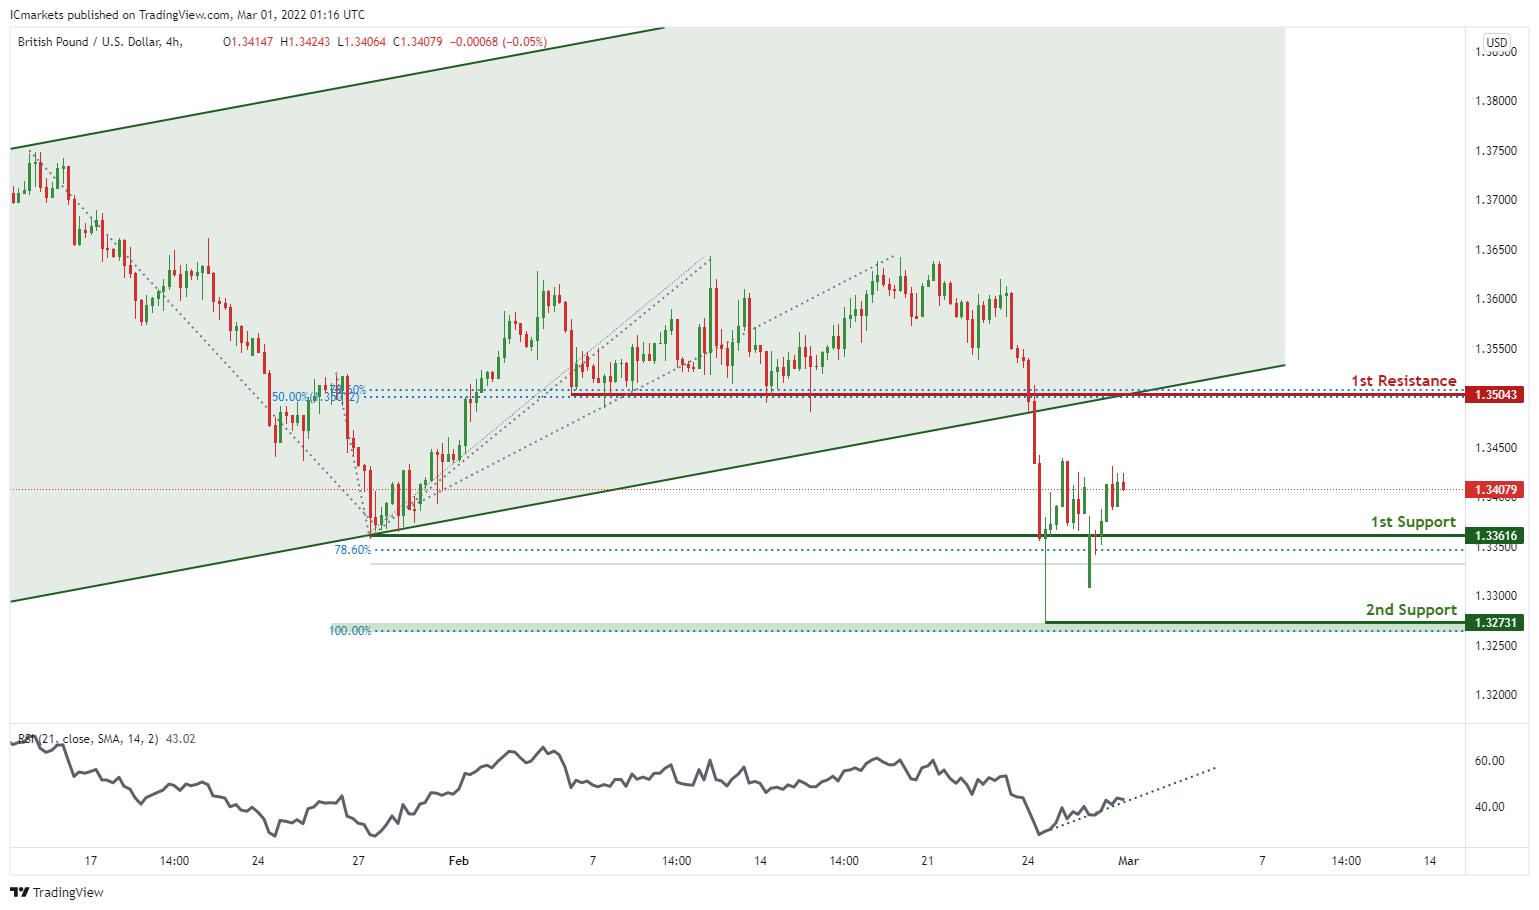
On the H4 chart , price has recently broken out of the ascending channel and is near 1st support level of 1.33561 in line with 78.6% Fibonacci projection. Price can potentially bounce from this level to 1st resistance level of 1.35043 in line with 50% Fibonacci retracement and 78.6% Fibonacci projection. Our bullish bias is supported by the stochastic indicator as it is at support level
Areas of consideration
- H4 1st resistance at 1.35043
- H4 1st support at 1.33561
USD/CHF:
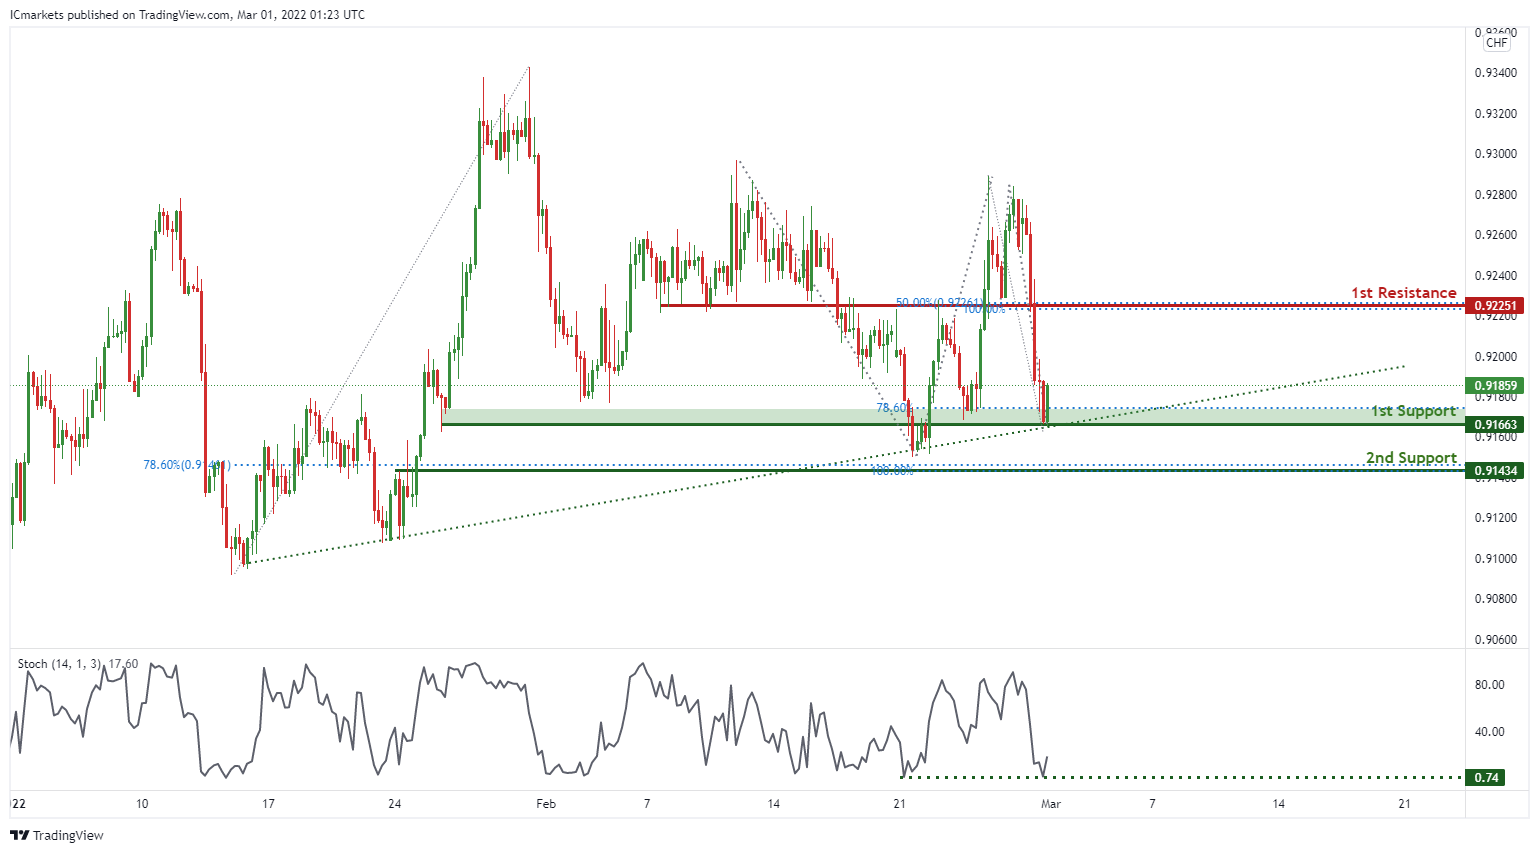
On the H4, price is abiding by an ascending trendline and near 1st support level of 0.91663 in line with 78.% Fibonacci projection. Price can potentially bounce to the 1st resistance level of 0.92251 in line with 50% Fibonacci retracement and 100% Fibonacci projection. Our bullish bias is supported by the stochastic indicator as it is at support level.
Areas of consideration
- 1st support level at 0.91663
- 1st resistance level at 0.92251
EUR/USD :
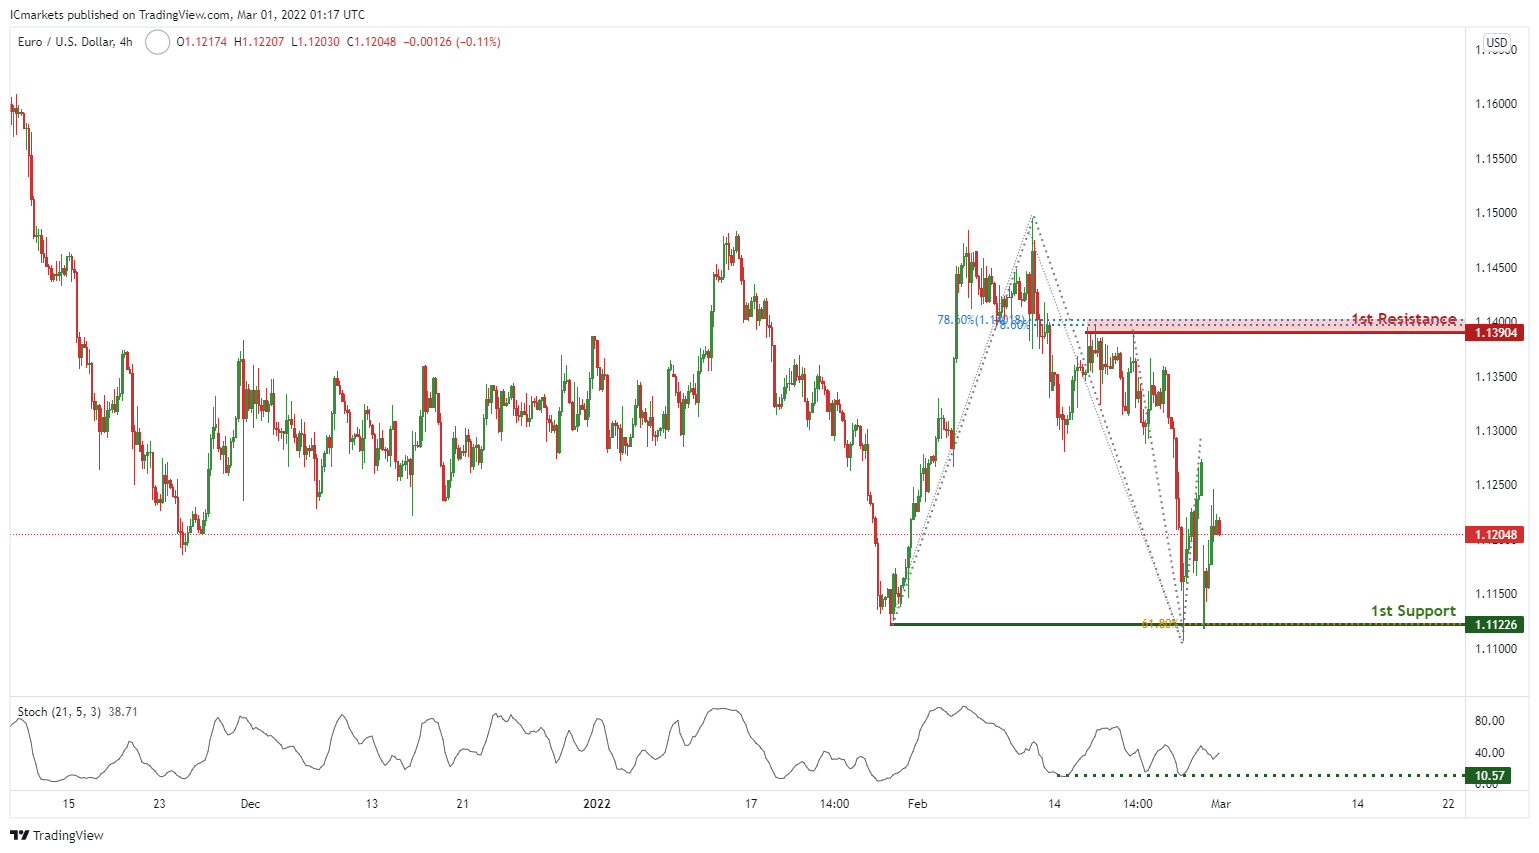
On the H4 chart price is near 1st support level of 1.11226 in line with 61.8% Fibonacci projection. Price can potentially go to the 1st resistance level of 1.13904 in line with 78.6% Fibonacci retracement and 78.6% Fibonacci projection. Our bullish bias is supported by the stochastic indicator as it is near support level.
Areas of consideration :
- H4 1st support at 1.11226
- H4 1st resistance at 1.13904
USD/JPY
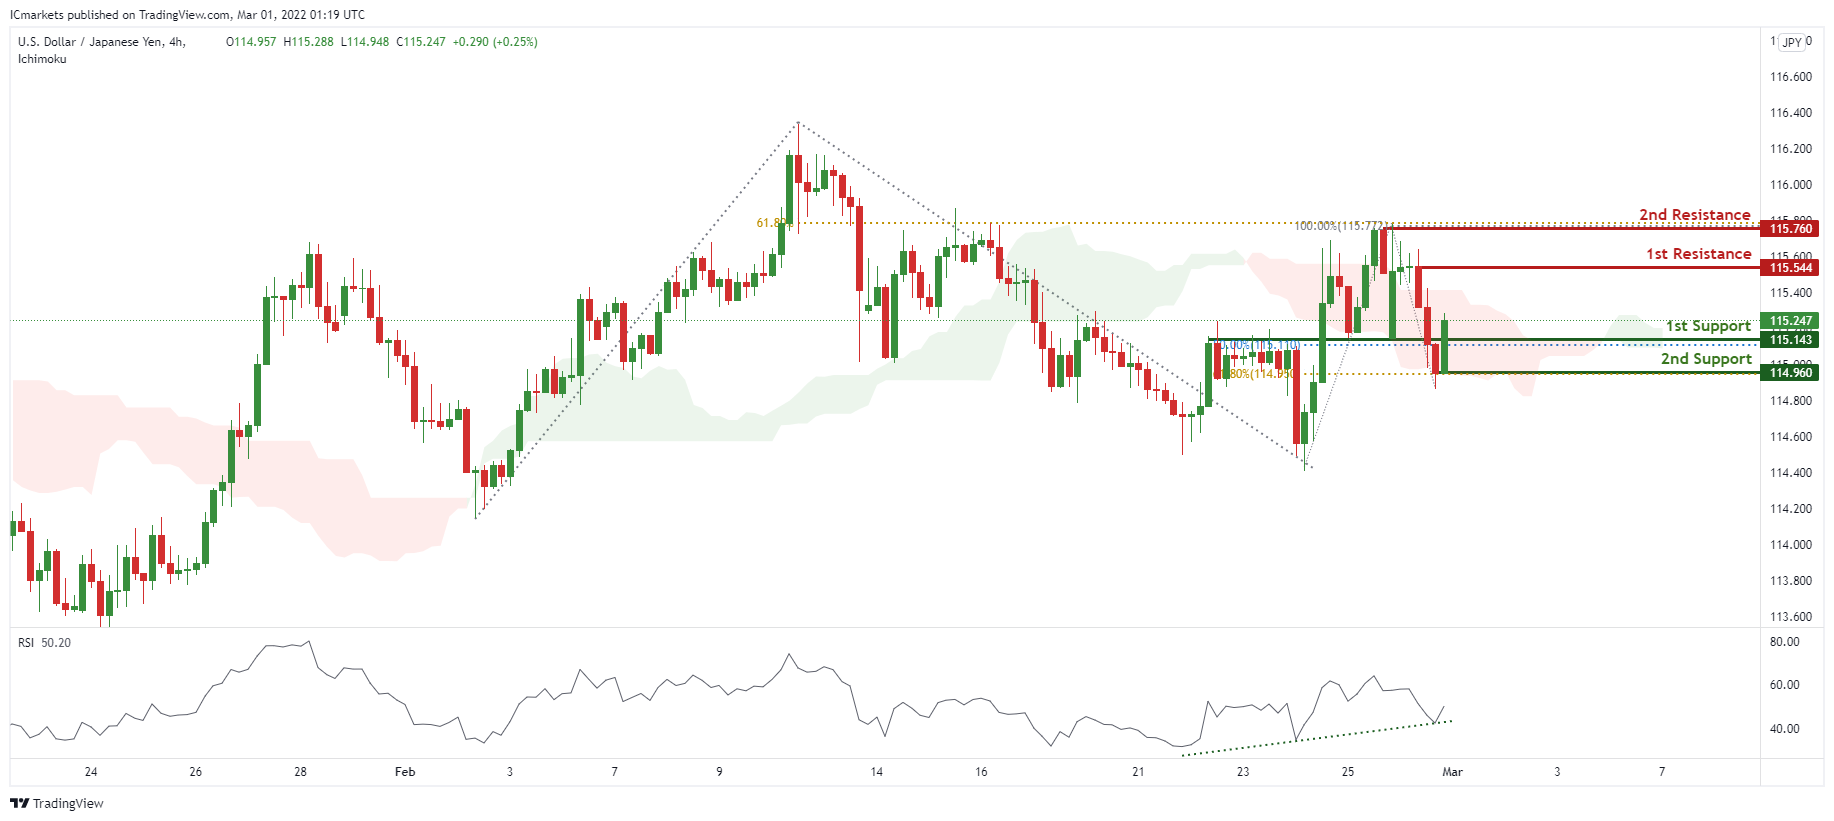
On the H4 timeframe, prices have recently bounced off a strong graphical overlap and also 1st support. We see the potential for further bullish continuation from our 1st support at 115.143 in line with 50% Fibonacci retracement towards our 1st resistance at 115.544 which is a recent swing high. Our bullish bias is further supported by ichimoku forecasting green clouds and RSI showing bullish momentum.
Areas of consideration:
- H4 time frame, 1st resistance at 115.544
- H4 time frame, 1st support at 115.143
AUD/USD:
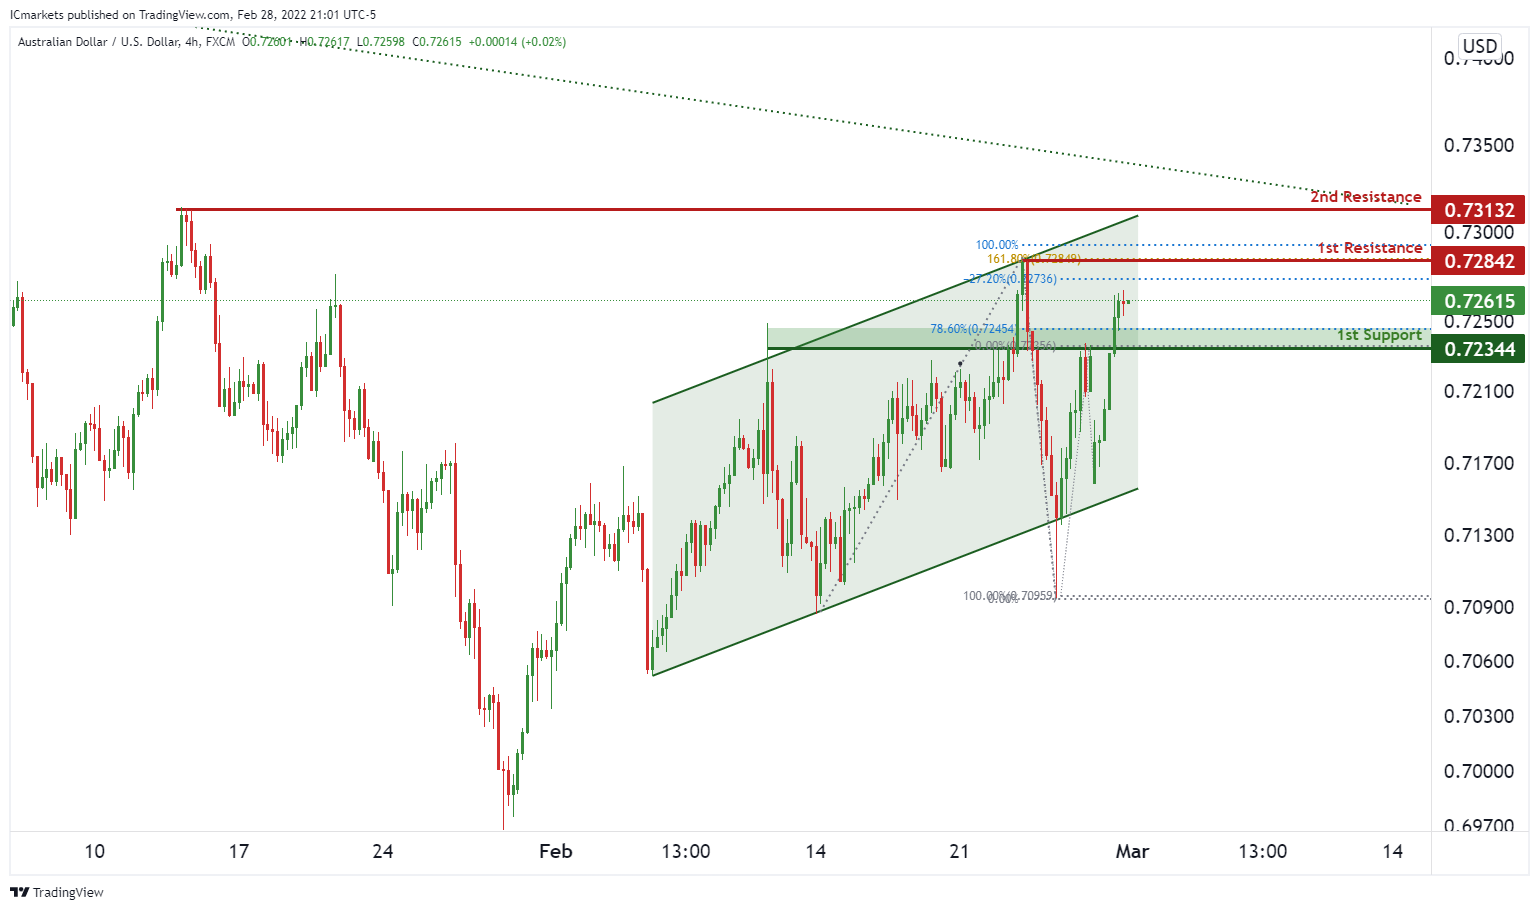
On the H4 chart, prices are moving along the ascending channel. We see potential for a bullish continuation from our 1st support at 0.72344 in line with 78.6% Fibonacci retracement and towards our 1st resistance at 0.72842 in line with Fibonacci confluence (100% Fibonacci projection, 161.8% Fibonacci extension, -27.2% expansion).
Areas of consideration :
- H4 1st support at 0.72344
- H4 1st resistance at 0.72842
NZD/USD:
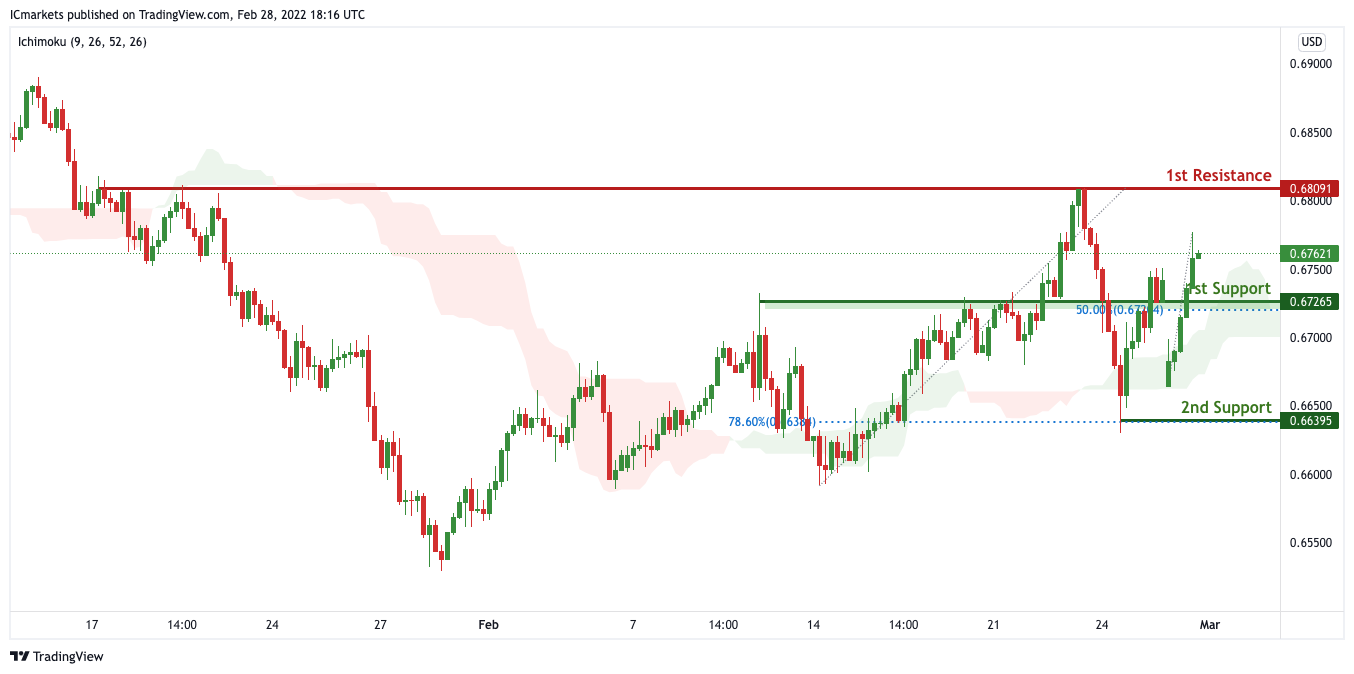
On the H4 chart, price is near 1st support level of 0.67265 in line with horizontal overlap support. Price can potentially rise to the 1st resistance level of 0.68091 in line with the horizontal swing high resistance. Alternatively, price may break 1st support and head for 2nd support at 0.66395. Our bullsh bias is supported by how price is expected to bounce off the support of the ichimoku cloud.
Areas of consideration:
- H4 time frame, 1st resistance at 0.68091
- H4 time frame, 1st support at 0.67265
USD/CAD:
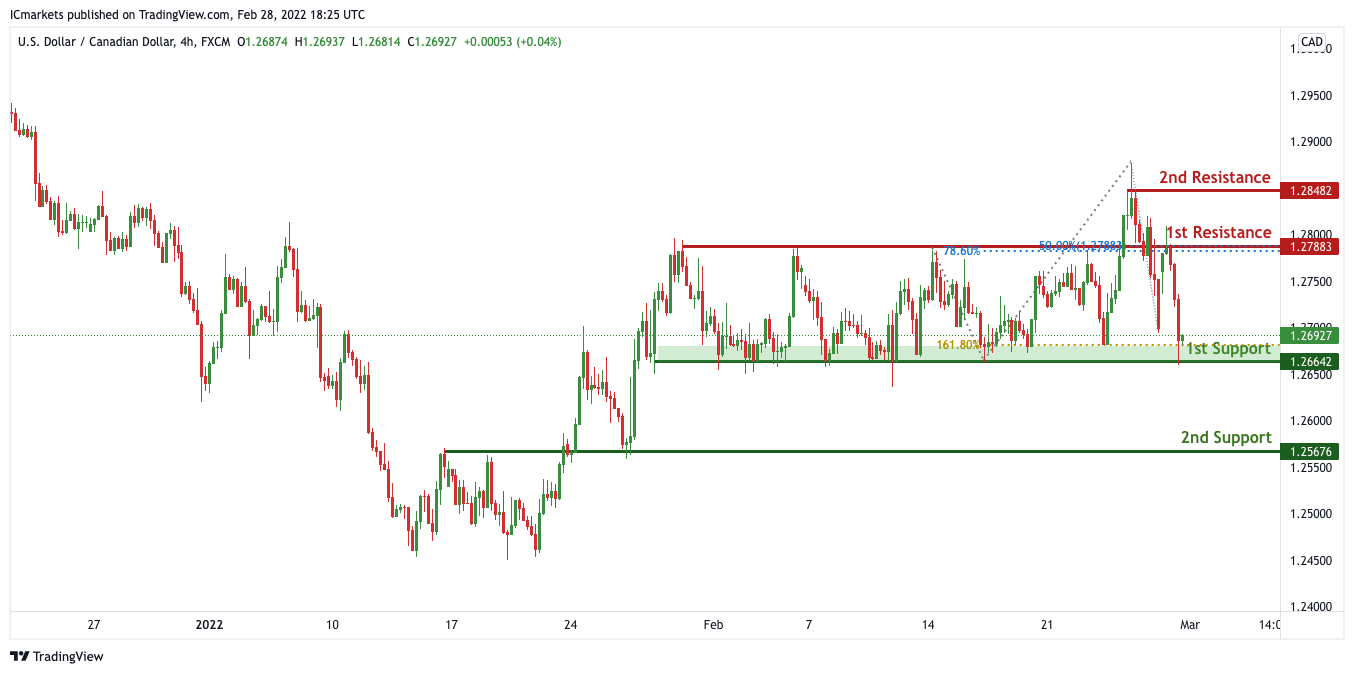
On the H4, price is ranging in between our 1st support and 1st resistance. We can expect price to rise from our 1st support at 1.26642 in line with 161.8% Fibonacci extension to our 1st resistance at 1.27883 which is a strong resistance and in line with 50% and 78.6% Fibonacci retracement. Alternatively, price may break 1st support structure and head for 2nd support.
Areas of consideration:
- H4 time frame, 1st support at 1.26642
- H4 time frame, 1st resistance at 1.27883
OIL:
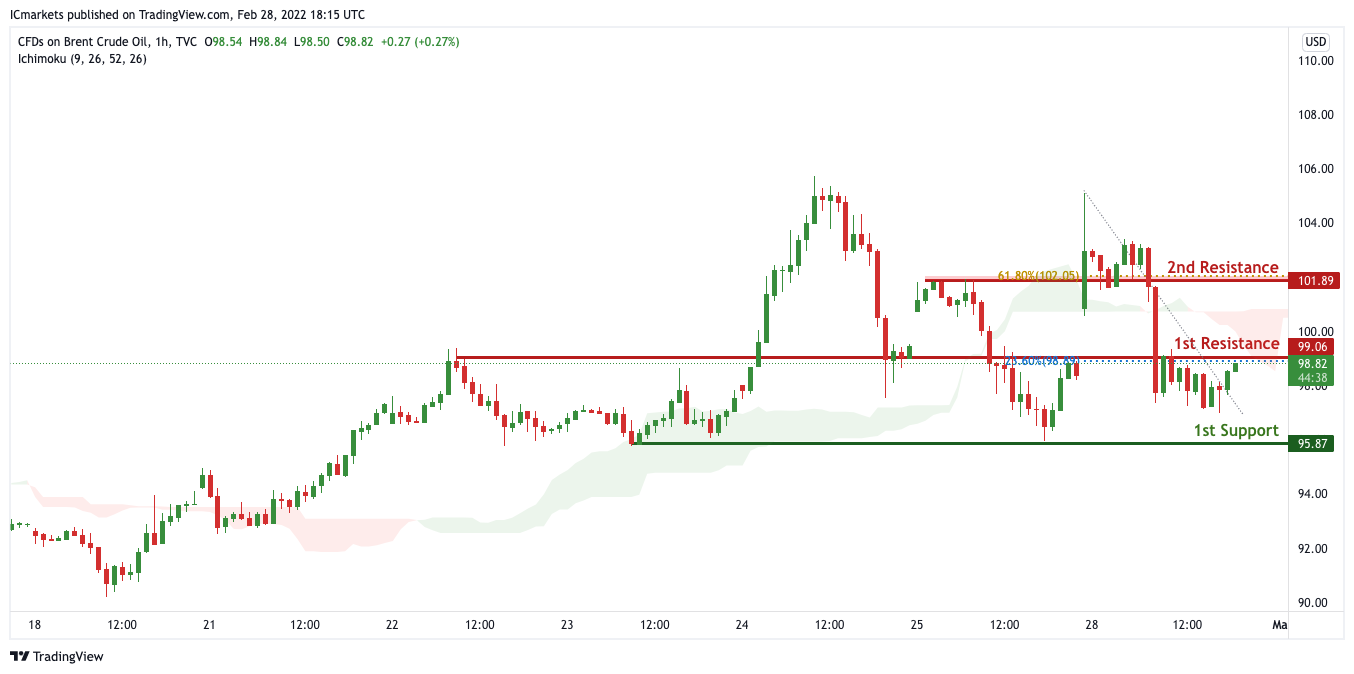
On the H4 timeframe, We see the possibility of bearish continuation from our 1st resistance at 99.06 in line with horizontal overlap resistance and 23.6% Fibonacci retracement towards our 1st support at 95.87 in line with the horizontal swing low support. Alternatively, price may break 1st resistance and head for 2nd resistance at 101.89 in line with the 61.8% Fibonacci retracement level. Our bearish bias is further supported by how price is moving below the ichimoku cloud
Areas of consideration:
- H4 time frame, 1st resistance of 99.06
- H4 time frame, 1st support of 95.87
Dow Jones Industrial Average:
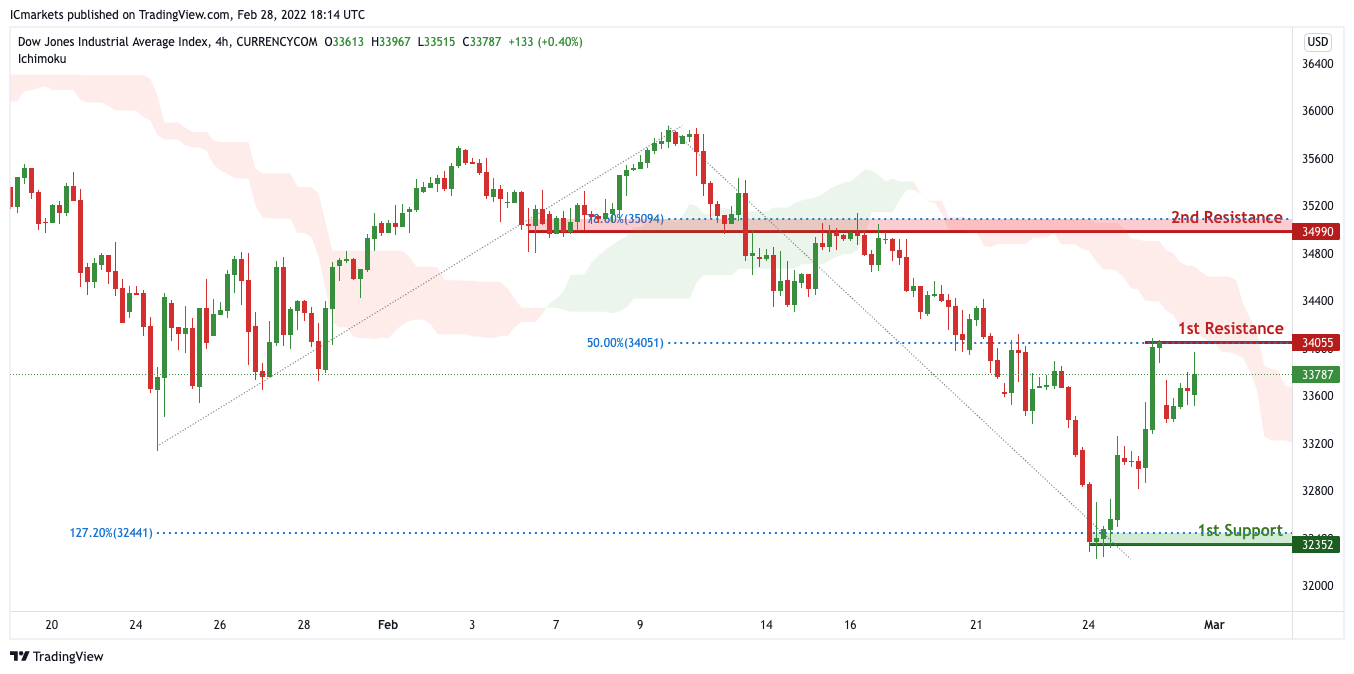
On the H4 timeframe, We see the possibility of bearish continuation from our 1st resistance at 34055 in line with horizontal overlap resistance towards our 1st support at 32352 in line with the horizontal swing low support. Alternatively, price may break 1st resistance and head for 2nd resistance at 34990 in line with the 78.6% Fibonacci retracement level. Our bearish bias is further supported by how price is moving below the ichimoku cloud
Areas of consideration :
- H4 1st support at 32352
- H4 1st resistance at 34055
GBP/USD Faces Uphill Task Near 1.3450
Key Highlights
- GBP/USD is attempting a recovery wave from the 1.3275 zone.
- It surpassed a connecting bearish trend line at 1.3370 on the 4-hours chart.
- EUR/USD could struggle if it stays below the 1.1280 resistance.
- The US ISM Manufacturing Index could increase from 57.6 to 58.0 in Feb 2022.
GBP/USD Technical Analysis
The British started a fresh decline from well above 1.3600 against the US Dollar. GBP/USD declined below the 1.3450 support zone to enter a bearish zone.
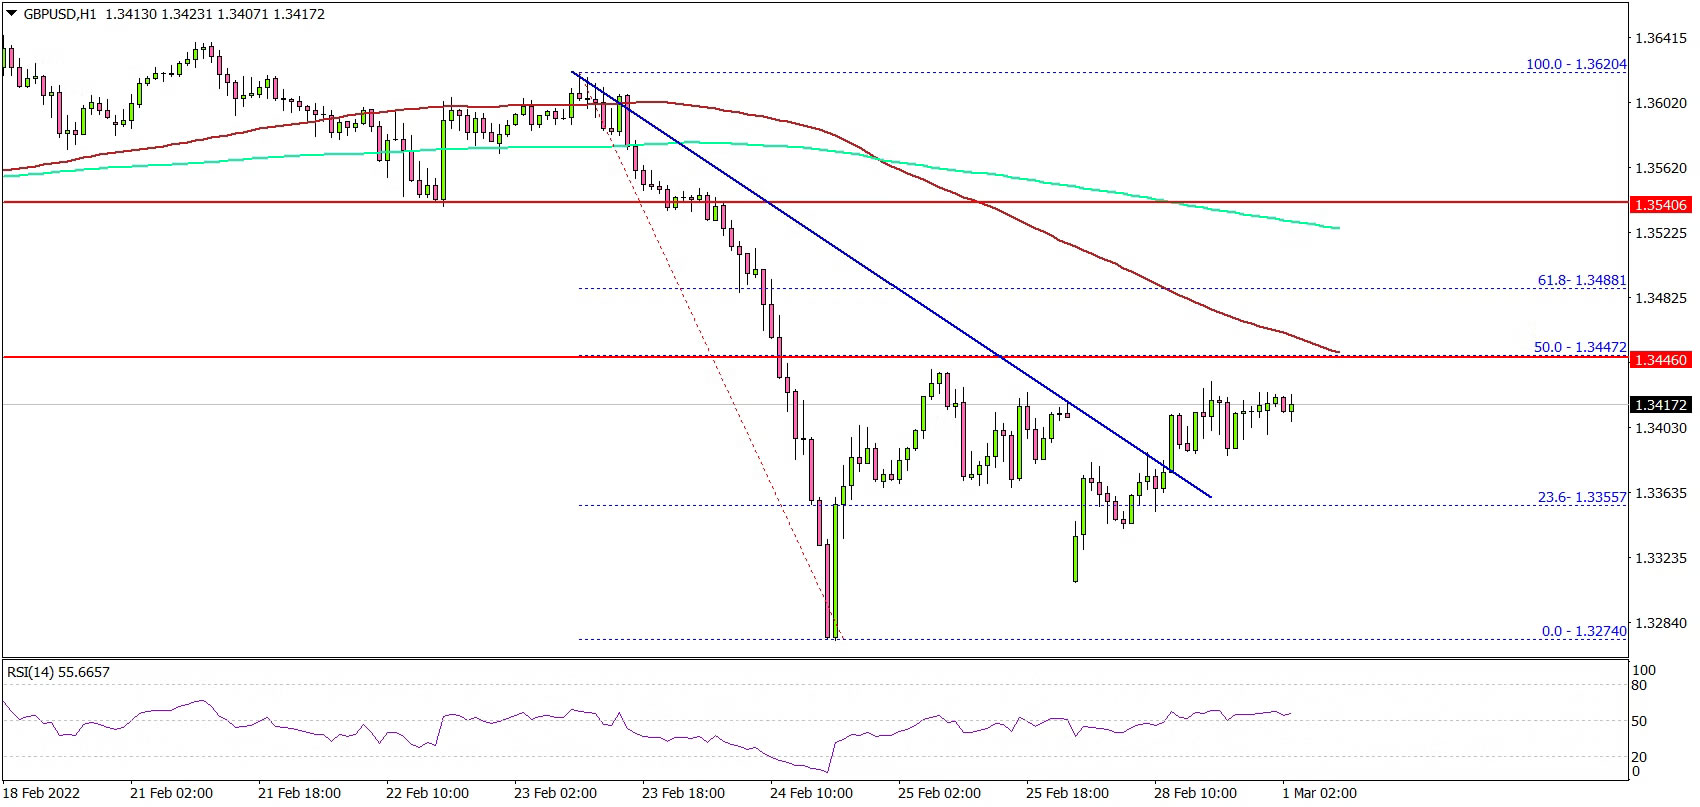
Looking at the 4-hours chart, the pair traded below the 1.3350 support zone. There was a close below the 1.3400 support zone, the 100 simple moving average (red, 4-hours), and the 200 simple moving average (green, 4-hours).
It even declined below 1.3300 and traded as low as 1.3274. It is now correcting losses above the 1.3320 resistance. There was a move above a connecting bearish trend line at 1.3370 on the same chart.
On the upside, the pair is facing a strong resistance near the 1.3440 and 1.3450 levels. It is near the 50% Fib retracement level of the downward move from the 1.3620 swing high to 1.3274 low. The next major resistance sits near the 1.3480 zone and the 100 simple moving average (red, 4-hours).
A close above 1.3480 might send GBP/USD higher towards 1.1450. On the downside, the pair might find bids near the 1.3350 level. If there are additional losses, the pair might dive to 1.3275.
Looking at EUR/USD, the pair is still showing bearish signs below the 1.1280 and 1.1320 levels. Besides, gold price is consolidating near the $1,900 level.
Economic Release
- Germany’s Manufacturing PMI for Feb 2022 - Forecast 58.5, versus 58.5 previous.
- Euro Zone Manufacturing PMI for Feb 2022 – Forecast 58.4, versus 58.4 previous.
- UK Manufacturing PMI for Feb 2022 – Forecast 57.3, versus 57.3 previous.
- US Manufacturing PMI for Feb 2022 – Forecast 57.5, versus 57.5 previous.
- US ISM Manufacturing Index for Feb 2022 – Forecast 58.0, versus 57.6 previous.
Eco Data 3/1/22
[php_everywhere instance="1"]
Eurozone CPI to Rise Again, Likely Add to ECB’s Dilemma Amid Ukraine Crisis
Inflation in the euro area again is heating up and data out on Wednesday (10:00 GMT) will probably underscore this trend. The harmonised index of consumer prices (HICP) is expected to have hit another record high in February, likely dashing hopes that inflation would begin to peak in the early part of 2022. But that’s not all. The war in Ukraine has exacerbated the energy crisis, meaning that soaring fuel prices could push inflation a lot higher over the coming months. Yet, the euro is sliding as the European Central Bank also has the economic costs of the Ukraine fallout to consider.
A short-lived hawkish tilt?
Before the geopolitical turmoil, the ECB was grudgingly plodding towards tighter policy, signalling to the markets that an early exit from quantitative easing was on the cards – a move that would also pave the way for an end of year rate hike. However, following the turn of events right on the EU’s doorstep, even the more hawkish voices within the ECB are having second thoughts about a speedy pull-out of stimulus policies.
Subsequently, investors have now started to scale back some of their previously aggressive rate hike bets, with the year-end market-implied rate being slashed by about 20 basis points. That, though, still suggests the ECB will raise its deposit rate by about 30 basis points by December, which shouldn’t be too surprising as the Eurozone’s inflation problem is unlikely to go away by itself.
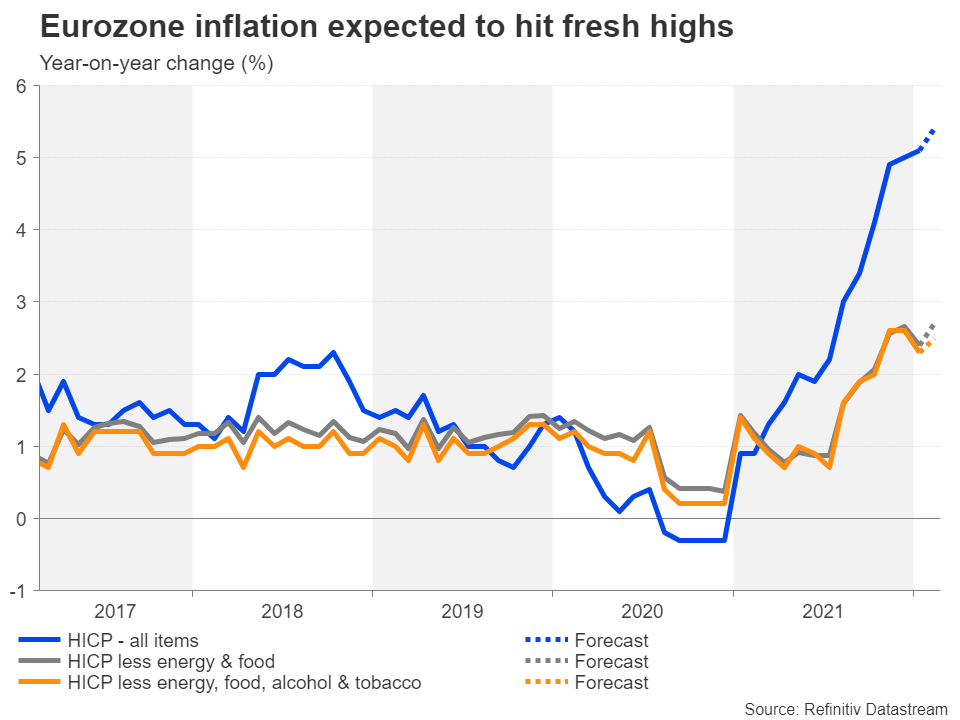
Eurozone inflation is still heading higher
The headline HICP rate is expected to have inched higher again in February, reaching a new all-time high of 5.4% year-on-year compared to 5.1% in January. More worryingly for policymakers, underlying measures have also risen to near record levels for the data series. HICP excluding food and energy is projected to reach 2.7% y/y, and the measure that additionally excludes alcohol and tobacco prices is forecast to edge up to 2.5%.
Avoiding a policy mistake
The ECB has so far stuck to its argument that most of the price pressures in the euro area stem from the surge in energy prices, which should fade over time, hence why it needs to be patient. But the crisis in Ukraine has complicated the policy path as the outlook has become even murkier than before. On the one hand, inflation is almost certain to peak much higher, on the other, growth is bound to take a hit.
The dilemma for the ECB is striking the right balance. If policymakers do too little too late to stifle inflation, there would be a greater risk of second-round effects where higher prices become embedded in the economy. If they overreact as President Christine Lagarde has repeatedly warned, they could end up choking the recovery.
Is the euro selloff justified?
Markets already appear to have made up their minds, however, pushing the euro sharply lower as the conflict in Ukraine unfolded. The single currency plummeted to a near 21-month low of $1.1105 in the aftermath of Russia’s invasion. It has since rebounded to above the $1.12 level, but unless it can climb back above the 61.8% Fibonacci retracement of the March 2020-January 2021 uptrend at $1.1290, the positive momentum could easily dwindle, opening the way for a retest of the $1.1105 low, followed by the 78.6% Fibonacci of $1.1002.
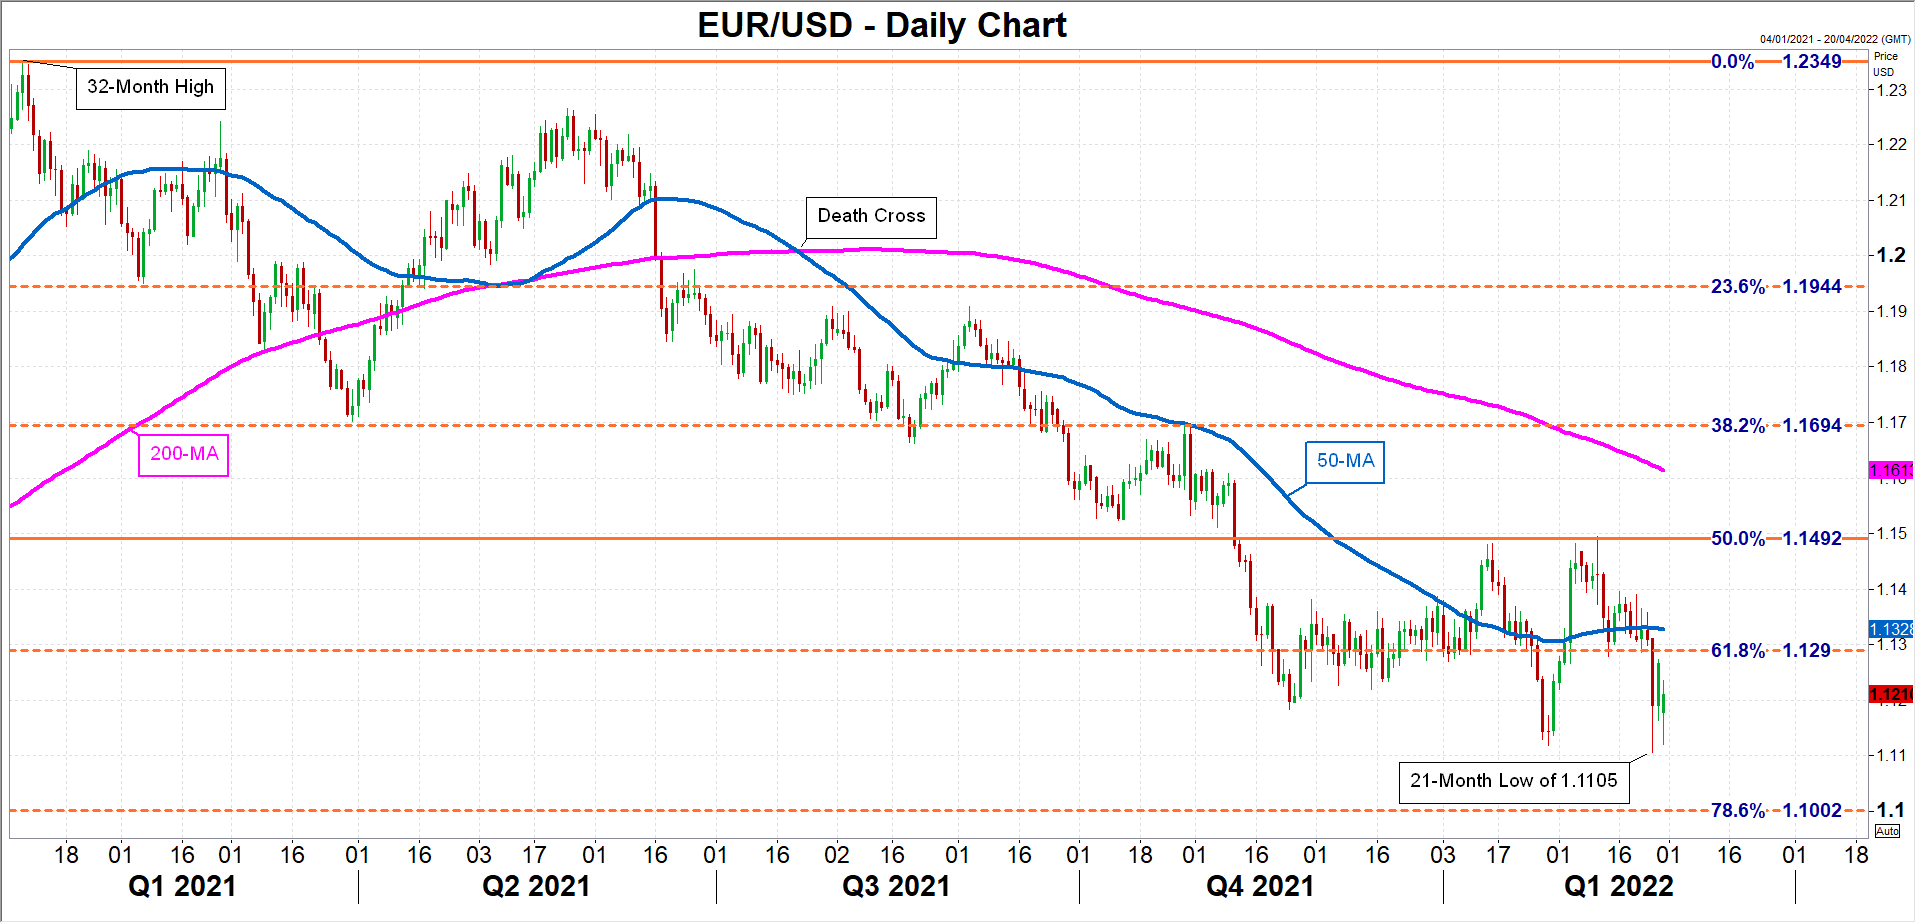
If, though, tensions between Ukraine and Russia de-escalate soon, for example, by agreeing to a ceasefire, the ECB might just be able to proceed with a reduced timeline of policy normalization come the March meeting, propelling the euro higher. In such a scenario, the bulls could target the 50% Fibonacci of $1.1492, which is close to the double top created in January and February.
The main danger for traders is that even if the ECB does turn more dovish in March, they may be underestimating the extent of the hawkish shift that was underway prior to the Ukraine war, in which case, a significantly pared back normalization plan might not seem so pared back in comparison to their own expectations.
Sunset Market Commentary
Markets
Russia is hurrying to defend its tanking currency in the wake of new sanctions announced by Europe and the US. By cutting the Bank of Russia’s access to its international reserves, they prevent the central bank from cushioning the blow on the currency and economy. The US Treasury Department later added more sanctions, banning transactions by US persons with the Russian central bank, the National Wealth Fund and the Ministry of Finance. In a response, the CBR jacked up policy rates from 9.5% to 20% at an emergency meeting this morning, forced Russian companies to sell 80% of their foreign currency revenue to the central bank and temporarily banned brokers from selling Russian securities held by foreigners. The Russian ruble continues to be under intense selling pressure, with moves exacerbated by liquidity issues since many dealers are no longer allowed to trade the currency. EUR/RUB gapped higher from 94.35 to 130.89 before paring some gains (ruble losses) to 122.1. Russian CDS’s surge with some suggesting a >50% probability to default. Russia’s central bank closed the stock market today but Russian stocks trading on exchanges elsewhere fall off a cliff.
It is nothing but risk-off on all other financial markets as well. Stocks decline 2.5% though are off their lows of the day. Wall Street keeps it orderly, printing losses of about 1.5%. Core bonds are a popular safe haven bet. The US yield curve bull steepens with yields 5.2 (30y) to 11 bps (2y) lower. German yields decline 6 (10y) to 11 bps (2y). European swap yields drop 6.5 bps at the front end. For now though, this may be more of a kneejerk reaction rather than markets actually repricing central bank intentions. In case of the euro zone, above-consensus inflation in Spain (7.5% y/y vs 7% expected) today once again highlighted the matter at hand. It followed the 4.1% reading in France (3.7% expected) last week. If anything, current market developments only add fuel to the fire with oil, wheat and corn prices surging 3-4% again. Gas jumps 15%. On currency markets, the yen and dollar started off strongly but the rally fizzled in European dealings. EUR/USD tested support at 1.1121 before rebounding north of 1.12. EUR/JPY hit 128 but is currently changing hands in the 129.3 area. The Swiss franc is the only one holding on to almost all of the intraday gains. EUR/CHF trades near the 1.03 pivot. Things in Central-Europe are precarious. The Hungarian forint underperforms and is set for a record low close at 371.93 currently. PLN is attacking the 13-year low of November last year at around EUR/PLN 4.70. The Czech currency could erase all of the 2022 gains so far by closing within proximity of EUR/CZK 25. News Headlines
According to data from Turkstat published this morning, the Turkish economy last year expanded by 11%. Value added in the services sector grew 21.1%, information and communication activities +20.2%, professional administration and support + 17.3% and 16.6% in industry. Financial and insurance activities, agriculture and construction decreased by 9%, 2.2% and 0.9% respectively. On the demand side, final consumption expenditure of households increased by 15.1%, with the share of household consumption in GDP reaching 55.1%. In Q4, growth slowed to 1.5% Q/Q and 9.1% Y/Y. A separate report showed a sharp rise in the trade deficit from TRY 6.81 bln in December to TRY 10.26 bln in January (was only TRY 3.06 bln in January last year). The rising trade deficit (amongst others due to the higher cost of energy import) complicates the authorities’ efforts to restore a current account surplus which is seen as an important factor to restore financial stability. The lira recently traded stable despite global market tensions. EUR/TRY even declined today to trade at 15.54.
Switzerland’s economic growth in Q4 slowed to 0.3% Q/Q down from 1.9% in the previous quarter as the economy was hampered by the latest corona wave. However, the industrial sector remained buoyant due to the chemical and the pharmaceutical sector. The economy grew 3.7% for the whole of 2021 after a -2.4% contraction in 2020 and returned to a pre-corona level by summer 2021.
Aussie Active ahead of RBA Meeting
The Australian dollar started the trading week with considerable losses but has recovered and is unchanged on the day.
Volatility continues due to Ukraine crisis
The financial markets remain focused on Ukraine, where the Russian invasion continues and the capital Kyiv is bracing for a Russian onslaught at any time. Russian and Ukrainian officials are currently meeting on the Belarus-Ukraine border to discuss a cease-fire, although expectations for a breakthrough are low. Still, if there are any positive developments from the meeting, it would boost risk sentiment which would be bullish for the Australian dollar. In the meantime, the greenback remains strong, as jittery investors have snapped up the safe-haven dollar. The dollar index has pared some of today’s gains, and is currently at 96.83, up 0.23%.
The Ukraine crisis has led to significant volatility in the market, which has increased after the US and Western Europe imposed stronger sanctions against Moscow on the weekend. The EU is financing and delivering weapons to Ukraine, which is the first time the bloc is shipping weapons to a county at war. No less important, the West has also cut off some Russian banks from SWIFT, the global fund transfer system, although it has not targeted transfers related to energy. Russia is already feeling the sanctions bite, as the ruble has fallen sharply and the Russian central bank responded by raising interest rates from 9.5% to 20% to boost the Russian currency. We’re likely to see more volatility during the week, as events in Ukraine continue to unfold.
The RBA holds a policy meeting on Tuesday. The central bank is expected to maintain rates at a record low 0.10%, but the tone of the rate statement could trigger a reaction from the markets. Inflation has risen to the bank’s target band of 2-3%, but the RBA has insisted that wage growth must accelerate to 3% before conditions are ripe for a rate hike. If the statement indicates that the RBA has become more hawkish, the Aussie could rise as a result. Conversely, a negative assessment about the economy would dampen rate hike expectations and the Aussie would likely lose ground.
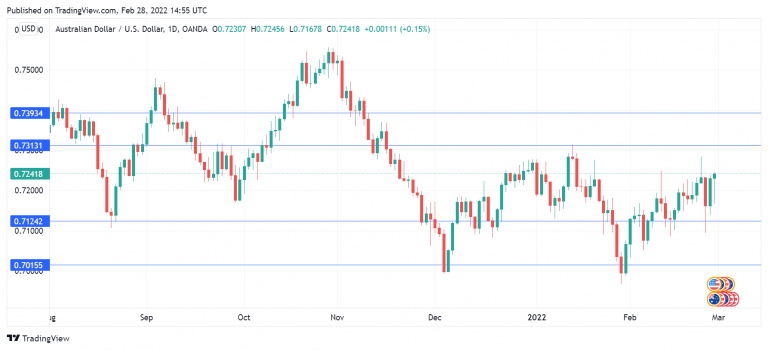
AUD/USD Technical
- There is resistance at 0.7313 and 0.7393
- AUD/USD has support at 0.7124 and 0.7015
USD/JPY Mid-Day Outlook
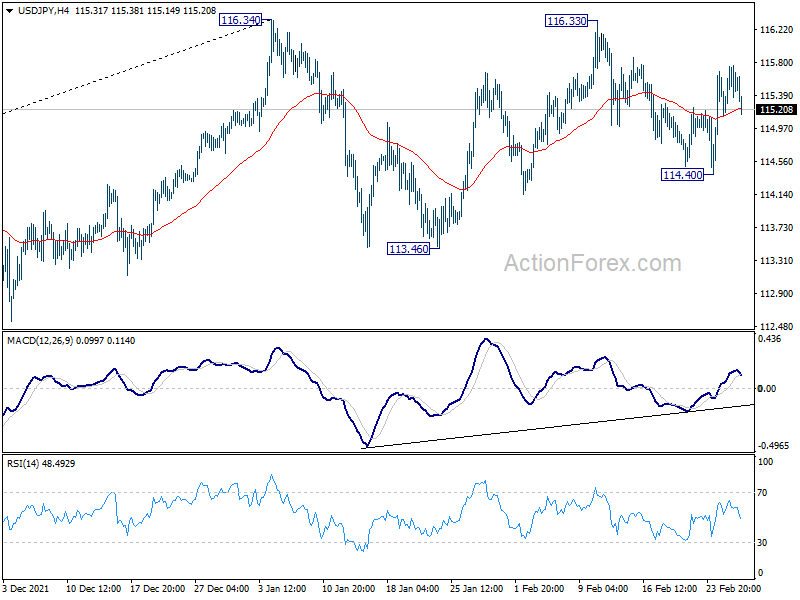
Daily Pivots: (S1) 115.21; (P) 115.48; (R1) 115.82; More...
Sideway trading continues in USD/JPY and intraday bias remains neutral for the moment. On the upside, firm break of 116.34 will resume larger up trend from 102.58 to 118.65 long term resistance next. On the downside, though, break of 114.40 will continue the corrective pattern from 116.34 with another fall to 113.46 support.
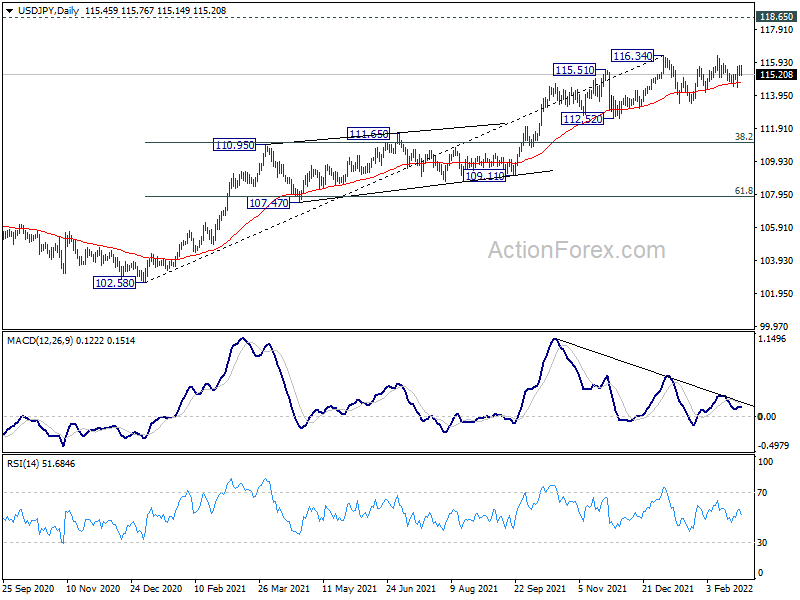
In the bigger picture, no change in the view that rise from 102.58 is the third leg of the up trend from 101.18 (2020 low). Such rally should target a test on 118.65 (2016 high). Sustained break there will pave the way to 120.85 (2015 high) and raise the chance of long term up trend resumption. This will remain the favored case as long as 55 week EMA (now at 111.64) holds.
USD/CHF Mid-Day Outlook
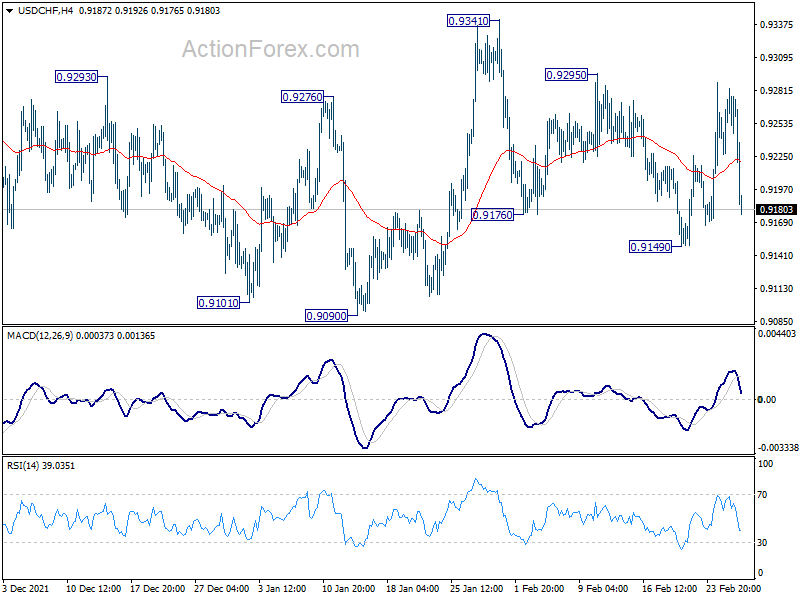
Daily Pivots: (S1) 0.9227; (P) 0.9256; (R1) 0.9282; More....
Sideway trading continues in USD/CHF and intraday bias remains neutral at this point. Choppy rise from 0.8925 would still be in favor to extend higher as long as 0.9090 support holds. Break of 0.9341 will target 0.9372 resistance and then 0.9471. On the downside, however, break of 0.9090 will bring deeper fall back to 0.8925 support.
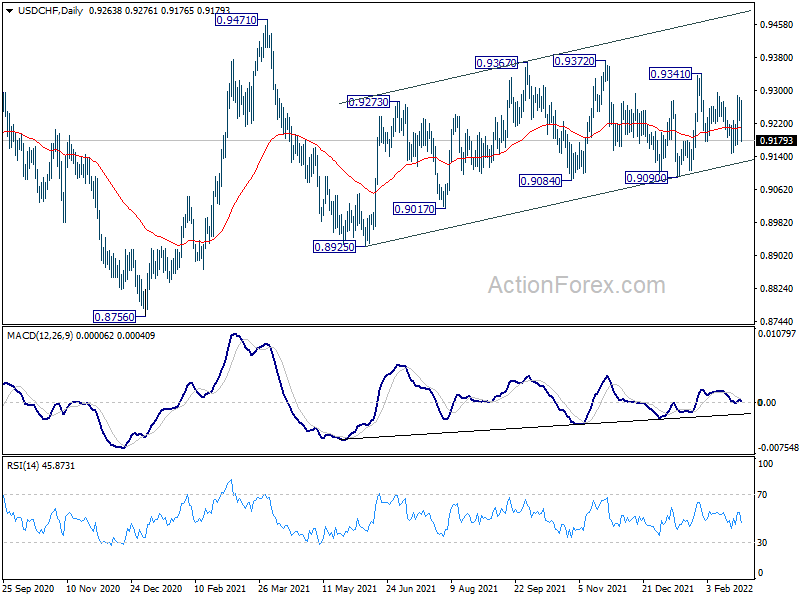
In the bigger picture, medium term outlook will be neutral at best as long as 0.9471 resistance holds. Larger down trend could still extend through 0.8756 (2021 low). However, firm break of 0.9471 will argue that the trend has already reversed and rebound the rally from 0.8756 with another impulsive move.
GBP/USD Mid-Day Outlook
Daily Pivots: (S1) 1.3372; (P) 1.3406; (R1) 1.3444; More...
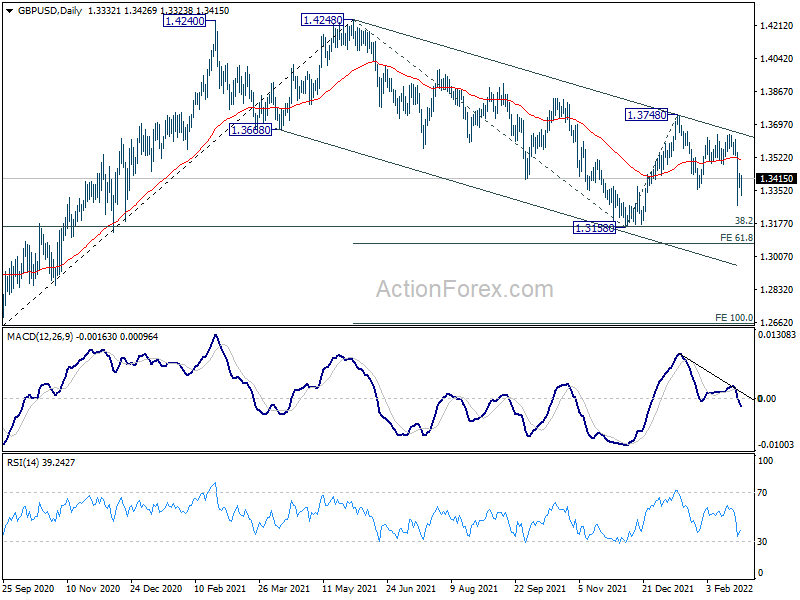
Intraday bias in GBP/USD stays neutral for consolidation above 1.3272. Further fall is expected as long as 1.3485 support turned resistance holds. On the downside, break of 1.3272 will target 1.3158 low. However, firm break of 1.3485 will dampen this bearish view and turn bias back to the upside for 1.3641 resistance.
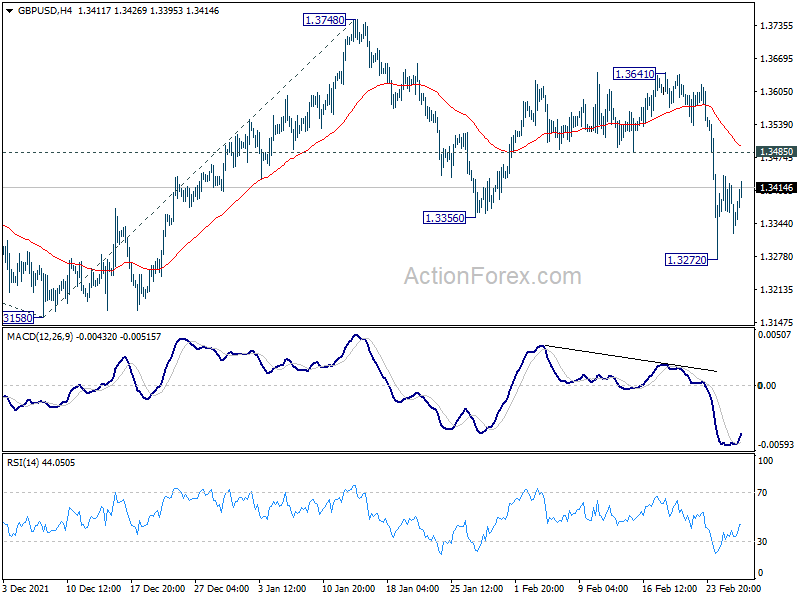
In the bigger picture, as long as 38.2% retracement of 1.1409 to 1.4248 at 1.3164 holds, up trend from 1.1409 (2020 low) is still in progress. On resumption, next target will be 38.2% retracement of 2.1161 to 1.1409 at 1.5134. Nevertheless sustained break of 1.3164 will argue that whole rise from 1.1409 has completed and bring deeper fall to 61.8% retracement at 1.2493.