Sample Category Title
Japan industrial production dropped -1.3% mom in Jan, retail sales rose 1.6% yoy
Japan industrial production dropped -1.3% mom in January, worse than expectation of -0.7% mom. Output declined for the second month, after the -1.0% mom contraction in December. Production of cars and other motor parts slumped -17.2% mom, falling for the first time in four months.
Nevertheless according to survey by the Ministry of Economy, Trade and Industry (METI), output is expected to bounce back by 5.7% mom in February and 0.1% mom in March. But the forecasts were taken before Russia's invasion of Ukraine, which impact is still unknown.
Retail sales rose 1.6% yoy, above expectation of 1.1% yoy, fourth consecutive month of expansion.
Technical Outlook and Review
DXY:
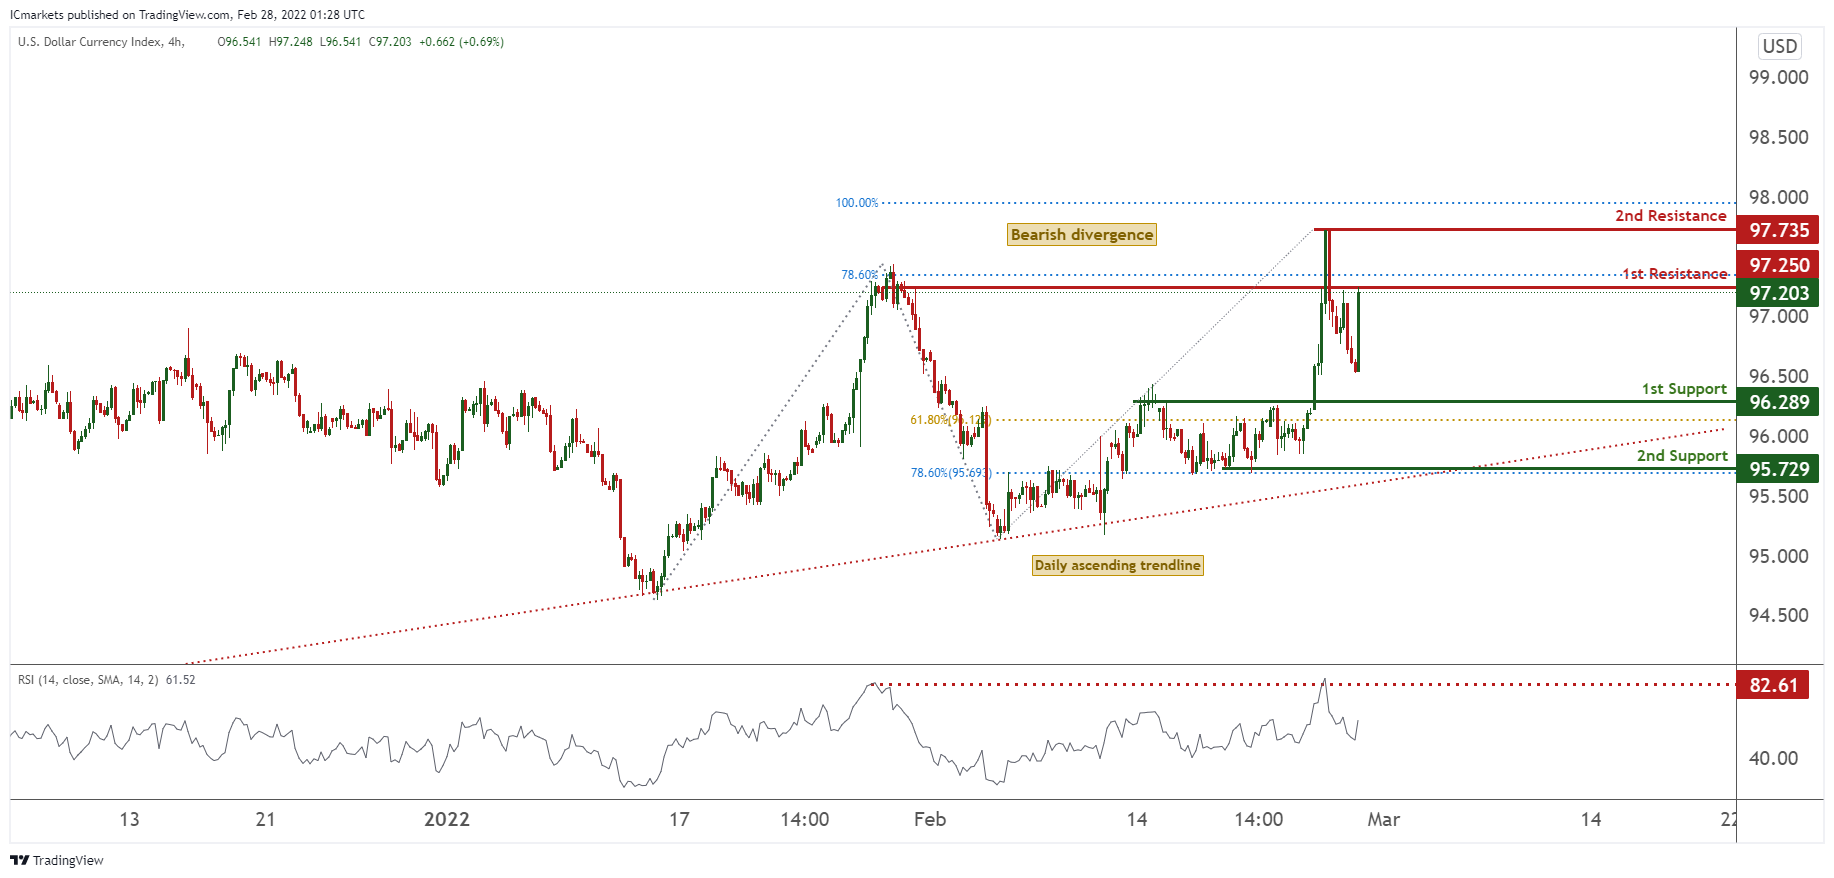
On the H4 timeframe, prices are on bullish momentum and abiding to an daily ascending trendline. We see the potential for bearish dip from our 1st resistance at 97.250 in line with 78.6% Fibonacci extension towards our 1st support at 96.289 in line with 61.8% Fibonacci retracement. RSI is at a level where dips occurred previously further supporting our bearish bias.
Areas of consideration:
- H4 time frame, 1st resistance at 97.250
- H4 time frame, 1st support at 96.289
XAU/USD (GOLD):
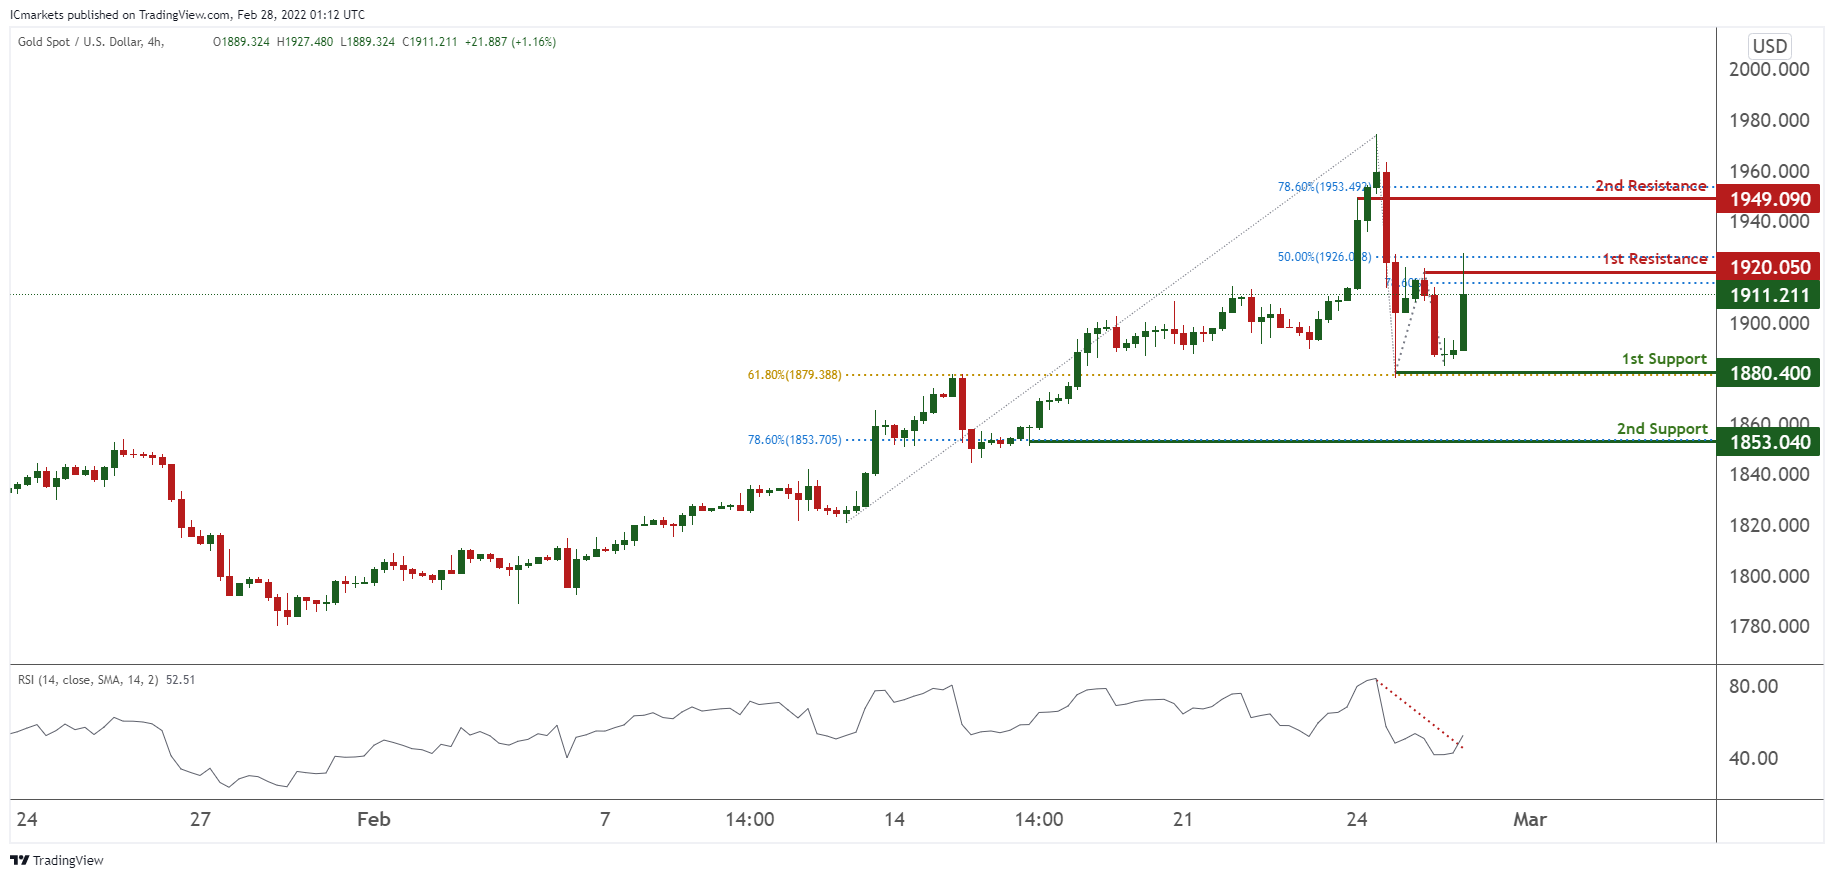
On the H4 chart, prices are at a pivot and at a graphical resistance. We see potential for a dip from our 1st resistance at 1920.050 in line with 78.6% Fibonacci extension and 50% FIbonacci retracement towards our 1st support at 1880.400 in line with 61.8% Fibonacci retracement. Our beairsh bias is further supported by RSI depicting bearish momentum.
Areas of consideration:
- 4h 1st support at 1880.400
- 4h 1st resistance at 1920.050
GBP/USD:
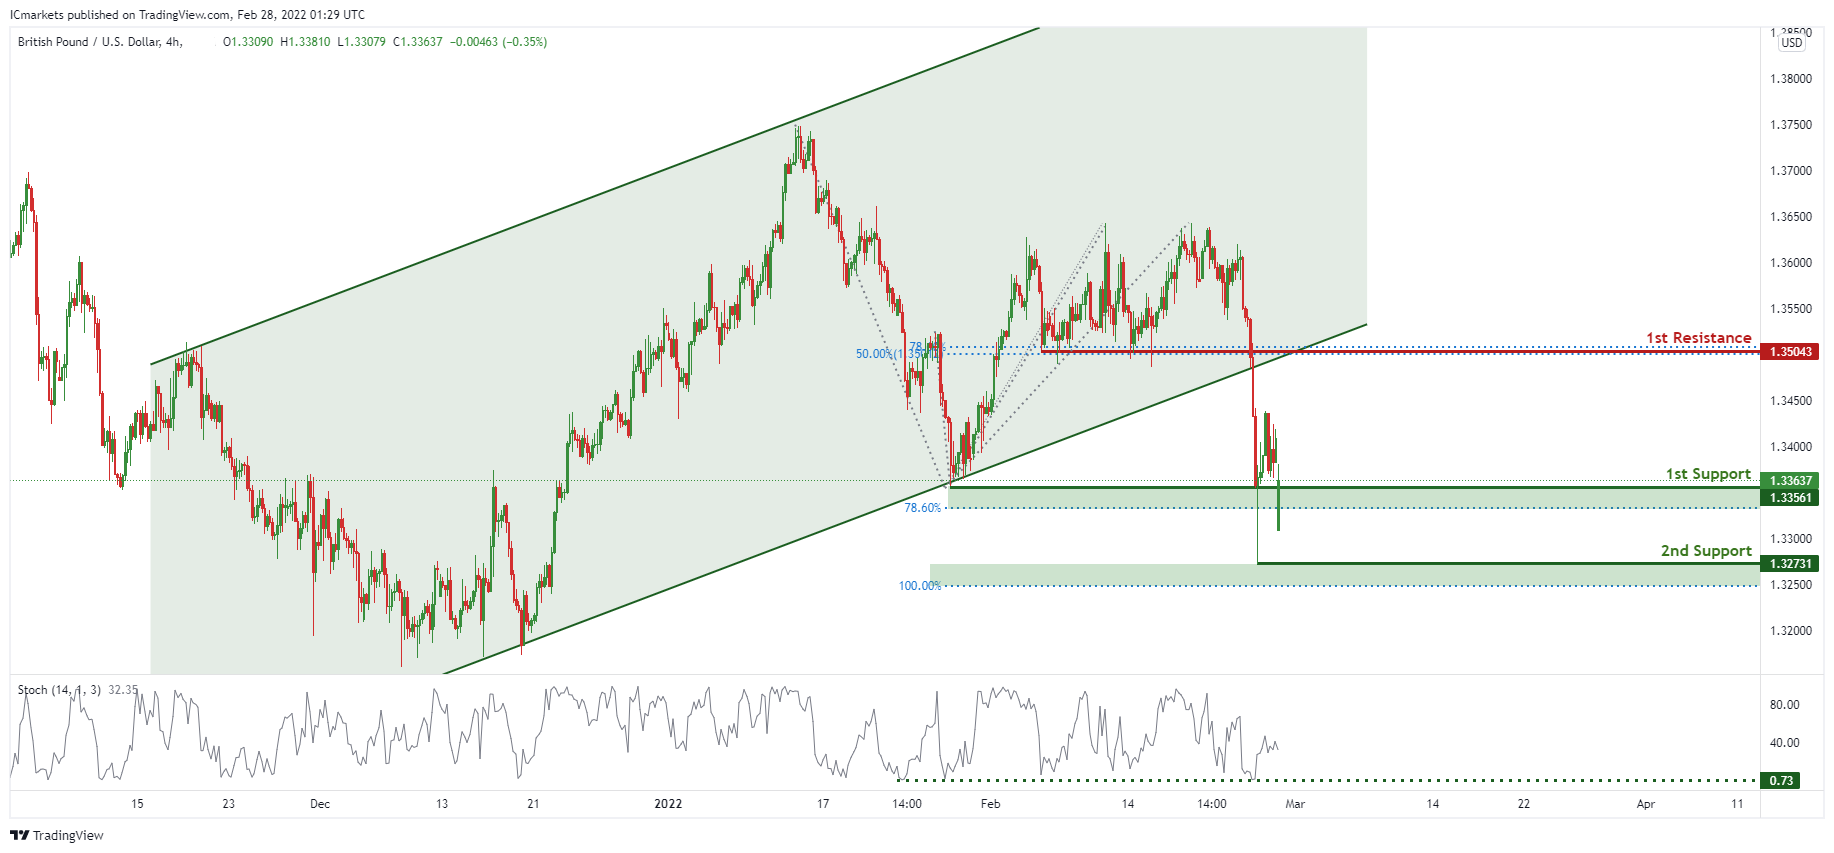
On the H4 chart , price has recently broken out of the ascending channel and is near 1st support level of 1.33561 in line with 78.6% Fibonacci projection. Price can potentially bounce from this level to 1st resistance level of 1.35043 in line with 50% Fibonacci retracement and 78.6% Fibonacci projection. Our bullish bias is supported by the stochastic indicator as it is at support level
Areas of consideration
- H4 1st resistance at 1.35043
- H4 1st support at 1.33561
USD/CHF:
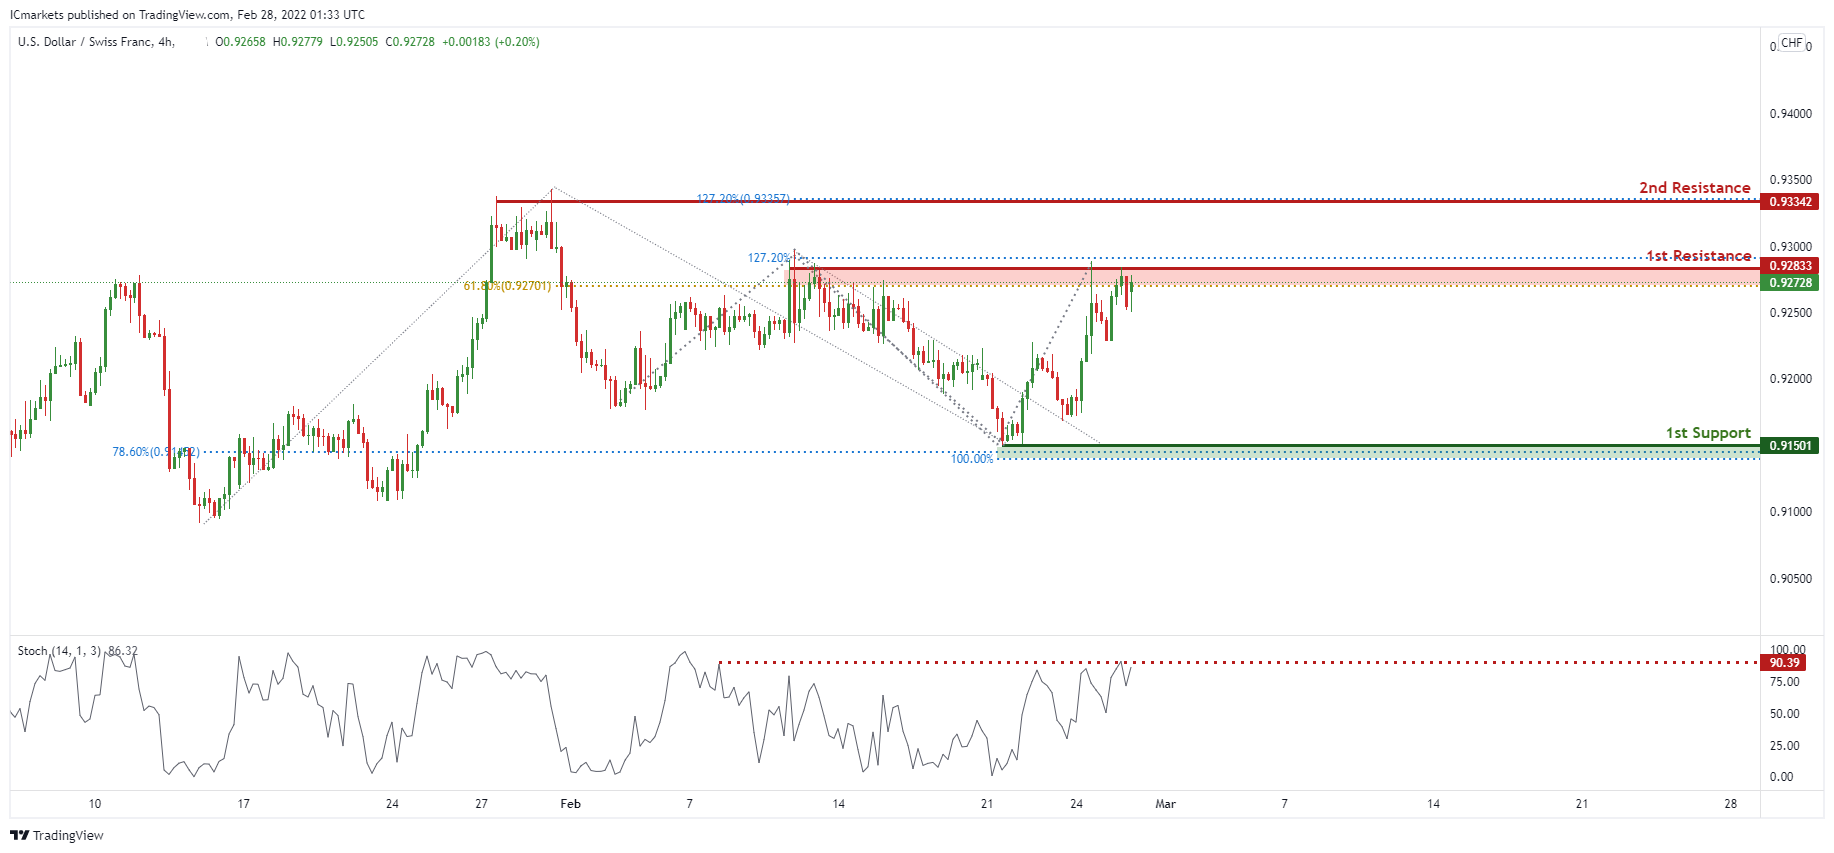
On the H4 chart , price is near the first resistance level of 0.92833 in line with 61.8% Fibonacci retracement and 127.2% Fibonacci projection. Price can potentially dip to the 1st support level of 0.91501 in line with 100% Fibonacci projection and 78.6% Fibonacci retracement. Our bearish bias is supported by the stochastic indicator as it is at resistance level.
Areas of consideration :
- H4 1st resistance at 0.92833
- H4 1st support at 0.91501
EUR/USD :
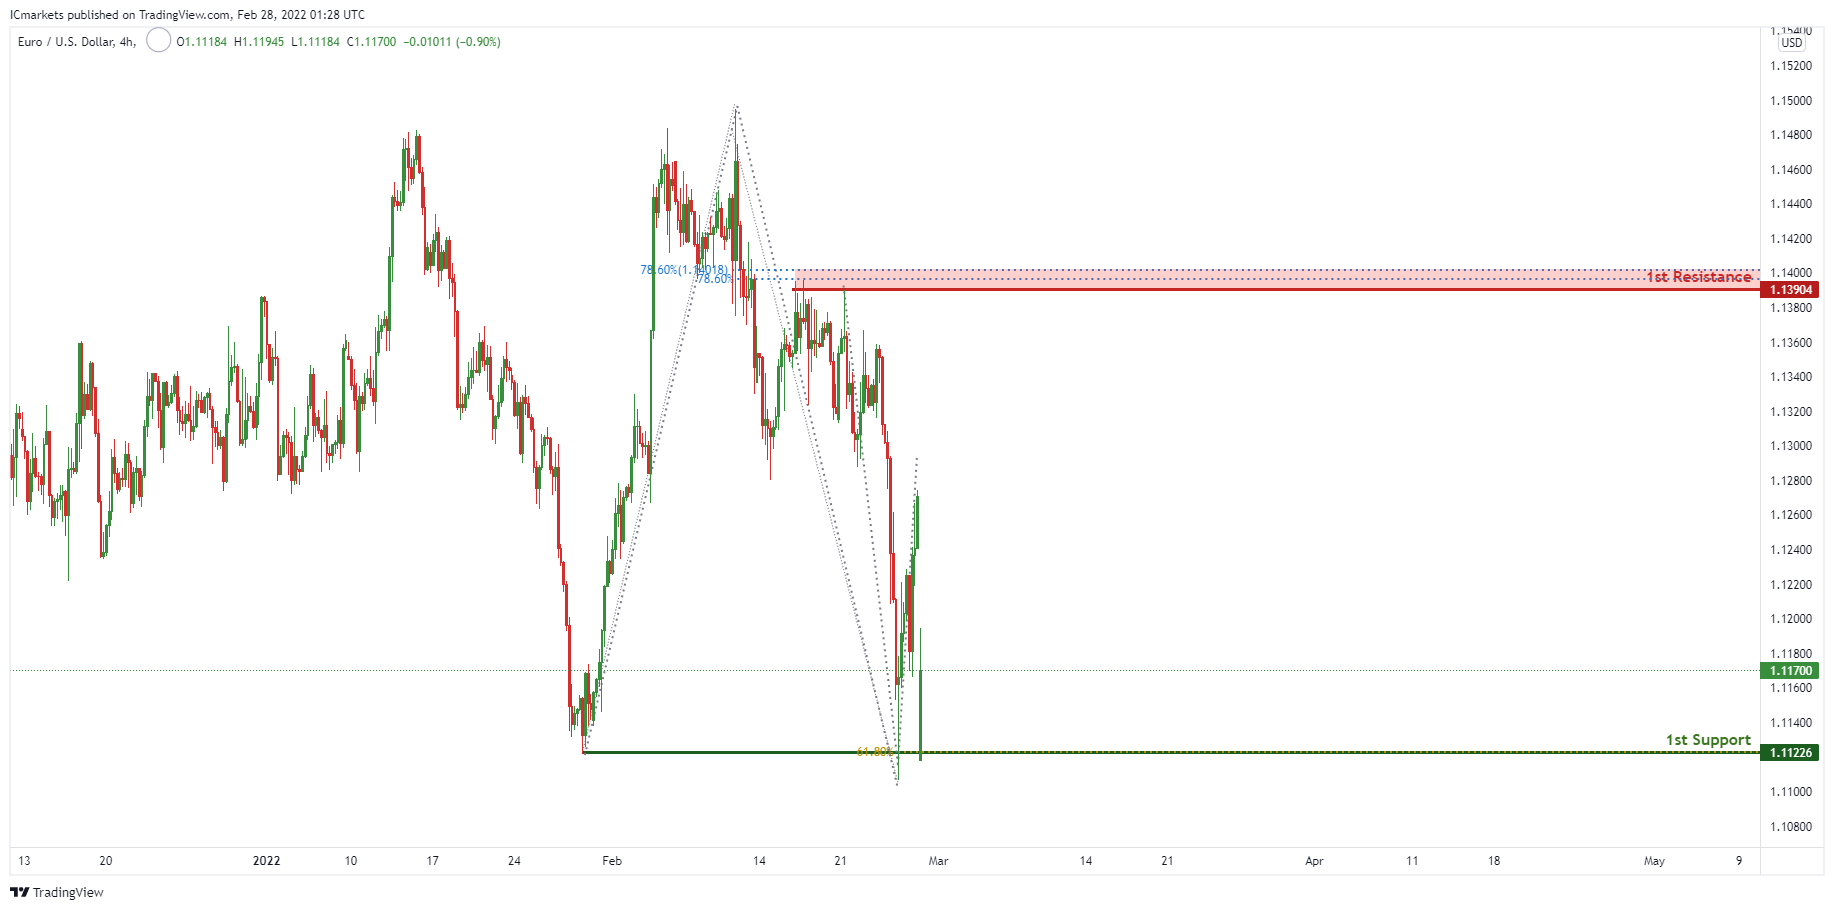
On the H4 chart price is near 1st support level of 1.11226 in line with 61.8% Fibonacci projection. Price can potentially go to the 1st resistance level of 1.13904 in line with 78.6% Fibonacci retracement and 78.6% Fibonacci projection. Our bullish bias is supported by the stochastic indicator as it is near support level.
Areas of consideration :
- H4 1st support at 1.11226
- H4 1st resistance at 1.13904
USD/JPY:
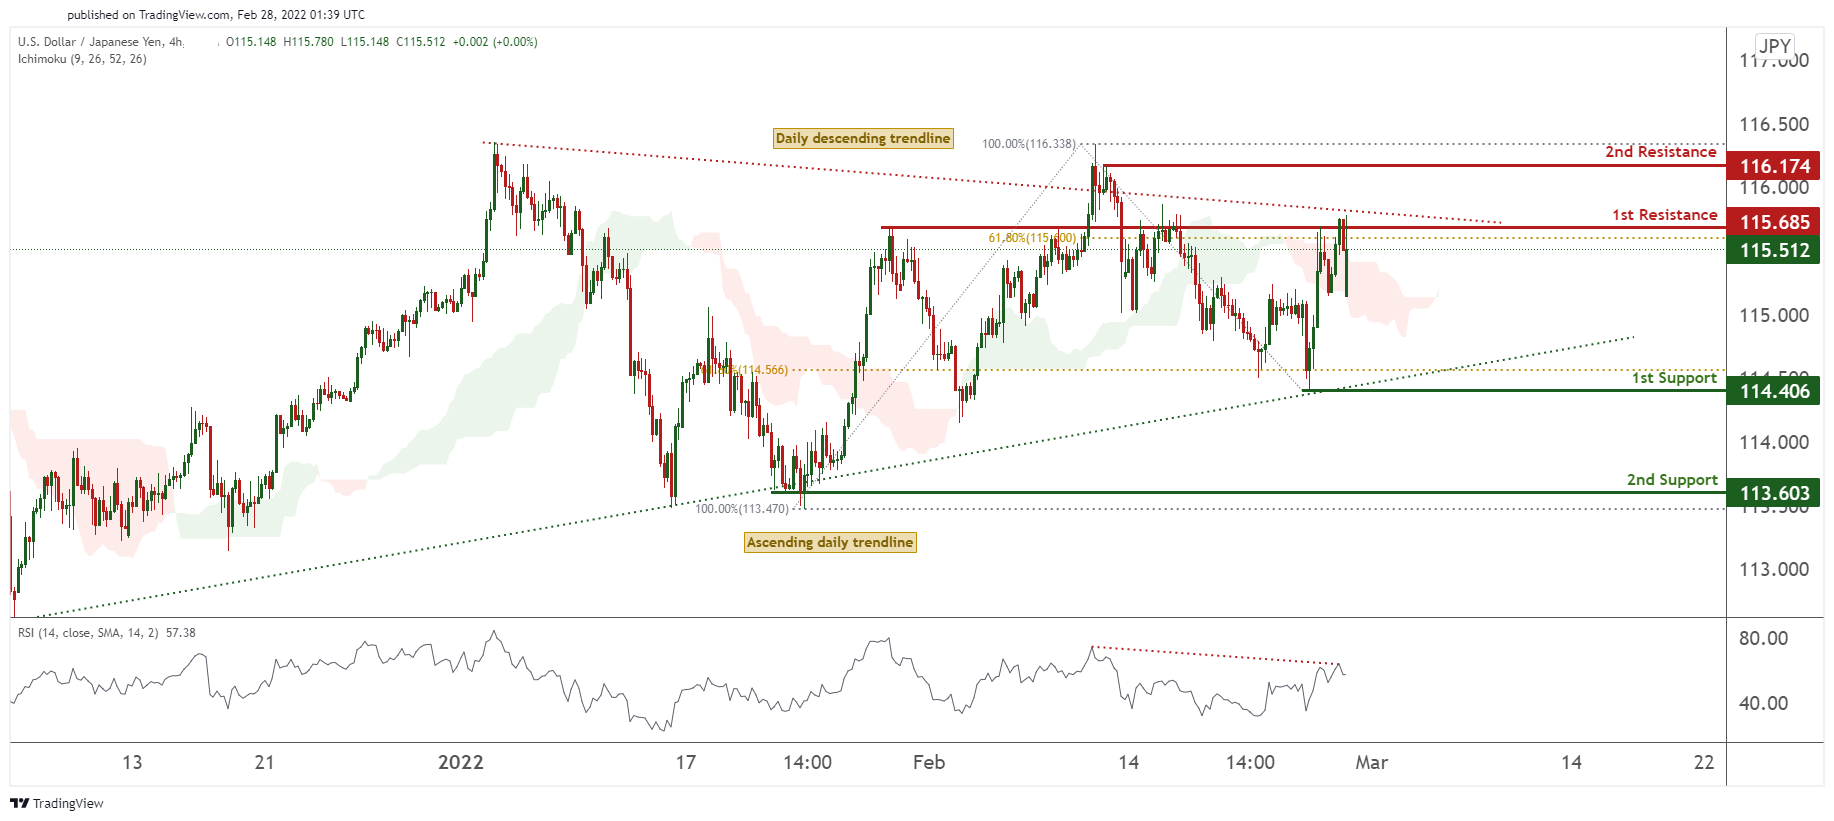
On the H4 timeframe, prices are consolidating in a daily triangle. We see the potential for further bearish continuation from our 1st resistance at 115.685 in line with 61.8% Fibonacci retracement towards our 1st support at 114.406 in line with 61.8% Fibonacci retracement. Our bearish bias is further supported by ichimoku forecasting red clouds and RSI showing bearish momentum.
Areas of consideration:
- H4 time frame, 1st resistance at 115.685
- H4 time frame, 1st support at 114.406
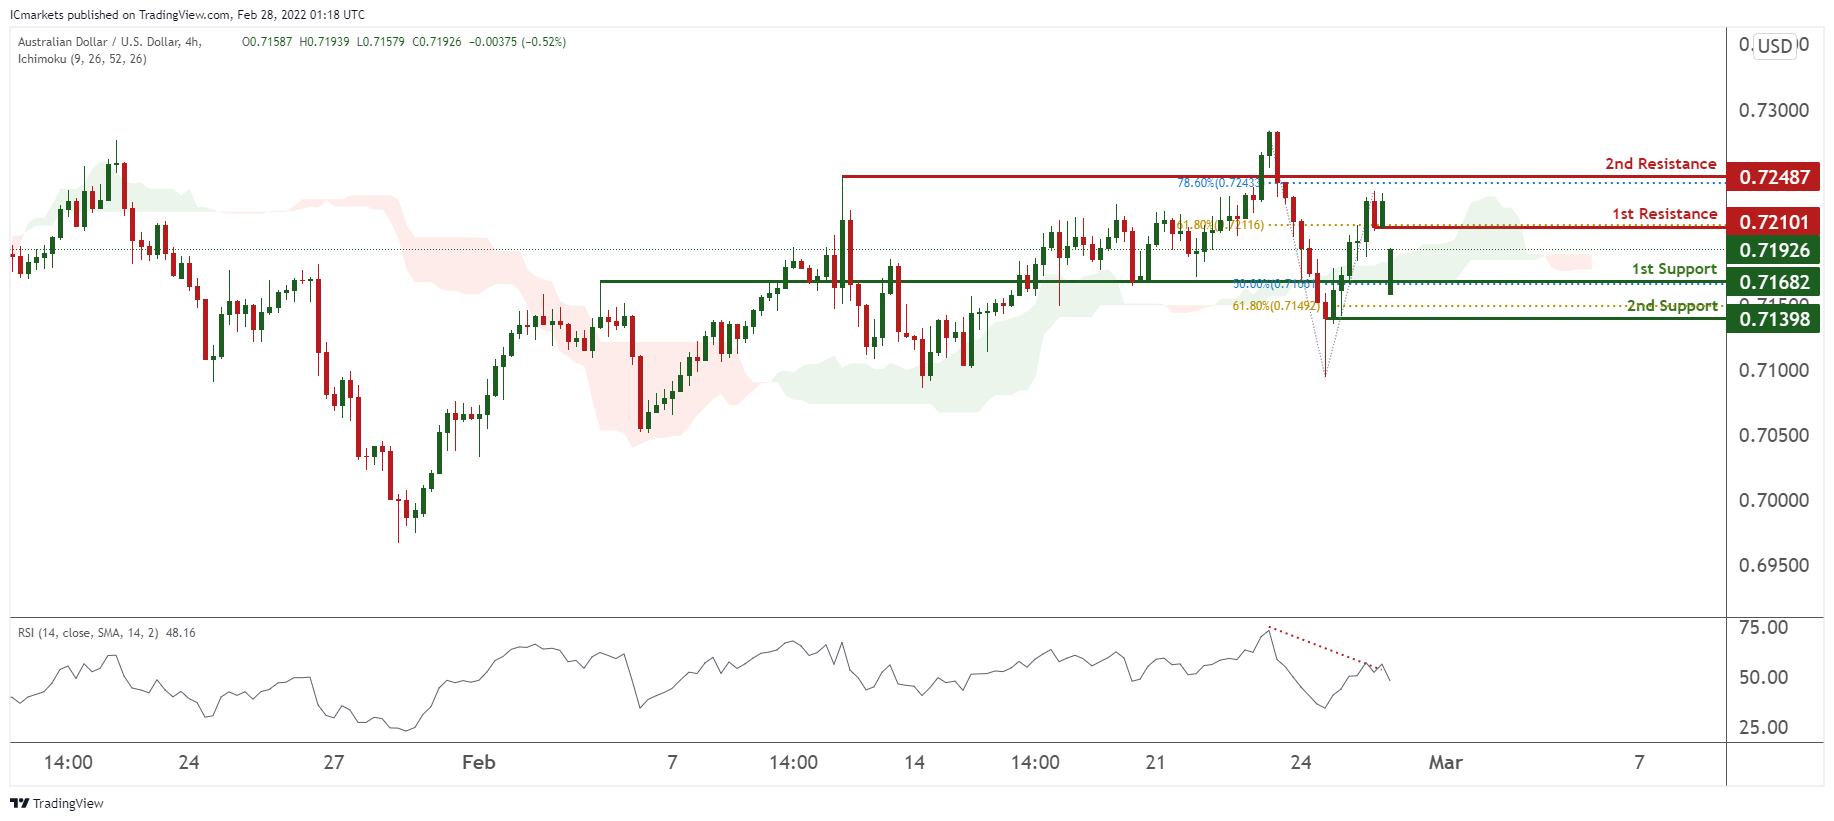
AUD/USD:
On the H4 chart, prices are consolidating horizontally. We see potential for a dip from our 1st resistance at 0.72101 in line with 61.8% Fibonacci retracement and towards our 1st support at 0.71682 in line with 50% Fibonacci retracement. Our bearish bias is further supported by prices trading below our ichimoku clouds and RSI portraying bearish momentum.
NZD/USD:
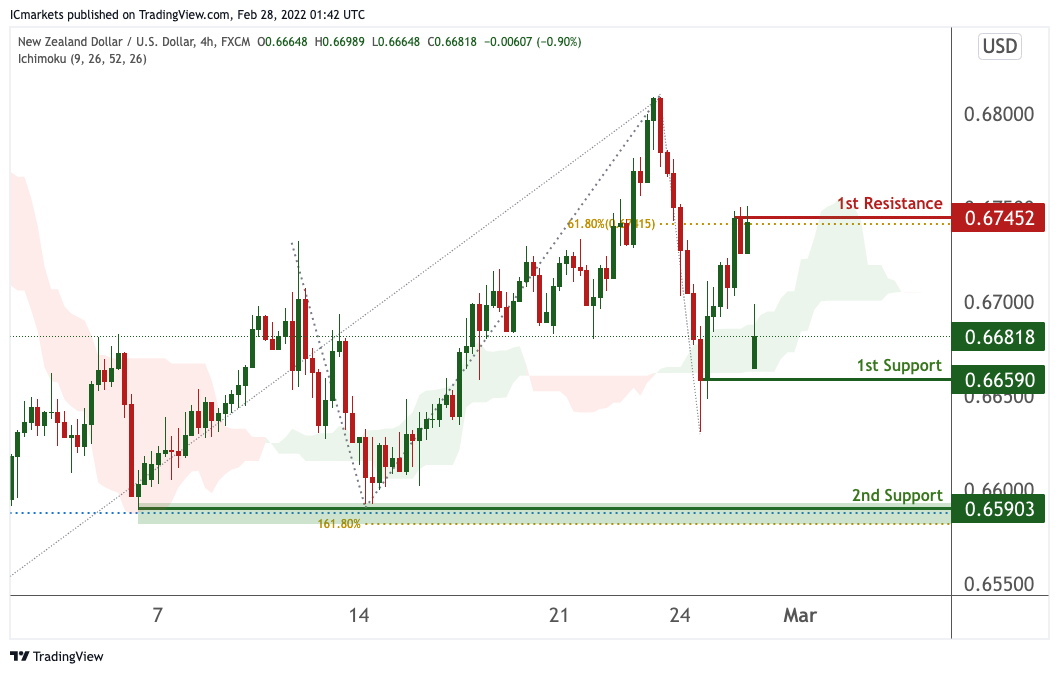
On the H4 chart, price is near 1st support level of 0.66590 in line with horizontal swing low support. Price can potentially rise to the 1st resistance level of 0.67452 in line with 61.8% Fibonacci retracement. Alternatively, price may break 1st support and head for 2nd support at 0.65903. Our bullsh bias is supported by how price is expected to bounce off the support of the ichimoku cloud.
Areas of consideration:
- H4 time frame, 1st resistance at 0.67452
- H4 time frame, 1st support at 0.66590
USD/CAD:
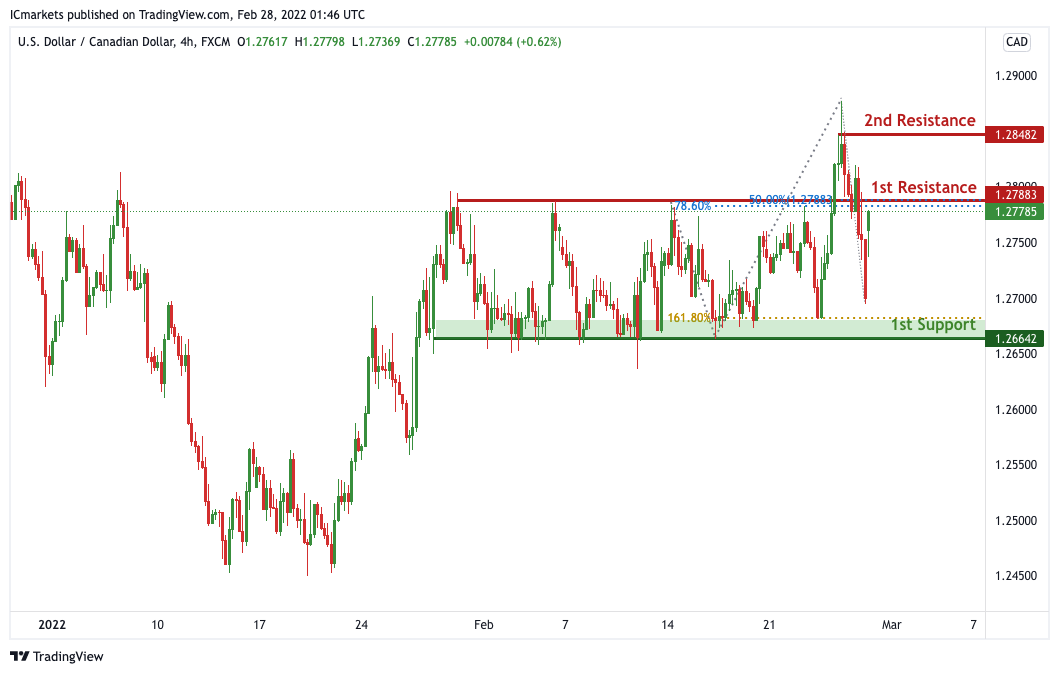
On the H4, price is ranging in between our 1st support and 1st resistance. We can expect price to drop to 1st support at 1.26642 in line with 161.8% Fibonacci extension from our 1st resistance at 1.27883 which is a strong resistance and in line with 50% and 78.6% Fibonacci retracement. Alternatively, price may break 1st resistance structure and head for 2nd resistance.
Areas of consideration:
- H4 time frame, 1st support at 1.26642
- H4 time frame, 1st resistance at 1.27883
OIL:
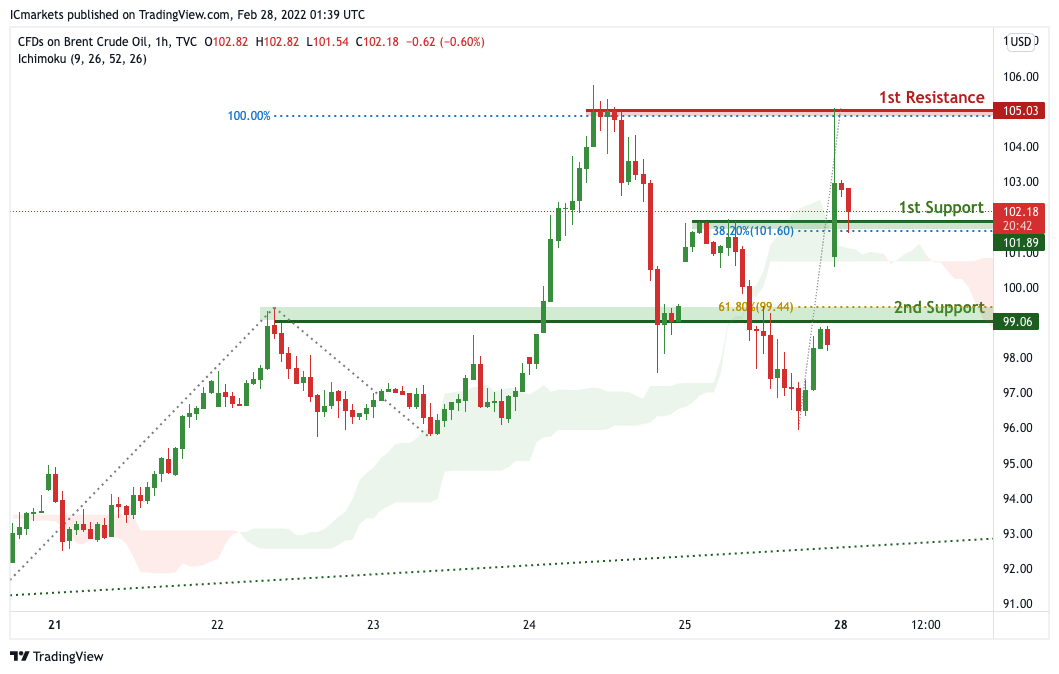
On the H4, with price moving above the ichimoku cloud, we can expect bullish continuation from our 1st support at 101.89 in line with 38.2% Fibonacci retracement towards our 1st resistance at 105.03 which is a strong resistance and in line with 100% Fibonacci projection. Alternatively, price may break 1st support structure and head for 2nd support, which coincides with the horizontal overlap support at 99.06.
Areas of consideration:
- H4 time frame, 1st resistance of 105.03
- H4 time frame, 1st support of 101.89
Dow Jones Industrial Average:
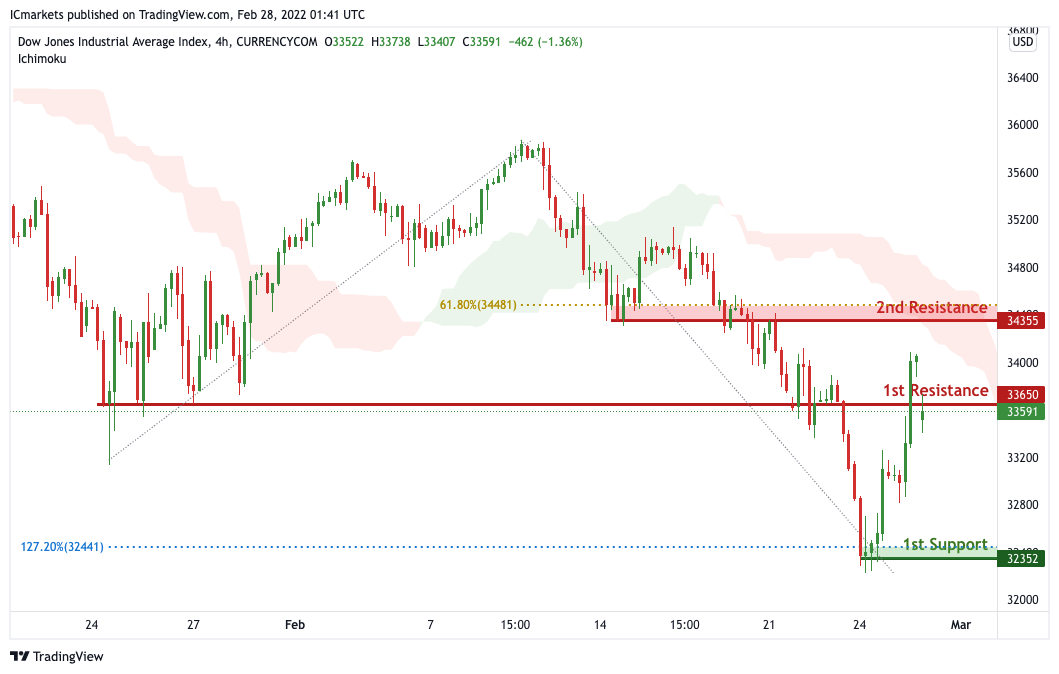
On the H4 timeframe, We see the possibility of bearish continuation from our 1st resistance at 33650 in line with horizontal overlap resistance towards our 1st support at 32352 in line with the horizontal swing low support. Alternatively, price may break 1st resistance and head for 2nd resistance at 34355 in line with the 61.8% Fibonacci retracement level. Our bearish bias is further supported by how price is moving below the ichimoku cloud
Areas of consideration :
- H4 1st support at 32352
- H4 1st resistance at 33650
EUR/USD At Risk of Downside Break
Key Highlights
- EUR/USD struggled to stay above 1.1300 and started a fresh decline.
- A key bearish trend line is forming with resistance near 1.1280 on the 4-hours chart.
- GBP/USD gained bearish momentum below the 1.3400 support zone.
- Gold price spiked higher to $1,975 before correcting lower.
EUR/USD Technical Analysis
The Euro started a fresh decline from well above 1.1450 against the US Dollar. EUR/USD declined below the 1.1320 support zone to enter a bearish zone.
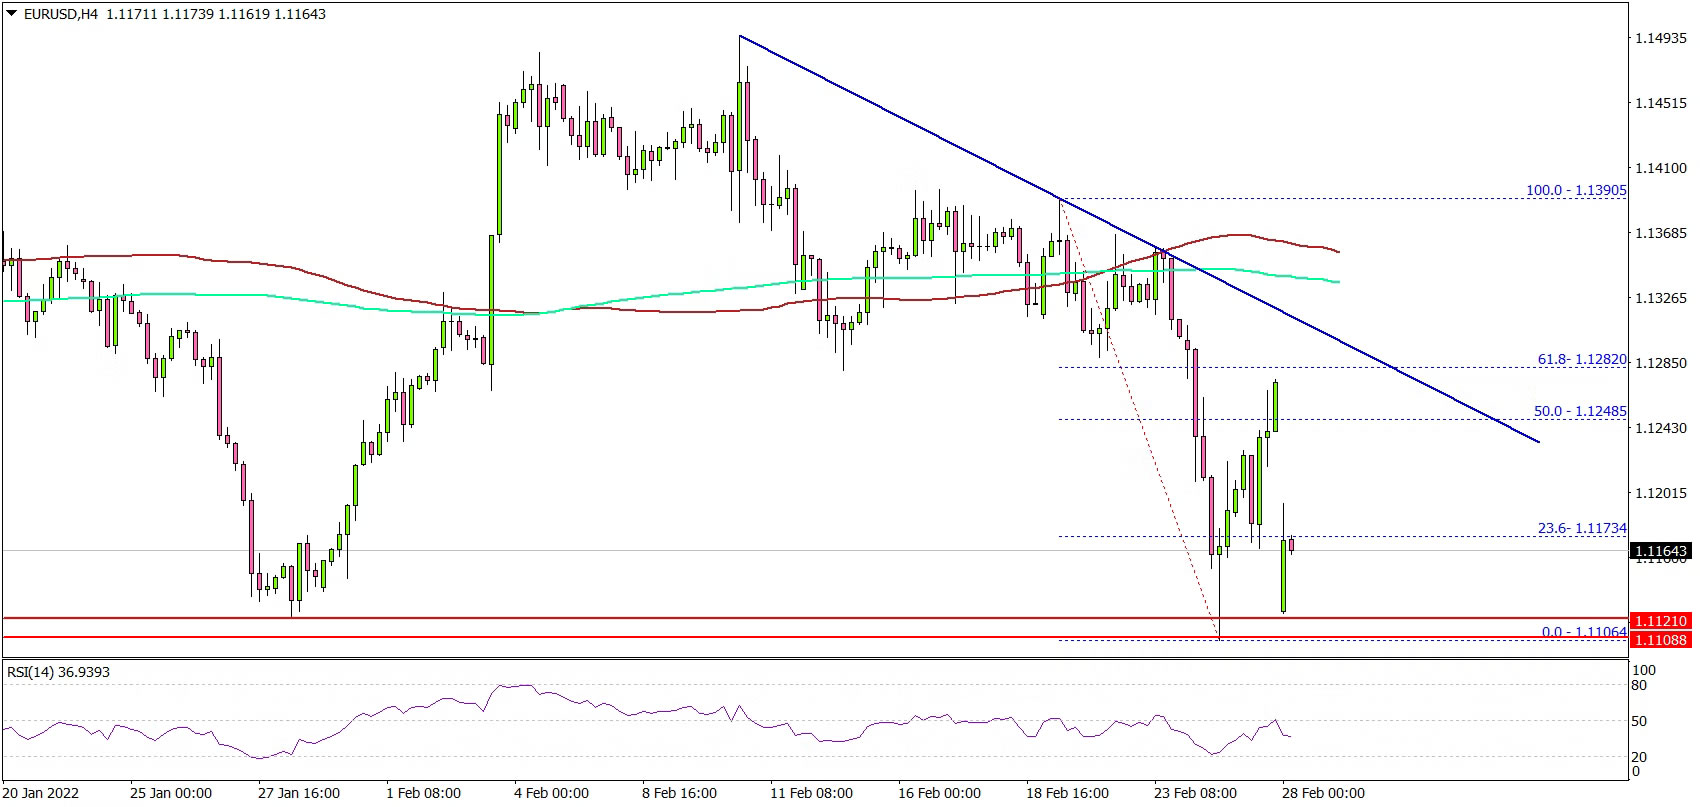
Looking at the 4-hours chart, the pair traded below the 1.1300 support zone. There was a close below the 1.1280 support zone, the 100 simple moving average (red, 4-hours), and the 200 simple moving average (green, 4-hours).
It even declined below 1.1150 and traded as low as 1.1106. It is now consolidating losses above the 1.1100 level. On the upside, the pair is facing a strong resistance near the 1.1250 level.
There is also a key bearish trend line forming with resistance near 1.1250 on the same chart. The next major resistance sits near the 1.1350 zone, the 100 simple moving average (red, 4-hours), and the 200 simple moving average (green, 4-hours).
A close above 1.1350 might send EUR/USD higher towards 1.1450. On the downside, the pair might find bids near the 1.1120 level. If there are additional losses, the pair might dive to 1.1050.
Looking at GBP/USD, the pair accelerated lower the 1.3420 and 1.3400 support levels. Besides, gold price is still in a positive zone above the $1,900 level.
Economic Releases
- Chicago Purchasing Manager’s Index for Feb 2021 – Forecast 63.9, versus 65.2 previous.
Eco Data 2/28/22
[php_everywhere instance="1"]
Summary 2/28 – 3/4
Monday, Feb 28, 2022
[php_everywhere instance="1"]
Tuesday, Mar 1, 2022
[php_everywhere instance="2"]
Wednesday, Mar 2, 2022
[php_everywhere instance="3"]
Thursday, Mar 3, 2022
[php_everywhere instance="4"]
Friday, Mar 4, 2022
[php_everywhere instance="5"]
Forex and Cryptocurrencies Forecast
EUR/USD: War Is Not Only Blood, But Also Business
The dynamics of European currencies is now determined by what is happening in Ukraine. You can forget about all kinds of macro-economic indicators for a while. Who and how much earned on Russia's invasion of a neighboring country, and who lost and how much, will become clear only when the situation stabilizes finally. And this may not happen soon.
Russia's possible hostilities against Ukraine had been discussed for several weeks. However, the world had expected that they would be limited to two regions in the east of the country, Donetsk and Luhansk. However, Russia launched missile and bomb attacks on all major cities of the country on Thursday, February 24, early in the morning, including the capital city of Kyiv, followed by an offensive by ground forces.
Nobody had expected anything like this (except for Russian President Putin and his inner circle). The markets experienced a real shock, and a stampede began not only from risky assets, but also from European currencies.
A number of European countries, primarily the Baltic ones, are afraid that Russia may invade their territory, following Ukraine. But even if these fears are discarded, Europe's economy has already suffered serious damage.
Due to its proximity, the Eurozone is much more dependent on Russian energy than the United States. Russia accounts for about 40% of gas supplies and 30% of oil supplies to the EU. Moreover, one of the main gas pipelines passes through the territory of Ukraine, where the fighting is going on. This situation instantly raised the prices for blue fuel to cosmic heights and they were eight times higher than similar prices in the United States.
It is clear that for Western Europe this does not portend anything else but falling into a deep recession, or even into stagflation Stagflation is an extremely weak GDP growth coupled with extremely high inflation, which has already reached a record level of 5.1%.
The negative outlook is reinforced by the economic sanctions that the EU imposed against Russia to support Ukraine. They limit the current industrial turnover seriously, and also tighten the banking sector. It is difficult to imagine how the ECB will be able to wind down monetary stimulus and raise interest rates in this situation. As for the US Federal Reserve, this regulator is unlikely to abandon its plans. Although, it is possible that their implementation will be somewhat slowed down for the sake of supporting the stock market. At least in the near future.
The EUR/USD pair was trading at 1.1494 back on February 10. The war in Eastern Europe led to the fact that it found the bottom at the level of 1.1106 just two weeks later, losing 388 points.
The markets recovered somewhat from a powerful shock at the end of the week on Friday, February 25. The old principle, known since Napoleon Bonaparte, "Buy while the blood is shed," worked. Stock indices went up, supporting the European currency. After the correction, it completed the week at 1.1270.
At the time of writing the review, on February 25, it is unknown how the operation of Russian troops in Ukraine will end. It is unknown either what new sanctions the EU and the US will take against Russia if hostilities do not stop. Therefore, it is President Putin alone who could give the most accurate forecast for the coming week. We can only record the opinions of experts and the readings of indicators at the moment.
The forecast of analysts for the next week looks very uncertain: 65% of them point to the 1.1300 zone, which has been the Pivot Point since mid-November 2021. The remaining 35% vote for the bears and do not rule out that the pair will test the support of 1.1100 again. Trend indicators on D1 are 90% red and 10% green. Among the oscillators, 80% are colored red, 20% are green.
Given the current increased volatility, the nearest resistance is located in a wide area of 1.1285-1.1390. If the bulls do not stop there, their next target will be the highs of January 13 and February 10 at 1.1485, then 1.1525, 1.1570 and 1.1615. Support zones are 1.1185-1.1200 and 1.1085-1.1120. They are followed by the levels of summer 2020, which are hardly worth focusing on in the current unstable geopolitical situation. Although, it can be assumed that the bears will try to at least reach the symbolic horizon of 1.1000.
As for the upcoming week's calendar, it will be quite busy. It is clear that the main focus will be on the events in Ukraine and the new sanctions associated with them from the EU and the US.
In addition, there will be data on the consumer market in Germany and business activity (ISM) in the US manufacturing sector on Tuesday, March 01. There will be statistics on the consumer market of the Eurozone on Wednesday, March 02, and a report from ADP on employment in the private sector will be published in the USA. Fed Chairman Jerome Powell will address Congress on the same day. The value of the ISM business activity index in the US services sector will become known on Thursday. And in addition to data on retail sales in the Eurozone, we are traditionally waiting for a portion of statistics from the US labor market, including the number of new jobs created outside the agricultural sector (NFP) on the first Friday of the month, March 04.
GBP/USD: Great Britain Is Europe as Well
Although the United Kingdom has left the European Union, it has not ceased to be part of Europe. Therefore, everything that has been said about the EU and the Eurozone is also relevant for the UK. The only difference is the numbers. Thus, the maximum volatility of the week for the GBP/USD pair was 366 points (falling from 1.3638 to 1.3272), and the finish, after the correction, fell at 1.3410. We can now forget about consolidation around 1.3600.
Just like the EU, the UK was very quick to impose sanctions on Russia and the Prime Minister issued an extremely tough and angry statement condemning the military operation in Ukraine. The consequences of such a step will be quite serious not only for the Russian, but also for the British economy. Suffice it to say that British Petroleum is one of the largest foreign investors in Russia and a shareholder of Rosneft. And the British banks have very close contacts with the largest Russian corporations and individuals. In addition, both countries have banned flights of national airlines over each other's territories.
Experts' forecast for the GBP/USD pair for the next week is as follows: 40% of them vote for the movement to the north and 40% for the movement to the south, the remaining 20% vote for the sideways trend. Almost all indicators on D1 are colored red. Among trend indicators, these are 100%, among oscillators these are 85%. Only 15% of them have reacted to the upward correction of the pair. Supports are located at 1.3400, 1.3365 and 1.3275-1.3315, then 1.3200 and the low of 08 December 2021, 1.3160. Resistance levels are 1.3485, 1.3600, 1.3645, 1.3700-1.3740, 1.3830 and 1.3900.
Following the results of February, we will have a fairly large package of macroeconomic statistics related to the British economy this week. The manufacturing business activity index (PMI) will be published on Tuesday, March 01, the composite index and the index of business activity in the services sector on Thursday, and a similar index in the construction sector - on Friday. The annual budget of the United Kingdom, which will be made public on Wednesday 02 March, is of interest as well.
USD/JPY: Japan Is Not Europe
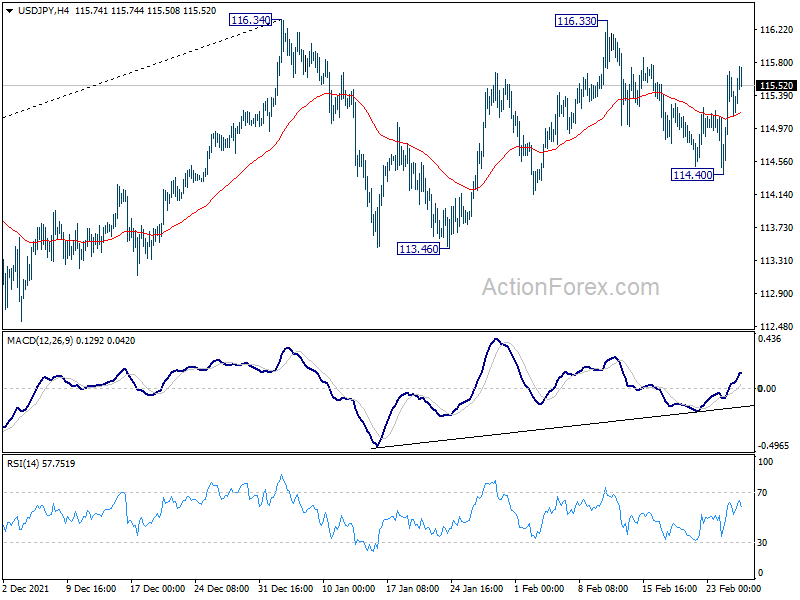
Japan is the one who practically did not react to the war in Ukraine. This is understandable: Kyiv and Tokyo are separated by 8205 kilometers. Japan, of course, joined the sanctions against Russia, but this made almost no impression on the dynamics of the USD/JPY pair. Rather, it was influenced by the rise in prices for energy resources, on which the economy of this country is quite dependent. As a result, having bounced off the level of 114.40 on Thursday, February 24, the pair rose to a height of 115.75, and put the last chord a little lower, at the level of 115.52. Summing up the results of the week, it can be noted that the fluctuation of the pair's quotes was quite insignificant: only 57 points (115.03-115.60).
Analysts' forecasts for the coming week look like this: 55% are in favor of the pair's growth, 35% are in favor of its fall, and 10% are in favor of a sideways trend. Among the oscillators on D1, 65% are green, 20% are red, and 15% are neutral grey. For trend indicators, 65% look up, 35% take the opposite position. The nearest resistance zone is 115.70. The main goal of the bulls is to renew the high of 116.34 and rise to where the pair has not been seen since January 2017. Support levels are at 115.00, 114.80, 114.15, 113.75, 113.45, 113.20, 112.55 and 112.70.
No significant economic events are expected in Japan next week.
CRYPTOCURRENCIES: Bitcoin and Ethereum Prove to Be More Reliable Than Stocks
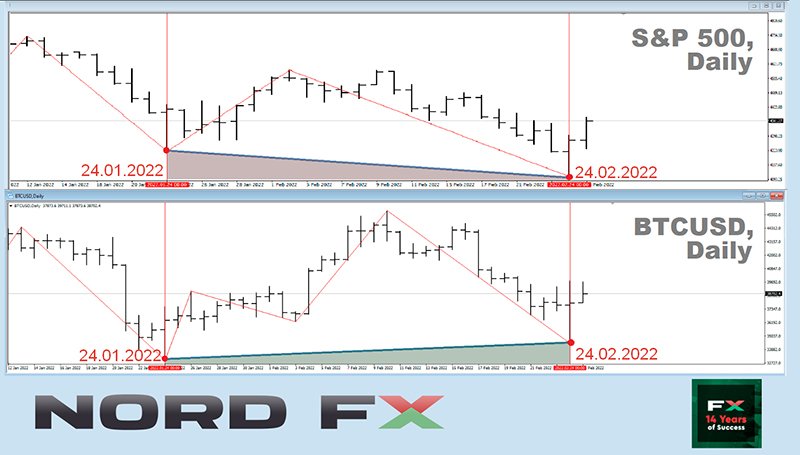
The main factor putting pressure on the crypto market was the expectation of an increase in interest rates by the US central bank a week ago. Russia's possible invasion of Ukraine was number two. It has now moved to the forefront, from assumption to fact.
The aggravation of the geopolitical situation associated with this increased the flight of investors from risky assets and led to a further fall in both stock indices and digital currency quotes. The 90-day correlation between bitcoin and the S&P 500 reached its highest level since October 2020. This is stated in the analytical report of Arcane Research. The statistical relationship between virtual gold and real gold, on the contrary, has become negative, since gold, unlike BTC, is a low-risk asset. Arcane Research has also noted that bitcoin spot trading volume on centralized exchanges has fallen to early December 2020 levels.
Bitcoin is commonly opposed to the dollar, being called insurance against inflation. But if you look at the charts of the last week, BTC is more likely an insurance within the market for risky assets: stock prices have fallen much faster since the outbreak of the war in Ukraine than the quotes of leading cryptocurrencies such as bitcoin and ethereum. The S&P500, Dow Jones, Nasdaq stock indices fell below the lows of a month ago in a few hours on the very first day of the bombing and rocket attacks, February 24. There is no need to talk about the Russian IMOEX index: it lost almost 50% in just a few hours, after which trading was stopped. Unlike all of them, the BTC/USD and ETH/USD pairs held their positions courageously above the January 24 low.
Of course, this is not a reason to rejoice. Expectations of a key rate hike by the US Federal Reserve and geopolitical tensions will continue to feed the pessimism of bitcoin investors, and therefore the likelihood of selling unprofitable coins will continue to grow. This is the conclusion reached by Glassnode analysts. The bearish trend is confirmed by on-chain indicators: the number of active bitcoin addresses has dropped to the lower boundary of the corridor. This indicates a decrease in demand for the asset. The share of bitcoin investors in profit is currently in the range between 65.8% and 76.7%.
Short-term speculators (coin holding period less than 155 days) have purchased 2.56 million BTC. The average acquisition cost is $47,200. Their unrealized loss is about 17%, with the price around $39.000. They are currently a source of sales pressure in the absence of an equivalent increase in demand. Glassnode believes that if the price rises, the pressure of sellers may increase, who will try to leave the market without losses or with a minimum profit.
According to Du Jun, CEO of Huobi crypto exchange, past price cycles indicate that a new bull market for bitcoin may not occur until late 2024 or early 2025. According to him, bitcoin's price cycles are closely related to halvings: periodic block reward halvings embedded in the algorithm, which occur approximately every four years.
The last halving took place in May 2020, and the quotes of the first cryptocurrency reached an all-time high above $68,000 a year later. A similar price movement was observed after the 2016 halving: bitcoin reached record levels in December 2017.
Then deep drops in the price of digital gold followed in both cases.
Based on the trend, Huobi CEO believes that "we are now in the early stages of a bear market" and expects a bullish trend for bitcoin to come only after the next halving in 2024. At the same time, he added that "it is difficult to predict accurately in reality, since there are many other factors that can affect the market, such as geopolitical issues, including war, or the COVID-19 pandemic."
Kevin O'Leary, the star of the Shark Tank business reality show, also announced his forecast. He notes that many institutional investors cannot yet invest in the leading cryptocurrency, as this issue has not yet been resolved at the level of regulators.
O'Leary has noted that anyone who wants to speculate about the cost of BTC at $100,000, $200,000, $300,000 should understand that all this will become possible when institutionalists finally have the opportunity to purchase a crypto asset in accordance with regulatory standards. He notes that he can say this with confidence, as he works with "sovereign wealth funds and pension plans." And although there is a lot of buzz around BTC right now, none of them have a single token. Moreover, they do not even plan investments in this asset yet.
According to O'Leary, it is much better to think of BTC not as a coin, but as software. He has noted that the above institutions have shares in Microsoft and Google, so it will be easier for them to understand if they regard cryptocurrencies as software. At a time when the crypto sector begins to meet all the requirements, these financial institutions will be able to invest 1% to 3% of their capital in bitcoin, and this can happen within the next 2-3 years.
Against this not very joyful background, the interview given by Vitalik Buterin, co-founder of Ethereum, to Bloomberg, can be considered the height of optimism. First, he is not yet sure that the "crypto winter" has really arrived. And secondly, he believes that such a "winter" can help the industry become stronger.
Buterin emphasized in the interview with the agency that in fact, people "deeply immersed in the cryptocurrency industry" welcome periods of the bear market. This allows to get rid of weak projects, and also reduces the level of "hype". It is in the "winter" that many weak and harmful projects disappear, and only reliable, important projects remain, that have well-thought-out business models and a close-knit team, the developer believes.
Looking to the near term, Arcane Research analysts believe that the strongest support range lies in the $28,000-$30,000 zone, as the "summer 2021 bear market bottom" is located there. They have named $40,000 as an important resistance level.
At the time of writing this review (Friday evening, February 25), the BTC/USD pair is trading around $39,000. The Crypto Fear and Greed Index has dipped a little into the Fear zone, falling from 30 to 27 points in a week, while the total crypto market capitalization has fallen from $1.815 trillion seven days ago to $1.755 trillion.
EUR/USD Weekly Outlook
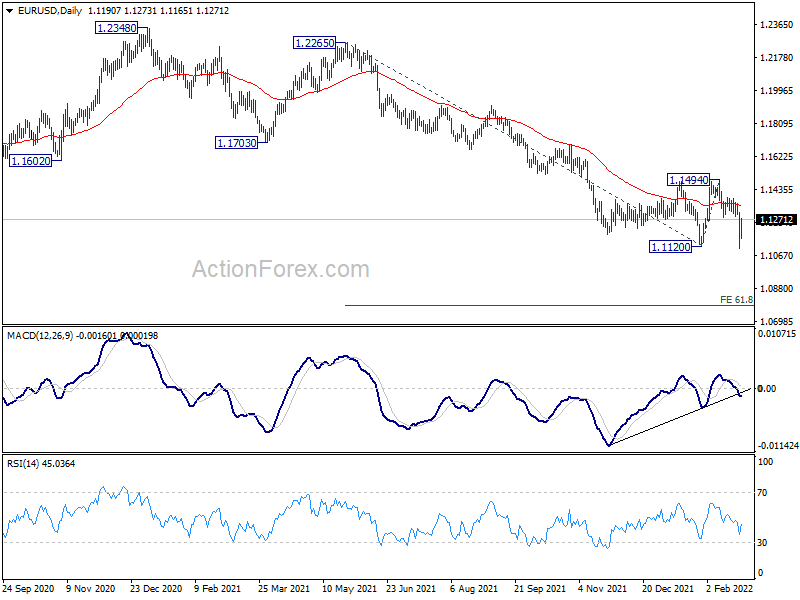
EUR/USD dropped sharply to 1.1105 last week but recovered since then. Initial bias is neutral this week first. Further fall is still in favor as long as 1.1287 support turned resistance holds. On the downside, sustained break of 1.1120 will confirm resumption of larger down trend from 1.2348. Next target is 61.8% projection of 1.2265 to 1.1120 from 1.1494 at 1.0786. However, firm break of 1.1287 will dampen this bearish view and turn bias back to the upside for 1.1494 resistance.
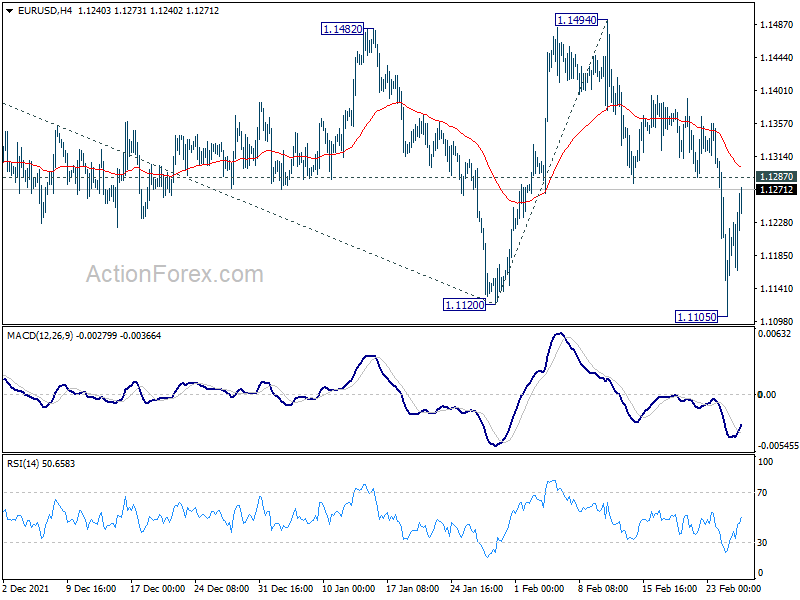
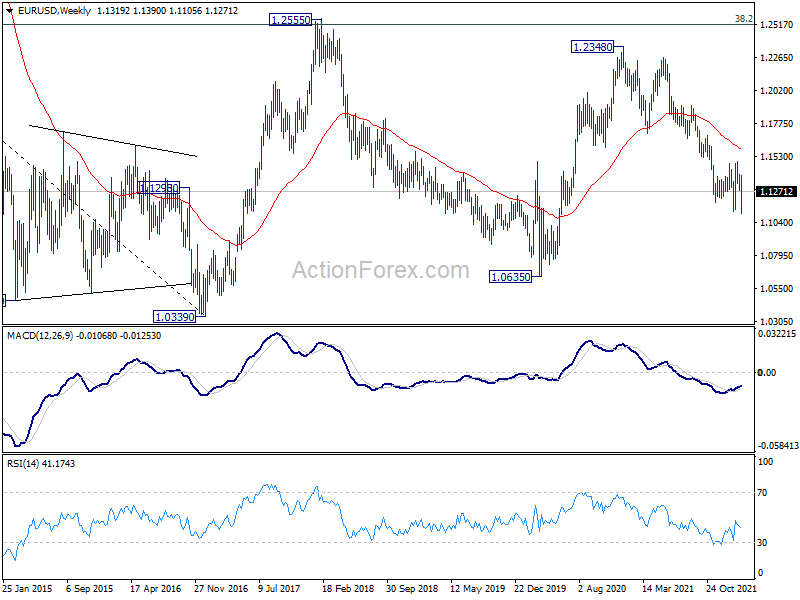
In the bigger picture, the decline from 1.2348 (2021 high) is seen as a leg inside the range pattern from 1.2555 (2018 high). Sustained trading above 55 week EMA (now at 1.1582) will argue that it has completed and stronger rise would be seen back towards top of the range between 1.2348 and 1.2555. However, firm break of 1.0635 (2020 low) will raise the chance of long term down trend resumption and target a retest on 1.0339 (2017 low) next.
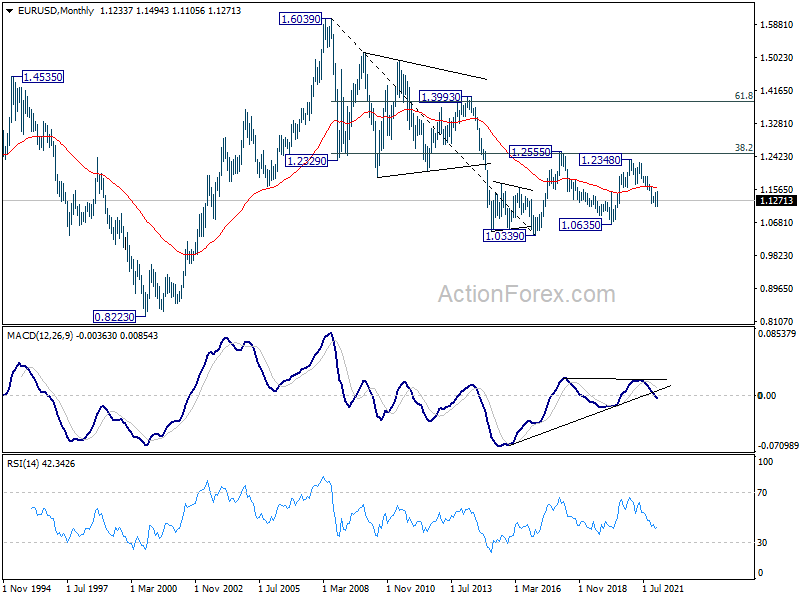
In the long term picture, in another case, as long as 38.2% retracement of 1.6039 (2008 high) to 1.0339 (2017 low) at 1.2516 holds, the down trend from 1.6039 could still resume through 1.0339 low. However, sustained trading above 1.2516 will argue that the long term trend has reversed.
USD/JPY Weekly Outlook
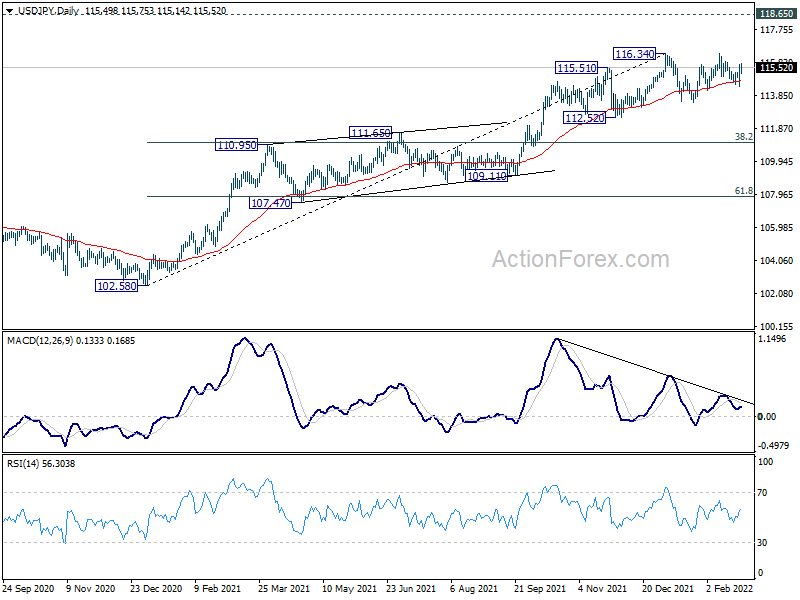
USD/JPY recovered strongly after dipping to 114.40 last week, but stayed well below 116.33 resistance. Initial bias remains neutral this week first. On the upside, firm break of 116.34 will resume larger up trend from 102.58 to 118.65 long term resistance next. On the downside, though, break of 114.40 will continue the corrective pattern from 116.34 with another fall to 113.46 support.
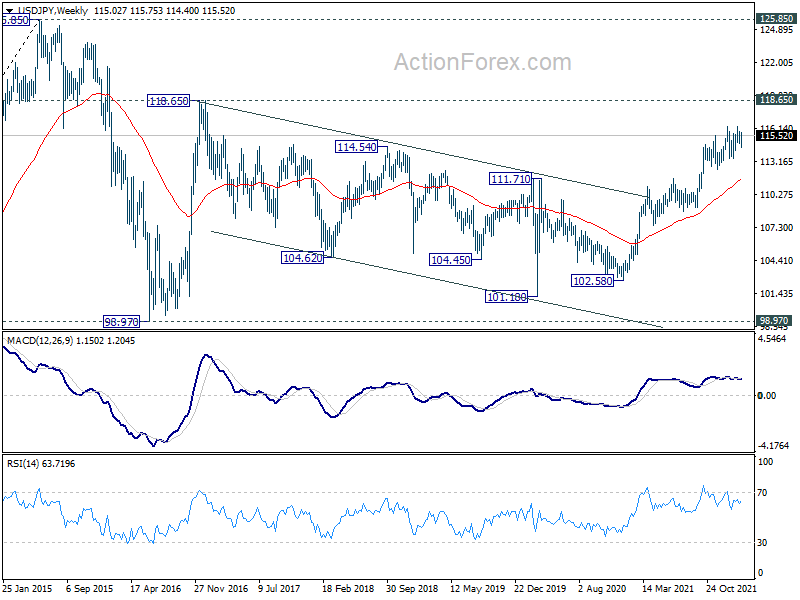
In the bigger picture, no change in the view that rise from 102.58 is the third leg of the up trend from 101.18 (2020 low). Such rally should target a test on 118.65 (2016 high). Sustained break there will pave the way to 120.85 (2015 high) and raise the chance of long term up trend resumption. This will remain the favored case as long as 55 week EMA (now at 111.64) holds.
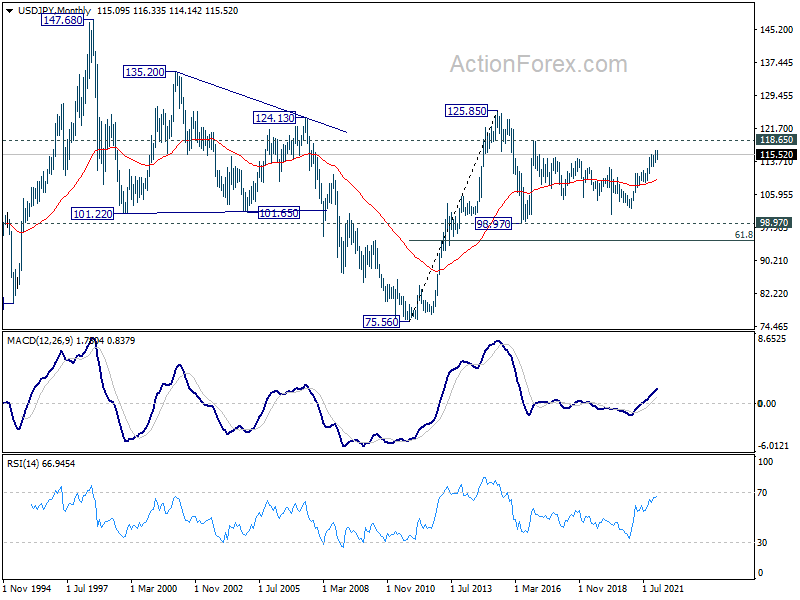
In the long term picture, the rise from 75.56 (2011 low) long term bottom to 125.85 (2015 high) is viewed as an impulsive move, no change in this view. Price actions from 125.85 are seen as a corrective pattern which could still extend. In case of deeper fall, downside should be contained by 61.8% retracement of 75.56 to 125.85 at 94.77. Up trend from 75.56 is expected to resume at a later stage for above 135.20/147.68 resistance zone.
GBP/USD Weekly Outlook
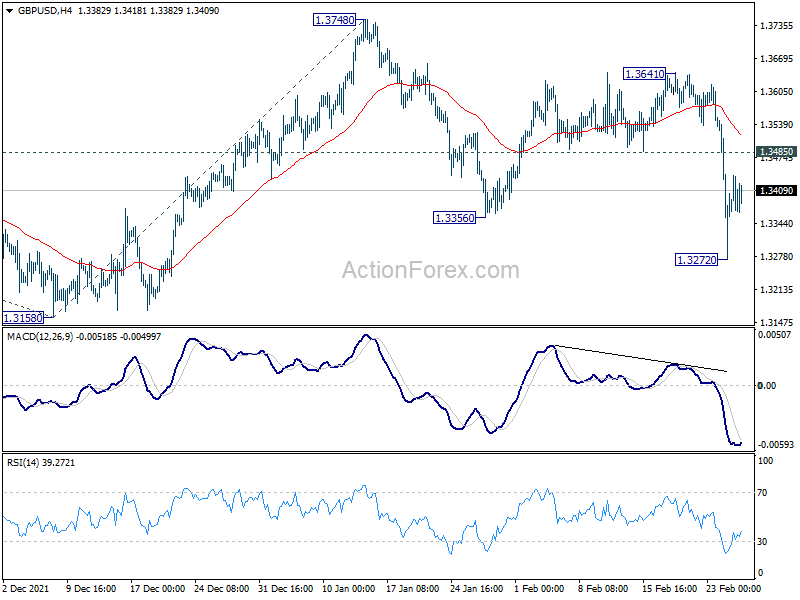
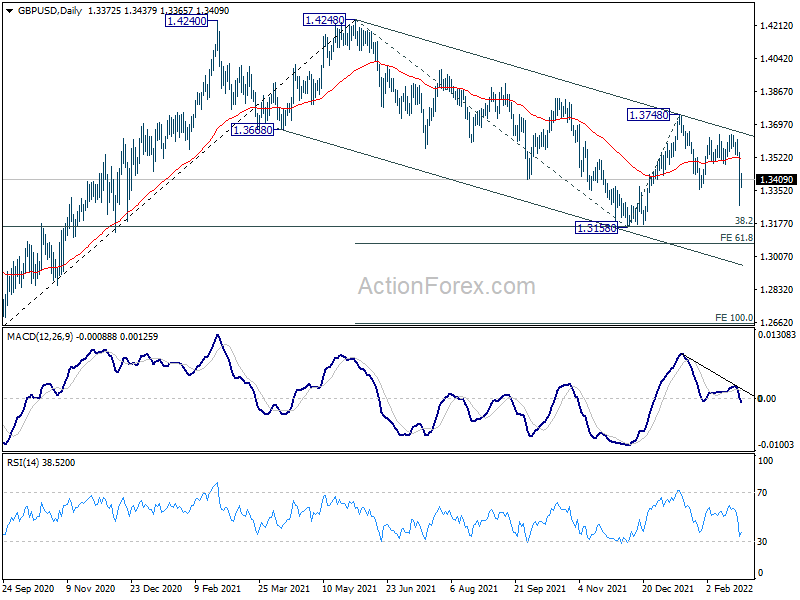
GBP/USD dropped to as low as 1.3272 last week but recovered since then. Initial bias remains neutral this week first. Break of 1.3356 support suggests resumption of fall from 1.3748. Further decline is in favor as long as 1.3485 support turned resistance holds. Break of 1.3272 will target 1.3158 low. However, firm break of 1.3485 will dampen this bearish view and turn bias back to the upside for 1.3641 resistance.
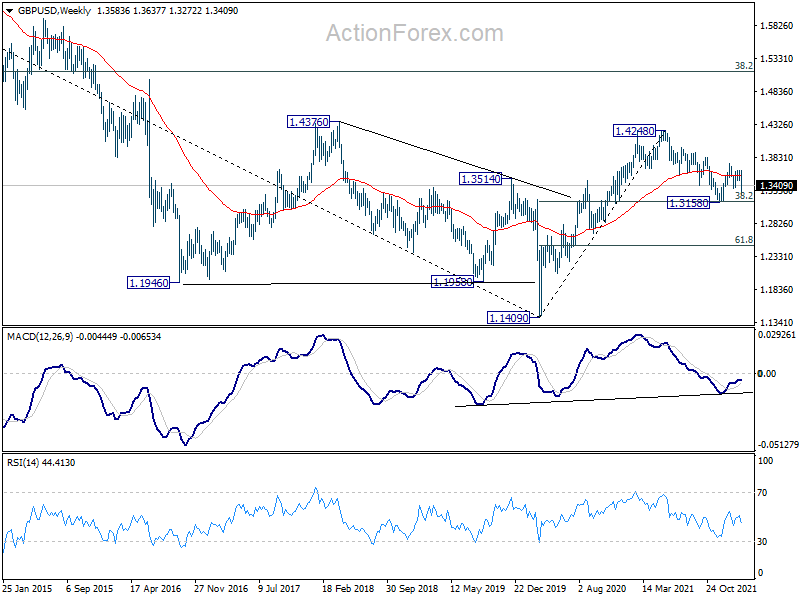
In the bigger picture, as long as 38.2% retracement of 1.1409 to 1.4248 at 1.3164 holds, up trend from 1.1409 (2020 low) is still in progress. On resumption, next target will be 38.2% retracement of 2.1161 to 1.1409 at 1.5134. Nevertheless sustained break of 1.3164 will argue that whole rise from 1.1409 has completed and bring deeper fall to 61.8% retracement at 1.2493.
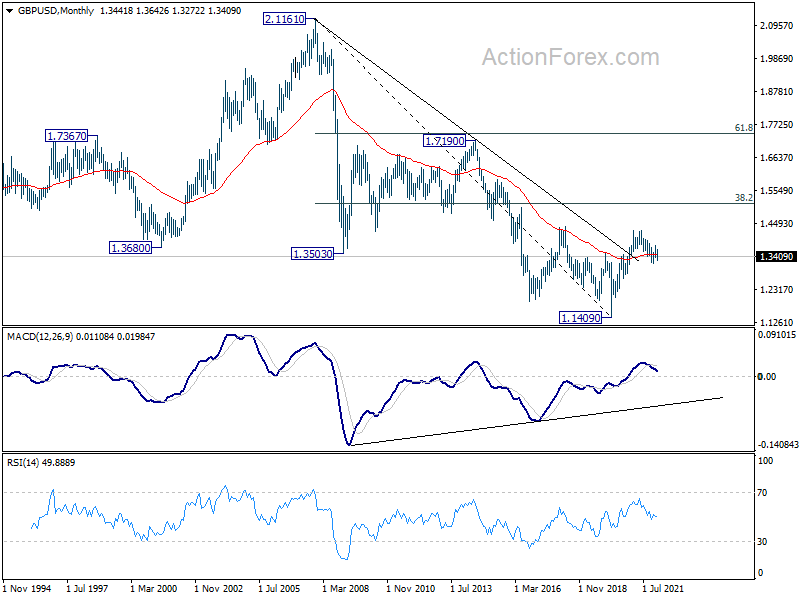
In the longer term picture, a long term bottom should be in place at 1.1409, on bullish convergence condition in monthly MACD. Rise from there would target 38.2% retracement of 2.1161 to 1.1409 at 1.5134. Reaction from there would reveal whether rise from 1.1409 is just a correction, or developing into a long term up trend.
USD/CHF Weekly Outlook
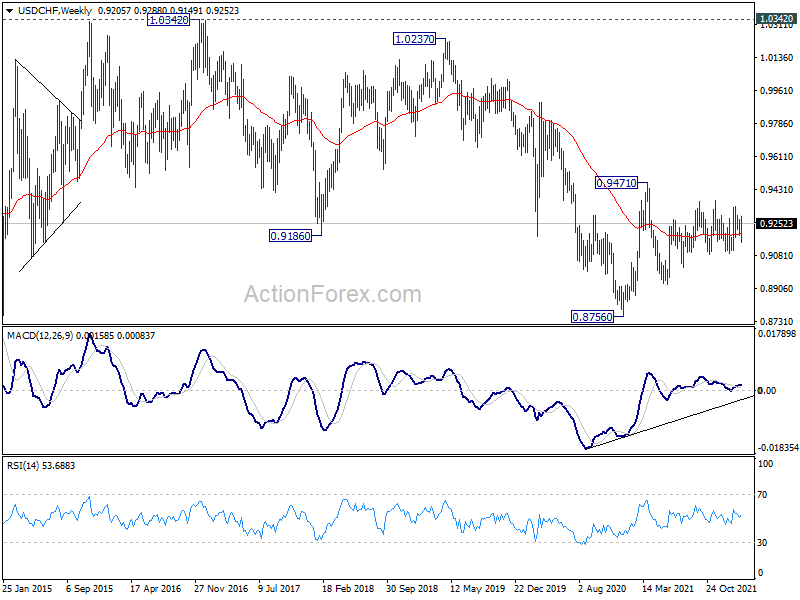
USD/CHF continued to gyrate in established range last week and outlook is unchanged. Initial bias stays neutral this week first. Choppy rise from 0.8925 would still be in favor to extend higher as long as 0.9090 support holds. Break of 0.9341 will target 0.9372 resistance and then 0.9471. On the downside, however, break of 0.9090 will bring deeper fall back to 0.8925 support.
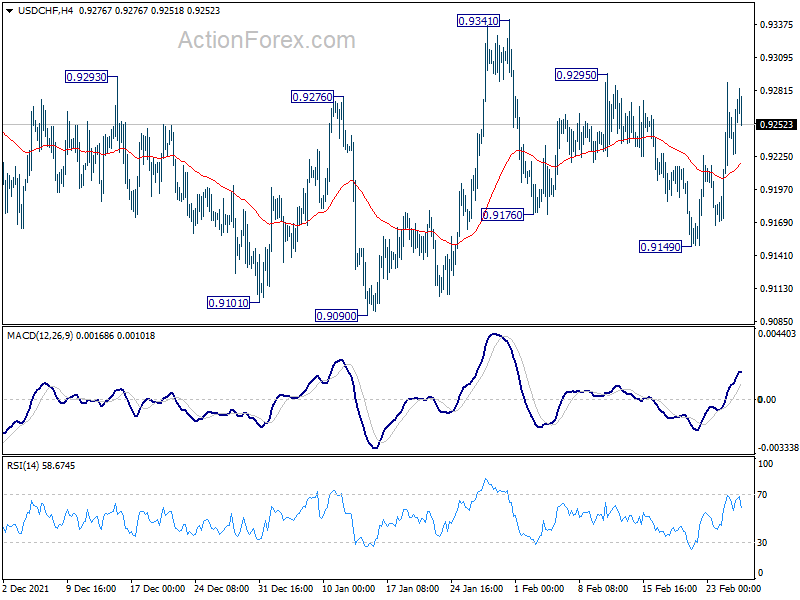
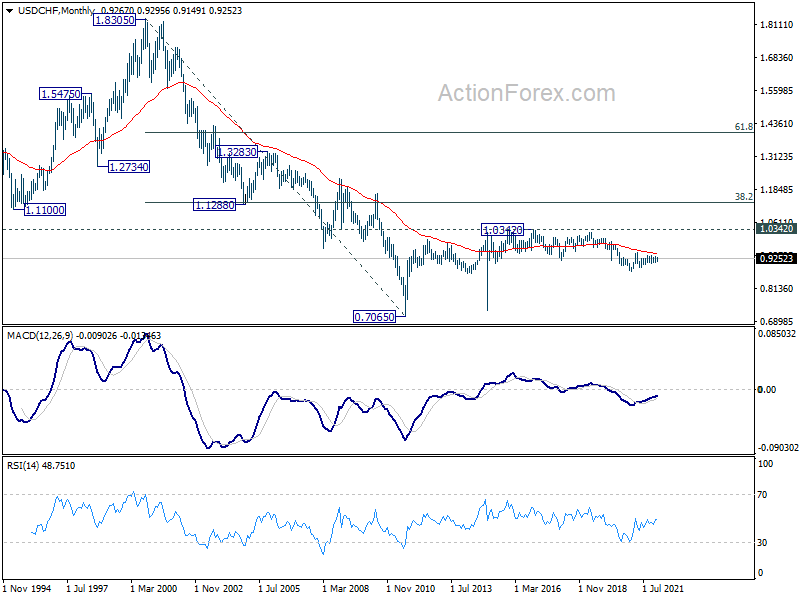
In the bigger picture, medium term outlook will be neutral at best as long as 0.9471 resistance holds. Larger down trend could still extend through 0.8756 (2021 low). However, firm break of 0.9471 will argue that the trend has already reversed and rebound the rally from 0.8756 with another impulsive move.
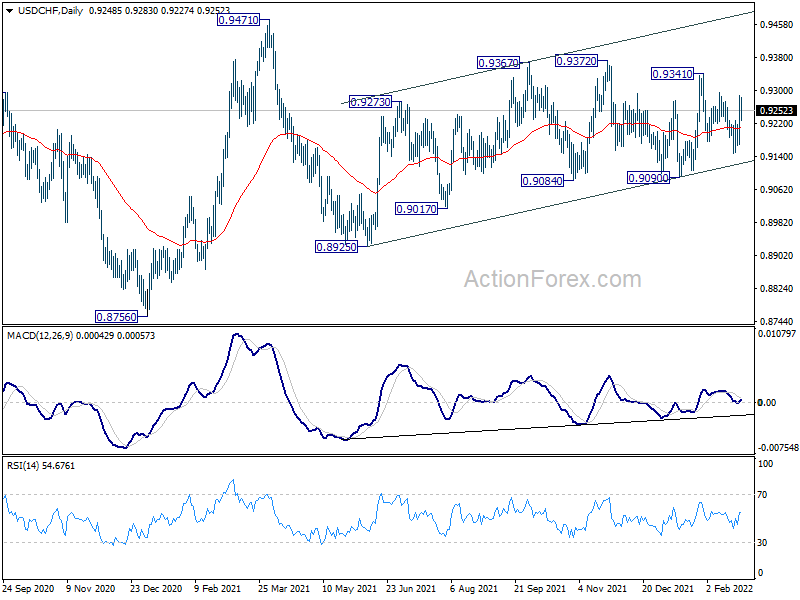
In the long term picture, price actions from 0.7065 (2011 low) are currently seen as developing into a long term corrective pattern, at least until a firm break of 1.0342 resistance.