Sample Category Title
GBP in Holding Pattern as BoE Meets
The British pound has put together an impressive rally this week, with gains of 1.11%. The currency has taken a pause ahead of a key BoE policy meeting later today.
BoE expected to hike rates
The Bank of England is widely expected to raise rates by 0.25% at today’s meeting. This would bring the Official Bank Rate to 0.50% and would be the first back-to-back rate hike since 2004. The markets were caught off guard by the December hike, as the Omicron wave was spreading across the UK. The BoE opted to raise rates because of concerns over inflationary pressures, which have continued to accelerate and show no signs of easing. The economy managed to withstand Omicron fairly well, and the central bank is confident that the economy can handle further tightening at today’s meeting.
With the likelihood of a quarter-point hike hovering around 90%, investors will be most interested in the guidance that accompanies today’s move – if the BoE sounds hawkish and hints at additional rates, this should translate into gains for the pound. A unanimous MPC vote at today’s meeting would be bullish for the pound, as it would indicate that central bank policy makers are on the same page with regard to monetary policy.
In the US, the ADP employment report for January was a disaster, with job losses of 301 thousand. This was the sharpest decline since April 2020, when the Covid pandemic started. The reaction of the markets was muted since the data was heavily impacted by the Omicron wave. Expectations are quite low for the nonfarm payroll report on Friday, with a consensus of 150 thousand. The NFP report is usually the highlight of the week, but investors are more focused on interest rate hikes and the US inflation report next week.
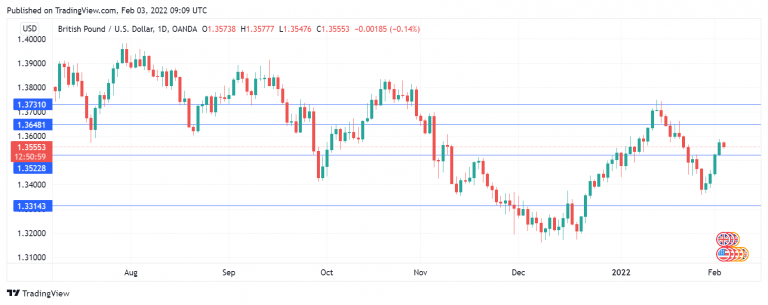
GBP/USD Technical Analysis
- 1.3522 has switched to a support role. It is a weak line. Below, there is support at 1.3314.
- There is resistance at 1.3648 and 1.3730
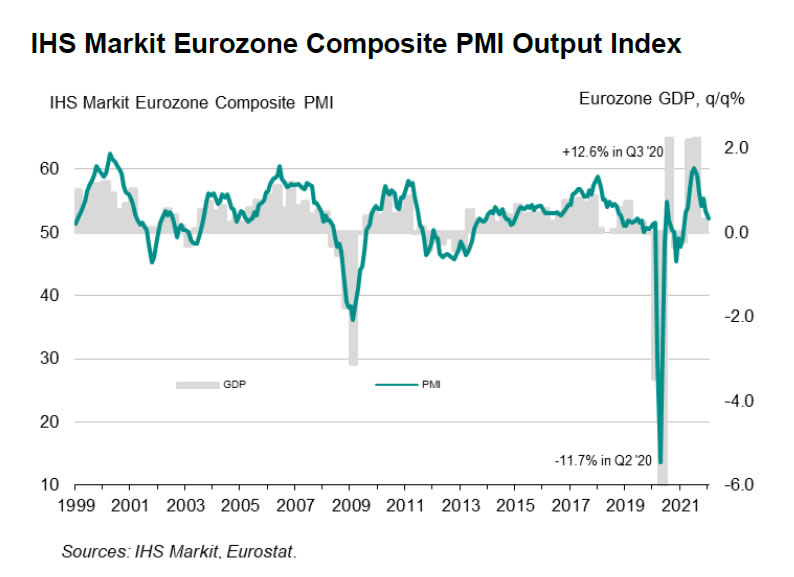
Eurozone PMI composite finalized at 52.3, economy slowed further
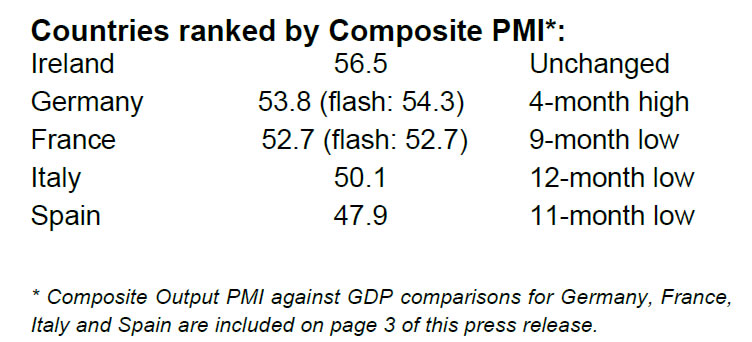
Eurozone PMI Services was finalized at 51.1 in January, down from December's 53.1. PMI Composite was finalized at 52.3, down from prior month's 53.3. Looking at some member states, Ireland PMI Composite was unchanged at 56.5, Germany dropped to 4-month low at 53.8, France dropped to 9-month low at 52.7, Italy dropped to 12-month low at 50.1, and Spain dropped to 11-month low at 47.9.
Chris Williamson, Chief Business Economist at IHS Markit said:
"The eurozone economy has slowed further in January after seeing growth weaken in the final quarter of 2021.... Spain has been the hardest hit, falling back into contraction, while Italy has seen business activity stall, in both cases linked to declining service sector output. France is meanwhile recording the weakest expansion since last April. Germany is bucking the slowdown trend, however, providing a welcome ray of light to suggest that the impact of Omicron will be both shorter and less severe than prior virus waves....
"A key concern is that inflationary pressures continue to build, with soaring energy prices likely to add further to upward price pressures in coming months. Households are already being squeezed and firms face further cost rises. Tensions in Ukraine also pose a further downside risk to the outlook, with any escalation of the situation likely to further dampen business confidence."
EURJPY Flirts with Weekly Resistance as Trend Signals Flash Green
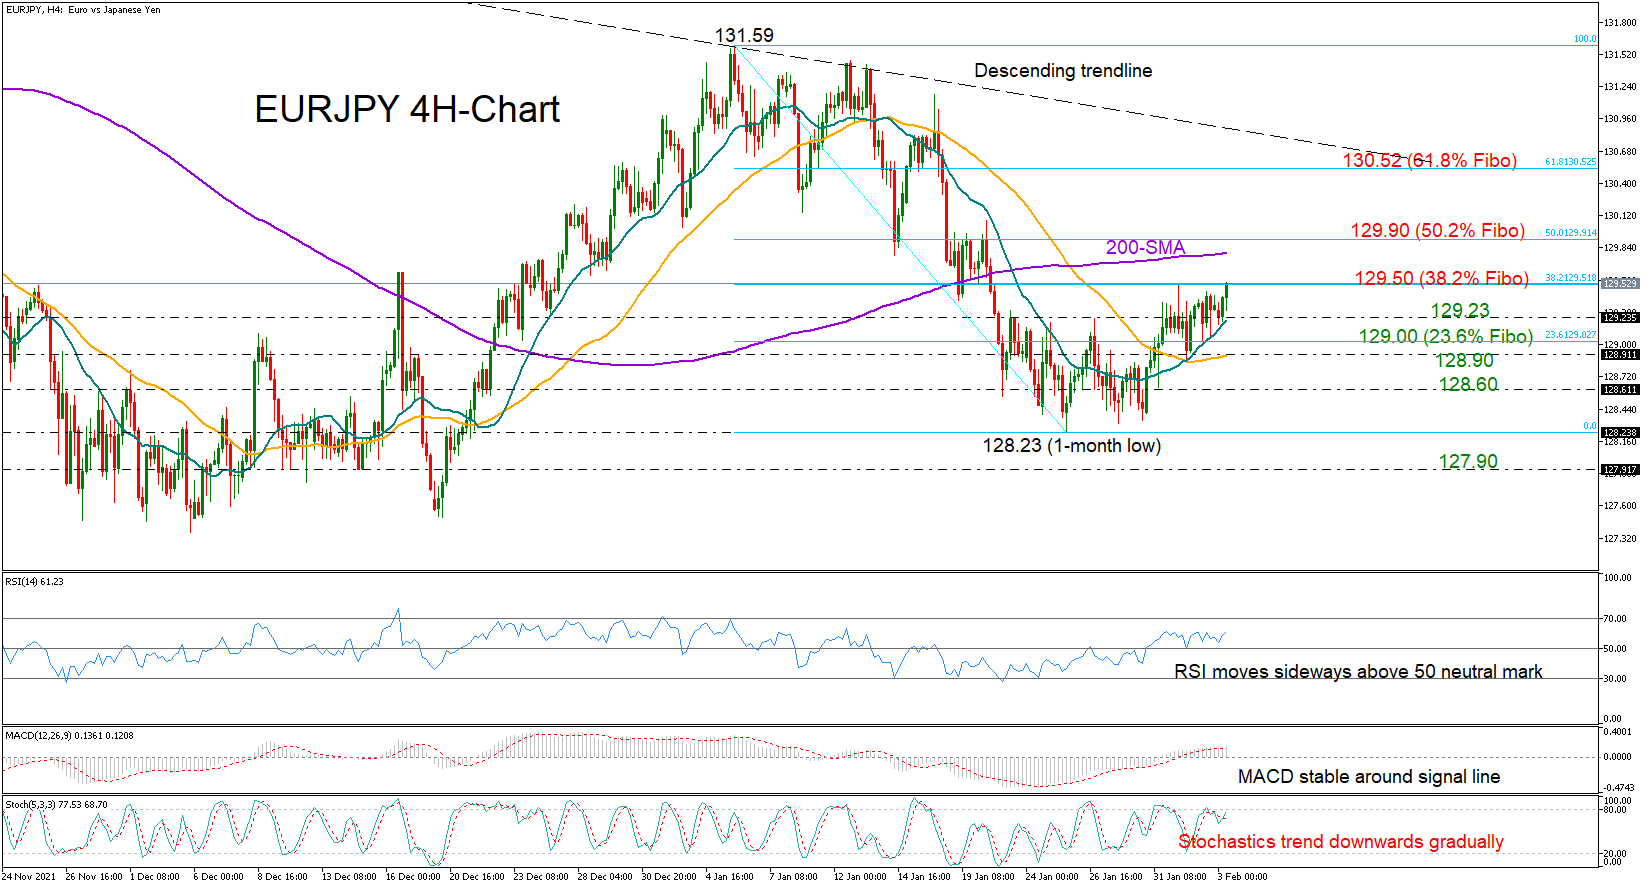
EURJPY slowed its positive pace after Monday’s quick bounce off the 128.00 territory, but the 20-day simple moving average (SMA) came to balance the boat, navigating the price gradually above the 129.23 barrier and to a fresh two-week high of 129.58.
The bullish intersection between the 20- and 50-day SMAs is feeding hopes that the rebound from one-month lows could further grow in the short-term. However, whether buyers could sustainably revive their weekly gains above the nearby resistance of 129.50, which is also the 38.2% Fibonacci of the latest bearish wave, remains to be seen as signals from momentum indicators provide no clear direction. The RSI continues to move sideways marginally above its 50 neutral mark, while the MACD is also stable and attached to its red signal line.
Should the 129.50 bar reject the bulls, with the price slipping below the immediate support of 129.23, the 23.6% Fibonacci of 129.00 and the 50-day SMA slightly beneath at 128.90 could quickly come to the rescue, preventing any extensions towards the 128.60 handle. If the latter proves fragile, the bears will next target the 128.23 bottom with scope to stretch the downtrend till the 127.90 mark.
In the event the pair snaps the 129.50 ceiling, the spotlight will shift straight to the 200-day SMA and the 50% Fibonacci of 129.90. If buyers claim that zone too, the price could fly up to the 61.8% Fibonacci of 130.52, while not far above it, the dashed descending trendline drawn from October’s top of 133.47 could stage a more challenging battle.
In brief, EURJPY is in a wait-and-see mode between the 129.50 and 129.23 boundaries in the very short-term picture. Any violation at these borders could direct the market action accordingly.
US30 Index Powers Back, Crossing Above its 50-SMA
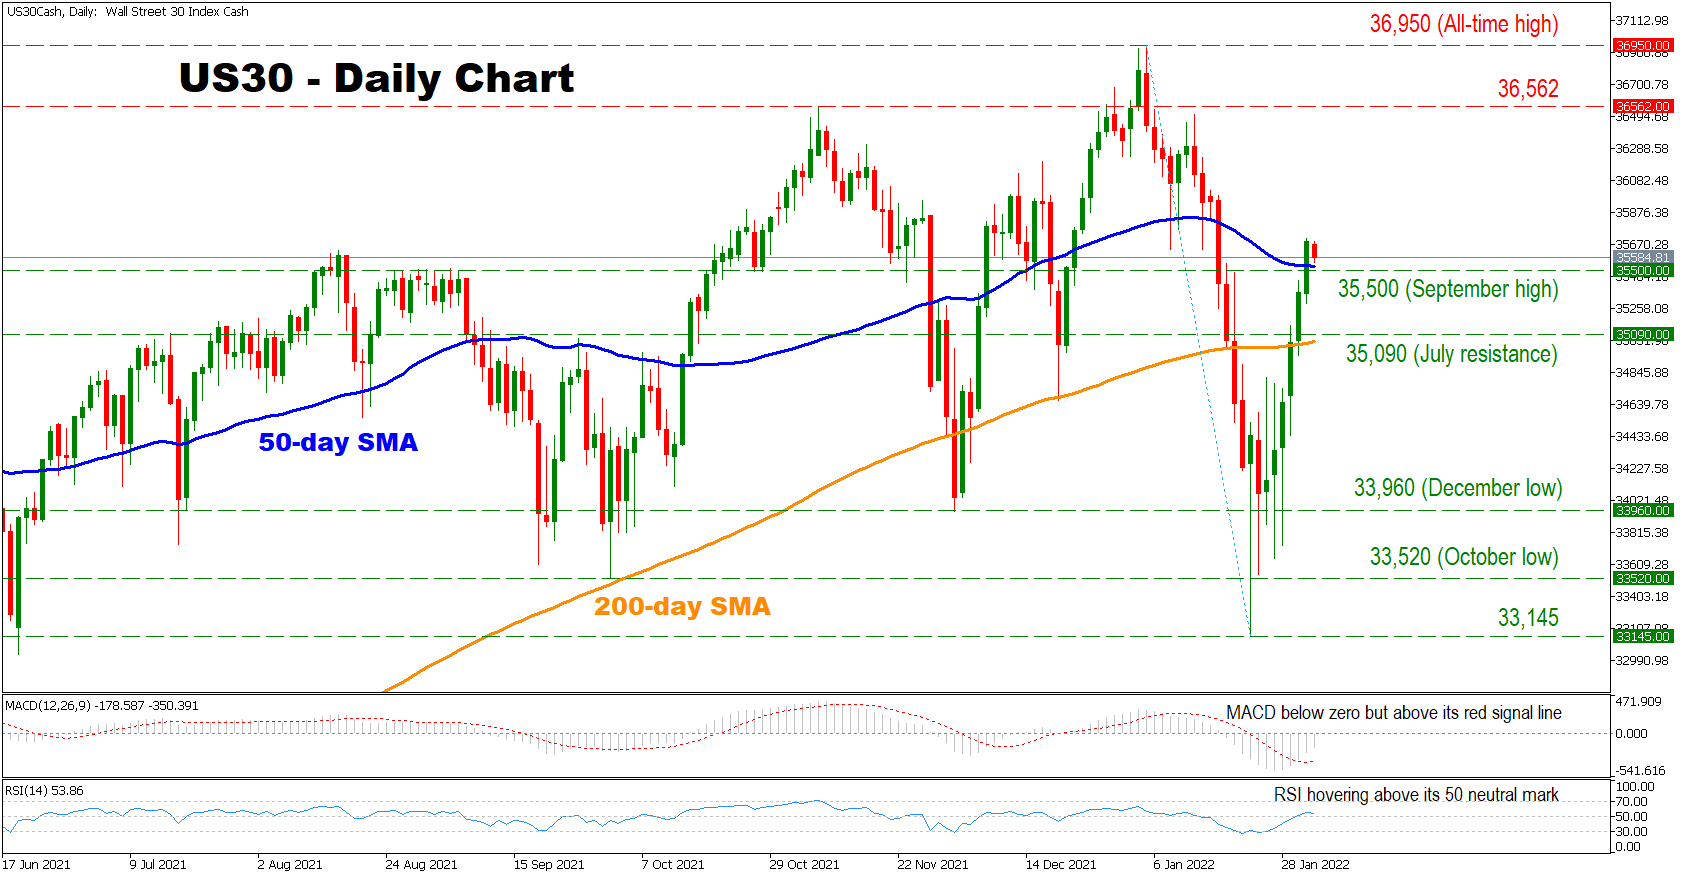
The US 30 cash index came back swinging after its January retreat, as the downtrend move appeared to be overextended. Currently, the index is trading above its 50- and 200-day simple moving averages (SMA), supporting an overall cautiously bullish outlook.
Short-term momentum indicators are also reflecting a positive bias as the RSI is hovering above its 50 neutral mark. Moreover, despite being below zero, the MACD is found above its red signal line, which indicates that the recent negative forces are waning.
Should the bulls maintain control, initial resistance might be found at the 36,562 hurdle before buyers shift their attention towards the all-time high of 36,950. Surpassing the latter, the price would enter uncharted waters, possibly targeting the 161.8% Fibonacci extension of the January 5 to January 24 downleg at 39,300.
On the flip side, the region which includes the 50-day SMA and the 35,500 obstacle might be the first line of defence, before sellers eye the area which includes the July resistance at 35,090 and the 200-day SMA currently at 35,040. Crossing below the 200-day SMA could increase selling pressures, opening the door towards the consecutive hurdles of 33,960 and 33,520.
In brief, the overall outlook for the index is cautiously bullish. For that to change, the sellers would need to break below the 200-day SMA.
AUDUSD’s bullish bias in the near term could be coming to an end
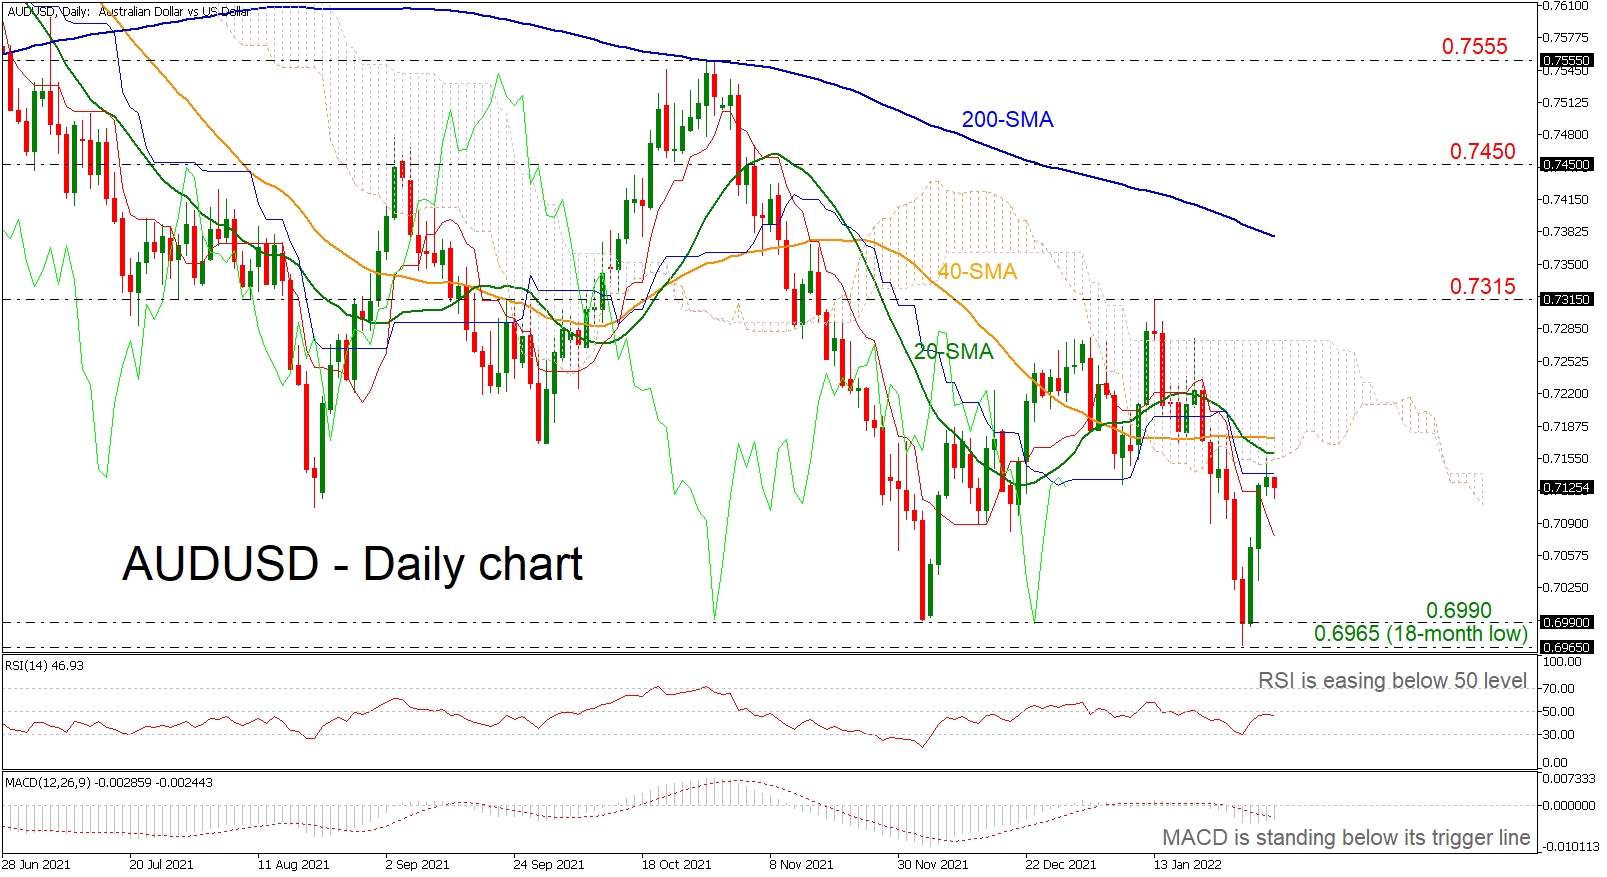
AUDUSD found strong support at the 18-month trough of 0.6965 in the previous week, rallying towards the 20-day simple moving average (SMA). However, the RSI indicator is suggesting a weakening bias as it is turning lower in the negative region, while the MACD is still holding below the zero level but is strengthening its positive move.
Should the price retreat, the 0.6990 barrier and the 18-month low of 0.6965, which the bears were unable to break the previous week, could provide immediate support. Moving lower, the focus will shift to the 0.6775 restrictive area, taken from the low in June 2020.
In the alternative scenario, traders would be eagerly looking for a break above yesterday’s top near the 20-day SMA of 0.7155 to increase buying orders. If that’s the case, the rally could last until 0.7270, the upper surface of the Ichimoku cloud. If bullish forces appear even stronger, 0.7315 and the 200-day SMA at 0.7380 should be additional resistance levels to keep in mind.
The recent bullish action turned the short-term view to slightly positive, though the bigger picture is still negative and only an advance above the 200-day SMA may change this outlook.
US Oil Consolidates Gains
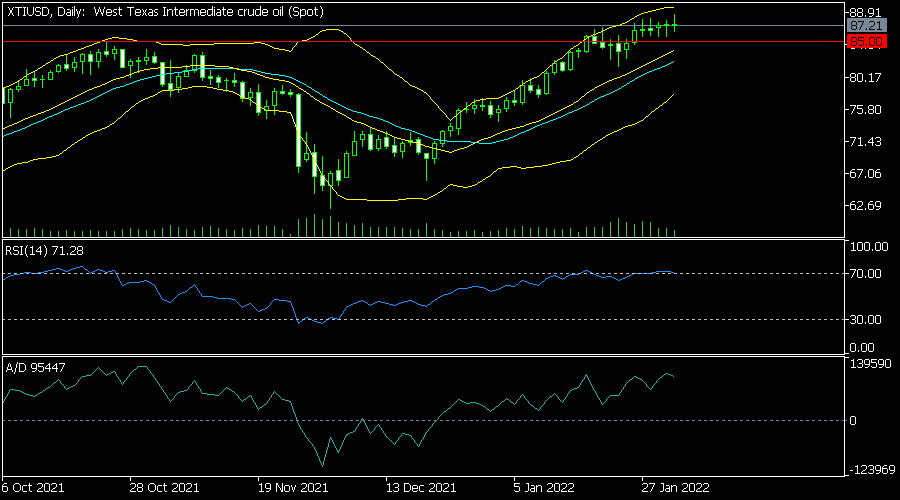
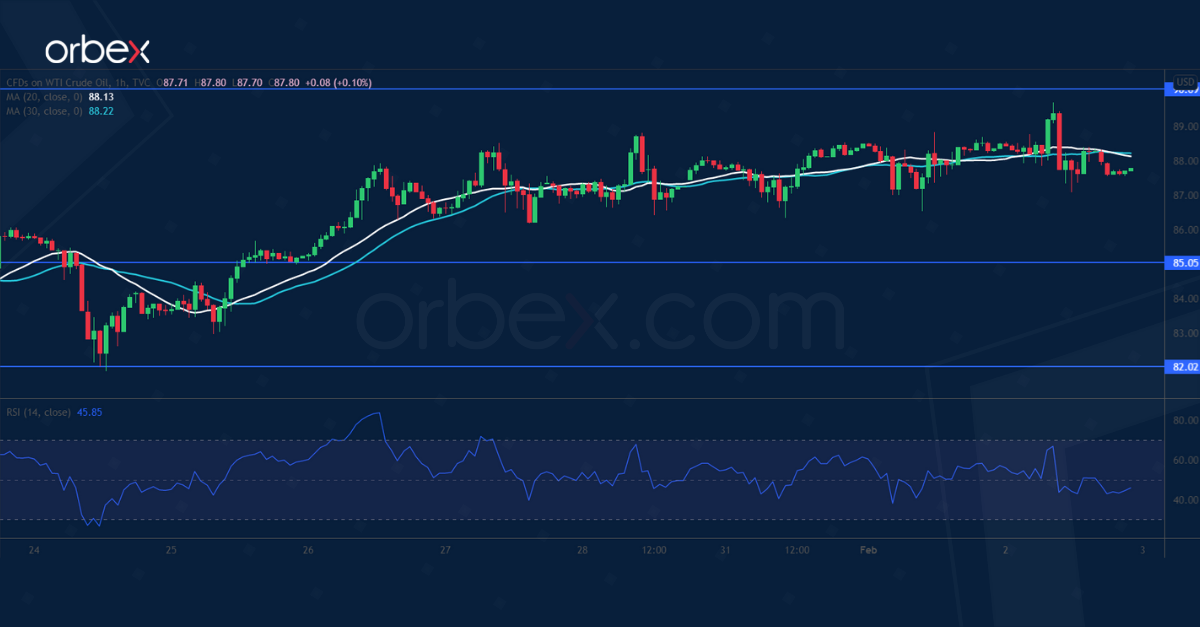
WTI crude continues to climb as OPEC+ refuses to raise its output limit. The RSI inched into the overbought territory on the daily chart after a new high above 85.00.
The bulls could be wary of chasing after the extended rally. 85.00 has turned into support and a pullback could be an opportunity to accumulate again.
Further down, 82.00 on the 30-day moving average is a major floor for the current rally. The milestone at 90.00 would be the next target when momentum makes its return.
S&P 500 Tests Resistance
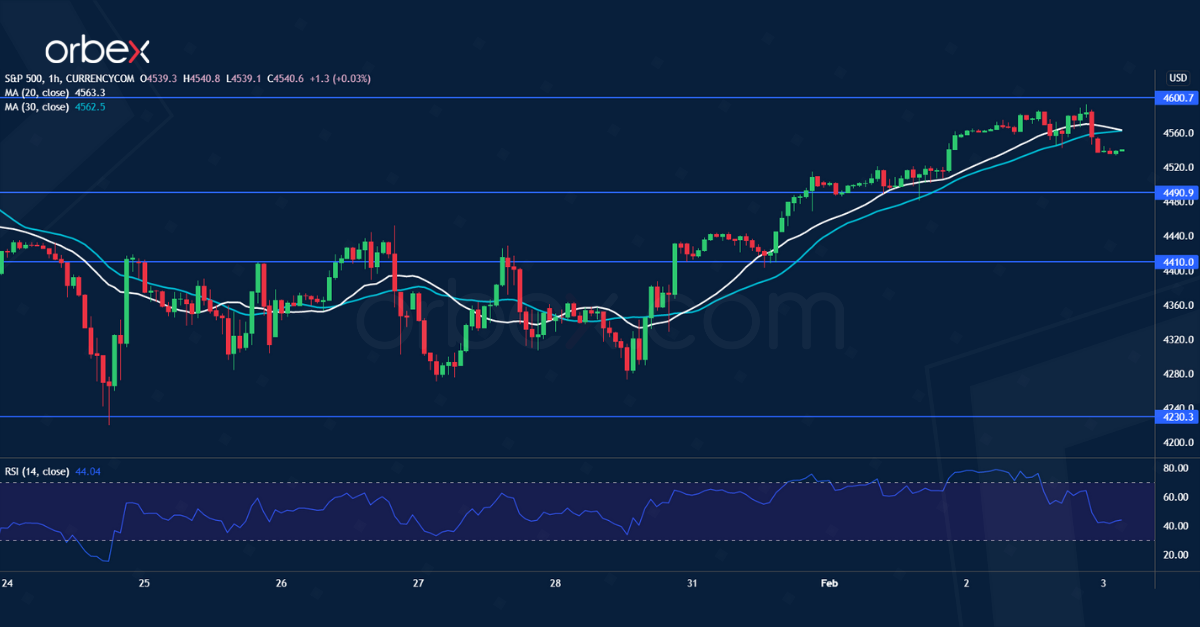
The S&P 500 rallies over better-than-expected corporate earnings. A break above 4490 has eased the selling pressure on the index.
The former daily support at 4600 is now a key resistance that lies over the 30-day moving average. A close above this congestion area could turn sentiment around, paving the way for a recovery towards 4750.
The RSI’s overbought situation may keep the momentum in check temporarily. A pullback may see buying interest in the demand zone between 4410 and 4490.
XAU/USD Attempts to Bounce
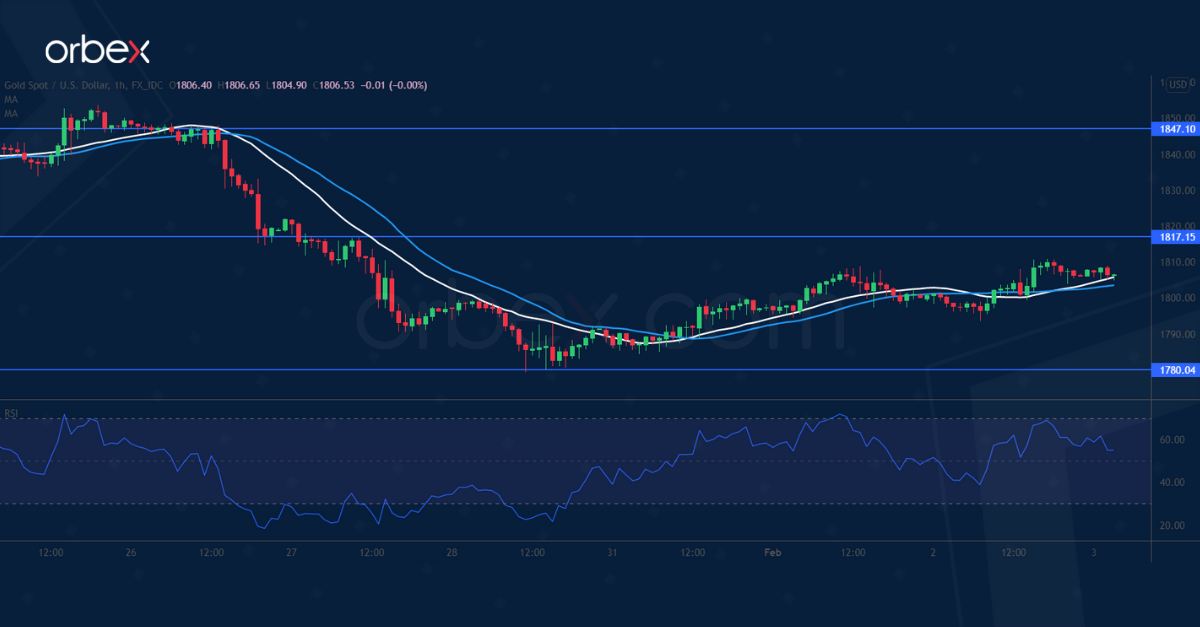
The billions bounce higher as the US dollar softens across the board. Gold is looking to claw back losses from the liquidation in late January.
A close above the psychological level of 1800 would be the first step, pushing short-term sellers into covering their bets. The previous support at 1817 coincides with the 30-day moving average, making it an area of interest and important resistance.
A bullish breakout may send the metal to the previous high at 1847. On the downside, 1780 is fresh support.
Daily Technical Analysis
EUR/USD
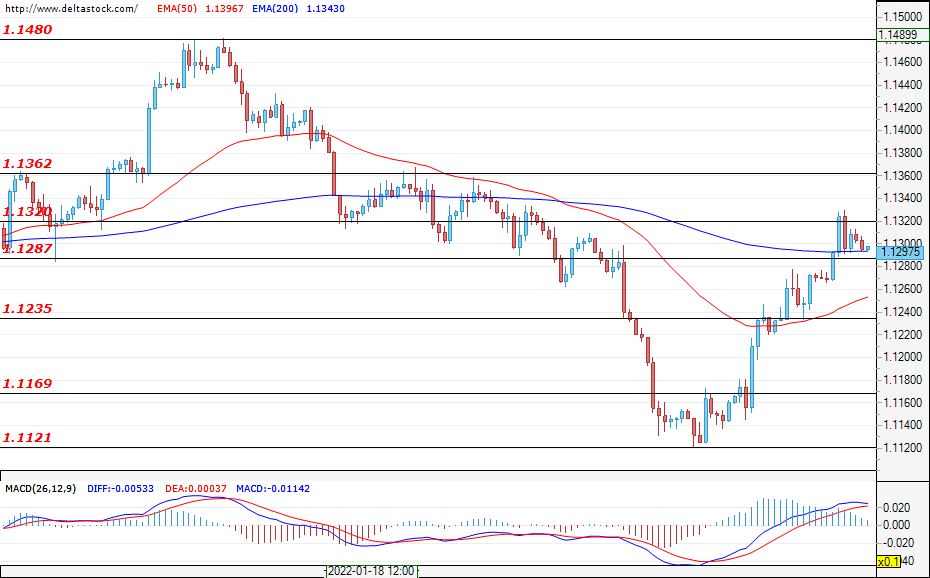
The attempt for a violation of the resistance zone at 1.1320 was not successful and the euro erased a small part of its recent gains against the dollar. During the early hours of today`s trading, the pair is holding around the current level at 1.1300, and if the bulls re-enter the market, then a new successful attack on the mentioned resistance could easily continue the recovery towards the target at 1.1362. If the bears prevail, then a violation of the support at 1.1287, followed by a breach of the lower zone at 1.1235, could deepen the decline and put an end to the corrective move. Today, an increase in market volatility can be expected around the announcement of the European Central Bank interest rate decision (today; 12:45 GMT) and during Lagard’s press-conference shortly after that.
USD/JPY
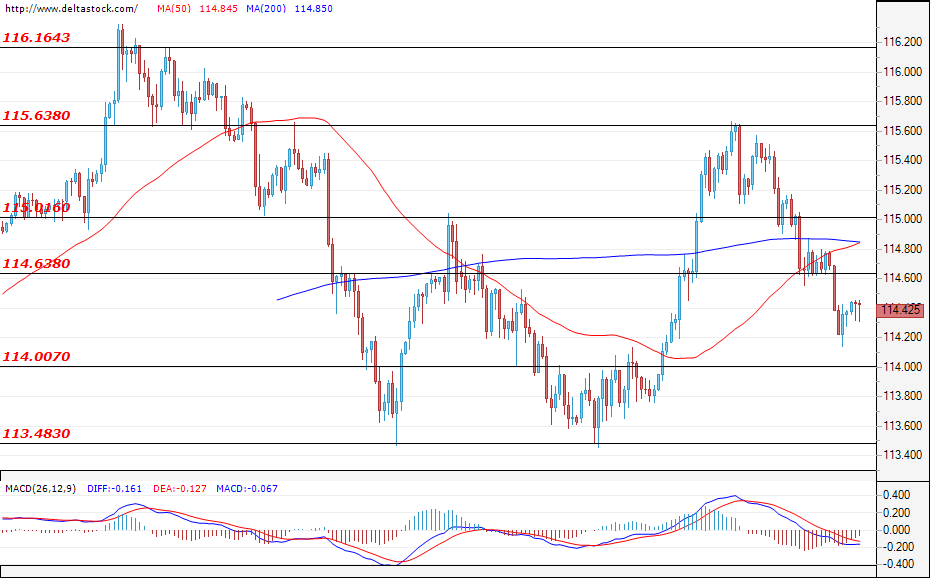
The U.S. dollar extended its losses against the yen, but at the time of writing the analysis, the pair has calmed down around the current level at 114.42. The expectations are for the downward movement to continue, with a test of the support zone at 114.00 being the most probable scenario. A breach of the mentioned level could easily lead to new losses and would strengthen the negative expectations for the future path of the Ninja. The first target for the bulls can be found at the level of 114.63, followed by the resistance at 115.00.
GBP/USD
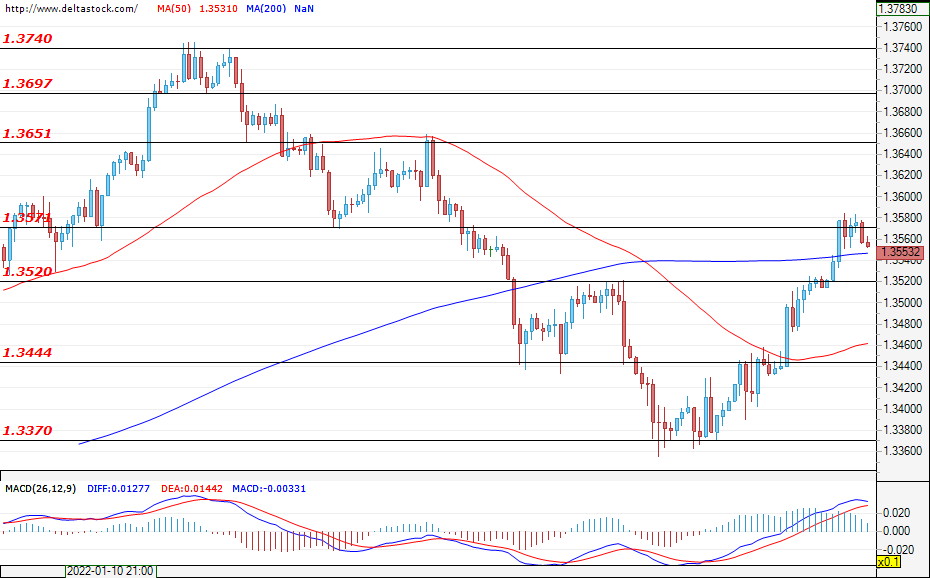
The test of the resistance zone at 1.3571 was not successful, and during the early hours of today`s trading, the pair is hovering under the mentioned level. If the bears prevail, then the corrective move should be limited to the support zone at 1.3444. If the bulls manage to gain enough momentum to overcome the zone at 1.3571, then the Cable will likely rally towards the resistance at 1.3651. The announcement of the Bank of England interest rate decision (today; 12:00 GMT) will most likely lead to an increase in volatility, especially given the fact that the main interest rate is expected to be increased by 25 bps.
EUGERMANY40
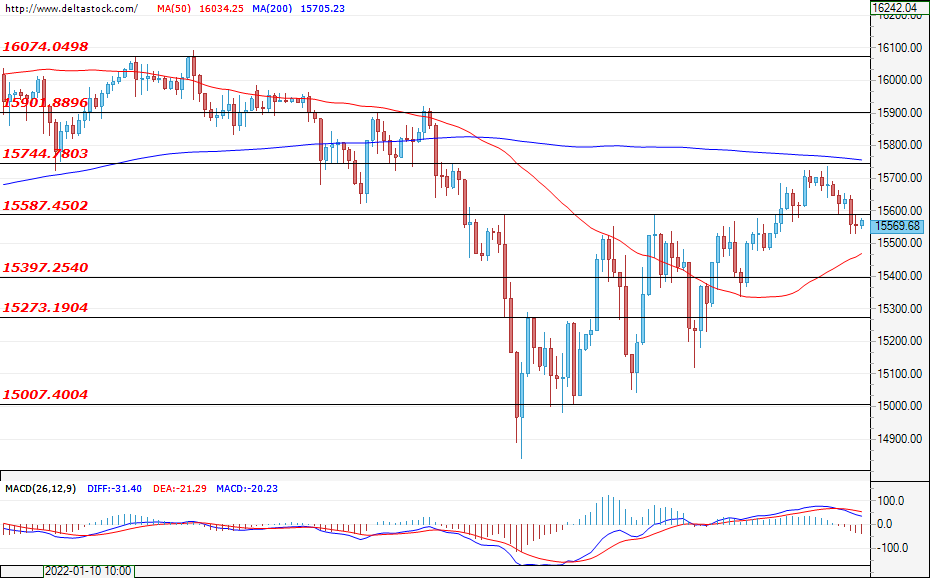
After the recovery was limited to the resistance zone at 15744, the German index fell below the close support zone at 15587. A confirmation of the breach could deepen the decline and pave the way for a test of the lower level at 15397. If the bulls regain their control, then a new successful attack on 15744 could easily lead to new gains and could strengthen the positive expectations for the future path of the index.
US30
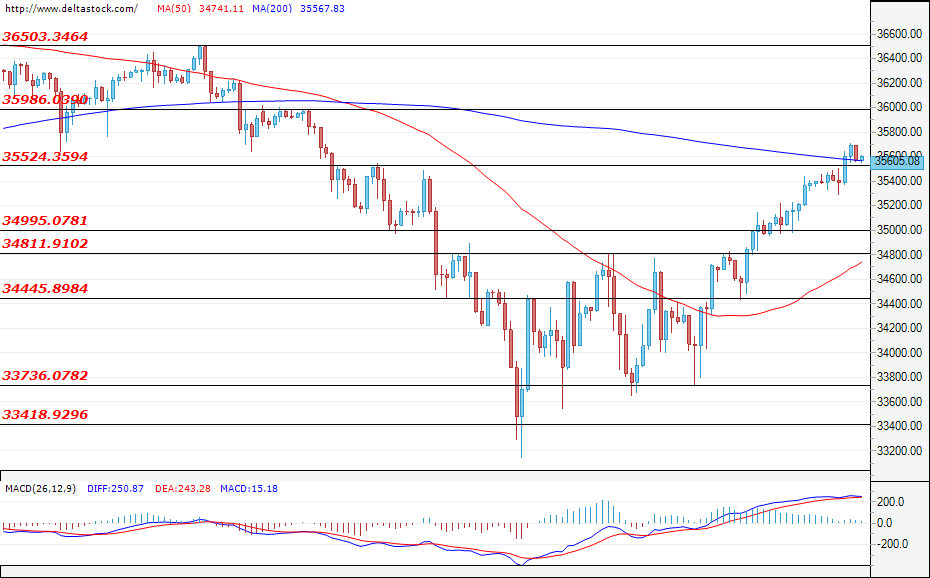
The positive sentiment remained unchanged, and at the moment of writing, the U.S. index is hovering above the zone at 35524. If the bulls remain in control, then a rally towards the target at 35986 will be the most probable scenario. Worse-than-expected data for the U.S. initial jobless claims (13:30 GMT), as well as for the ISM non-manufacturing index (15:00 GMT) could help the bears prevail. If this proves to be the case, then a breach of the support at 34811 could lead to a short-lived range-bound trading in the interval between 33736 and 34811.
Majors Hold Steady ahead of BOE and ECB Decisions
The US dollar stabilized against key currencies after surprise data by ADP Institute. The report showed that the private sector lost more than 300k jobs in January after it added 776k jobs in the previous month. Economists were expecting the figure to rise by 207k. Focus now shifts to the latest initial jobless claims numbers scheduled for later today and the official non-farm payrolls (NFP) that will come out on Friday. Historically, there is usually some divergence between the numbers published by ADP and those released by the Bureau of Labor Statistics.
The British pound held steady during the American and Asian sessions as investors turned their attention to the upcoming interest rate decision by the Bank of England (BOE). The decision comes at a time when the UK has published strong economic numbers. For example, its home price index jumped sharply in January this year. Similarly, inflation has risen while activity in the retail sector has been robust. Therefore, analysts expect that the BOE will increase the interest rate for the second meeting in a row.
The euro also held steady against the US dollar and Swiss franc ahead of the European Central Bank (ECB) decision. The decision also comes at a time when the Eurozone economy is also seeing impressive growth. On Monday, data by Eurostat revealed that the bloc’s economy expanded sharply in the fourth quarter even as the Omicron variant continued spreading. The strong GDP data was followed by data that revealed that the unemployment rate declined to an all-time low. On Wednesday, Eurostat also showed that the bloc’s inflation is rising. Therefore, there is a likelihood that the ECB will sound hawkish today.
EURUSD
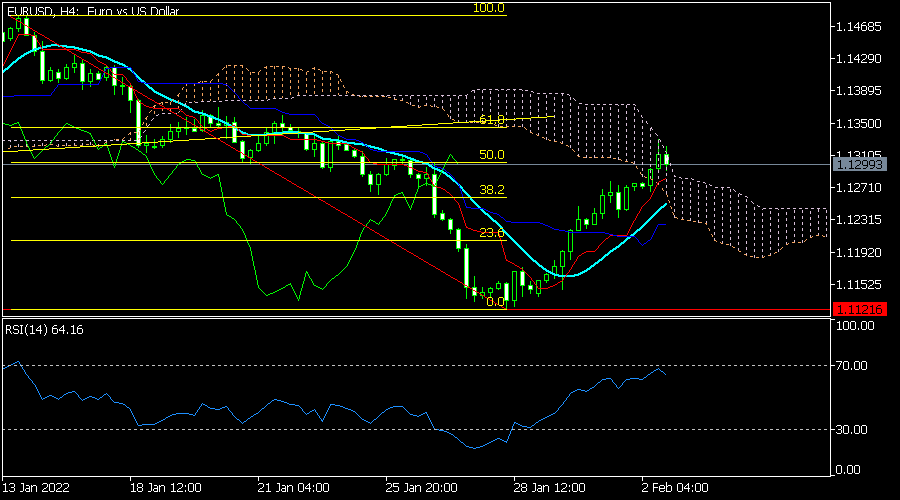
The EURUSD pair has been in a strong bullish trend in the past few days. The pair rose to a high of 1.1328 as traders waited for the upcoming ECB decision. On the four-hour chart, the pair is along the 50% Fibonacci retracement level. It also remains above the 25-day moving average and is inside the Ichimoku cloud. Therefore, the pair will likely pull back slightly ahead of the ECB decision.
GBPUSD
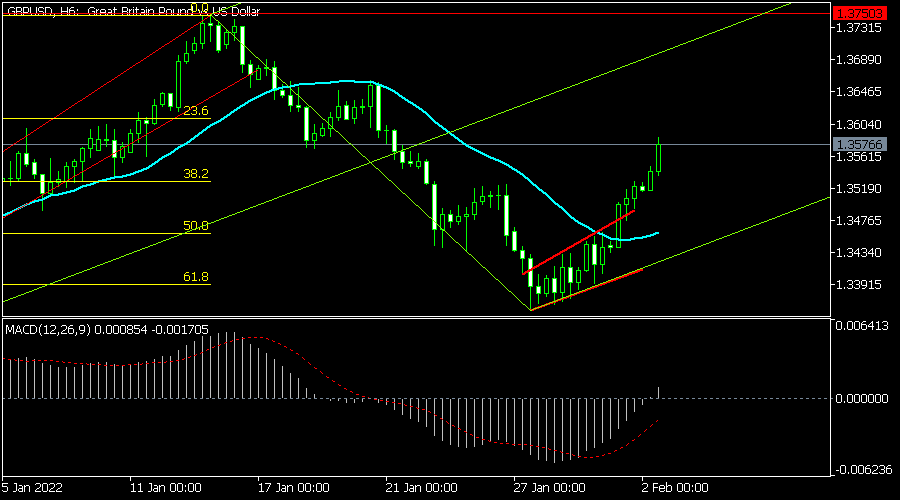
The GBPUSD pair continued its bullish trend ahead of the BOE decision. On the six-hour chart, the pair managed to move above the 38.2% Fibonacci retracement level. It is also between the middle and the support lines of Andrew’s pitchfork tool. It is also above the 25-day moving average. Therefore, there is a possibility that the pair will have a pullback as traders sell the rate hike news.
XTIUSD
The XTIUSD pair held steady of the latest OPEC+ deal. The cartel decided to continue with the gradual pace of supply increases. It also moved above the key resistance level at 85, which was the highest point last year. It is between the middle and upper lines of the Bollinger Bands while oscillators have risen. Therefore, the path of the least resistance for the pair is in the upside.