Sample Category Title
Crude Oil Price Touches $90, Indicators Suggest Loss In Momentum
Key Highlights
- Crude oil price gained pace and tested the $90.00 level.
- A key bullish trend line is forming with support near $88.20 on the 4-hours chart of XTI/USD.
- EUR/USD extended recovery above 1.1300, and GBP/USD spiked above 1.3550.
- The US ISM Services Index could decline from 62.0 to 59.5 in Jan 2022.
Crude Oil Price Technical Analysis
In the past few days, crude oil price saw a steady increase above $82.00 against the US Dollar. It broke many hurdles near $85.00 and $86.50 to move further into a positive zone.
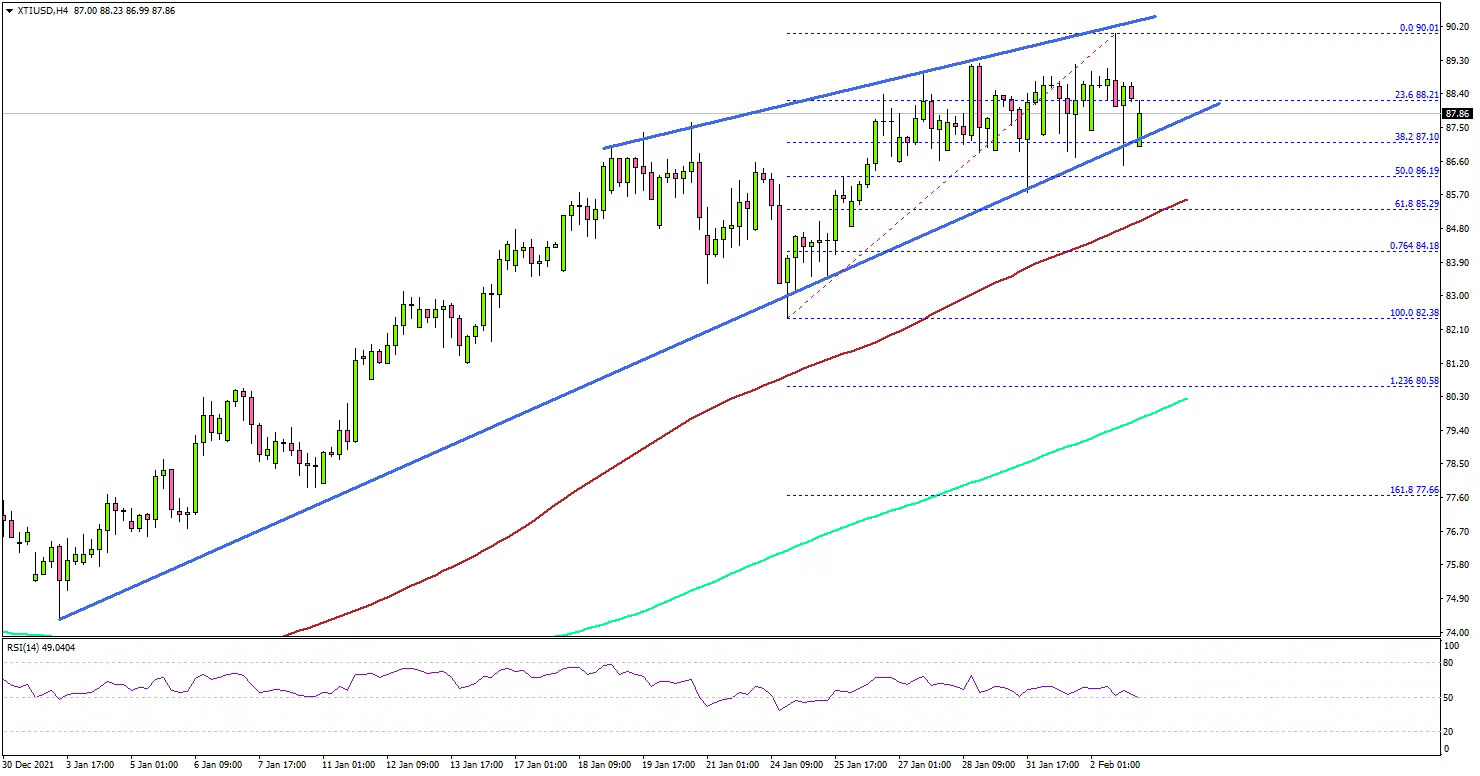
Looking at the 4-hours chart of XTI/USD, the price even settled above the $85.00 level, the 100 simple moving average (4-hours, red) and the 200 simple moving average (4-hours, green).
It traded to a new multi-year high above $90.00. The current indicators suggest that the price is losing bullish momentum. An immediate support on the downside is near the $88.50 level. The first major support is near $88.20.
There is also a key bullish trend line forming with support near $88.20 on the same chart. Any more losses could open the doors for a move towards the $85.20 support and the 100 simple moving average (4-hours, red).
On the upside, the bulls are facing resistance near $90.00. The next major resistance is near $92.00, above which the price could rise to $93.50.
Looking at EUR/USD, the pair was able to gain pace for a move above the 1.1300 level. Besides, GBP/USD also started a fresh increase above the 1.3500 resistance zone.
Economic Releases to Watch Today
- Germany’s Services PMI for Jan 2022 - Forecast 52.2, versus 52.2 previous.
- Euro Zone Services PMI for Jan 2022 – Forecast 51.2, versus 51.2 previous.
- UK Services PMI for Jan 2022 – Forecast 53.3, versus 53.3 previous.
- BoE Interest Rate Decision - Forecast 0.50%, versus 0.25% previous.
- US Services PMI for Jan 2022 – Forecast 50.9, versus 50.9 previous.
- US ISM Services Index for Jan 2022 – Forecast 59.5, versus 62.0 previous.
- US Initial Jobless Claims - Forecast 245K, versus 260K previous.
Eco Data 2/3/22
[php_everywhere instance="1"]
GBPUSD’s Positive Mood Gains Strength
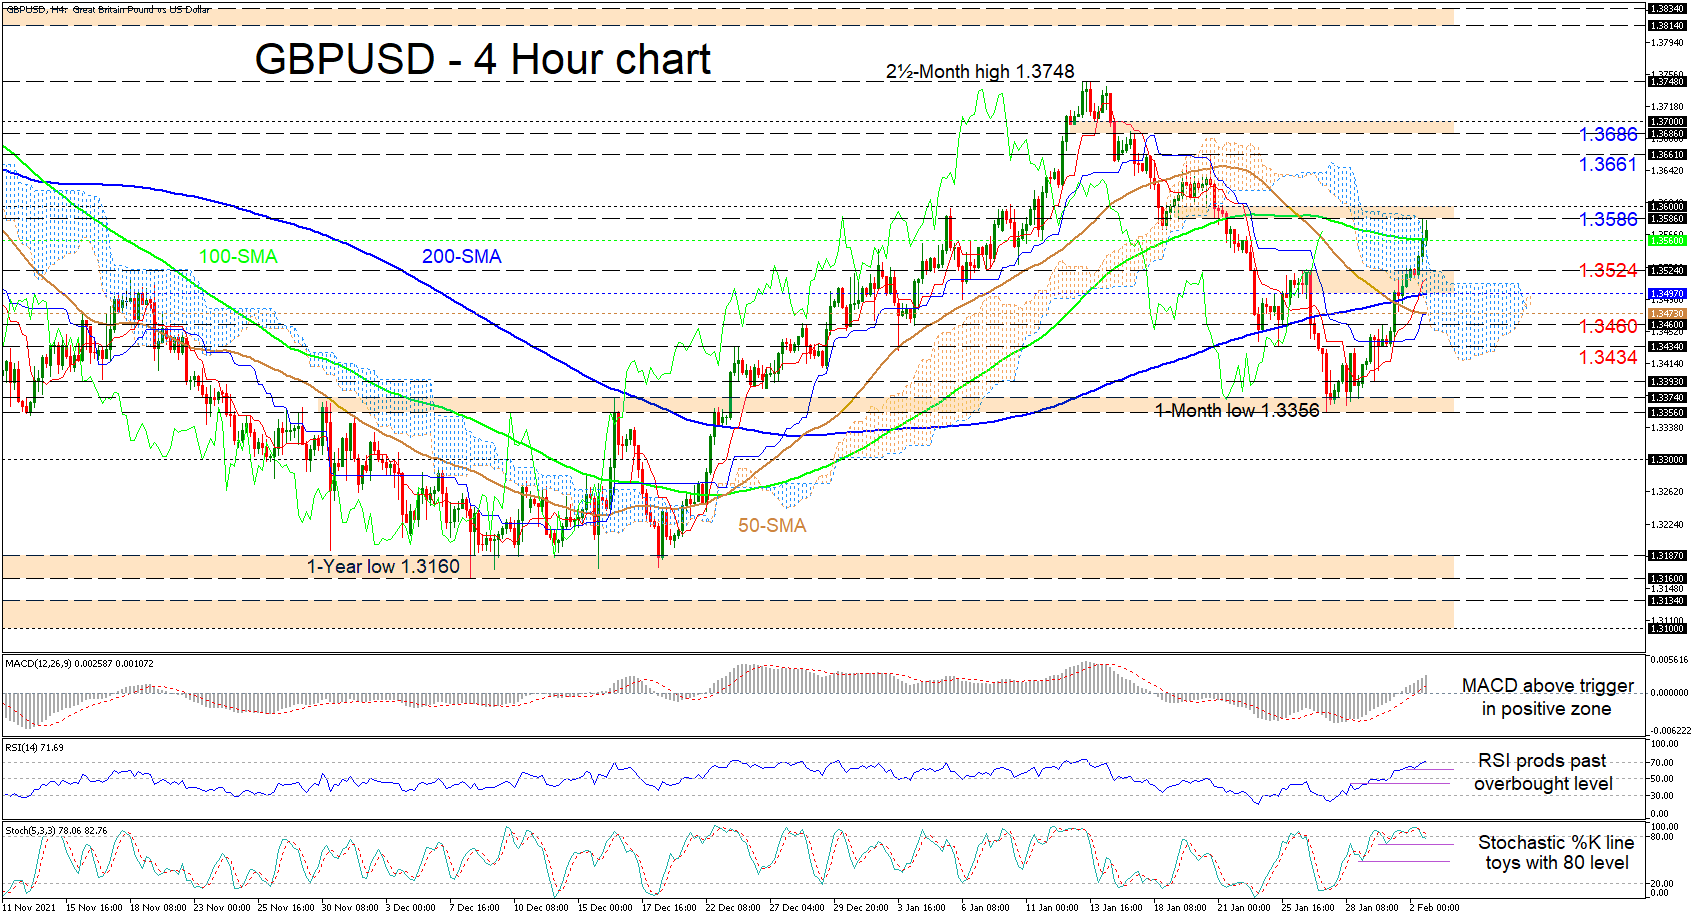
GBPUSD has nudged above the Ichimoku cloud and over the 100-period simple moving average (SMA) at 1.3560 and appears to be sustaining its optimistic tone from the bounce off the 1.3356 level. The SMAs are not reflecting a driving trend but the negative slopes of the 50- and 100-period SMAs have diminished to a degree.
The Ichimoku lines are indicating positive forces are growing, while the short-term oscillators are confirming upside momentum is persisting. The MACD is soaring above its red trigger line in the positive section, while the RSI is climbing in the overbought territory. The stochastic %K line is flirting with the 80 overbought level as positive pressures endure.
Maintaining the current price trajectory, resistance may originate from the 1.3586-1.3600 boundary. If additional gains unfold, the price could then propel towards the 1.3661 barrier before the bulls challenge the 1.3686-1.3700 resistance band.
If upside pressures subside around the 1.3586-1.3600 zone, progress in the pair could dwindle, with initial downside friction occurring at the 100-period SMA at 1.3560. Retreating below it, a key support section between the 1.3524 barrier and the 200-period SMA at 1.3497 could provide buyers with a footing. However, if this area fails to do so, the price could sink towards the space between the 50-period SMA at 1.3473 and the 1.3460 level, before sellers seek out the 1.3434 low.
Summarizing, GBPUSD is exhibiting a persistent bullish tone above the 200-period SMA and the 1.3524 inside swing high. A break above 1.3600 may boost the existing rally, while a dip the 200-period SMA around 1.3500 could feed negative tendencies.
US oil inventories dropped -1.0m barrels, WTI rejected by 90
US commercial crude oil inventories dropped -1.0m barrels in the week ending January 28, versus expectation of 1.8m rise. At 415.1m barrels, oil inventories are about -9% below the five year average for this time of year.
Gasoline inventories rose 2.1m barrels. Distillate dropped -2.4m barrels. Propane/propylene dropped -4.3m barrels. Total commercial petroleum inventories dropped -5.8m barrels.
Earlier today, OPEC+ decided to raise production by another 400k barrels a day in March, continuing with the monthly plan agreed back in last July.
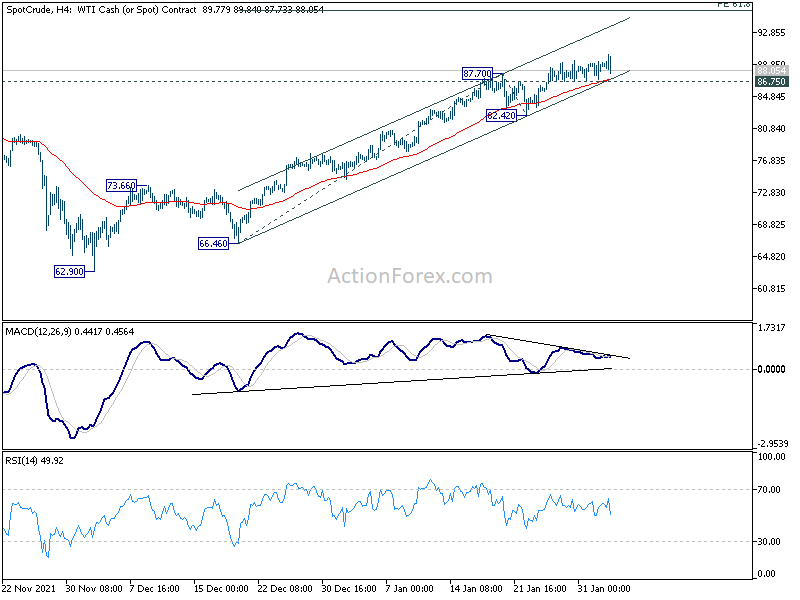
WTI crude oil hit 90.10 earlier today but failed to sustain above 90 handle and retreated. For now, further rise will remain in favor as long as 86.75 support holds, which is close to 4 hour 55 EMA. Current rally could still target 61.8% projection of 66.46 to 87.70 from 62.42 at 95.54 before topping.
However, considering bearish divergence condition in 4 hour MACD, break of 86.75 support will confirm short term topping and bring deeper pull back to 82.42 support, and possibly below.
Sunset Market Commentary
Markets
The US dollar extends this week’s losses. It’s the worst performing currency, even losing out against JPY and CHF in spite of the risk rebound of the past days. The trade-weighted dollar now changes hands at 96, exactly where it was trading ahead of last week’s hawkish FOMC meeting. In between, it set a new recovery high at 97.27. The same goes for EUR/USD which is back at 1.13+ after dipping to 1.1121 on Friday. There’s no strong driver for this USD-reversal, but it does say something on underlying sentiment. From current levels, it will be hard for USD to put in place any new significant upleg. With regard to EUR/USD, it’s also remarkable that the rebound higher wasn’t stronger. Especially taking into account this week’s huge increase at the front end of EUR rate curves. The Euribor 3-month forward curve trades positive in yield terms from March 2023 onwards. We’ve seen over the past months that FX only really starts profiting when central bank step up their efforts in making policy rates less negative. The probability that the single currency gets the backing from the ECB tomorrow remains low, even if we got the umpteenth upside inflation surprise today. Headline inflation accelerated to a new EMU high of 5.1% Y/Y (from 5% Y/Y) while they anticipated a base-effect triggered slowing. Core inflation remains above the ECB’s 2% inflation target, declining less than expected (2.3% Y/Y from 2.6% Y/Y vs 1.9% Y/Y forecast). We continue to believe that the ECB eventually will make a policy turn (eg at the March meeting with new inflation forecasts), accelerating the tapering of net asset purchases in order to free space to start hiking policy rates this year. German Bunds again underperformed US Treasuries. German yield changes range between -1.2 bps (30-yr) and +2.4 bps (5-yr). The US Treasury curve steepens with yield changes varying between -1.8 bps (2-yr) and + 0.7 bps (30-yr). The US eco calendar contained a disappointing January ADP employment report after the stellar December numbers (776k). US firms cut 301k jobs, while consensus expected 180k net job growth. A surge in Omicron-infections is to blame. Details showed a broad-based decline with negative outliers in services. More specifically for leisure/hospitality (-154k jobs) and trade/transportation/utilities (-62k). Payrolls in manufacturing and construction fell by 21k and 10k respectively. European and US stock markets currently record gains of around 0.5%. EUR/GBP treads water between 0.83 and 0.8350 for the past five session in anticipation on tomorrow’s BoE meeting. A rate hike is discounted, but is the BoE willing to deliver more hikes than previously communicated? UK money markets are already betting on 5 25 bps moves this year.
News Headlines
US Treasury announced it will trim bond sales for the February-April quarter. The second cut on a row reflects declining funding needs after going all in at the height of the pandemic. Total bond issuance over the next three months is $111bn lower compared to the previous fiscal quarter. Volumes decline across the curve. The deepest cutbacks will be for the 7-year notes which will see total issuance $9bn lower at the end of the current quarter compared to the end of the previous three months (January). Issuance in the 2y-3y-5y segment over the same period will have declined by $6bn each. Treasury will ramp up supply in the 10y and 30y tenors this month by $1bn compared to the last auction before cutting back in March (-$3bn each). It will keep that amount stable at the end of the fiscal quarter in April.
OPEC+ agreed to normalize output, sticking to the script outlined in 2021. Production should increase by some 400k barrels a day. Should, but not necessarily will because some cartel members experience difficulties to keep up with production due to outages or general capacity constraints. In January, OPEC+ also agreed to add 400k barrels per day. In reality though, total additional supplies only amounted to 210k, Bloomberg reported based on information from officials. Data presented to an internal committee on Tuesday showed an overcompliance to production cuts by OPEC of 122%, meaning they are cutting far more than required.
Stocks Extend Gains, Dollar Retreats Amid Improving Risk Tone
Dollar slips; euro and pound advance
The dollar continues to lose ground for the third consecutive session as long-term Treasury yields extend their decline and seem unable to gain traction. Moreover, the soaring risk appetite observed in the markets today inflicted further damage on the safe-haven dollar. To make matters worse, the ADP jobs data reported earlier today showed a 301K decrease in private US employment in January versus expectations for a 207K gain, setting the stage for a disappointing NFP figure on Friday.
On the other hand, the euro and British pound are trading higher ahead of the ECB and BoE policy meetings tomorrow. For the euro, the hotter-than-expected inflation figure released earlier today was the largest upside surprise from the consensus estimates on record, dealing a blow to the ECB’s projection that inflation had reached its peak. Following the announcement, the markets are pricing in a 10 basis point rate hike in July of 2022, acting as a tailwind for the single currency.
Additionally, sterling is appreciating today as the upcoming rate decision is enhancing its attractiveness versus the sluggish greenback, while there are also increasing odds that tomorrow the BoE will signal an acceleration of its rate hike timeline.
In the broader forex spectrum, cyclical currencies such as the aussie, kiwi and loonie are stronger on the day, capitalizing on the risk-on sentiment and the elevated oil prices. Elsewhere, the intensifying geopolitical tensions continue to support the franc and yen, which are gaining ground against the dollar but are lagging versus risky currencies.
Stocks head north as earnings smash projections
Wall Street is set to open higher today and extend its three-day winning streak as stronger-than-expected earnings and dip-buying seem to be resuming. More specifically, e-mini futures for the Nasdaq, S&P 500 and Dow Jones are up 1.7%, 0.9% and 0.25% in pre-market trade respectively. Additionally, major European stock markets are also storming higher today, benefiting from the broader risk-on sentiment. However, investors’ fears over the timing and pace of the Fed’s upcoming monetary tightening seem to be capping the upside potential.
Oil creeps higher; gold holds steady
Oil futures have resumed their rally and are climbing towards fresh 7-year highs after OPEC+ decided to stick with its current output plan. In other commodity news, natural gas futures are up 9% on the day due to supply disruptions from extreme weather conditions on the east coast of the US and tensions in Ukraine.
Gold remains slightly above the $1,800 mark today as opposite directional forces seem to counteract each other. The negative impact of the surging risk appetite on bullion’s demand is being offset by retreating yields, tensions in the Russian-Ukrainian borders and the softer dollar.
USD/JPY Mid-Day Outlook
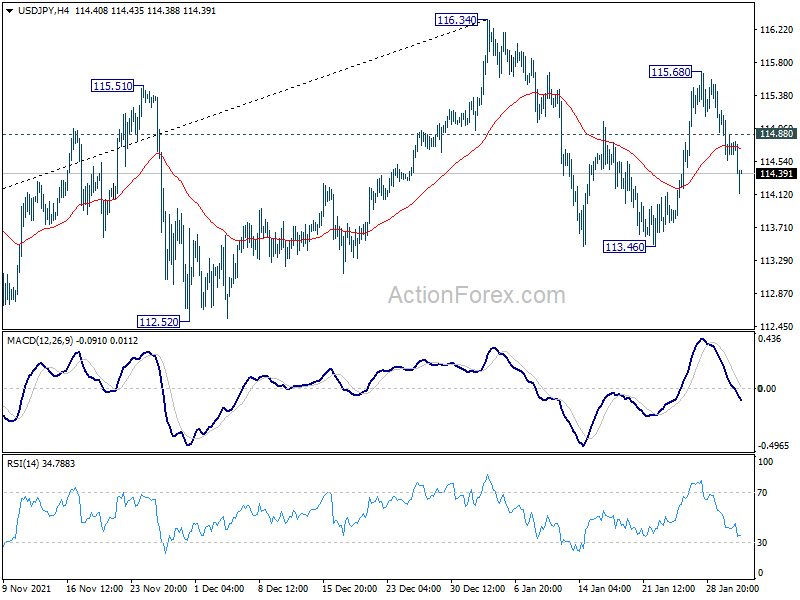
Daily Pivots: (S1) 114.45; (P) 114.82; (R1) 115.07; More...
Break of 114.46 minor support suggest that rebound from 113.46 is finished at 115.68. Intraday bias is back on the downside. Corrective pattern from 116.34 is extending with another falling leg. Break of 113.46 will target 112.52 support. On the upside, above 114.88 minor resistance will turn bias back to the upside for 115.68 resistance.
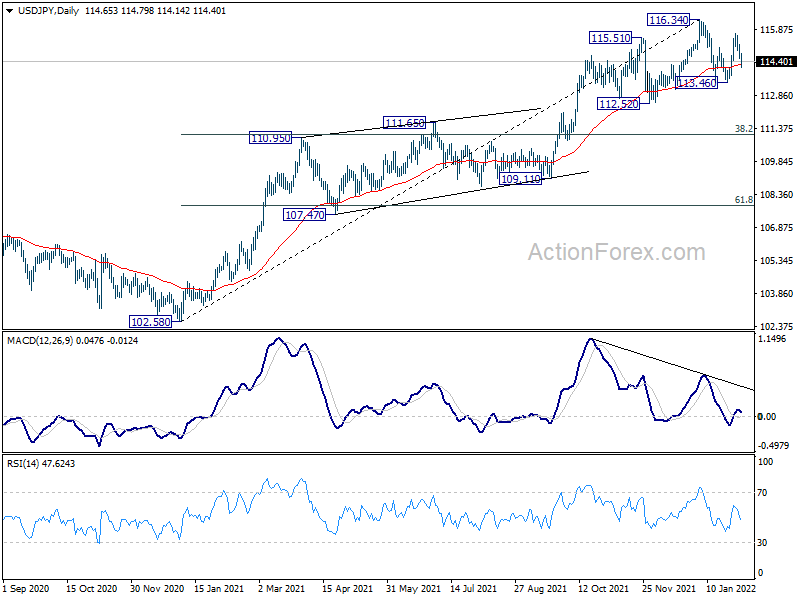
In the bigger picture, no change in the view that rise from 102.58 is the third leg of the up trend from 101.18 (2020 low). Such rally should target a test on 118.65 (2016 high). Sustained break there will pave the way to 120.85 (2015 high) and raise the chance of long term up trend resumption. This will remain the favored case as long as 55 week EMA (now at 111.07) holds.
USD/CHF Mid-Day Outlook
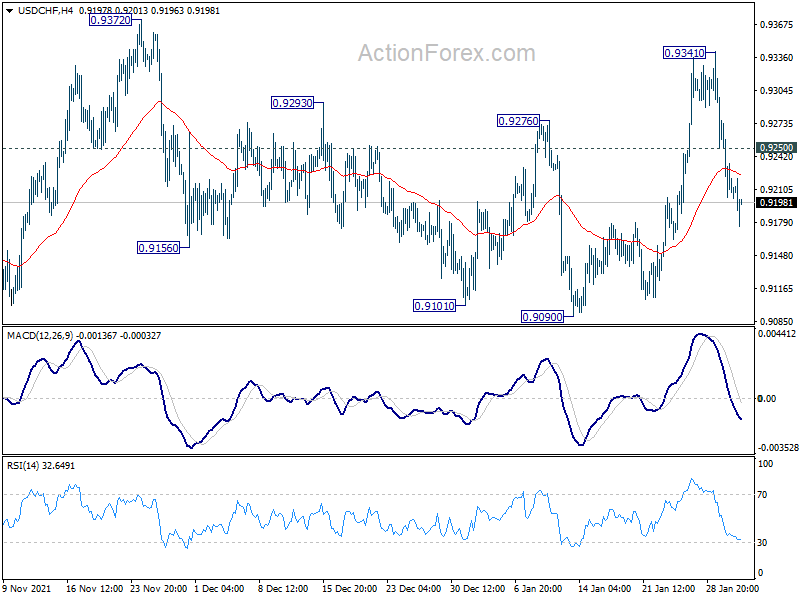
Daily Pivots: (S1) 0.9184; (P) 0.9230; (R1) 0.9257; More....
Intraday bias in USD/CHF remains on the downside for 0.9090 support. Firm break there will argue that choppy rise from 0.8925 has completed, and turn near term outlook bearish. Nevertheless, above 0.9250 will turn bias back to the upside for 0.9341, and then 0.9372 instead.
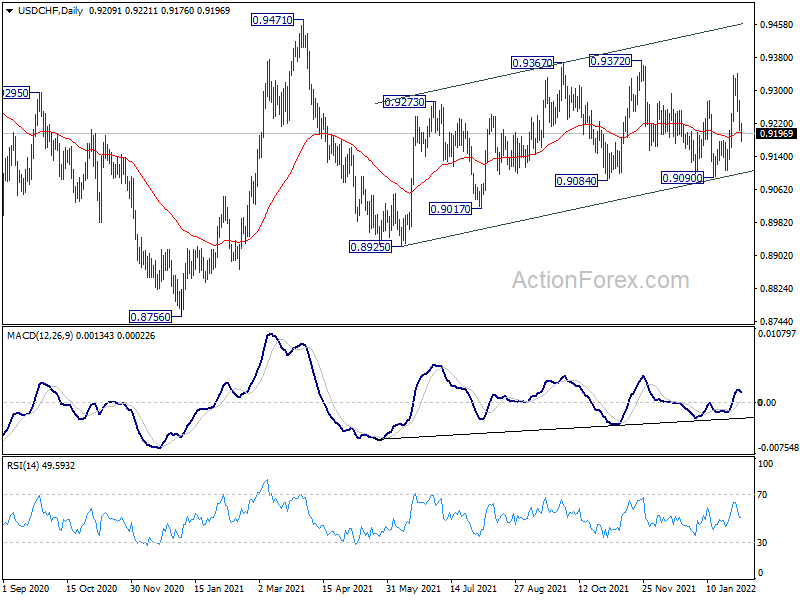
In the bigger picture, medium term outlook will be neutral at best as long as 0.9471 resistance holds. Larger down trend could still extend through 0.8756 (2021 low). However, firm break of 0.9471 will argue that the trend has already reversed and rebound the rally from 0.8756 with another impulsive move.
GBP/USD Mid-Day Outlook
Daily Pivots: (S1) 1.3464; (P) 1.3496; (R1) 1.3557; More...
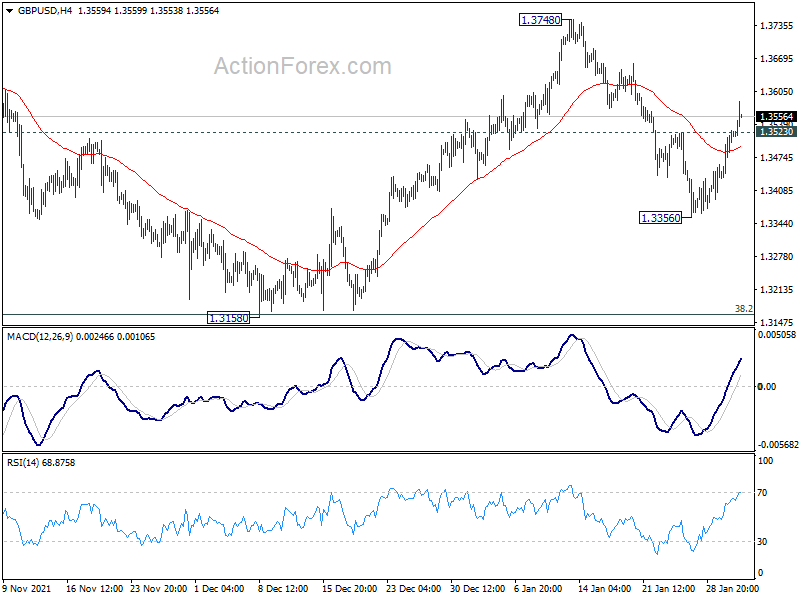
GBP/USD's break of 1.3523 minor resistance suggests that fall from 1.3748 is completed at 1.3356. Intraday bias is back on the upside for 1.3748 resistance first. Firm break there will revive the case that correction from 1.4248 has completed with three waves down to 1.3158. Further rally should then be seen through 1.3833 to retest 1.4248 high. On the downside, though, below 1.3356 will bring retest of 1.3158 low.
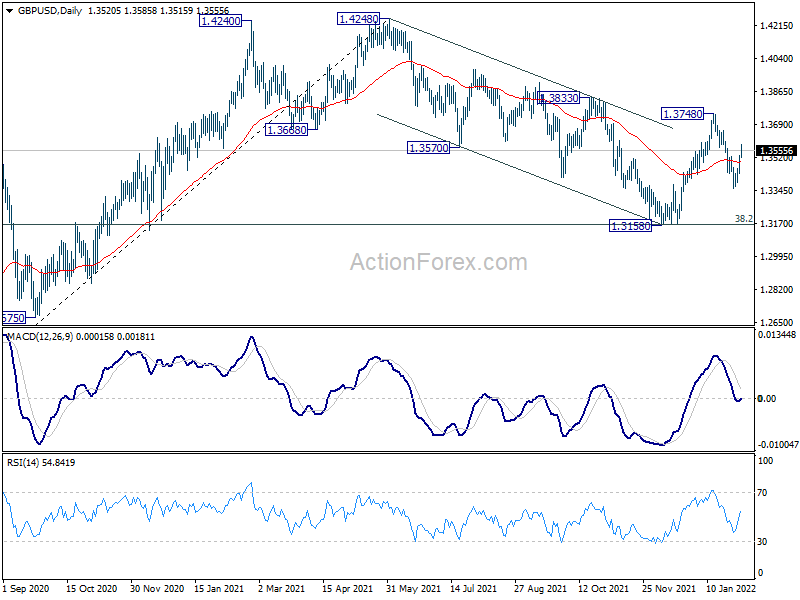
In the bigger picture, as long as 38.2% retracement of 1.1409 to 1.4248 at 1.3164 holds, up trend from 1.1409 (2020 low) is still in progress. On resumption, next target will be 38.2% retracement of 2.1161 to 1.1409 at 1.5134. Nevertheless sustained break of 1.3164 will argue that whole rise from 1.1409 has completed and bring deeper fall to 61.8% retracement at 1.2493.
EUR/USD Mid-Day Outlook
Daily Pivots: (S1) 1.1236; (P) 1.1258; (R1) 1.1294; More...
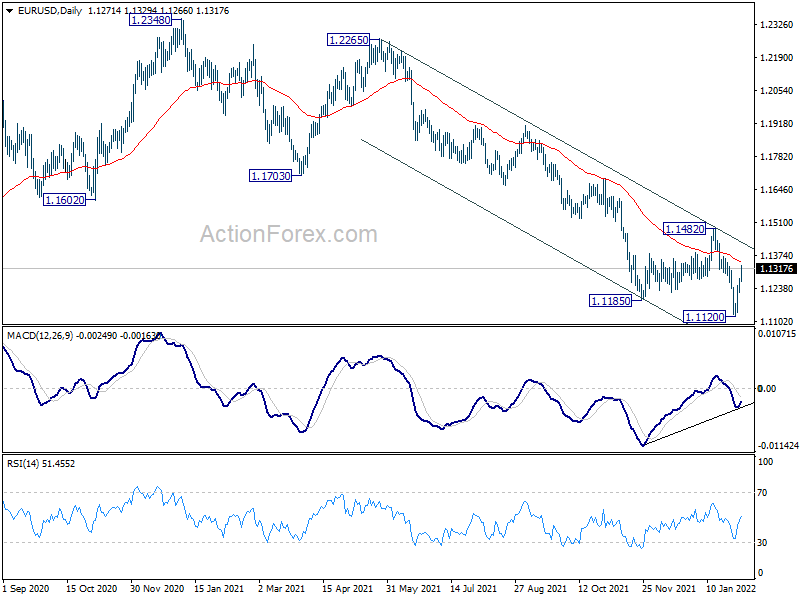
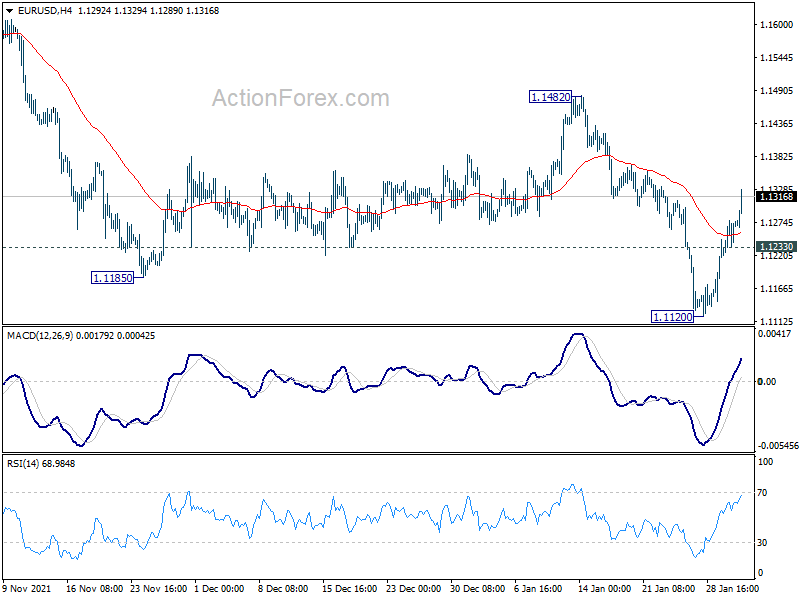
EUR/USD's break of 1.1299 minor resistance suggests that fall form 1.1482 has completed. Intraday bias is back on the upside for 1.1482 resistance first. Firm break there will argue that a medium term bottom was formed on bullish convergence condition in daily MACD. Stronger rally would then be seen back to 1.1703 support turned resistance next. On the downside, break of 1.1233 minor support will flip bias back to the downside for retesting 1.1120 low instead.
In the bigger picture, the strength of the the decline from 1.2348 (2021 high) suggests that it's not a corrective move. But still, it could be the fourth leg of a sideway pattern from 1.0339 (2017 low), or resuming long term down trend. In any case, outlook will now stay bearish as long as 1.1482 resistance holds. Next target would be 1.0635 low. However, firm break of 1.1482 will raise the chance that whole fall from 1.2348 has completed, and turn focus back to 1.1703 resistance for confirmation.