Sample Category Title
Bitcoin Testing Downtrend Resistance
Bitcoin rose 0.6% on Tuesday, ending the day around $38,700. Ethereum added 3.7%, while other leading altcoins in the top 10 are growing: from 0.5% (Binance Coin) to 12.8% (Solana). The total capitalisation of the crypto market, according to CoinGecko, rose 1.5% to $1.86 trillion overnight.
Bitcoin hit a week-and-a-half high above $39,000 on Tuesday but then pulled back, offsetting almost all of the gains. The first cryptocurrency was boosted by positive stock indexes and a weakening dollar, but sellers began taking profits on long positions.
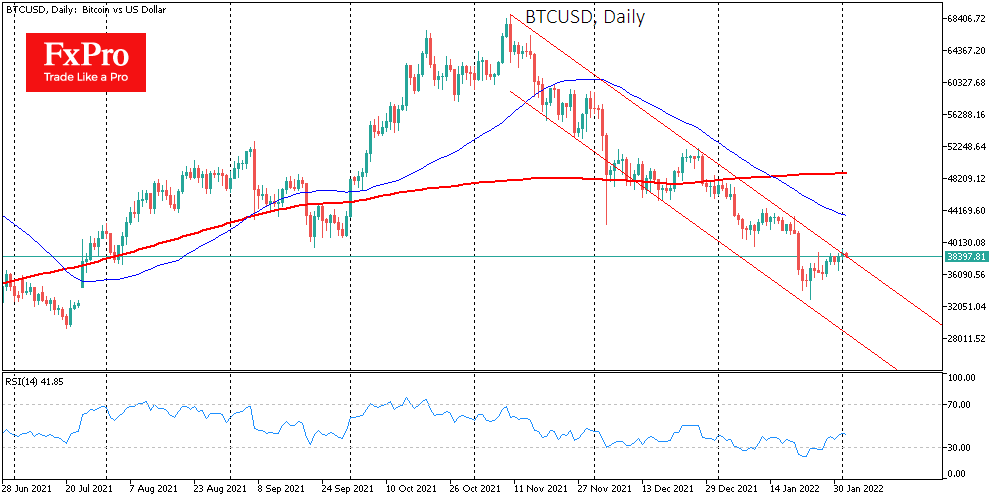
Over the last eight days, BTC gained almost 20%, recouping more than half of the failure of the second half of January, and buyers decided not to take risks. Ahead is solid psychological resistance at the circular $40,000 level, which supported the first half of January.
Technically, Bitcoin has stalled its gains as it approaches the upper boundary of the descending channel. Traders are waiting for new signals about whether the recovery in risk demand will continue or whether the latest rebound will soon be choked off. The result of this struggle will determine whether we will see a break from the downtrend or whether the downtrend will continue again.
El Salvador president Nayib Bukele is confident that bitcoin will still show tremendous growth. It’s all about the fact that there are 50 million millionaires in the world. If they wanted to buy a coin, there wouldn’t be enough for everyone, as the entire bitcoin issue wouldn’t exceed 21 million.
MicroStrategy added another 660 BTC on the recent market decline. In total, MicroStrategy already has more than 125,000 bitcoins. Russian government officials told Bloomberg that Russians own $214 billion worth of cryptocurrencies. That’s about 12% of the total crypto market capitalisation.
Eurozone CPI accelerated to new record 5.1% yoy in Jan
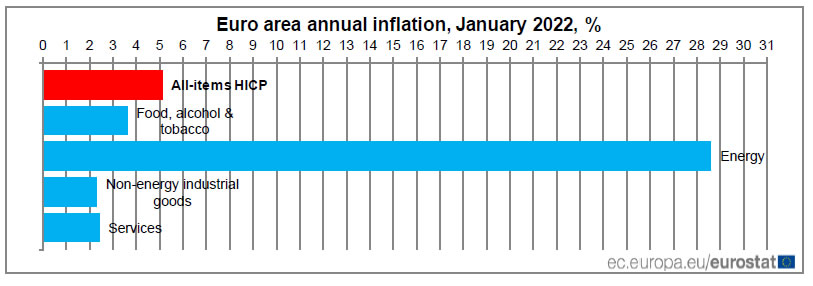
Eurozone CPI accelerated to 5.1% yoy in January, up from December 5.0% yoy, well above expectation of slowing to 4.3% yoy. That's also another record high. CPI core dropped from 2.6% yoy to 2.3% yoy, but still beat expectation of 1.9% yoy.
Energy is expected to have the highest annual rate (28.6%, compared with 25.9% in December), followed by food, alcohol & tobacco (3.6%, compared with 3.2% in December), services (2.4%, stable compared with December) and non-energy industrial goods (2.3%, compared with 2.9% in December).
Gold Slips Below 1,800 Mark as Positive Momentum Abates
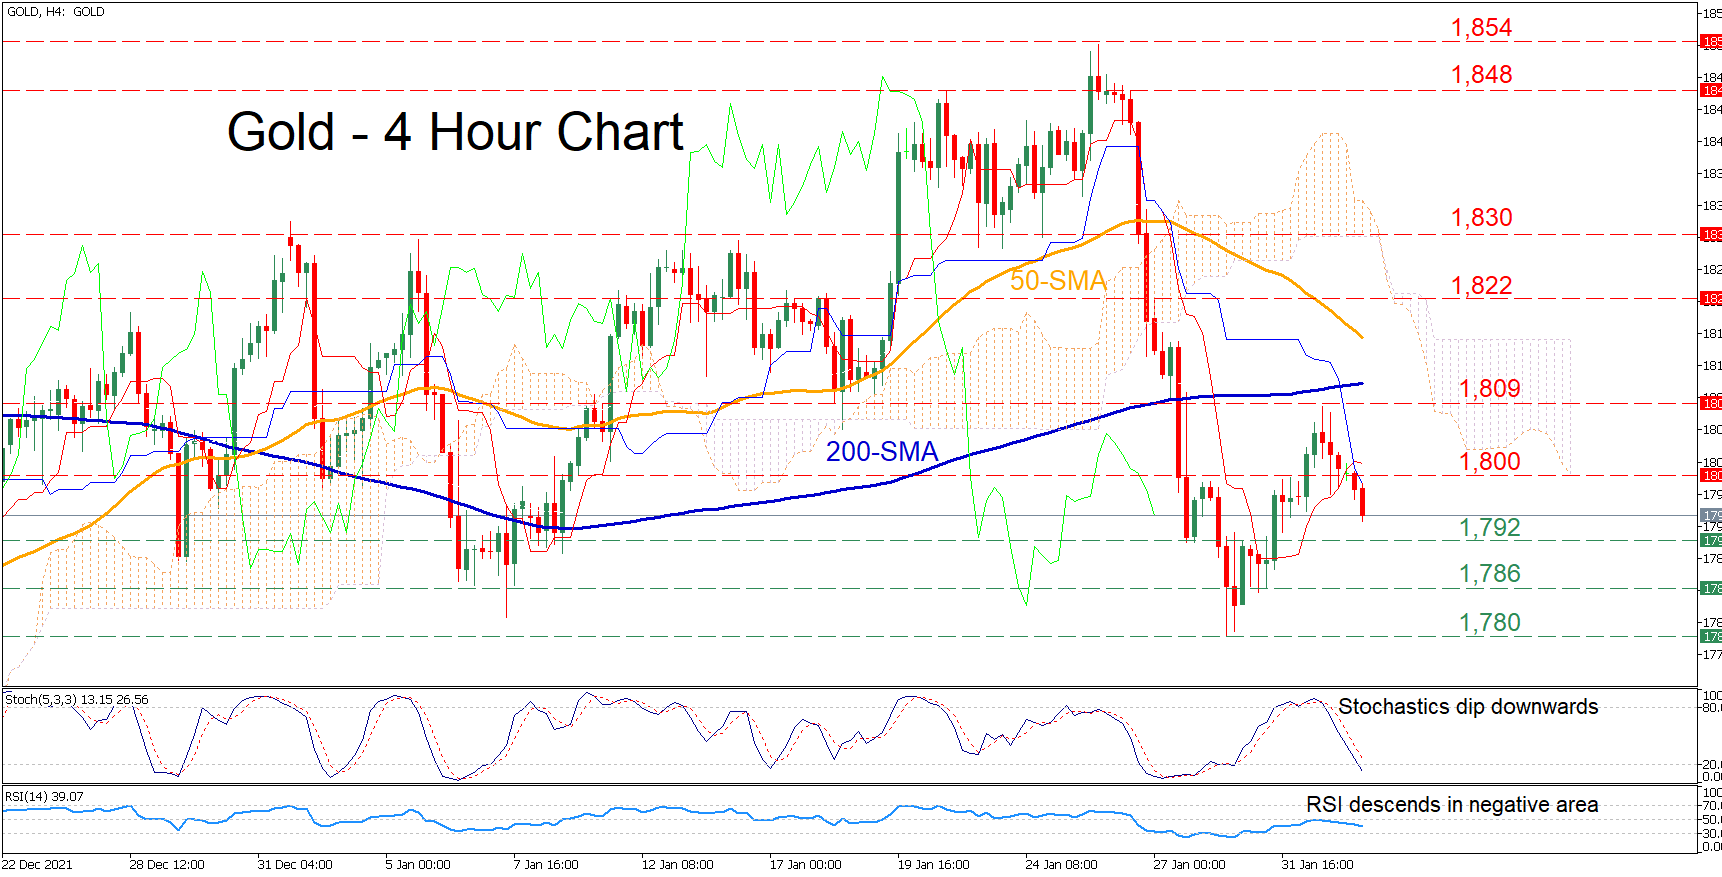
Gold has managed to stage a partial rebound after its sharp decline halted at the 1,780 region. However, the near-term picture has deteriorated again, with the bullion losing some ground in the last few four-hour sessions.
This recent pullback from 1,854 is likely to resume as momentum indicators confirm the loss of steam for the commodity. The stochastic oscillator is sloping downwards near the oversold area, while the RSI is ticking down beneath the 50-neutral mark. Moreover, the price is currently trading far below the Ichimoku cloud, endorsing the broader bearish picture for the precious metal.
Should the negative momentum intensify further, the price might dip towards the 1,792 barrier. Failing to halt there, the bears could target the 1,786 level. Violating this support point, the spotlight would turn to the January low of 1,780.
On the flipside, if buyers re-emerge and regain the upper hand, initial resistance may be encountered at the 1,800 psychological mark. Overstepping this region, the price could test 1,809 before it ascends towards the 1,822 hurdle. Higher up, further upside advances might cease at the 1,830 obstacle.
In brief, gold’s rebound seems to be in danger as the positive momentum has failed to intensify, while near-term risks remain tilted to the downside. Therefore, only a profound cross above 1,809 could signal the continuation of the short-term recovery for the precious metal.
USDJPY Declines in Ascending Channel in Near Term
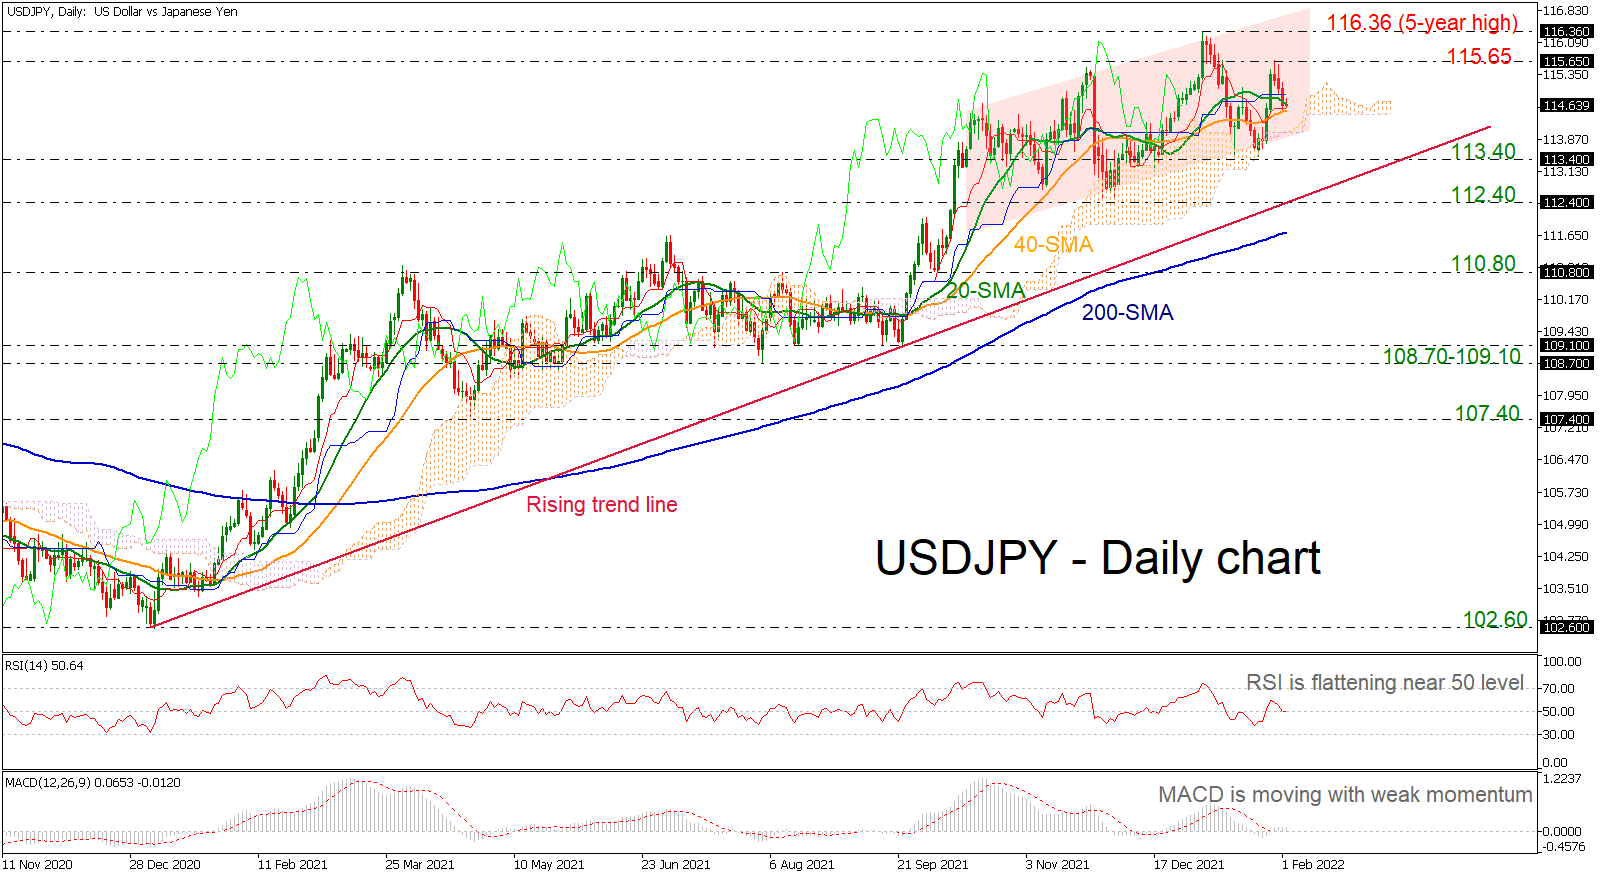
USDJPY is falling for the fourth consecutive day, meeting the 20- and 40-day simple moving averages (SMAs) following the pullback off the 115.65 resistance level.
The technical indicators are mirroring the latest weak momentum, as the RSI is flattening near its neutral threshold of 50, while the MACD is holding near its zero level. Also, the Ichimoku lines are endorsing a negative move as the red Tenkan-sen line is holding below the blue Kijun-sen line.
In case the bears continue to have the upper hand, immediate support could come from 113.40 ahead of the long-term ascending trend line near 113.00 and the 112.40 barrier. A slip beneath the uptrend line could open the door for the 200-day SMA at 111.70 and 110.80.
Alternatively, a rebound off the short-term SMAs could shift the bias to the upside, meeting 115.65 and the more-than-five-year high of 116.36. Running higher, the next stop could come from the 118.60 barrier, registered in January 2017.
All in all, USDJPY has been in a bullish tendency in the long- and short-term timeframes despite the latest descending move. Any moves below the rising trend line may shift the outlook to neutral.
Daily Technical Analysis
EUR/USD
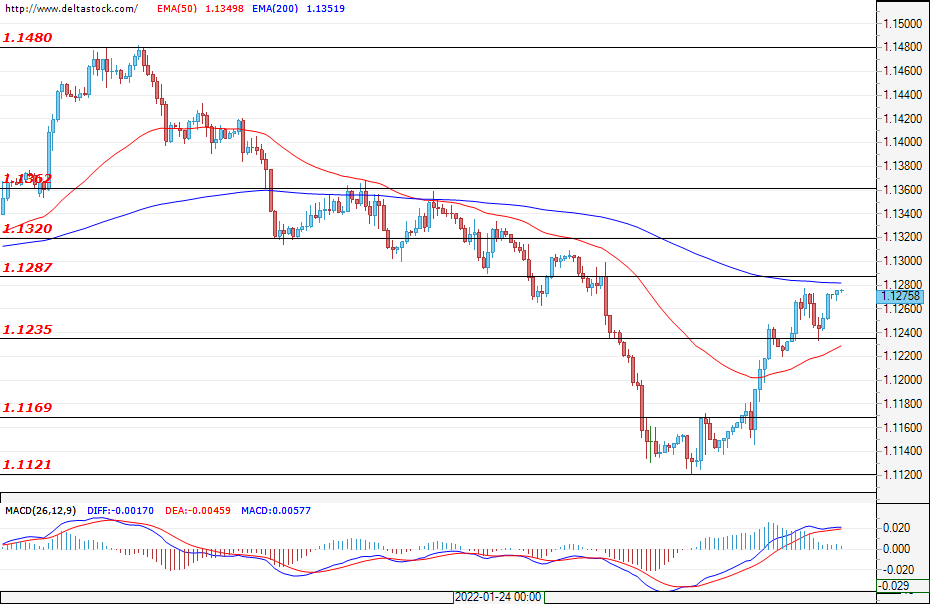
The market is in a corrective phase and the bulls are about to test the resistance at around 1.1287. The movement looks aggressive and it is possible that this area could be breached and that the next resistance zones for the buyers could become the levels of 1.1320 and 1.1360. The first support for the bulls is the zone of 1.1235 and it is possible that it will be tested again. The expectations are for the formation of a small range between 1.1235 and 1.1287. The inability of the bears to plunge prices back towards 1.1170 could possibly spark a rally towards 1.1400 and 1.1480. The trend is still negative and so rallies may not be sustainable. A reversal of market sentiment can be expected if prices hold above 1.1480. Today, an increase in activity can be expected around the announcement of the change in ADP non-farm employment for the United States at 13:15 GMT.
USD/JPY
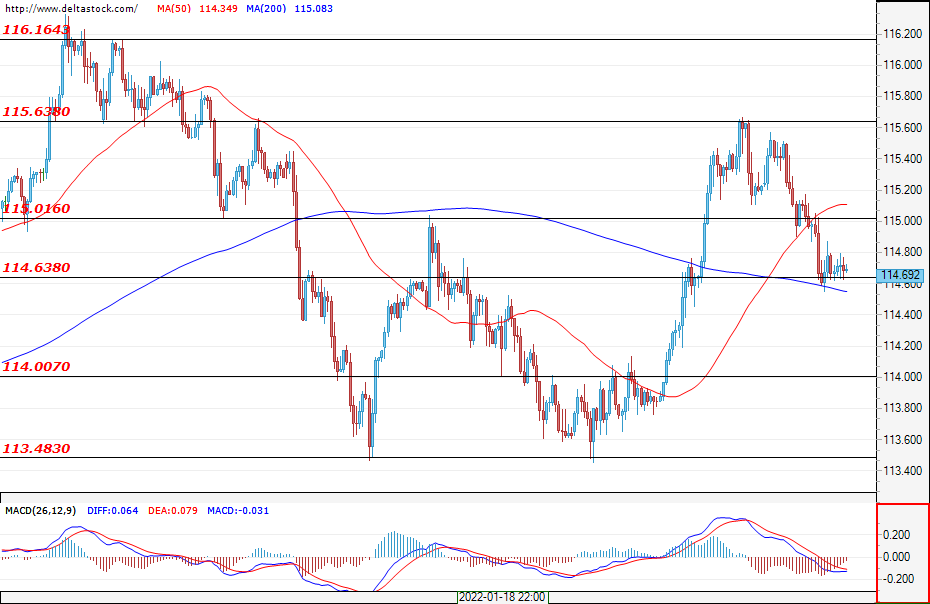
The expectations for a consolidation and the return of the bears above 115.01 were realised as the rally of the bulls was limited by the resistance at 115.63. The pair is currently hovering near the support zone at 114.63, and it is expected that it will be overtaken and that prices could head towards a test of the support at 114.00. A return of prices above 115.00 would break the pattern of continued downward movement. In such a scenario, a new test and a breach of 115.63 can be expected, as well as a possible attack on the high peak at around 116.16
GBP/USD
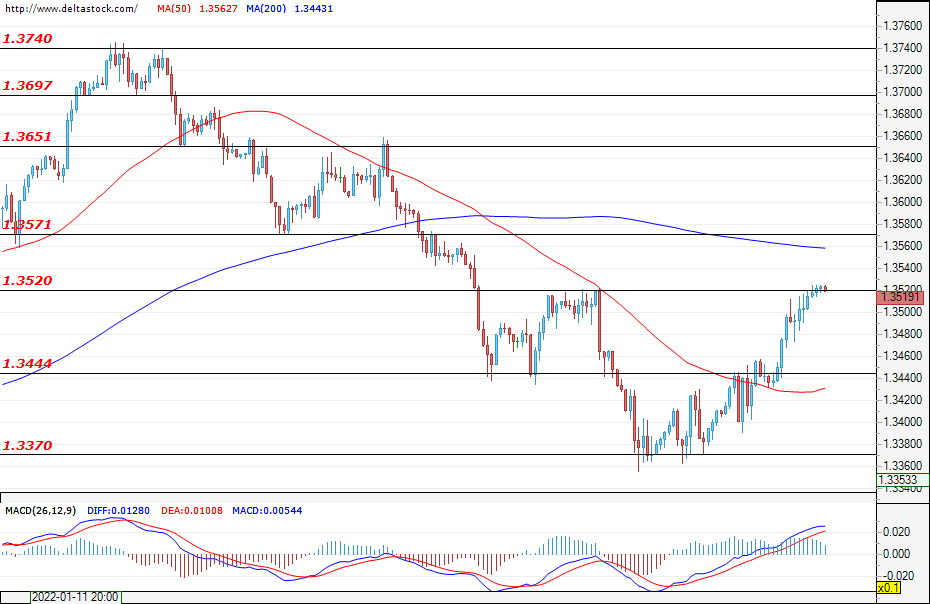
The bulls overcame the resistance at 1.3444 and managed to violate the zone at 1.3520. The downward trend is disturbed and it is possible that the direction of the movement will get reversed. A new test of 1.3444 is still not ruled out, and if the zone is confirmed, then a rally with a target of 1.3570 and even 1.3650 can be expected. In case of an unsuccessful breach of 1.3520, it is possible that the market will enter a range phase with a support level of 1.3370. The BoE is expected to announce its interest rate decision on Thursday, a raise of which is expected to favour the bulls.
EUGERMANY40
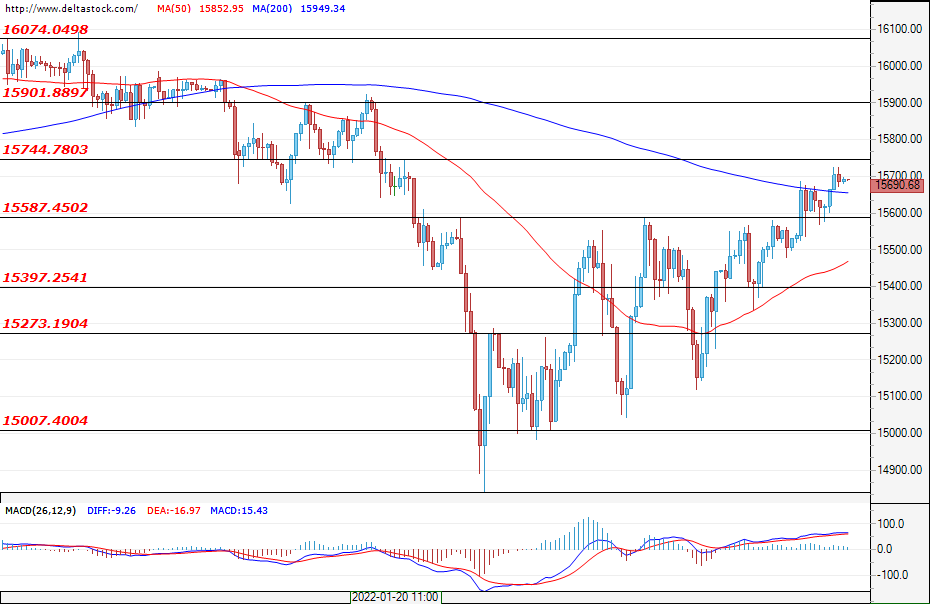
In recent days, optimism has returned to the markets and the bulls managed to overcome the key resistance at 15587. The covering of short positions gave the rally extra energy and the market is currently headed towards a test of the resistance at 15744. As the market is turning increasingly overbought, a new decline towards 15273 is possible. However, the expectations are for the dip to be bought again. The first daily support for the index is 15587, followed by 15400. If the rally continues and dashes towards 15744, then a movement towards 15900 can be expected.
US30
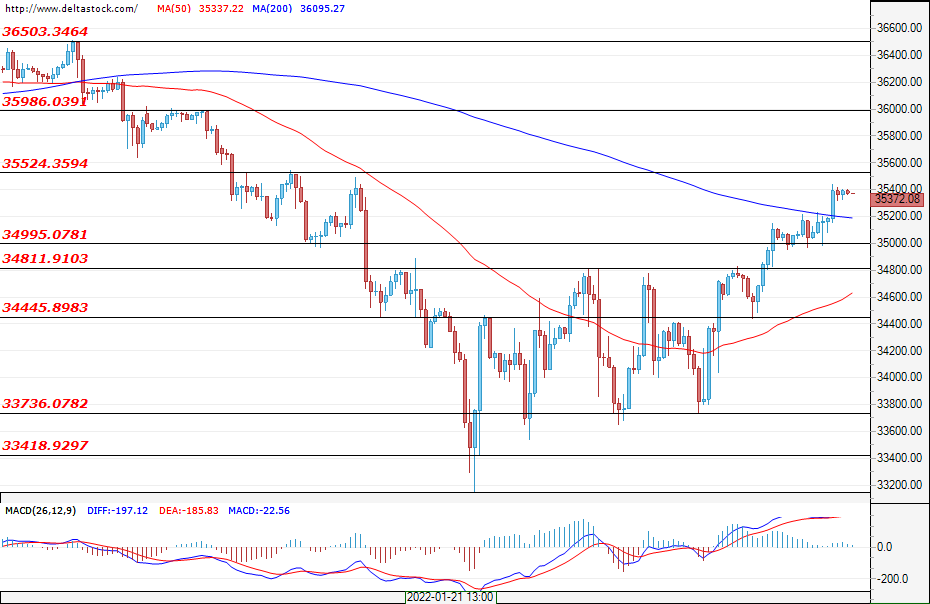
The dip was bought by investors and the breach above 34810 strengthened the positive market sentiment. The first support for the blue U.S. chips is found at 35000, but a test of 34810 is also not ruled out. The first resistance for the bulls is 35520 and a breach of this zone would open the way towards 35990. The last zone is unlikely to be breached from the first attempt, and given the stretched market, new and smaller pullbacks are not to be excluded.
NZD/USD Sees Limited Rebound
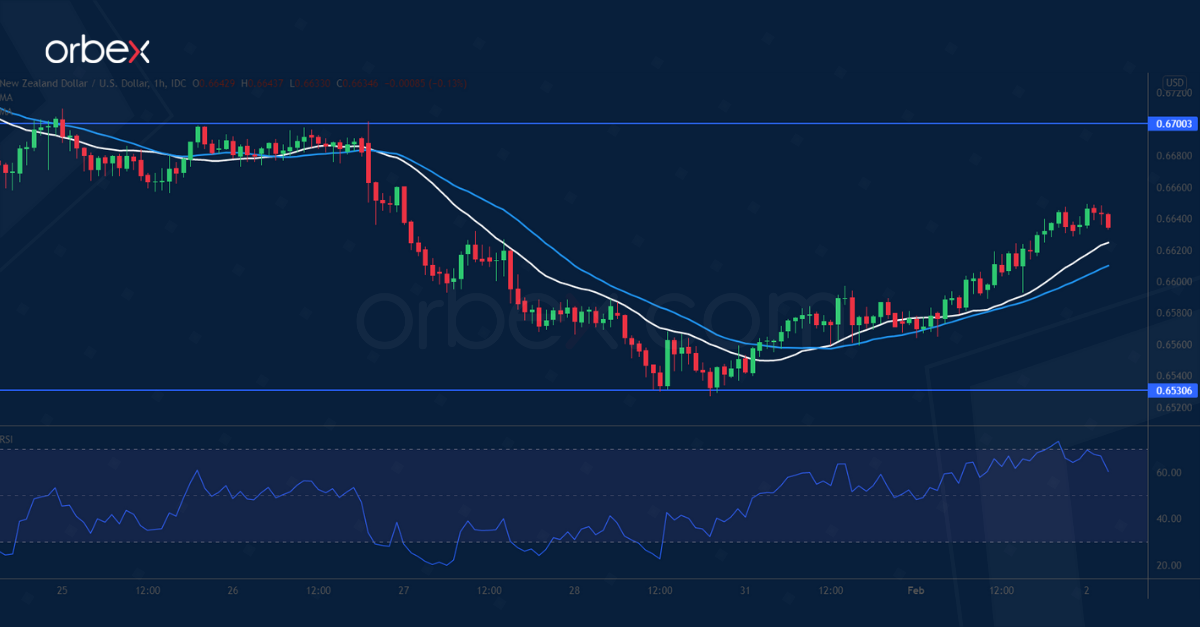
The New Zealand dollar bounced back after the Q4 jobless rate dropped to 3.2%.
The pair saw bids over September 2020’s lows around 0.6530. The RSI’s repeated oversold situation has caught bargain hunters’ attention. However, the directional bias remains bearish.
The kiwi could find resistance at 0.6700 near the 20-day moving average as trend- followers look to sell into strength. 0.6400 would be the next target if the US dollar makes a comeback across the board.
USD/CAD Tests Support
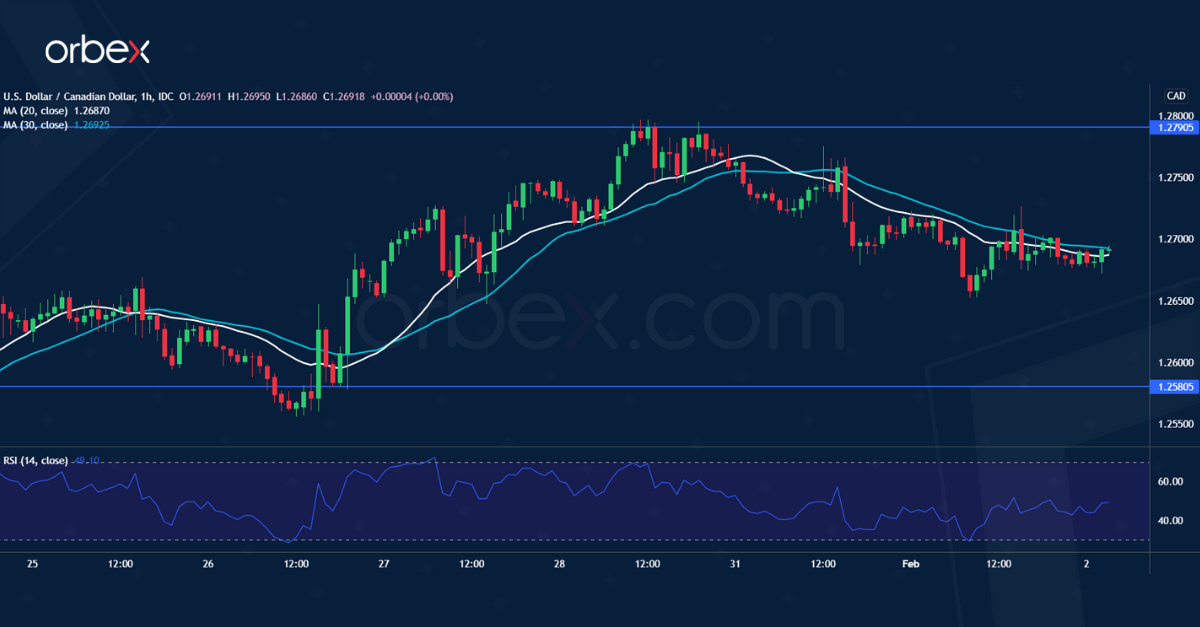
The Canadian dollar advanced after November’s GDP exceeded expectations. A break above the supply zone at 1.2730 has put the US counterpart back on track.
Nonetheless, the rally came to a halt at the daily resistance at 1.2790. The greenback needed a breather as the surge prevented buyers from chasing after volatility.
1.2580 is key support and an oversold RSI may raise buyers’ interest again. A close above the said resistance could propel the pair to December’s high at 1.2950.
AUD/USD Recoups Losses
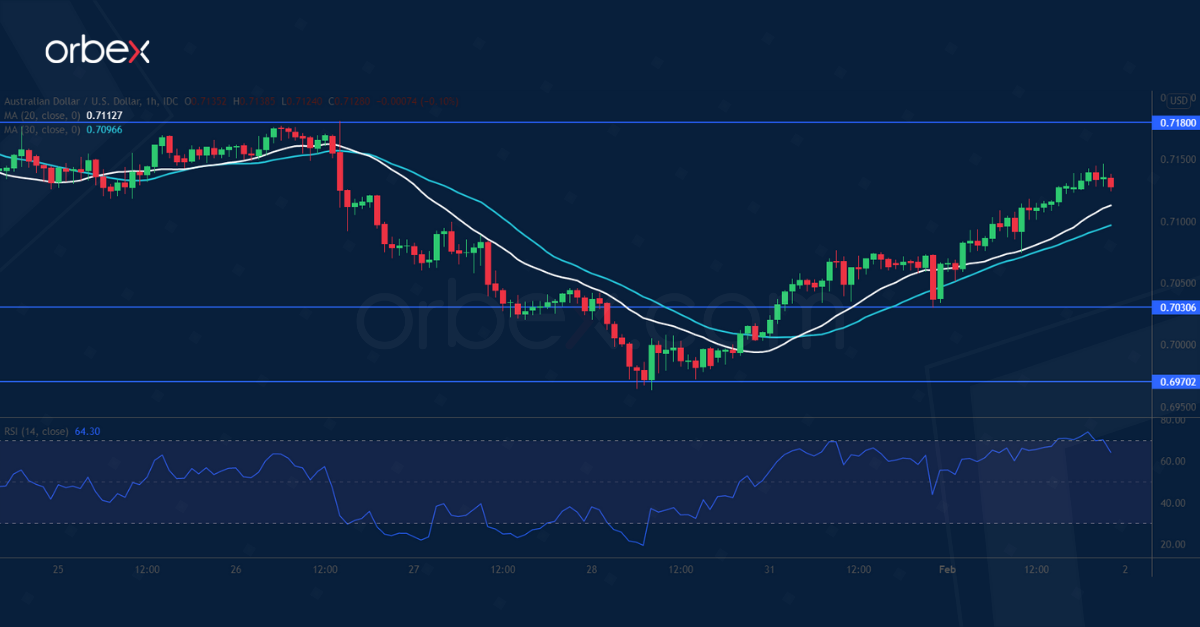
The Australian dollar recovered after the RBA signaled an end to its bond-buying program. The recent sell-off below the daily support and psychological level of 0.7000 further weighed on market sentiment. As the RSI dipped again into the oversold territory, short-term sellers’ profit-taking has driven the price higher.
The bears could be looking to fade the current rebound unless the bulls succeed in pushing past 0.7180. 0.7030 is a fresh support and 0.6970 a major floor before June 2020’s lows near 0.6800.
Dollar Traded on the Back Foot
Markets
The most interesting action occurred on German bond markets yesterday. Yields surged further north in the wake of the much smaller-than-expected HICP decline. The short end of the curve underperformed with the 2y yield gapping another 5.8 bps higher to -0.47%. It closed above the -0.50% ECB deposit rate for the first time since 2016. Yields further down the curve added 1.8 bps (5y) over 2.6 bps (10y) to 3.8 bps (30y) with new recovery highs for the former two. Economic data in the US had little impact. The manufacturing ISM came in at a strong 57.6 vs 57.5 expected and slightly down from 58.8 last month. Production and new orders eased a bit to still lofty levels while employment rose to 54.5. Prices paid advanced again after a drop in December but supplier deliveries declined for a third month straight to the lowest since November 2020, suggesting further relief on supply chains. Jolt openings (10925k) topped consensus estimates and are hovering near the all-time highs. US yield moves were limited between -1.4 bps and +1.4 bps. The 2y yield shows signs of short-term topping after the recent aggressive repositioning towards five Fed policy rate hikes for 2022. The dollar traded on the back foot, allowing EUR/USD to recover further despite a poorly shaped euro. A constructive risk setting (stocks gained about +1%) may have weighed on the greenback as well. Either way, the pair closed at 1.1272. DXY eased to 96.38. Sterling recouped half of Monday’s technical losses against the euro. EUR/GBP grinded lower to finish at 0.834.
Down Under stays in the center of attention during Asian dealings. RBA governor Lowe during a press conference elaborated on the policy decision made yesterday. He repeated that the end of QE does not imply an immediate rate hike but said it’s plausible that the policy rate goes up “later this year”. The Aussie dollar gains marginally. In New Zealand, the unemployment rate hit the lowest on record (see below). News otherwise is limited. Stocks gain 1-2% with Japan outperforming. Core bonds and FX markets are an ocean of calm.
The US ADP job report today precedes the official reading on Friday. Consensus expects omicron to have dampened employment gains to an 184k increase after the whopping 807k in December. Our (and market’s) eye will go to the European inflation figure though. Consensus was already raised from 4% to 4.4% in recent days, limiting but not completely eliminating the scope for an upward surprise after a string of individual country releases earlier. The slower-than-expected easing of inflation heaps ever more pressure on the ECB. After the recent boost, European & German yields may first want to check the outcome of the central bank meeting tomorrow. We expect the euro to stay on the sidelines for the same reason. For sterling the tone of and hints by the BoE tomorrow will be crucial. The market bar is set quite high at 5 policy rate hikes.
News Headlines
Stats NZ published Q4 New Zealand labour market data this morning. The labour market continued to show tightness witnessed in Q3 with both unemployment (3.2%; lowest since start of the series in 1986) and underutilization (9.2%) remaining low. The participation rate declined from 71.2% to 71.1%. The number of employed people remained steady in Q4 (0.1% Q/Q), but the Y/Y reading remained elevated at 3.7% thanks to the previous three quarters. Wage inflation measured by the labour cost index was 2.6% in the year to the December 2021 quarter, while average ordinary time hourly earnings rose 3.8 percent. The private sector experienced stronger wage growth than the public sector in Q4. The kiwi dollar didn’t react to the data, but made a welcome rebound in yesterday’s positive risk climate. NZD/USD trades around 0.6635, up one big figure from last week’s sell-off low.
A survey by the British Retail Consortium showed that shop prices rose by 1.5% Y/Y in January (0.1% M/M), up from 0.8% Y/Y in December and the fastest pace since December 2012. Food prices increased by 0.3% M/M to be up 2.7% Y/Y (from 2.4%), reflecting poor harvests, labour shortages and rising global food prices. Non-food prices rose fell by 0.3% M/M, but were up 0.9% Y/Y (from -0.2%). Exceptionally high demand for furniture and flooring stood out.
Crude Oil Price Steady ahead of February OPEC+ Meeting
The Dow Jones, S&P 500, and Nasdaq 100 indices tilted higher after positive corporate results. On Tuesday, UBS reported that 2021 was its best year in over 15 years as the wealth management segment performed well. In the US, ExxonMobil announced strong results, helped by rising oil and gas prices. The firm made a profit of $8.9 billion, beating the consensus estimate of $8.4 billion. It will launch a $10 billion buyback program. Its annual profit came in at over $23 billion. Alphabet, the parent company of Google and Android announced strong results, helped by strong ad and cloud revenue.
The US dollar eased against most currencies after strong economic numbers from the US. According to Markit, the manufacturing PMI came in at 54.5 in January, which was a better performance than the median estimate of 53.5. On the other hand, data by the Institute of Supply Management (ISM) showed that the PMI rose to 57.6 in January. The strong performance was mostly because of the rising demand from both local and international buyers. Most manufacturers complaint about the rising cost of doing business. Later today, the currency will react to the latest ADP jobs data.
The euro rose against the US dollar and sterling after strong Eurozone jobs and manufacturing PMI data. According to Eurostat, the bloc’s unemployment rate declined to a record low of 7.0% in December. That was a sign that the European recovery is doing better than estimated. Later today, the currency will react to the preliminary inflation data for February. Analysts expect the data to show that consumer prices dropped to 4.4% in January from 5.0% in December.
XBRUSD
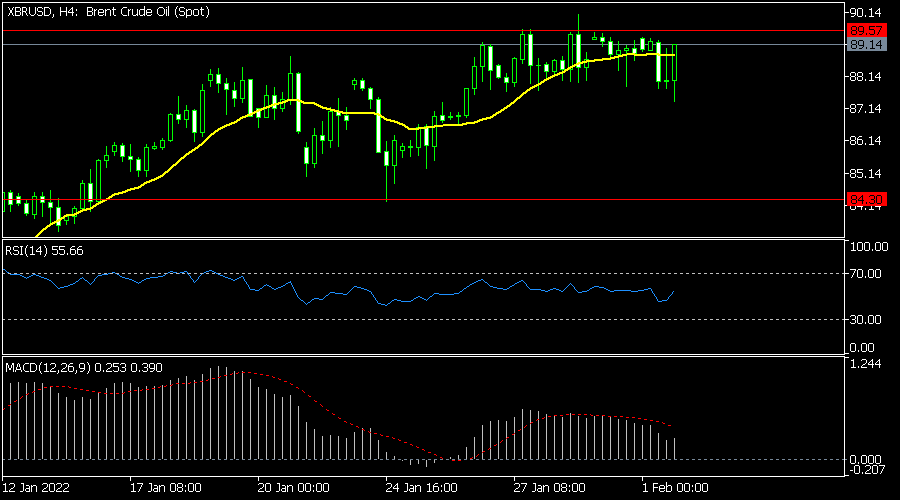
The XBRUSD pair held steady as investors refocused on the upcoming OPEC meeting. There is chatter that the cartel will agree to gradually increase production considering that demand is rising globally. The pair is trading at 88.95, which is slightly below this year's high of 90. It is along the 25-day moving average while the MACD and the Relative Strength Index (RSI) are at a neutral level. Therefore, the pair will likely have a bullish break-out later this week.
EURUSD
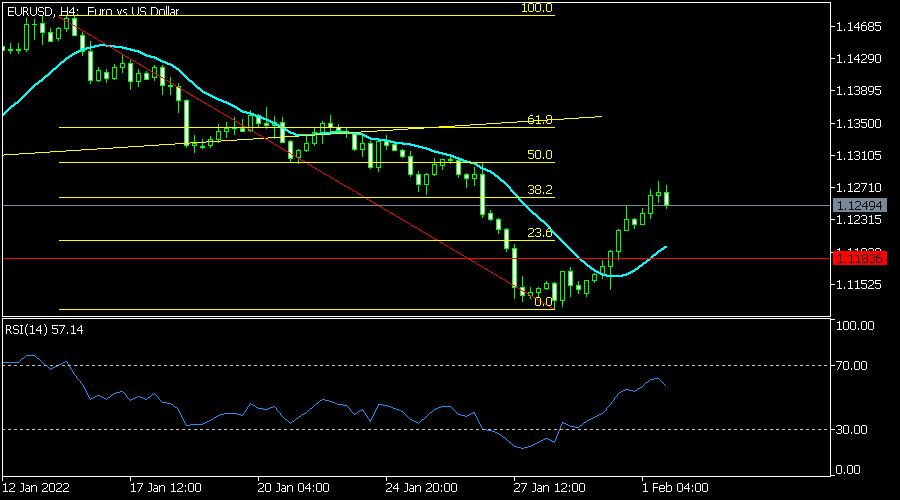
The EURUSD pair rose to a high of 1.1280, which was the highest level since January 27. On the four-hour chart, the price is slightly below the 38.2% Fibonacci retracement level. It is also slightly above the 25-day moving average while the Relative Strength Index (RSI) has been rising. Therefore, the pair will likely keep rising as bulls target the next key resistance at 1.1300.
XAUUSD
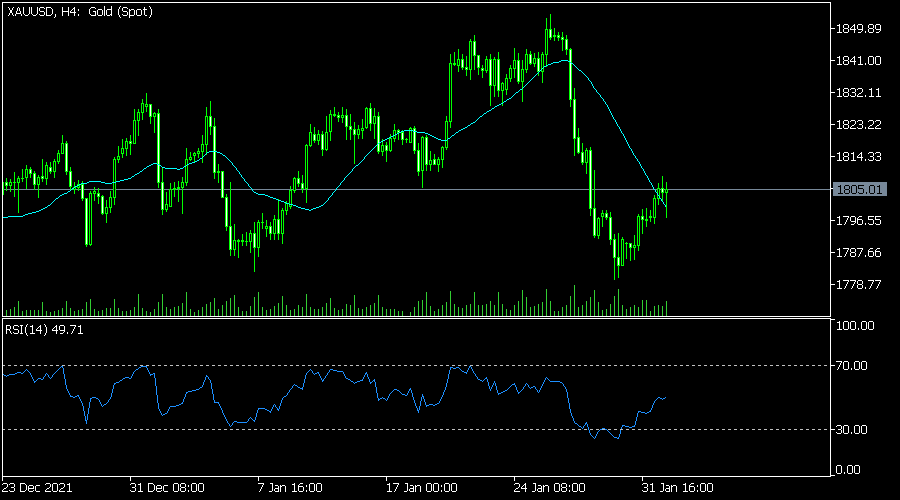
XAUUSD pair held steady as gold attempted to make a comeback. The pair is trading at 1,803, which is higher than this week's low of 1,780. On the four-hour chart, the pair is slightly above the 38.2% Fibonacci retracement level. It has also formed what looks like a bearish flag pattern while the Relative Strength Index (RSI) has moved slightly above the oversold level. Therefore, the pair will likely keep rising ahead of US jobs data.