Sample Category Title
US Dollar Index Moves Sideways ahead of US Retail Sales Data
US stocks wavered on Thursday ahead of the earnings season that kicks off today. The Dow Jones rose by over 100 points while the tech-heavy Nasdaq 100 index declined by about 80 points. The key companies that will publish their results today are Wells Fargo, Blackrock, Citigroup, JP Morgan, and First Republic. Analysts believe that most of these companies will publish strong results. For example, the median estimate is that JP Morgan’s revenue jumped to $29 billion while Citi and Blackrock had over $17 billion and $5 billion, respectively.
The US dollar moved sideways as investors reacted to the latest initial jobless claims and producer inflation data from the US. Data by the statistics agency showed that the headline producer price index (PPI) data declined from 9.8% in November to 9.7% in December. This decline was weaker than the median estimate of 9.9%. The core CPI, which excludes the volatile food and energy prices, rose from 7.9% to 8.3%, respectively. These numbers came a day after numbers revealed that consumer inflation rose to the highest level since 1982. Later today, the US will publish the latest retail sales numbers.
The British pound held steady against the US dollar ahead of the upcoming data dump from the UK. The Office of National Statistics (ONS) will publish the first GDP numbers of the year. Economists will be looking at the trends in the UK economy in the final months of 2021. The ONS will also publish the latest industrial and manufacturing production numbers from the UK. Economists polled by Reuters expect the data to show that manufacturing production declined from 1.3% in October to -0.3% in November. They also expect that industrial production declined to 0.5% because of fears over covid-19.
GBPUSD
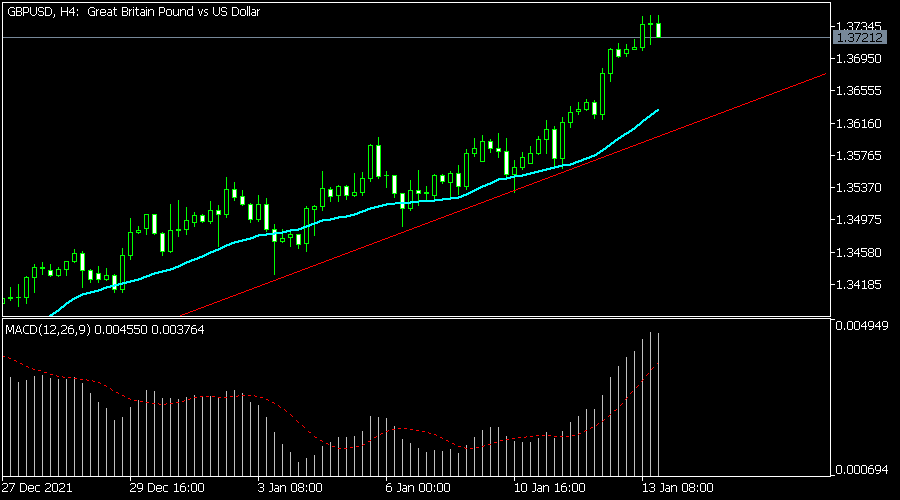
The GBPUSD pair has been in a strong bullish trend in the past few weeks. It is trading at a multi-month high of 1.3731, which is substantially higher than the December low of 1.3170. On the four-hour chart, the pair has moved above the 25-day and 50-day moving averages and the ascending red trendline. Oscillators like the Relative Strength Index (RSI) and the Stochastic have also been rising. Therefore, the pair will likely keep rising later today.
EURUSD
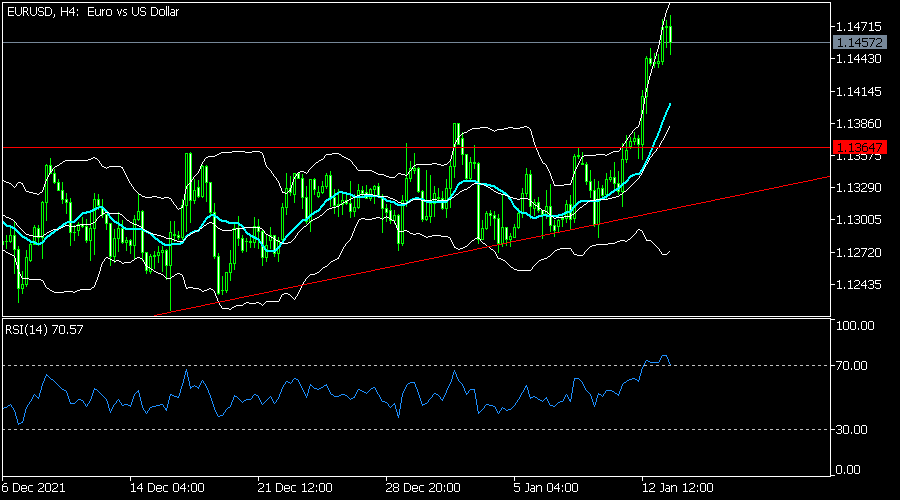
The EURUSD pair retreated slightly in the overnight session. The pair is trading at 1.1450, which is slightly lower than Thursday’s high of 1.1480. The pair is slightly below the key resistance at 1.1500, which is the 61.8% Fibonacci retracement level. It is also slightly below the upper side of the Bollinger Bands. Therefore, the pair will likely resume the bullish trend as bulls target the key resistance at 1.1500.
EURCHF
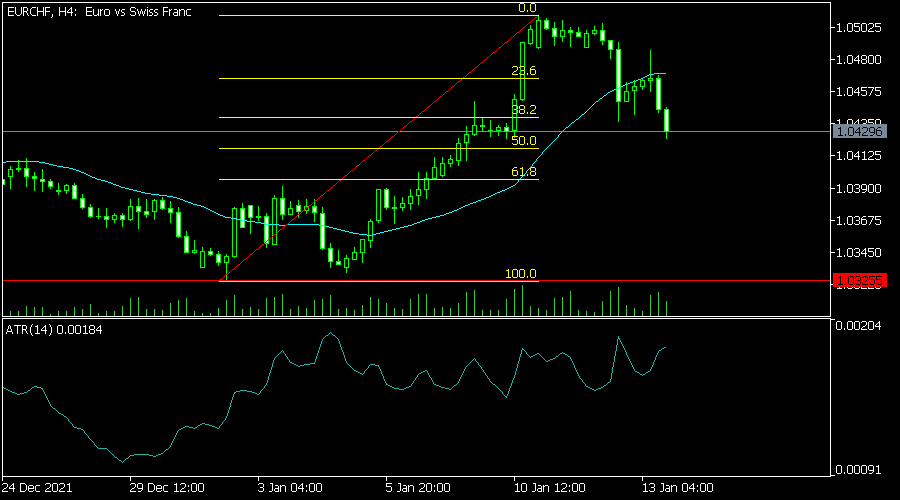
The EURCHF pair declined to a low of 1.0430, which was the lowest level since January 10. This price is below this year’s high of 1.0512. It moved below the 25-day and 50-day moving averages. It is also between the 50% and 38.2% Fibonacci retracement levels. Therefore, the pair will likely keep falling as bears target the key support at 1.0400.
Will Earnings Reverse the Fed-Induced Pessimism?
Optimism about a less dovish speech from the Federal Reserve (Fed) Chair Jerome Powell and a ‘not higher than expected inflation print earlier this week remained rather short-lived, as other FOMC officials didn’t beat about the bush and hinted at an imminent rate hike in the US.
Rate-sensitive Nasdaq fell the most among the major US indices, as losses in the Dow Jones, which is believed to be better equipped to cope with higher rates remained limited.
The US 2-year yield consolidates a touch above the 0.90% mark, and no matter how aggressive the hawkish Fed pricing has been, the yield will likely advance above the 1% soon, and we will see more flattening across the curve.
In the FX, one would’ve expected the US dollar to recover on the back of a series of hawkish comments from the Fed officials, but the dollar index continued to move lower. It looks like the dollar bulls are out of breath and the bearish trend could further develop despite the clear hawkish shift in Fed expectations. The DXY is now preparing to test an important support band between 94 and 94.60, including the 100-DMA, and the major 38.2% Fibonacci retracement on May – December rally. Moving below the 94 mark should hint at a medium-term bearish reversal in the dollar index.
Investor attention shifts from macro data to corporate earnings as a couple of big banks are due to release their Q4 earnings today, including JP Morgan, Wells Fargo, BlackRock and Citigroup. There is no doubt that financials will benefit from a rising interest rate environment. Banks already outperformed the S&P500 last year and the trend is expected to continue throughout this year. And of course, the earlier and steeper rate expectations are a boon for the bank earnings expectations. But, expectations on bank earnings got quite high, which means that they now must live up to these strong expectations to keep the rally going. Therefore, if we see anything less than amazing in the big bank results, the wind could rapidly change direction. So, the risk is, even shiny results could result in price pullbacks.
On the other hand, good earnings are the only thing that could clear investors’ heads from the Fed-induced bearish thoughts.
Monetary Policy Tightening Focus
Market movers today
Today is the last day that the Fed can send any signals ahead of the January meeting, as the blackout period starts tomorrow. With the Fed signalling increasing support for a March rate hike and the beginning of quantitative tightening later this year, we are not sure we will hear any significant new signals from the Fed today.
This morning, we receive UK monthly GDP for November. We expect the indicator to show that the recovery continued.
In Sweden, we expect December headline CPIF and core CPIF excl. Energy to print 1.3 % mom/4.2 % yoy and 0.5 % mom/1.8 % yoy respectively. This is in line with market consensus. While the former is way above Riksbank's forecast (due to soaring electricity prices) the latter is just slightly higher. The Riksbank Governor Ingves will also speak about the economy, however, we don't expect any new signals.
In the US, retail sales, industrial production and preliminary consumer confidence from the University of Michigan are due out in the afternoon.
The next steps in the conflict between Russia and the West will be in focus after the two sides ended talks this week without a breakthrough. This morning we published a note outlining the economic and financial market implications of the different outcomes of the conflict, see Research Russia - Expect serious market disruptions if a war breaks out.
The 60 second overview
Markets: The clear theme in markets remains the adjustment to higher global yields as monetary policy makers begin tightening liquidity conditions. In equity markets duration sensitive growth stocks have taken a hit and yesterday the technology heavy Nasdaq lost 2.5%. So far this year the rotation into value-sectors has kept overall risk appetite afloat, yet this morning we also see some of the value-outperforming indices and futures trading in red. The rise in commodity prices is also taking a breather and the USD continues to trade on the back foot.
Fed: FOMC board members continue to talk up expectations for monetary policy tightening as we head into the blackout period that starts tomorrow. Over the last 24 hours we have heard calls for policy normalisation likely starting in March from Brainard, Harker, Evans and Waller. Interestingly, Waller - who has been one of the first to verbally guide markets in a more hawkish direction - even mentioned the potential for five hikes this year albeit he stated that three hikes this year is still a "good baseline". Waller also stated that he does not favour a 50bp hike at the meeting in March and that quantitative tightening could start this summer.
Bank of Korea: Tighter global monetary conditions remain a key theme for 2022 and this morning Bank of Korea hiked policy rates for the third time since August. That brings the key policy rate to 1.25% - the same levels as prior to the COVID-19 crisis. At the press conference Governor Lee reiterated that policy remains accommodative and that policy like has to be tightened further in 2022.
Bank of Japan: This morning a news story from Reuters get attention as its sources from the Japanese central bank report that the central bank is brainstorming how to signal interest rate hikes to markets before inflation hits 2% - albeit likely not before 2023. The story report that the swift move from the Fed, the weakening the pressure on the JPY and general public discontent with rising living costs are the primary drivers behind talks of an exit plan.
Russia-West talks: Diplomatic optimism has faded fast after the Russian foreign minister said that Russia and the West remain far apart in talks about Ukraine and NATO's role in Eastern European countries. The Russian side went as long as saying that if they don't hear a constructive response from the West within a reasonable timeframe then Russia will have to act to eliminate threats to its national security. White House national security advisor Sullivan says that the threat of a Russian invasion of Ukraine is "high" and there are no dates set for any more talks. Recent events has left RUB as the clear underperformer in FX space with USD/RUB rising 2.5% in yesterday's session.
Equities: Sector performance reversed again on Thursday. Growth lagged value, with tech and health care among the losers. Valuation was key, fundamentals secondary; most evident in the semi space that sold off despite Q4 earnings beats. S&P 500 -1.4%, Nasdaq -2.5%, Dow -0.5%, and Russell 2000 -0.8%. Asian markets are following the move lower this morning, while US futures have stabilized.
FX: FX markets calmed down yesterday after big moves seen on Wednesday. JPY and CHF gained vis-à-vis CAD and NOK, but overall no moves stuck out. EUR/USD still trades above 1.14, while EUR/NOK rebounded towards 10.00.
Credit: Synthetic indices continued their widening trend yesterday. The negative mood was due to a combination of higher focus on geopolitical risks in relation to Russia and still high primary activity. This was partly balanced by slightly lower rates. Overall iTraxx Main widened 1.1bp to 51.2bp while Xover drifted some 4.9bp to 253.9bp. The secondary liquidity in cash space was very low, but on screen indications IG cash widened 0.9bp while HY widened 0.2bp.
Nordic macro
In Sweden, December inflation figures will be relased. We expect headline CPIF and core CPIF excl. Energy to print 1.3 % mom/4.2 % yoy and 0.5 % mom/1.8 % yoy respectively. This is in line with market consensus. While the former is way above Riksbank's forecast (due to soaring electricity prices) the latter is just slightly higher. Looking forward, January electricity prices have so far dropped some 30 %, hence, there will most likely be a partial correction at the start of this year.
GBP/JPY Daily Outlook
Daily Pivots: (S1) 156.07; (P) 156.76; (R1) 157.21; More...
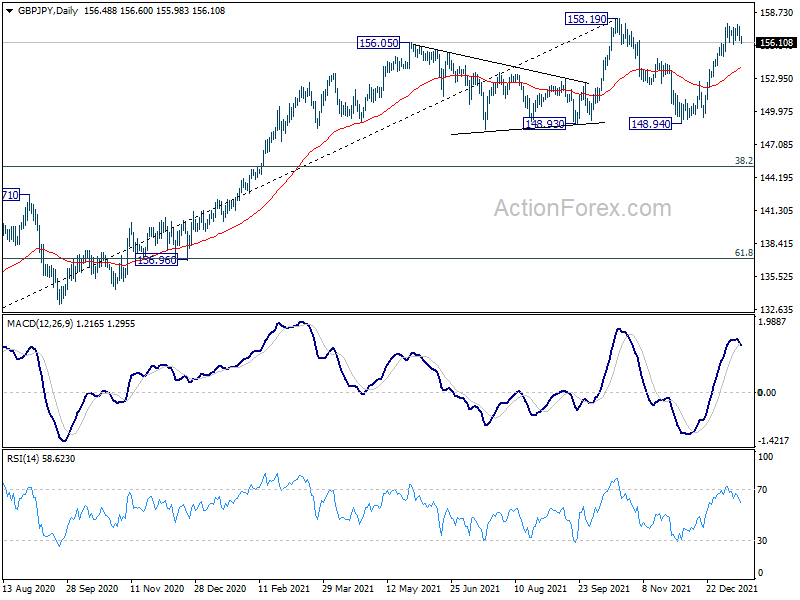
Intraday bias in GBP/JPY remains neutral for consolidation below 157.74. Further rally is expected with 154.86 support intact. On the upside, decisive break of 158.19 high will resume larger up trend to 167.93 long term fibonacci level. On the downside, below 154.86 minor support will turn intraday bias back to the downside for deeper pull back.
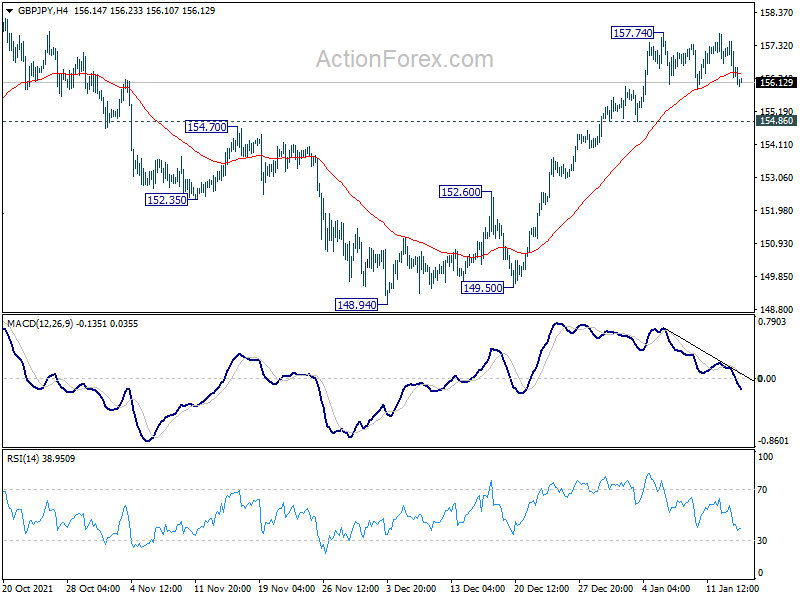
In the bigger picture, strong rebound from 148.93 key structural support retains medium term bullishness. Firm break of 158.19 high will resume whole up trend from 123.94 (2020 low), to 61.8% retracement of 195.86 to 122.75 at 167.93. Nevertheless, firm break of 148.93 will bring deeper correction to 38.2% retracement of 123.94 to 158.19 at 145.10, and possibly further lower, as a correction to up trend from 123.94 at least.
EUR/JPY Daily Outlook
Daily Pivots: (S1) 130.45; (P) 130.94; (R1) 131.27; More....
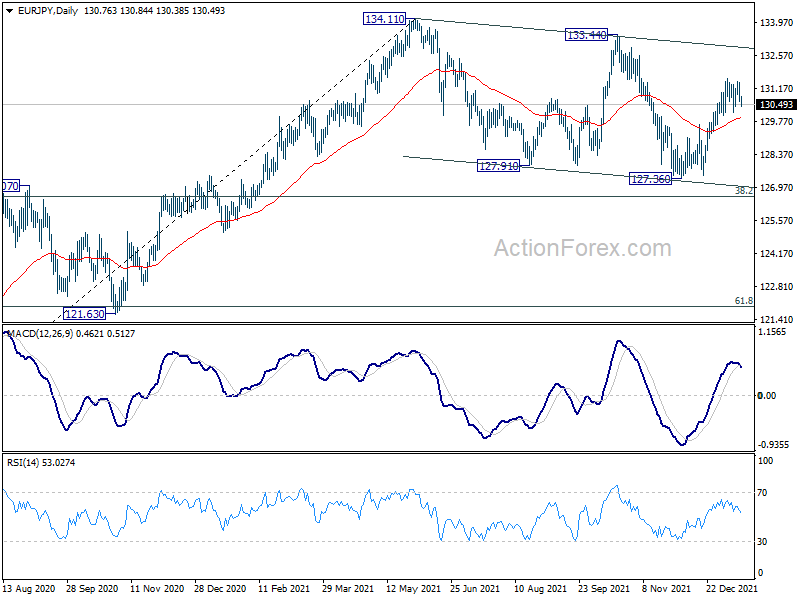
Intraday bias in EUR/JPY remains neutral as consolidation from 131.59 is still extending. Further rise is expected with 130.01 support intact. Whole consolidation from 134.11 could have completed with three waves down to 127.36, ahead of 126.58 medium term fibonacci level. Break of 131.59 will target a test on 133.44/134.11 resistance zone. On the downside, break of 130.01 minor support will turn bias bias to the downside for retesting 127.36 low instead.
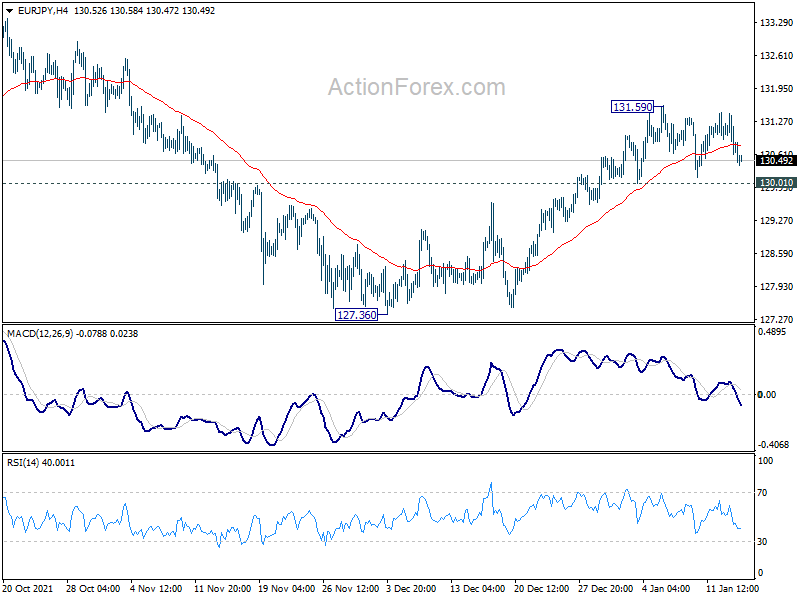
In the bigger picture, as long as 38.2% retracement of 114.42 (2020 low) to 134.11 at 126.58 holds, up trend from 114.42 is still in favor to continue. Break of 134.11 will target long term resistance at 137.49 (2018 high). However, sustained break of 126.58 will raise the chance of medium term bearish reversal. In this case, deeper decline would be seen to 61.8% retracement at 121.94, and possibly below.
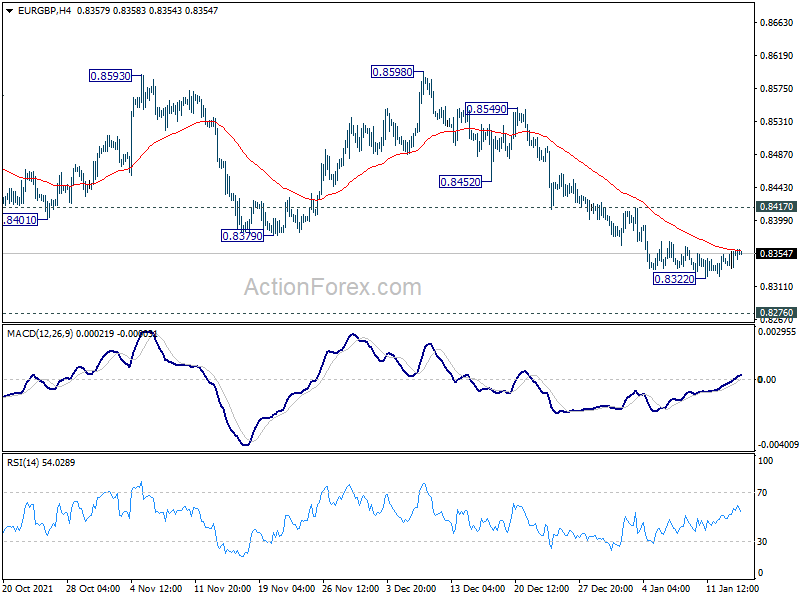
EUR/GBP Daily Outlook
Daily Pivots: (S1) 0.8342; (P) 0.8351; (R1) 0.8365; More...
Intraday bias in EUR/GBP stays neutral for consolidation above 0.8322 temporary low. In any case, outlook will stay bearish as long as 0.8417 resistance holds. Below 0.8322 will resume recent down trend to 0.8276 key long term support. On the upside, above 0.8417 will turn bias back to the upside for stronger rebound.
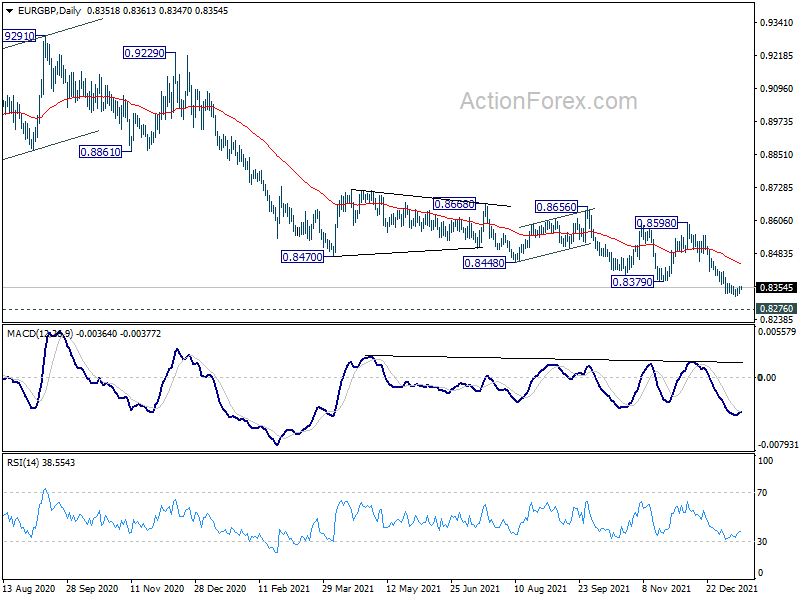
In the bigger picture, price actions from 0.9499 (2020 high) are still seen as developing into a corrective pattern. Deeper fall could be seen as long as 0.8598 resistance holds, towards long term support at 0.8276. We'd look for bottoming signal around there to bring reversal. Meanwhile, firm break of 0.8598 will now be an early sign of medium term bottoming and bring stronger rebound. However, sustained break of 0.8276 will argue that the long term trend has reversed.
EUR/AUD Daily Outlook
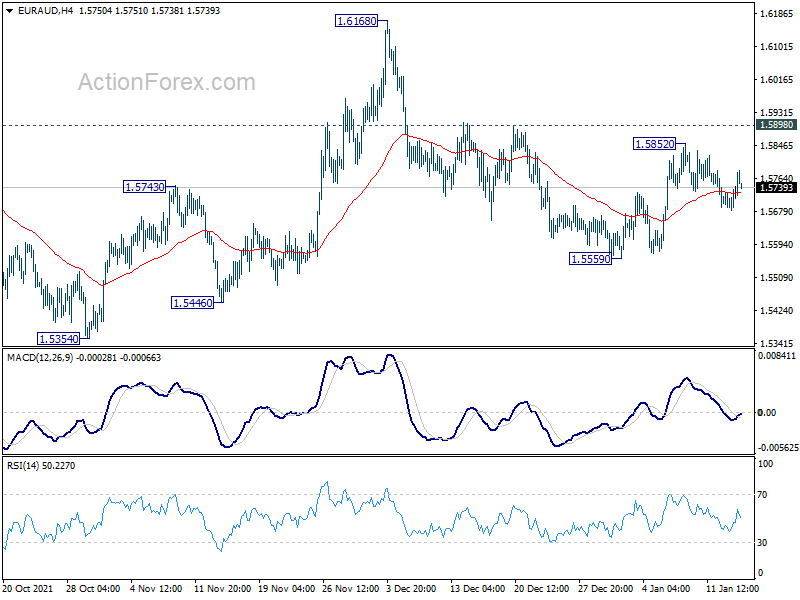
Daily Pivots: (S1) 1.5697; (P) 1.5720; (R1) 1.5758; More...
Intraday bias in EUR/AUD remains neutral as range trading continues. On the downside, break of 1.5559 will resume the fall from 1.6168 to retest 1.5250/5354 support zone. On the upside, however, break of 1.5898 will argue that pull back form 1.6168 has completed. Intraday bias will be back to the upside for 1.6168 resistance.
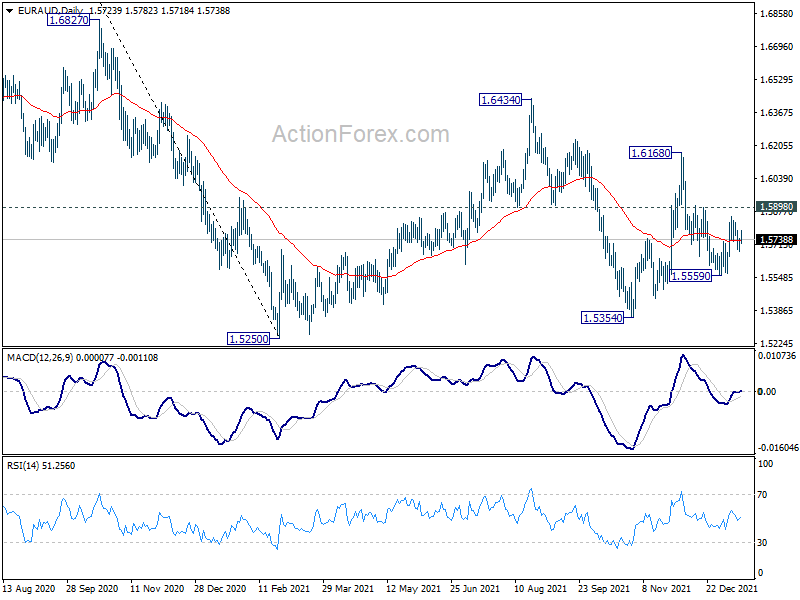
In the bigger picture, rise from 1.5354 is seen as the third leg of the corrective pattern from 1.5250 low. Further rise cannot be ruled out, but even in that case, strong resistance should be seen at 38.2% retracement of 1.9799 to 1.5250 at 1.6988. Larger down trend from 1.9799 is in favor to extend through 1.5250 at a later stage.
EUR/CHF Daily Outlook
Daily Pivots: (S1) 1.0414; (P) 1.0451; (R1) 1.0476; More....
Intraday bias in EUR/CHF remains neutral for the moment. Corrective rebound from 1.0342 could extend higher. But strong resistance should be seen from 38.2% retracement of 1.0936 to 1.0324 at 1.0558 to limit upside. On the downside, below 1.0423 minor support will turn bias back to the downside for retesting 1.0324 low. Break there will resume larger down trend from 1.1149.
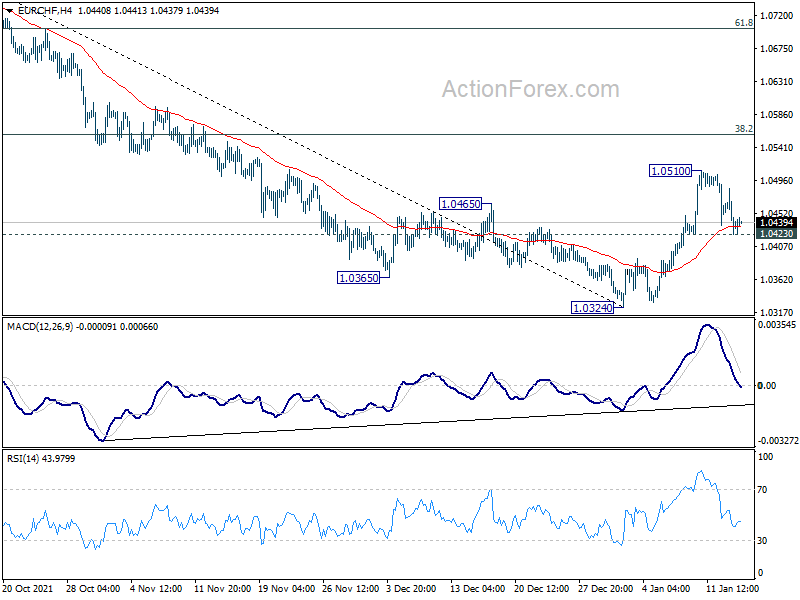
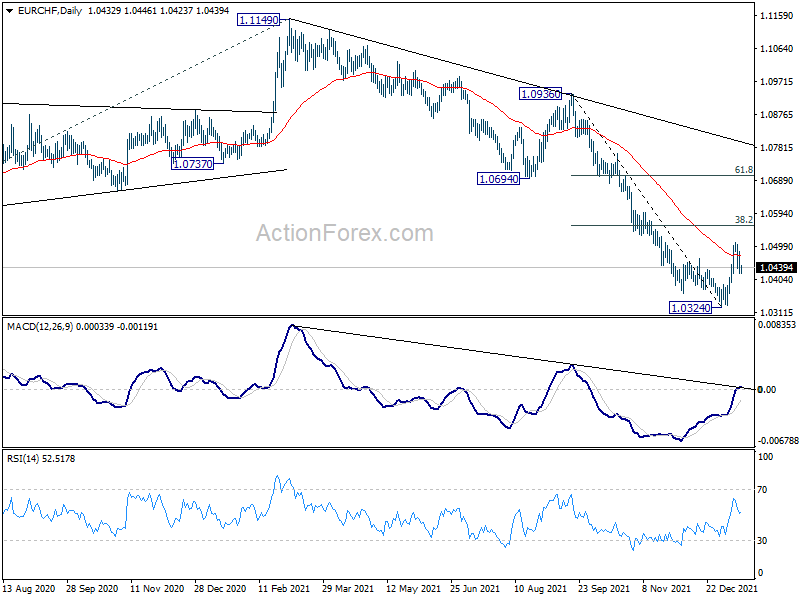
In the bigger picture, long term down trend from 1.2004 (2018 high) is now extending. Next target is 61.8% projection of 1.2004 to 1.0505 to 1.1149 at 1.0223. On the upside, break of 1.0505 support turned resistance is needed to be the first sign of medium term bottoming. Otherwise, outlook will remain bearish even in case of rebound.
Technical Outlook and Review
DXY:
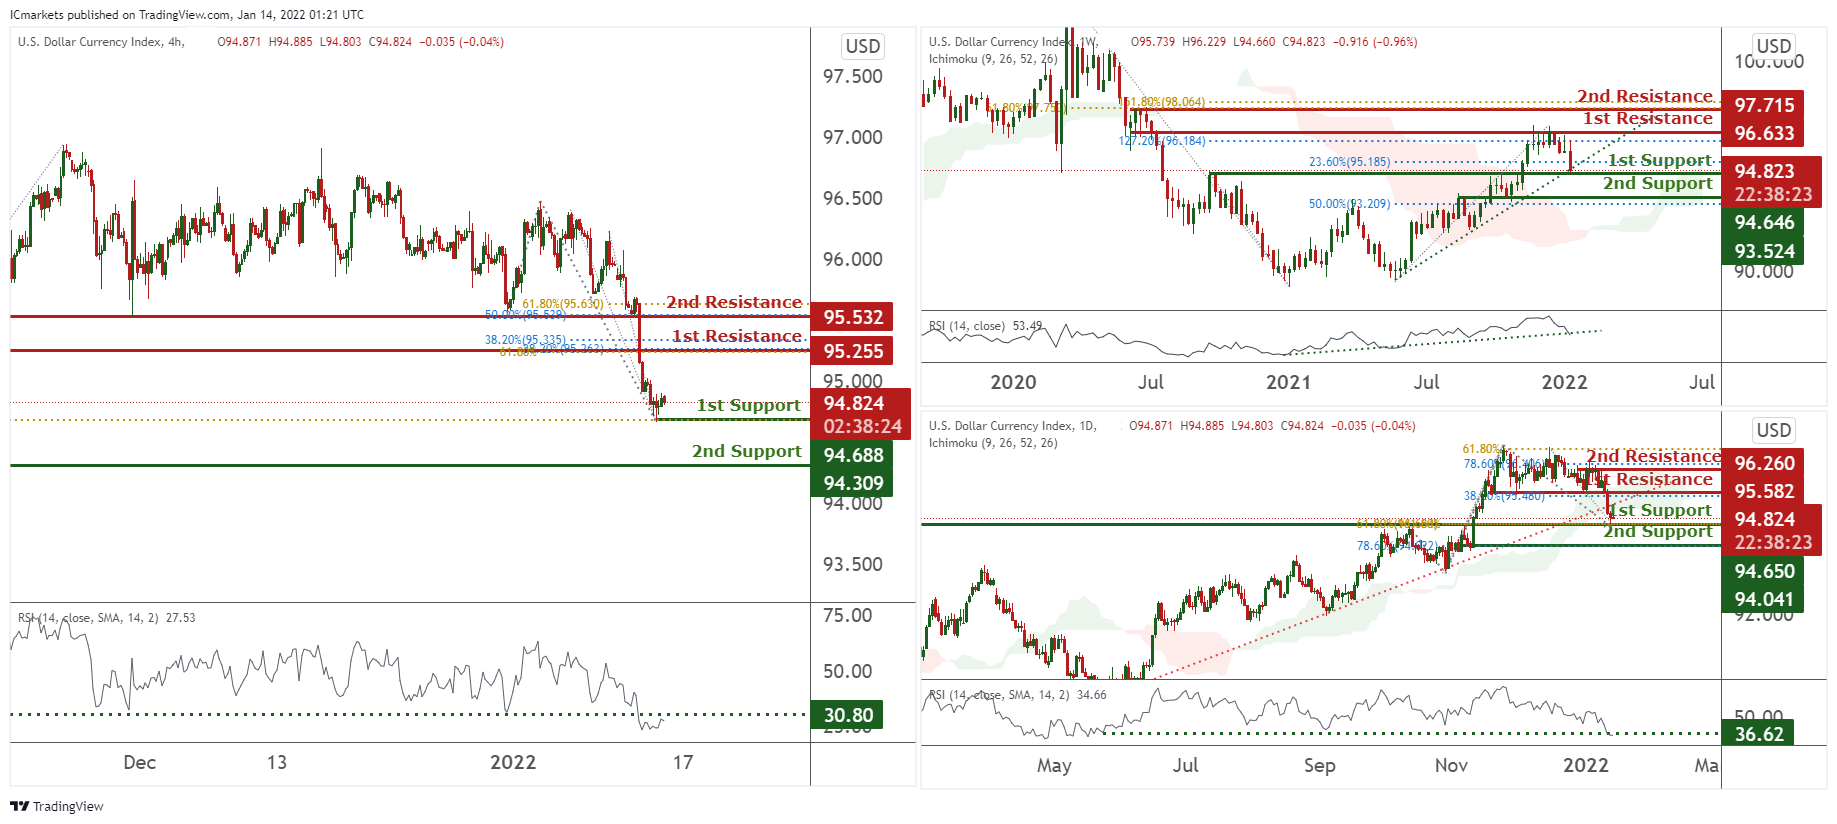
On the weekly, prices are on bullish momentum and abiding to our ascending trendline. We see potential for prices to bounce from our 1st support at 94.646 in line with 23.6% Fibonacci retracement towards our 1st resistance at 96.633 in line with 127.2% Fibonacci extension. Ichimoku clouds are forecasting bullish bounce.
On the daily, prices have recently broken out of our ascending trendline. We see potential for prices to bounce from our 1st support at 94.650 in line with 61.8% Fibonacci retracement and 61.8% Fibonacci extension towards our 1st resistance at 95.582 in line with 38.2 Fibonacci retracement to retest our ascending trendline. RSI is at a level where bounces previously happened.
On the H4 timeframe, prices have reached a graphical swing low. We would expect a bounce from our 1st support at 94.688 in line with 61.8% Fibonacci retracement towards our 1st resistance at 95.255 which is an area of FIbonacci confluences. RSI is at a level where bounces previously occurred.
Areas of consideration:
- H4 time frame, 1st resistance at 95.255
- H4 time frame, 1st support at 94.688
XAU/USD (GOLD):
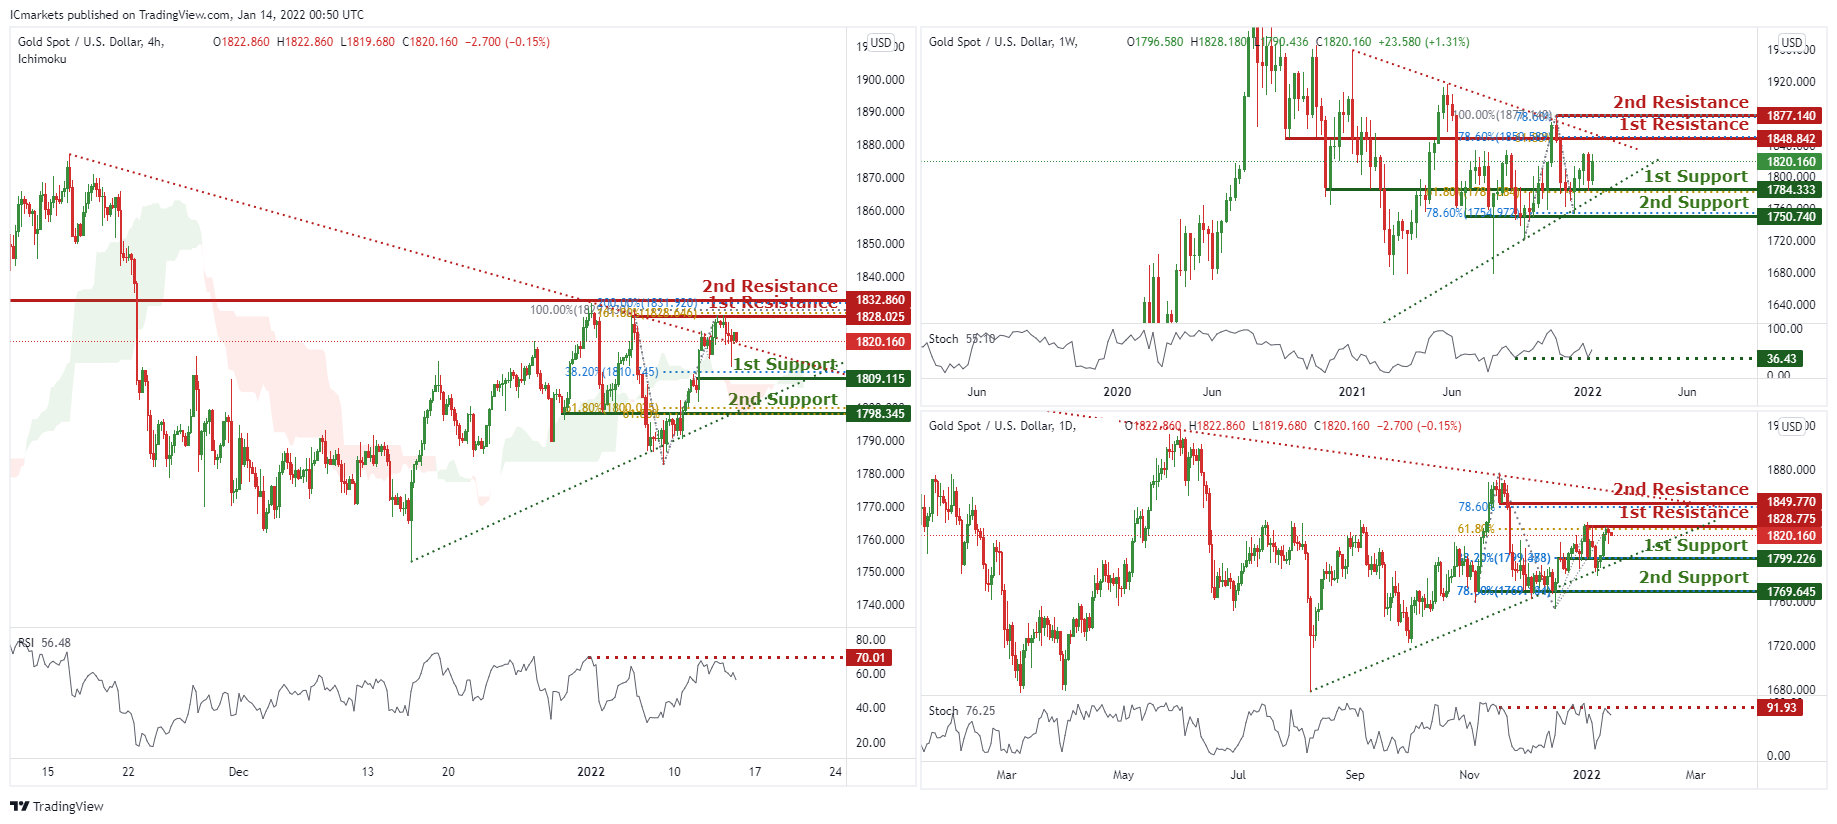
On the weekly, prices are consolidating in a triangle and have the potential to bounce from our 1st support at 1784.333 in line with 61.8% Fibonacci extension towards our 1st resistance at 1848.842 in line with 78.6% Fibonacci retracement and 61.8% Fibonacci extension. Technical indicators are showing bullish momentum.
On the daily, prices are consolidating in a triangle. We see potential for a dip from our 1st resistance at 1828.775 in line with 61.8% Fibonacci retracement and 78.6% Fibonacci retracement towards our 1st support at 1799.226 in line with 38.2% Fibonacci retracement. Our bias is further supported by RSI at a level where dips previously occurred.
On the H4 chart, prices are abiding to our daily bearish trendline. We see potential for prices to dip from our 1st resistance at 1828.025 which is an area of Fibonacci confluences towards our 1st support at 1809.115 in line with 38.2% Fibonacci retracement. RSI is at a level where dips previously occurred. Alternatively, breaking our 1st resistance will find prices climbing further towards our 2nd resistance at 1832.860 which is a graphical overlap.
Areas of consideration:
- 4h 1st support at 1809.115
- 4h 1st resistance at 1828.025
GBP/USD
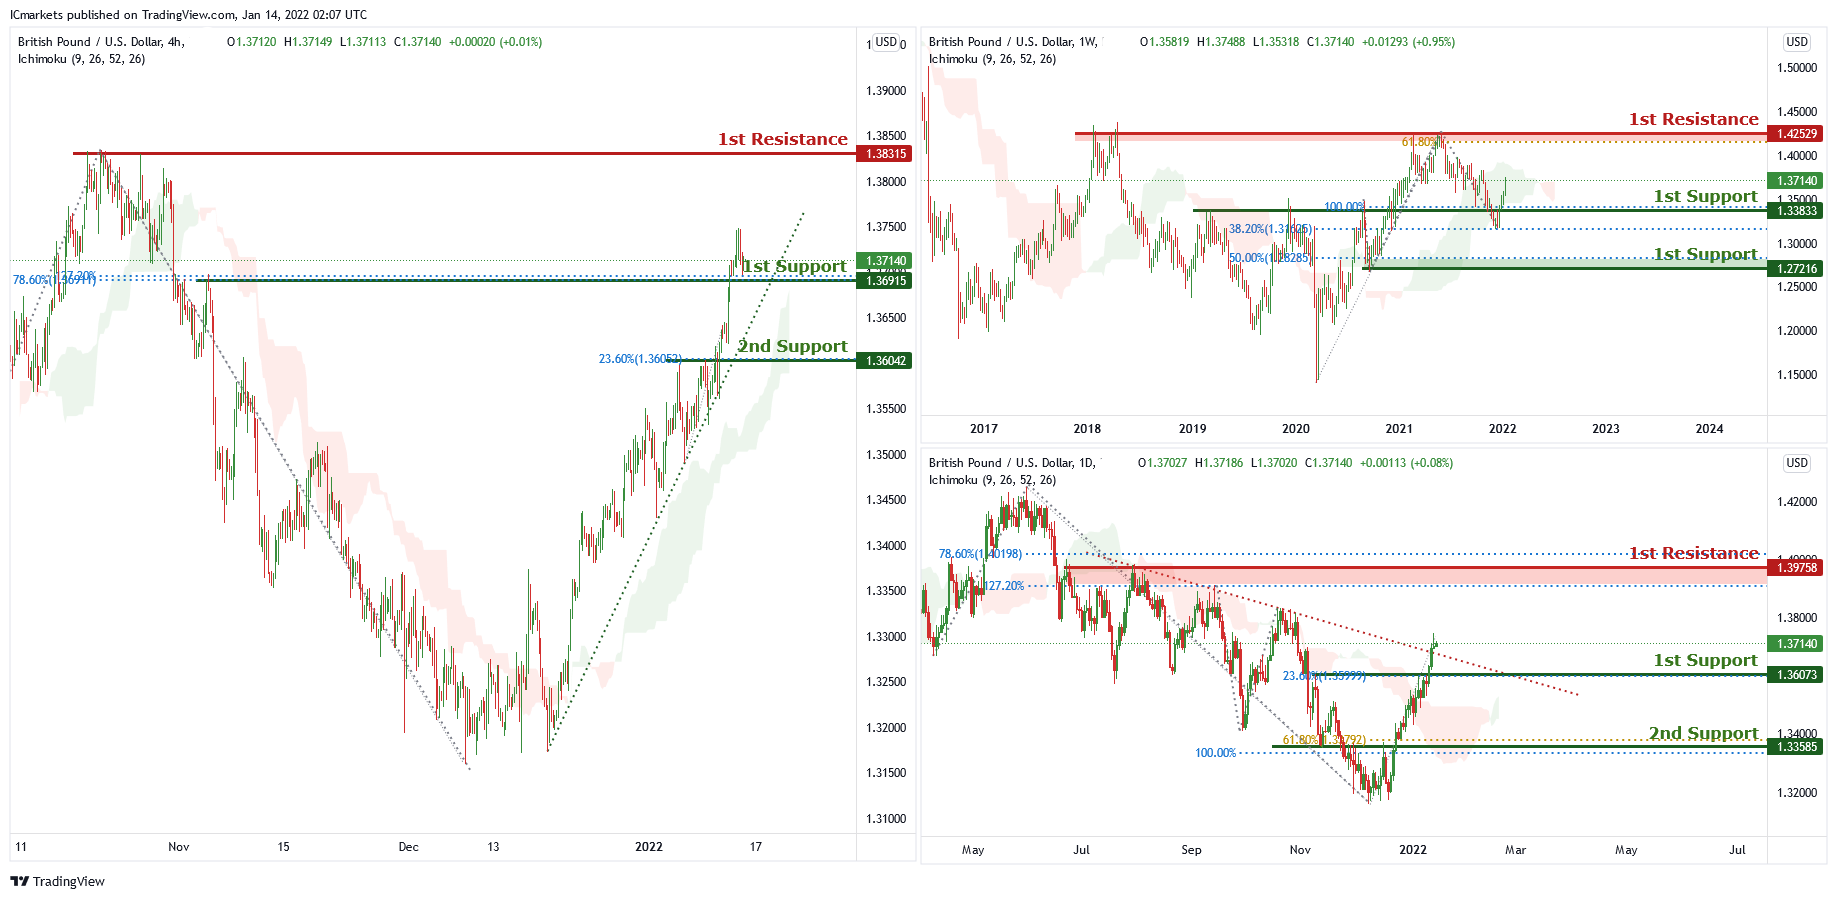
On the weekly chart, price is near the support level of 1.33833 which is also 100% Fibonacci projection and 38.2% Fibonacci retracement. Price can potentially go to the 1st resistance level of 1.42529 which is also 61.8% Fibonacci projection and graphical swing high. Our bullish bias is supported by the ichimoku cloud indicator as price is trading above it.
On the daily chart price has recently broken out of the descending trendline and is near 1st support level of 1.36073 which is also 23.6% Fibonacci retracement. Price can potentially go to the 1st resistance level of 1.39758 which is also 78.6% Fibonacci retracement and 127.2% Fibonacci projection. Our bullish bias is supported by the ichimoku cloud indicator as price is trading above it.
On the H4 chart price is abiding by an ascending trendline and near the first support level of 1.36915 which is also 78.6%% Fibonacci retracement and 127.2% Fibonacci projection . Price can potentially go to the 1st resistance level of 1.38315 which is the graphical swing high level. Our bullish bias is supported by the ichimoku cloud indicator as price is trading above it.
Areas of consideration:
- H4 1st resistance at 1.38315
- H4 1st support 1.36915
USD/CHF
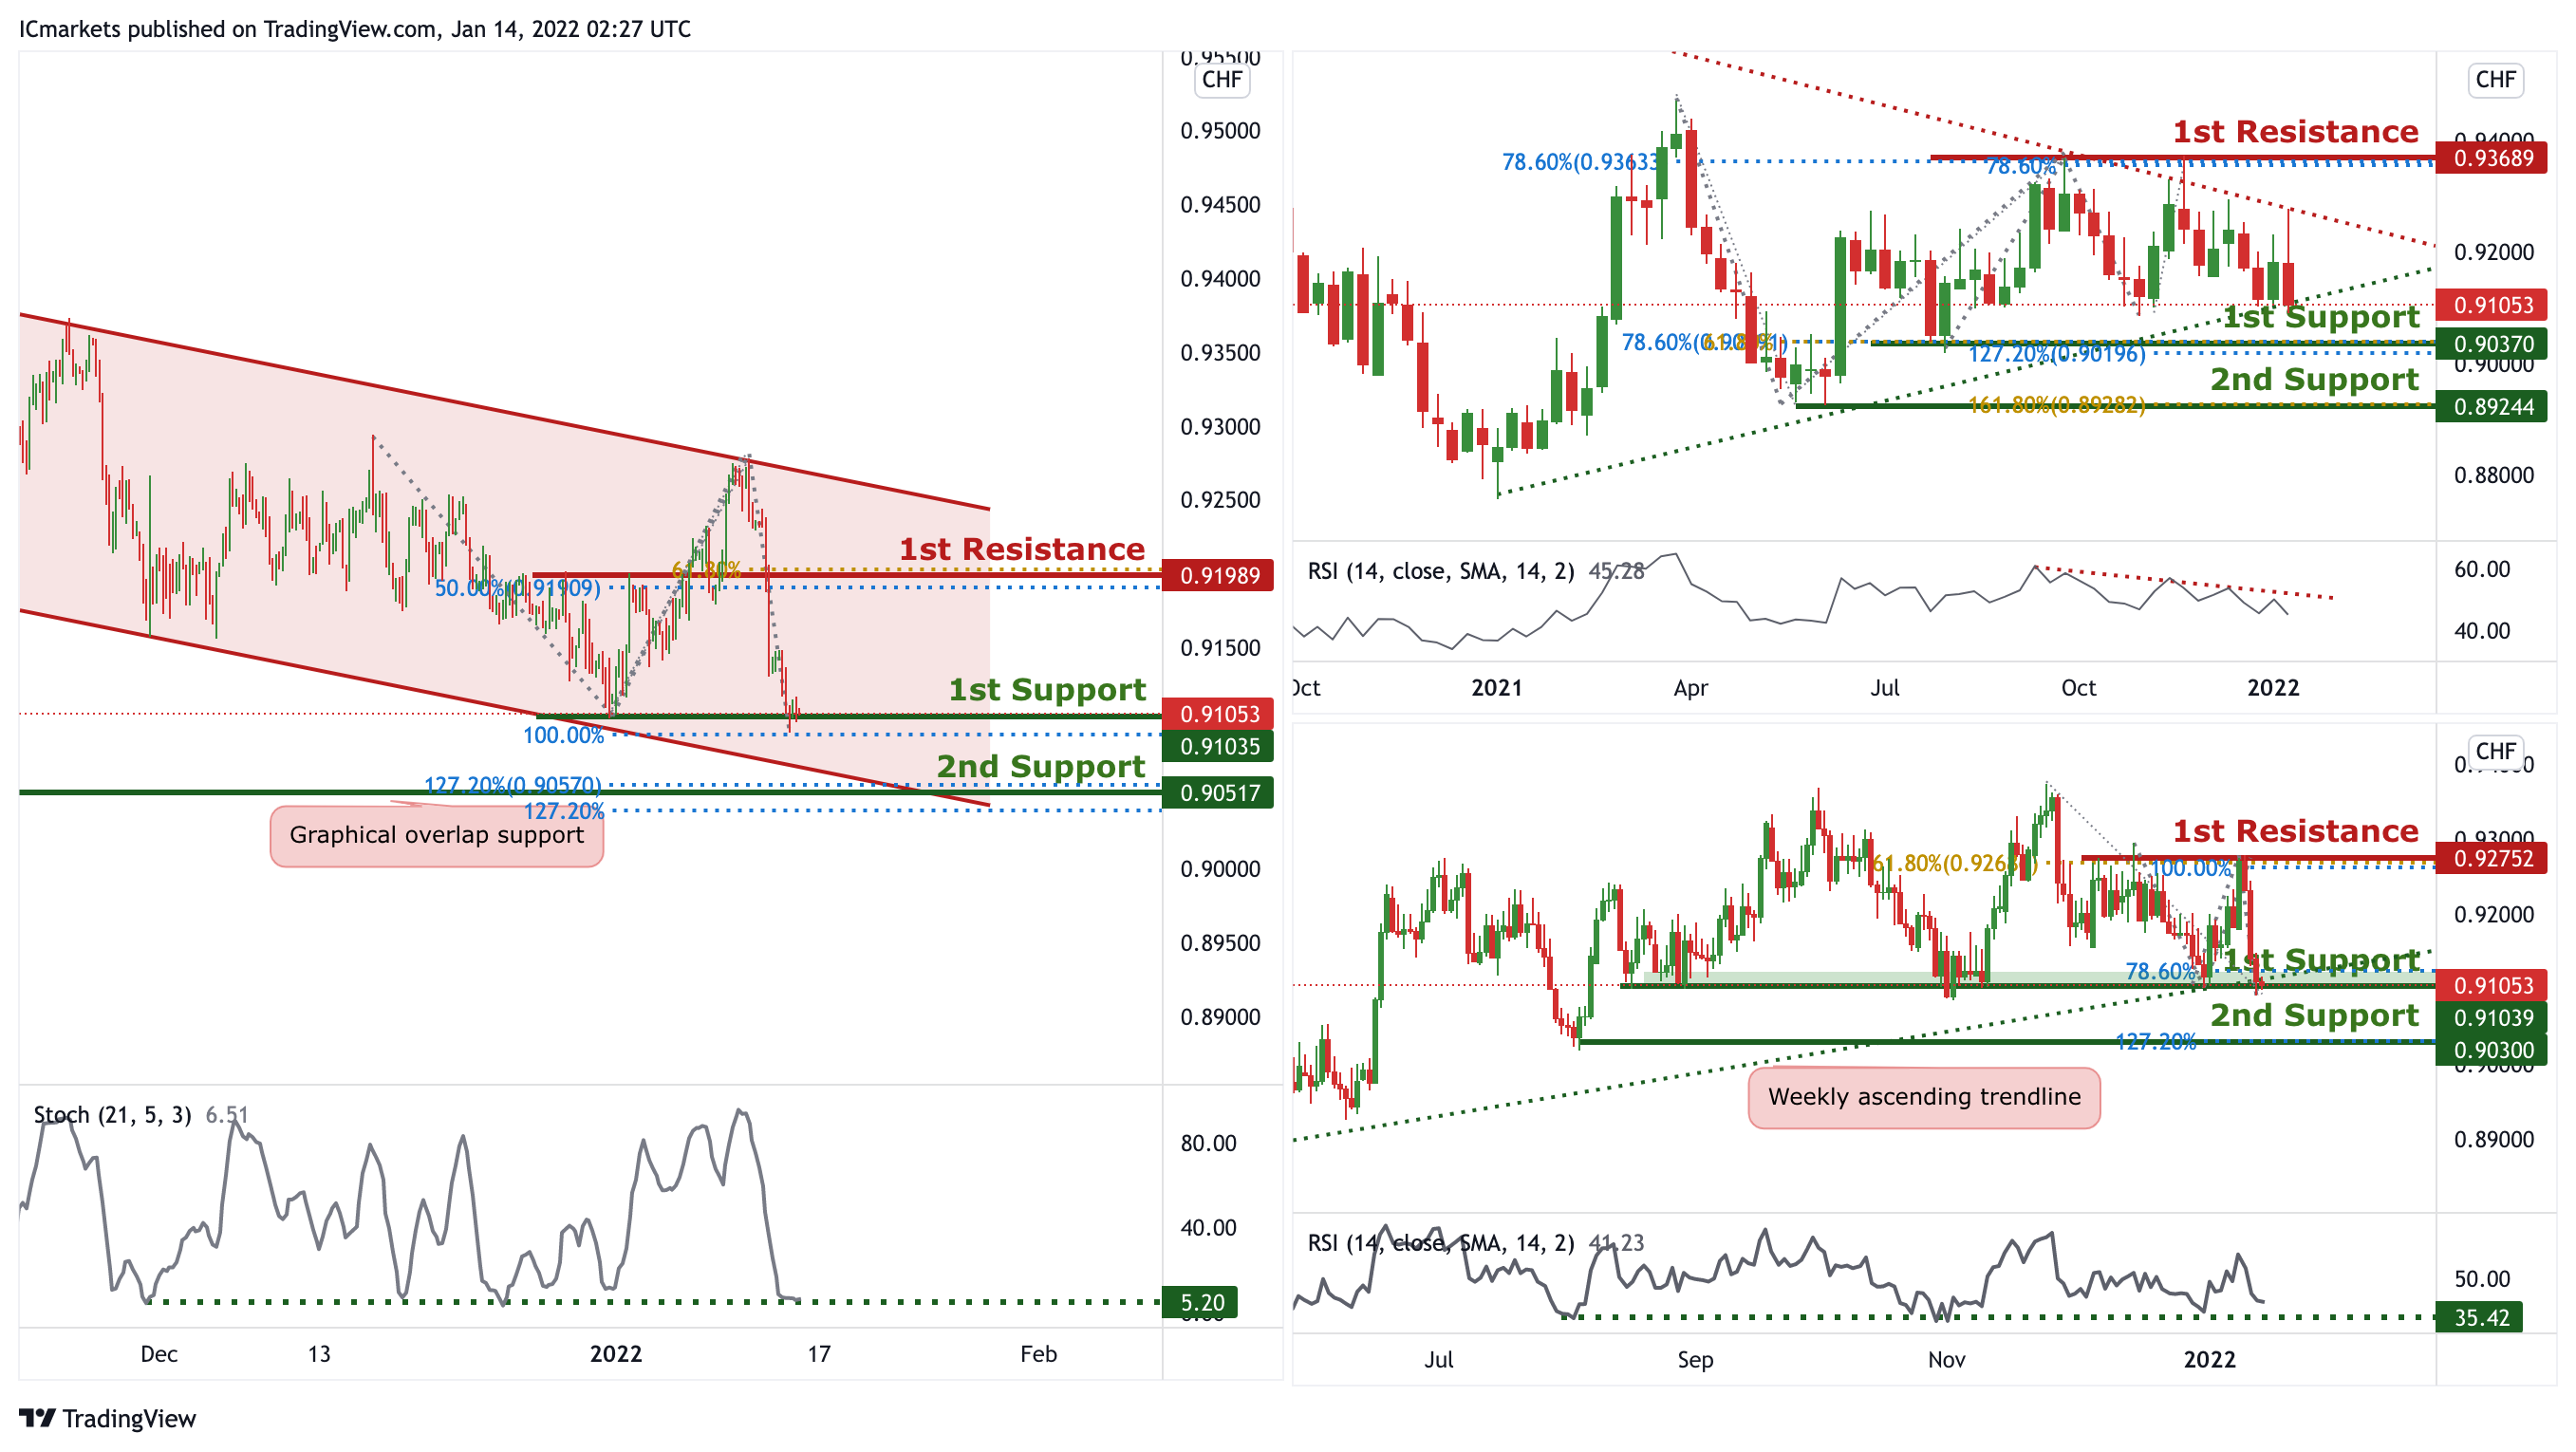
On the Weekly timeframe, price is reacting in a triangle pattern. Traders should wait for the price to swing higher or lower before entering. On the Daily timeframe, price is abiding to the ascending trendline support on the weekly,we can expect an overall bullish momentum. Price could bounce from 1st Support in line with 78.6% Fibonacci retracement and 78.6% FIbonacci projection towards 1st Resistance in line with 61.8% Fibonacci retracement and 100% Fibonacci projection. Our bullish bias is further supported by the RSI indicator where it is at the support level.
On the H4 timeframe, price is abiding to a descending channel, signifying a bearish momentum. Price is approaching a support level, we can expect price to make a short-term bullish bounce in line with 78.6% Fibonacci Projection and 161.8% Fibonacci retracement towards 1st Resistance in line with 78.6% Fibonacci projection. Our short-term bullish bias is further supported by the stochastic indicator where the %K line is approaching the support level.
Areas of consideration:
- Watch 1st Support at 0.91113
- Watch 1st Resistance at 0.92698
EUR/USD :
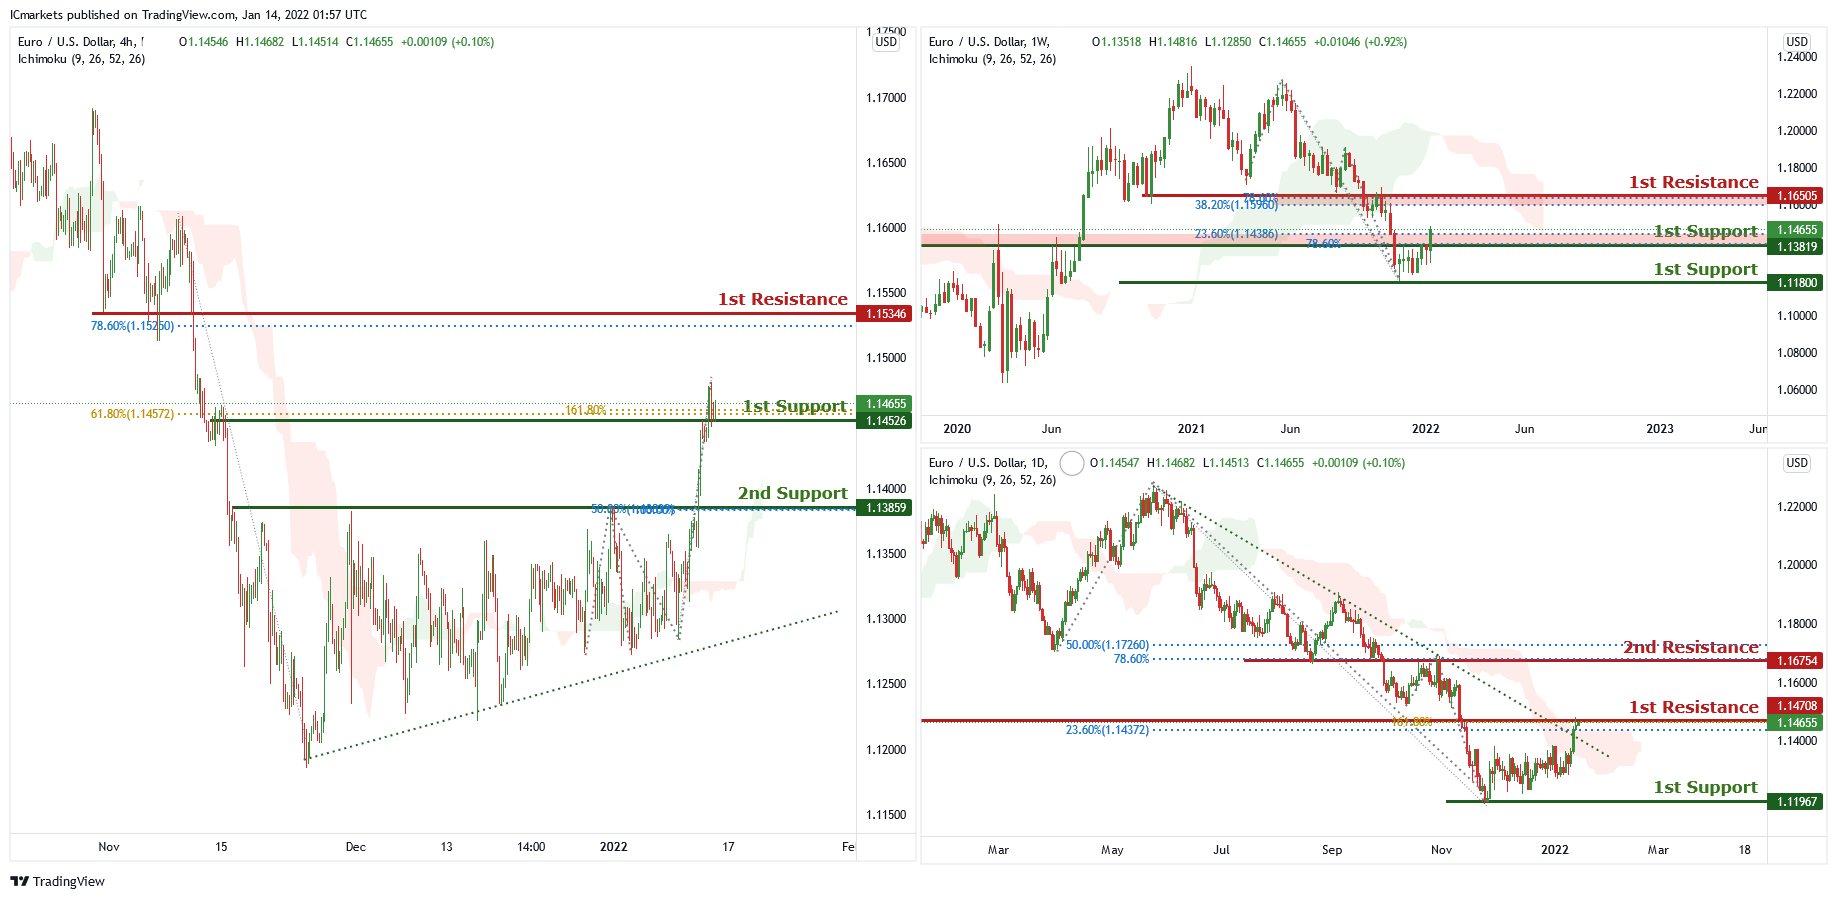
On the weekly chart, price is near the 1st support level of 1.13819 which is also 23.6% Fibonacci retracement and 78.6% Fibonacci projection. Price can potentially go to the 1st resistance level of 1.16505 which is also 78.6% Fibonacci projection and 38.2% Fibonacci retracement. Our bullish bias is supported by the stochastic indicator as it is near support level.
On the daily chart, price has recently broken out of the descending trendline and is near 1st resistance level of 1.14708 which is also 23.6% Fibonacci retracement. Price can potentially go to the graphical overlap resistance level of 1.16754 which is also 50% Fibonacci retracement and 78.6% Fibonacci projection. Our bullish bias is supported by the ichimoku cloud indicator as price is trading above it.
On the H4 chart , price is abiding by an ascending trendline and is near 1st support level of 1.14526 which is also 161.8% Fibonacci projection and 61.8% Fibonacci retracement. Price can potentially go to the 1st resistance level of 1.15346 which is also 78.6% Fibonacci retracement. Our bullish bias is supported by the ichimoku cloud indicator as price is trading above it.
Areas of consideration:
- H4 1st resistance at 1.15346
- H4 1st support at 1.14526
USD/JPY
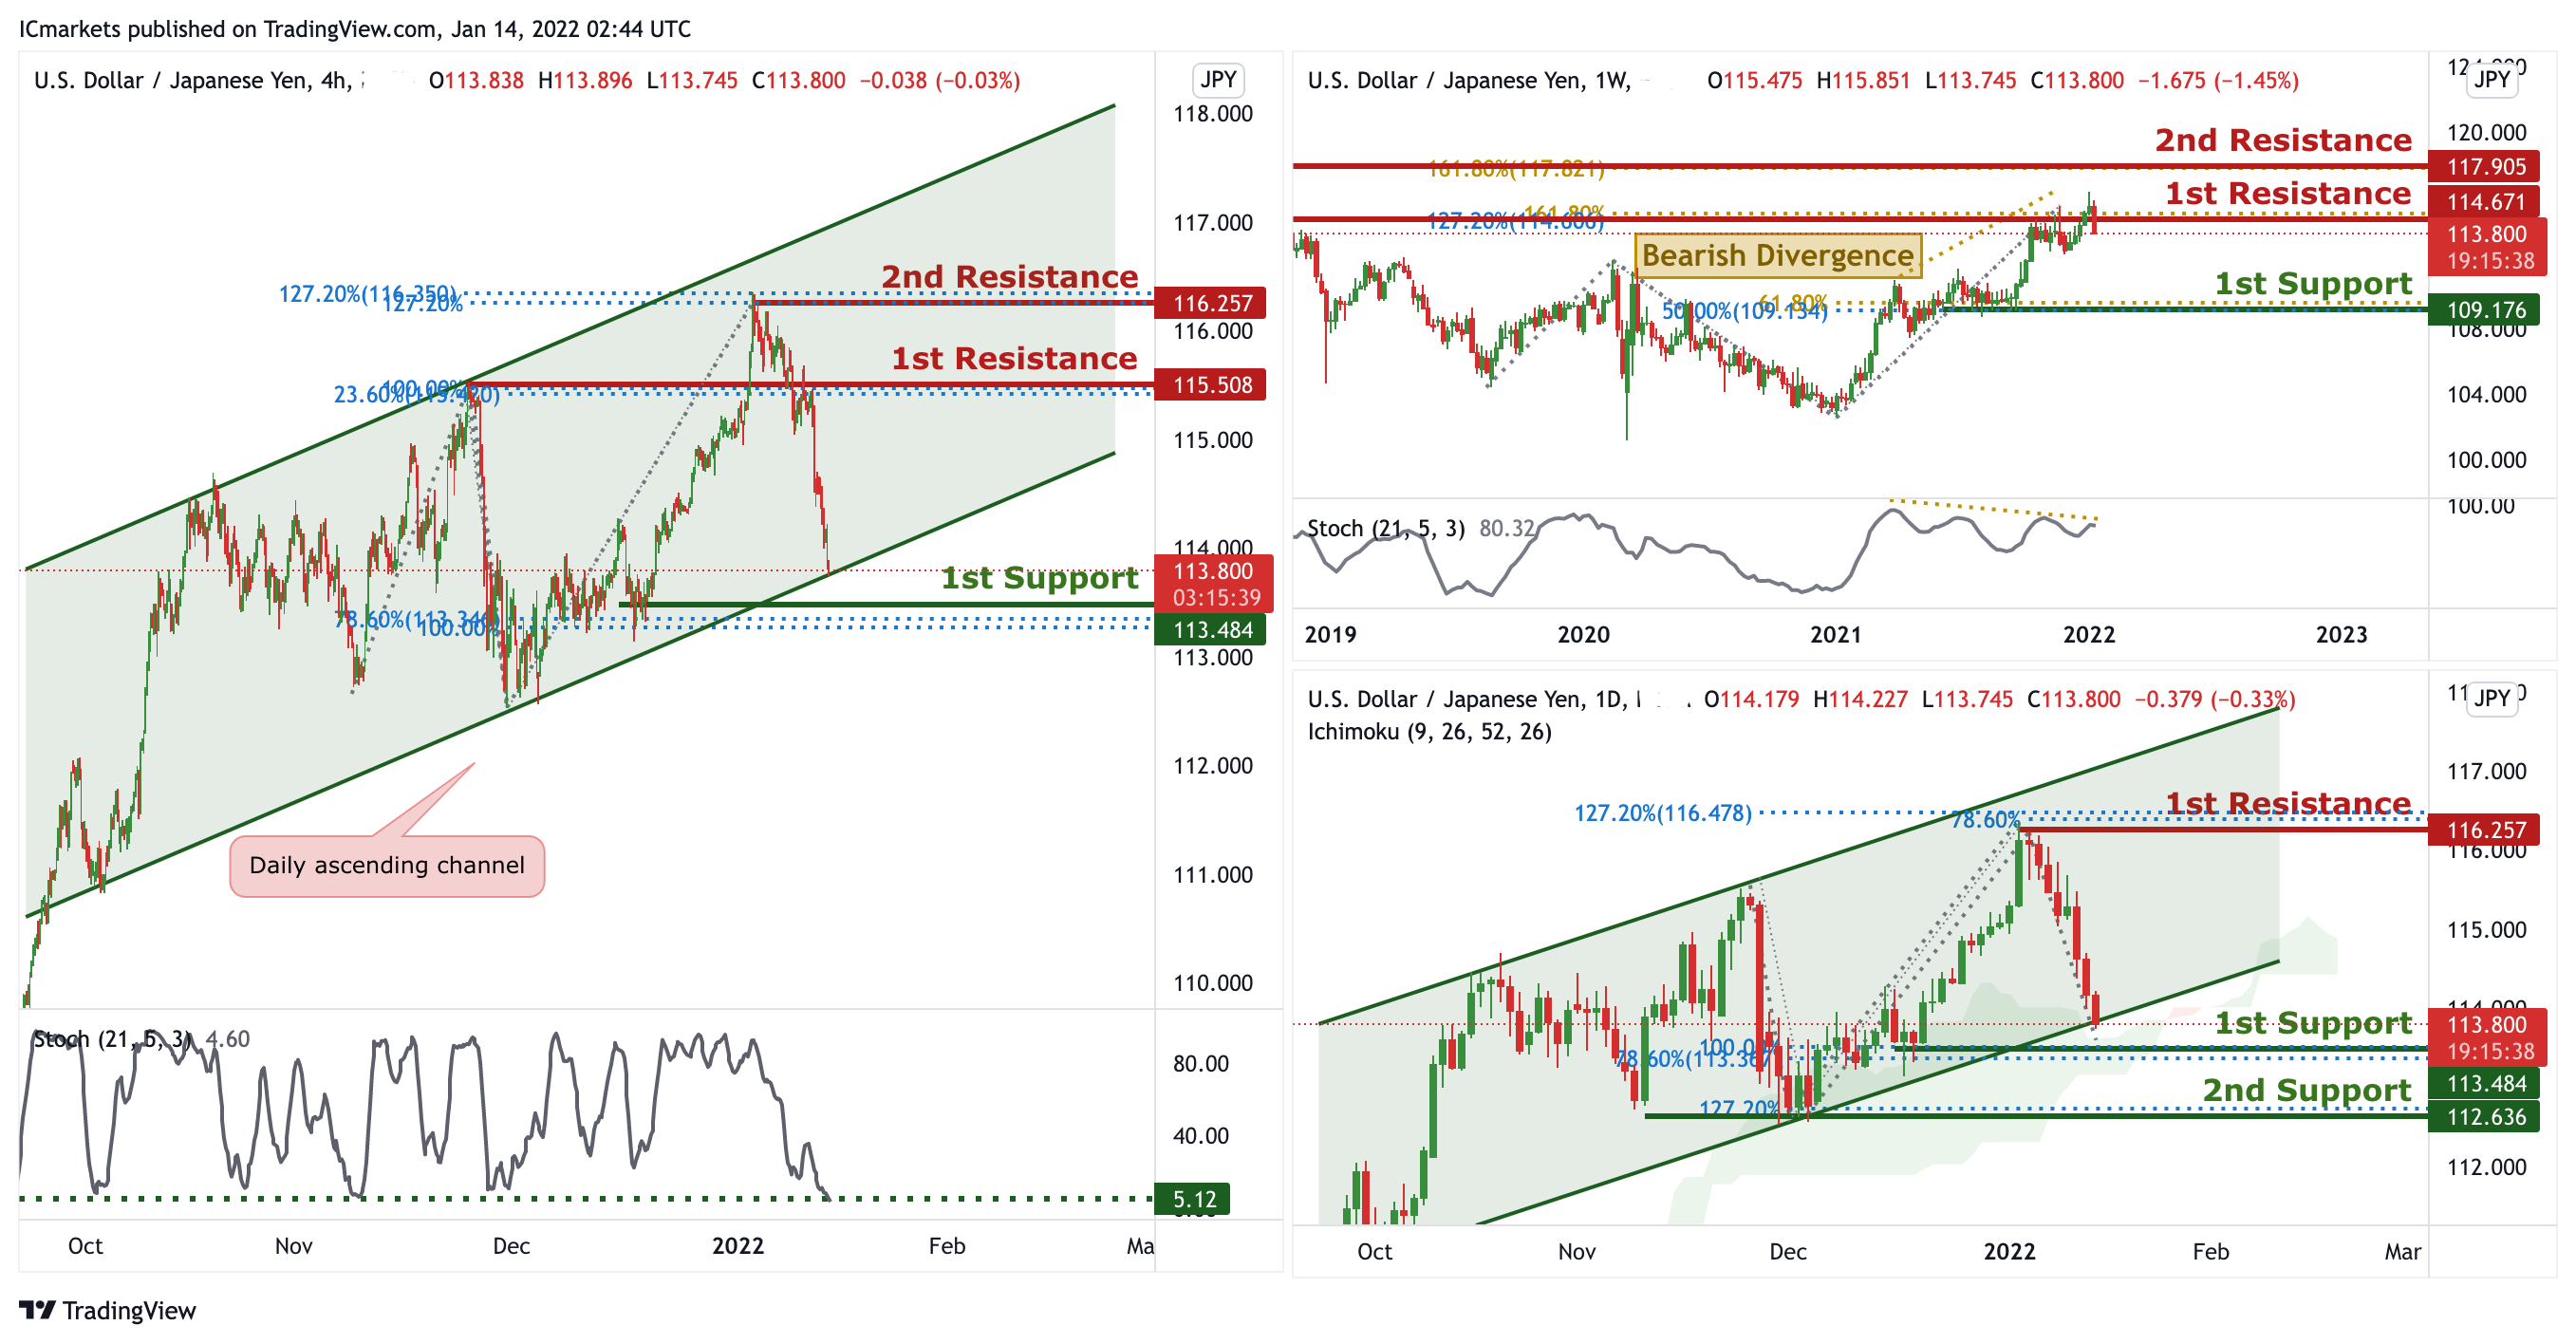
On the Weekly timeframe, we can see that price touched the 1st resistance in line with horizontal swing highs and 127.2% FIbonacci Retracement and 161.8% Fibonacci Projection. We can expect the price to drop from the 1st Resistance towards the 1st Support in line with 61.8% Fibonacci projection and 50% Fibonacci retracement. Our short-term bearish momentum is further supported by the stochastic %K line holding below the descending trendline resistance and bearish divergence spotted. In reference to last week’s analysis, on the Daily timeframe price indeed dropped to the 1st Support. Price is now abiding to the ascending channel, we can expect price to bounce from 1st Support in line with 100% Fibonacci projection and 78.6% Fibonacci extension towards 1st Resistance in line with previous swing high, 127.2% Fibonacci expansion and 78,6% Fibonacci projection. Our bullish bias is further supported by the Ichimoku cloud acting as a support level.
In reference to yesterday’s analysis, price indeed moved down nicely to the 1st Support. On the H4 timeframe, is abiding to the ascending channel on the daily, signifying an overall bullish momentum. We can now expect price to bounce from 1st Support in line with daily support, 78.6% Fibonacci retracement and 100% FIbonacci projection. Our bullish bias is further supported by the stochastic indicator where the %K line is at the support level.
Areas of consideration:
- H4 1st resistance level 115.508
- H4 1st support level 113.484
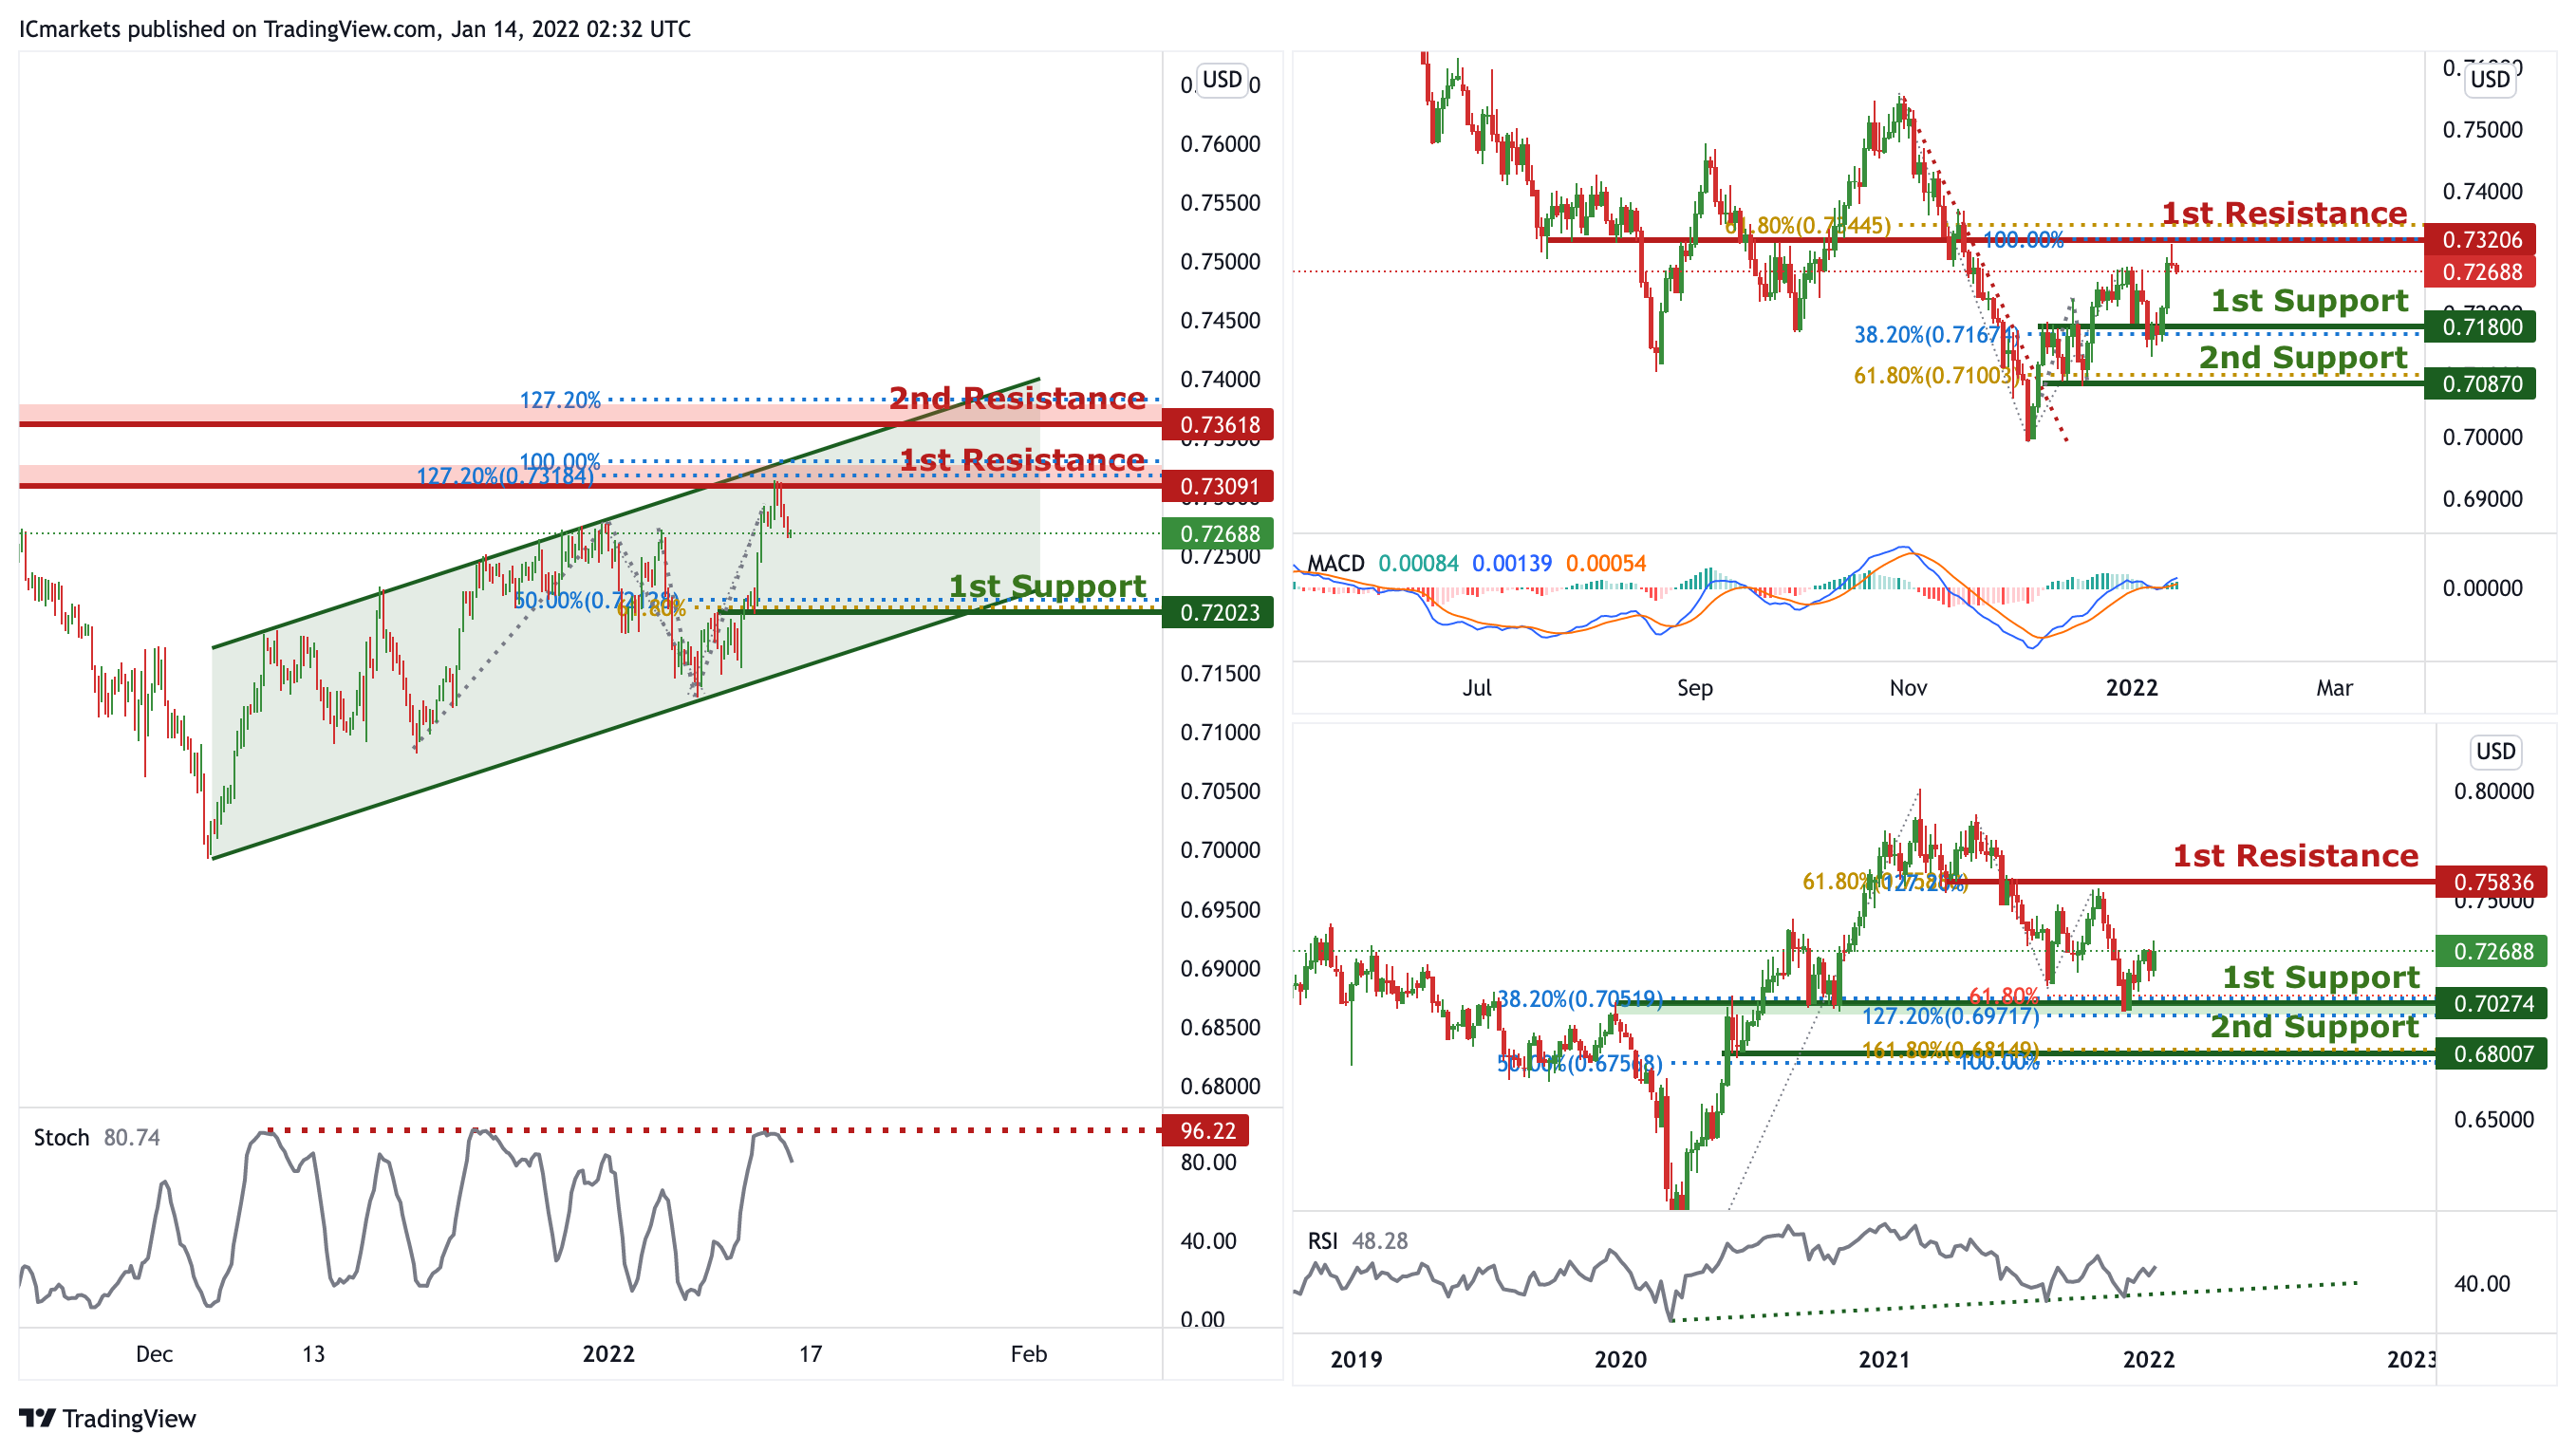
AUD/USD:
In reference to last week’s analysis, price has bounced nicely on the 1st Support. On the weekly, we can now expect the price to continue to push higher from the 1st Support in line with 61.8% Fibonacci projection, 38.2 % FIbonacci retracement and 127.2% Fibonacci extensions. Our bullish bias is further supported by the RSI indicator abiding to an ascending trendline. Traders should wait for prices to swing higher or lower before entering again. In reference to last week’s analysis price indeed bounced nicely on the 1st Support on the daily timeframe. On the Daily, the price is at the 1st support, we can expect the price to continue to push higher from 1st Support in line with 38.2% Fibonacci retracement towards 1st Resistance in line with 100% Fibonacci projection and 61.8% Fibonacci retracement. Our bullish bias is further supported by the MACD indicator where the MACD line is above the signal line.
On the H4, price is reacting within the ascending channel, signifying an overall bullish momentum. Price is approaching the 1st Resistance, we can expect to see price make a short-term bearish drop from 1st Resistance in line with 127.2% Fibonacci extension and 100% Fibonacci projection towards 1st Support in line with 50% Fibonacci retracement and 61.8% Fibonacci projection. Our short-term bearish bias is further supported by the stochastic indicator where the %K line is at the resistance level.
Areas of consideration:
- H4 1st Support level 0.72023
- H4 1st resistance level 0.73091
NZD/USD:
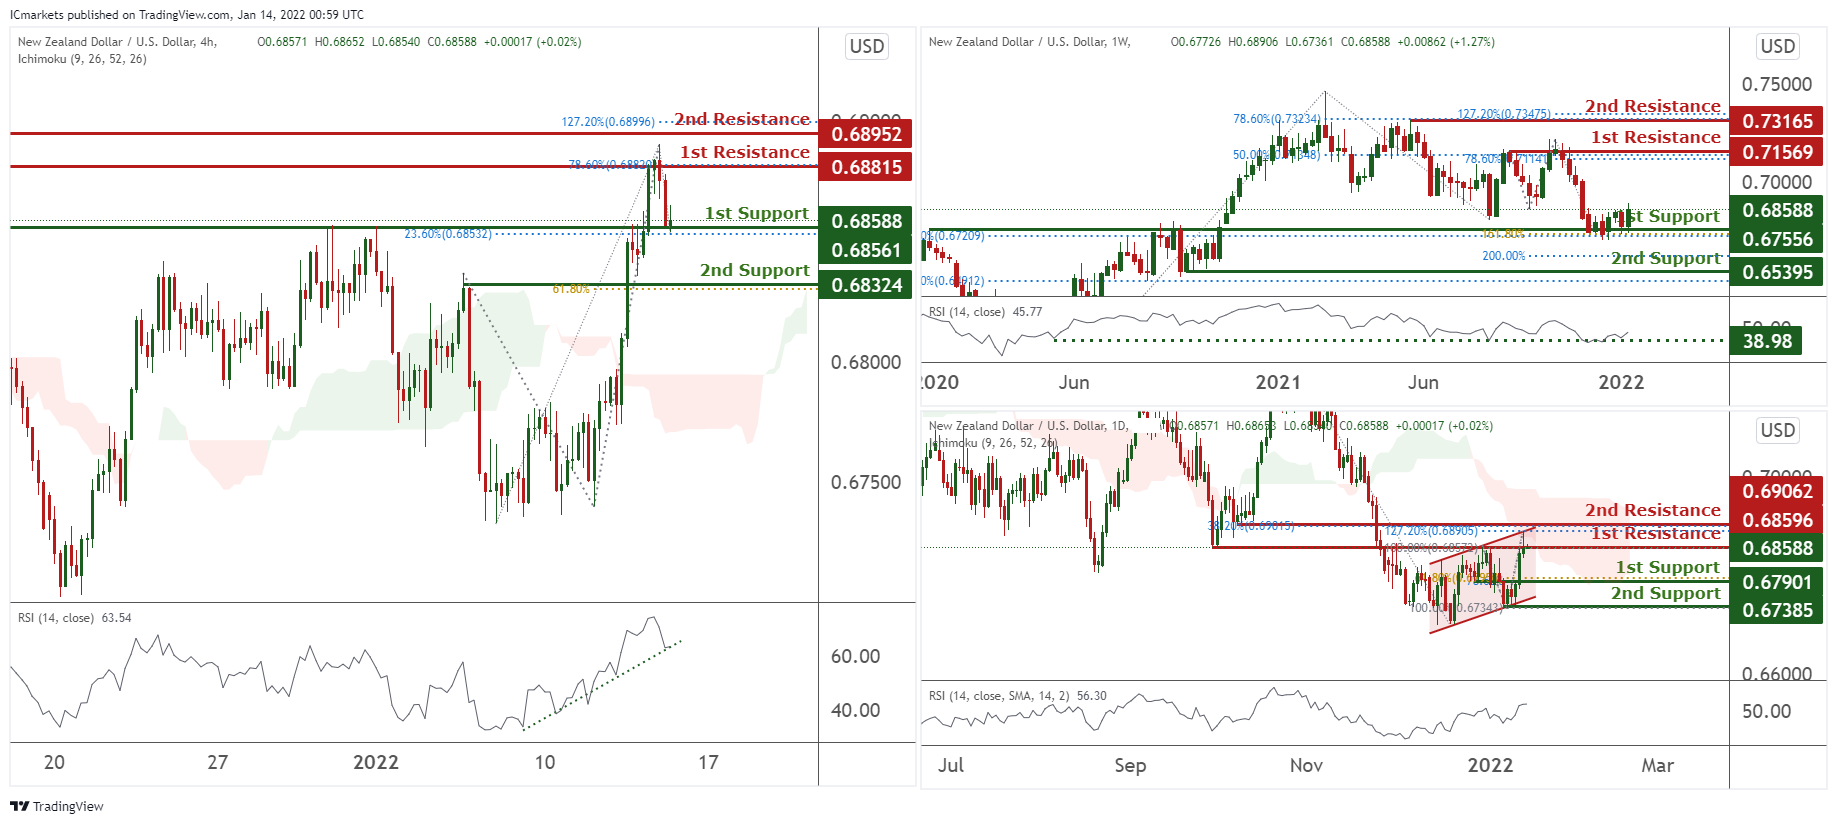
On the weekly, prices are on a bullish momentum. We see potential for a bounce at 1st support at 0.67556 in line with 23.6% Fibonacci retracement towards 1st resistance at 61.8% Fibonacci retracement. Technical indicators are showing bullish momentum. Alternatively, if prices break our 1st support, we might find it dipping towards our 2nd support at 0.69794 in line with 61.8% and 78.6% Fibonacci retracement.
On the daily, prices are consolidating in a channel. We see potential for prices to dip from our 1st resistance at 0.68596 in line with 100% Fibonacci retracement towards our 1st support at 0.67901 in line with 61.8% Fibonacci retracement. Ichimoku clouds are forecasting the dips.
On the H4 timeframe, prices are at a daily support and strong graphical overlap. We see potential for prices to bounce from our 1st support at 0.68588 in line with 23.6% Fibonacci retracement towards our 1st resistance at 0.68815 in line with 78.6% Fibonacci extension. Our bias is further supported by the Ichimoku Clouds forecasting bullish momentum and also RSI portraying an upward trend. If prices break our 1st support, we can potentially find prices dipping towards our 2nd support at 0.68324 in line with 61.8% Fibonacci retracement.
Areas of consideration:
- H4 time frame, 1st resistance at 0.68815
- H4 time frame, 1st support at 0.68588
USD/CAD:
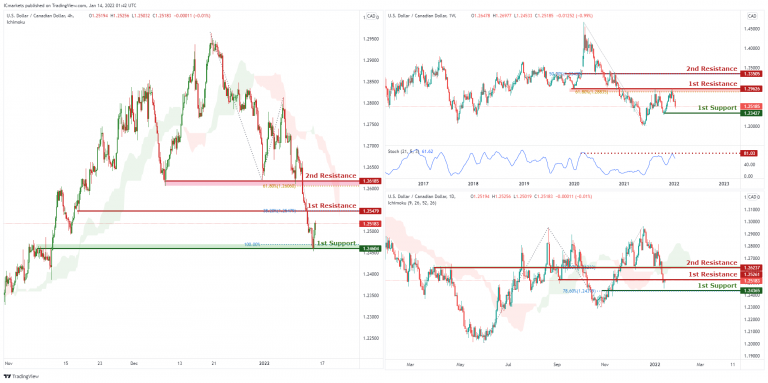
On the Weekly, with price reversing from the resistance of the stochastics, we have a bearish bias that price will from from our 1st resistance at 1.29626 which is in line with horizontal overlap resistance and 61.8% Fibonacci retracement to 1st support at 1.23427, which is in line with horizontal swing low support. Alternatively, price may break 1st resistance structure and head for 2nd resistance at 1.33505, which coincides with horizontal overlap resistance and 50% Fibonacci retracement.
On the Daily, with price moving below the ichimoku cloud, we have a bearish bias that price will from from our 1st resistance at 1.25261 which is in line with horizontal overlap resistance to 1st support at 1.24365, which is in line with horizontal overlap support and 78.6% Fibonacci retracement level. Alternatively, price may break 1st resistance structure and head for 2nd resistance at 1.26237, which coincides with horizontal overlap resistance and 50% Fibonacci retracement.
On the H4, with price moving below the ichimoku cloud, we have a bearish bias that price will from from our 1st resistance at 1.25479 which is in line with horizontal overlap resistance and 38.2% Fibonacci retracement to 1st support at 1.24604, which is in line with horizontal overlap support and 100% Fibonacci projection level. Alternatively, price may break 1st resistance structure and head for 2nd resistance at 1.26185, which coincides with horizontal overlap resistance and 61.8% Fibonacci retracement.
Areas of consideration:
- H4 time frame, 1st support at 1.24604
- H4 time frame, 1st resistance at 1.25479
OIL:
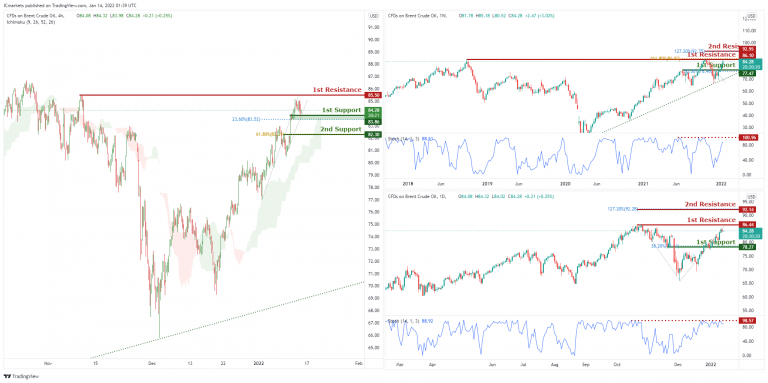
On the Weekly, with price approaching the resistance of the stochastics, we have a bearish bias that price will from from our 1st resistance at 86.10 which is in line with horizontal swing high resistance and 161.8% Fibonacci projection to 1st support at 77.47, which is in line with horizontal overlap support and 50% Fibonacci retracement level. Alternatively, price may break 1st resistance structure and head for 2nd resistance at 92.95, which coincides with horizontal swing high resistance and 127.2% Fibonacci extension level.
On the Daily, with price at the resistance of the stochastics zone, we have a bearish bias that price will from from our 1st resistance at 86.44 which is in line with horizontal swing high resistance to 1st support at 78.27, which is in line with horizontal overlap support and 38.2% Fibonacci retracement level. Alternatively, price may break 1st resistance structure and head for 2nd resistance at 92.14, which coincides with horizontal swing high resistance and 127.2% Fibonacci extension level.
On the H4, with price moving above the ichimoku cloud, we have a bullish bias that price will rise to our 1st resistance at 85.5 which is in line with horizontal swing high resistance from 1st support at 83.86, which is in line with horizontal overlap support and 23.6% Fibonacci retracement level. Alternatively, price may break 1st support structure and head for 2nd support at 82.30, which coincides with horizontal swing low support and 61.8% Fibonacci retracement level .
Areas of consideration:
- H4 time frame, 1st resistance of 85.5
- H4 time frame, 1st support of 83.86
Dow Jones Industrial Average:
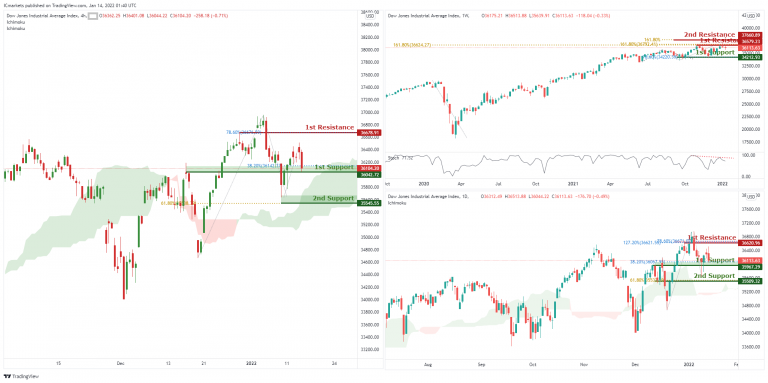
On the Weekly, with price reacting off the resistance of the stochastics, we have a bearish bias that price will from from our 1st resistance at 36579 which is in line with horizontal swing high resistance and 161.8% Fibonacci projection level to 1st support at 34212, which is in line with horizontal swing low support and 78.6% Fibonacci retracement level. Alternatively, price may break 1st resistance structure and head for 2nd resistance at 37660, which coincides with horizontal swing high resistance and 161.8% Fibonacci projection level.
On the Daily, with price moving above the ichimoku cloud, we have a bullish bias that price will rise to our 1st resistance at 36620 which is in line with horizontal swing high resistance, 78.6% Fibonacci projection and 127.2% Fibonacci extension from 1st support at 35967, which is in line with horizontal overlap support and 38.2% Fibonacci retracement level. Alternatively, price may break 1st support structure and head for 2nd support at 35509, which coincides with horizontal overlap support and 61.8% Fibonacci retracement level.
On the H4, with price moving above the ichimoku cloud, we have a bullish bias that price will rise to our 1st resistance at 36678 which is in line with horizontal swing high resistance and 78.6% Fibonacci retracement level from 1st support at 36042, which is in line with horizontal overlap support and 38.2% Fibonacci retracement level. Alternatively, price may break 1st support structure and head for 2nd support at 35545, which coincides with horizontal swing low support and 61.8% Fibonacci retracement level.
Areas of consideration:
- H4 time frame, 1st resistance of 36678
- H4 time frame, 1st support of 36042
AUD/USD Daily Report
Daily Pivots: (S1) 0.7265; (P) 0.7289; (R1) 0.7305; More...
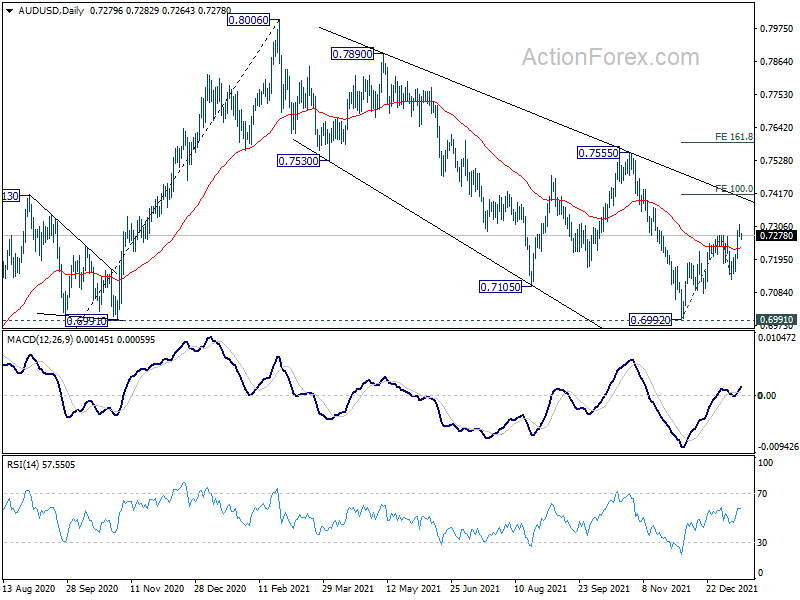
Intraday bias in AUD/USD remains on the this point. Correction from 0.8006 could have completed after defending 0.6991. Further rise should be seen to 100% projection of 0.6992 to 0.7277 from 0.7128 at 0.7413 first. For now, further rally will remain in favor as long as 0.7128 support holds, in case of retreat.
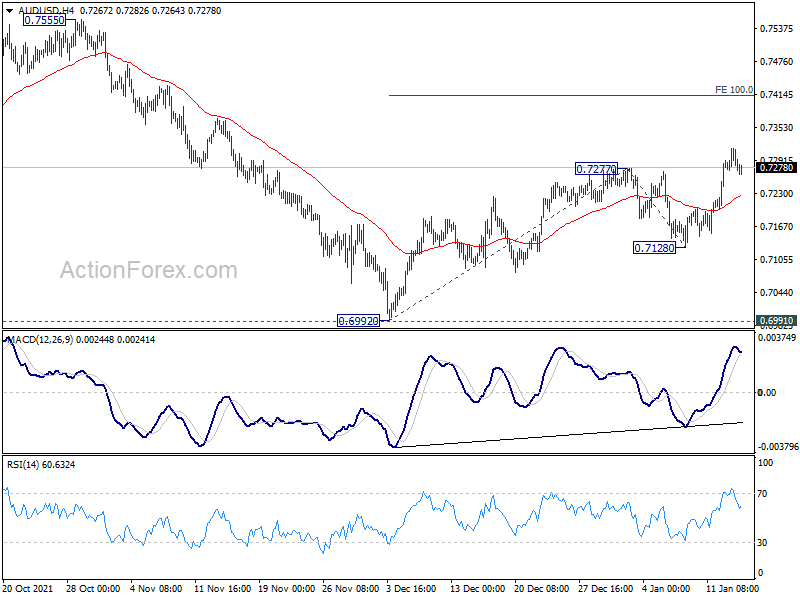
In the bigger picture, strong rebound from 0.6991 key structural support will retain medium term bullishness. That is, whole up trend from 0.5506 is still in progress. Firm break of 0.7555 resistance will target 0.8006 high and above. However, sustained break of 0.6991 will argue that the whole up trend from 0.5506 might be finished at 0.8006, after rejection by 0.8135 long term resistance. Deeper decline would then be seen back to 61.8% retracement of 0.5506 to 0.8006 at 0.6461.