Sample Category Title
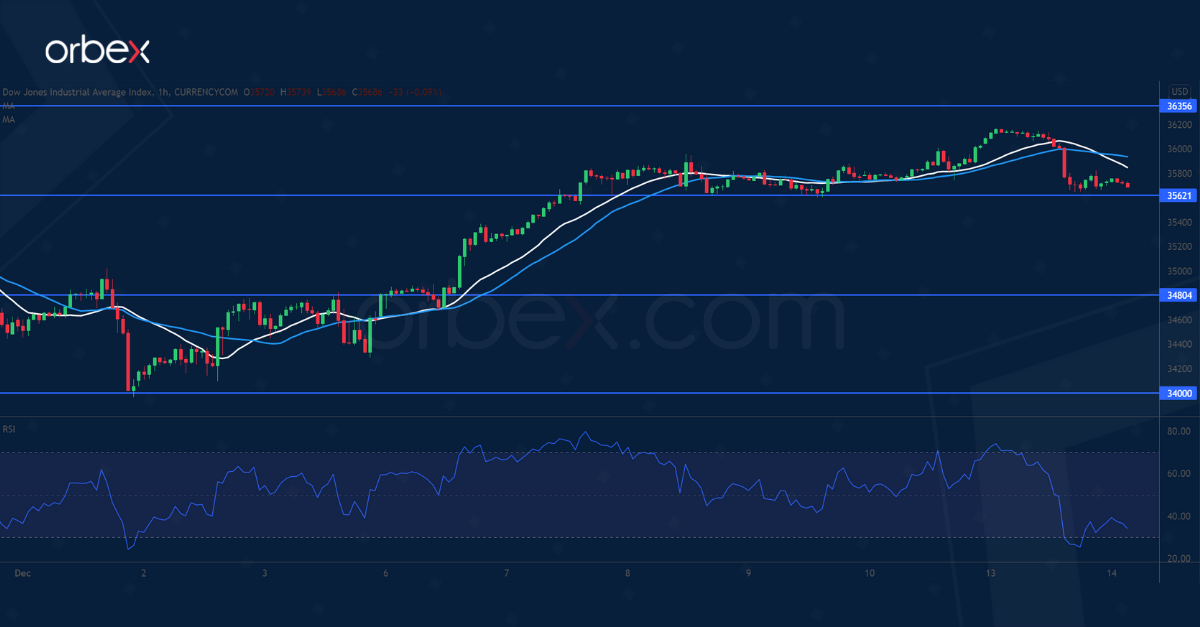
US 30 To Test Previous Peak
The Dow Jones 30 inches lower as investors look ahead to Fed’s aggressive tapering.
By lifting offers around the psychological level of 36000, a major resistance on the daily chart, the bulls may have turned sentiment around. As the index falls back in search of support, the RSI’s oversold situation may catch buyers’ attention.
A break above 36350 may resume the uptrend. Otherwise, 35620 is the closest support where buyers could jump in for fear of missing out. Further down, 34800 would be a second line of defense.
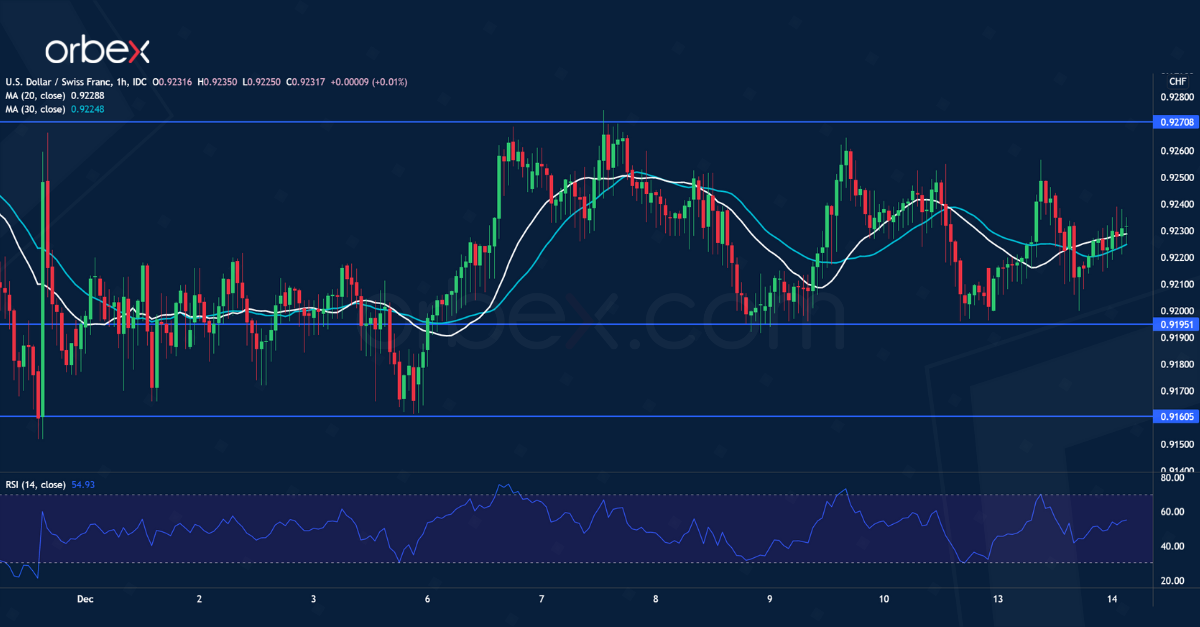
USD/CHF Looks For Breakout
The US dollar consolidates ahead of the Federal Reserve meeting.
The pair is grinding for support above 0.9160 after it gave up most gains from the November rally. Overall sentiment remains positive as long as price action stays above the daily support at 0.9100. The current consolidation is a sign of accumulation from the long side.
A close above the immediate resistance at 0.9270 would propel the greenback to the previous peak at 0.9360. On the downside, between 0.9160 and 0.9195 lies an important demand zone.
The Analytical Overview Of The Main Currency Pairs
The EUR/USD currency pair
Technical indicators of the currency pair:
Prev Open: 1.1308
Prev Close: 1.1285
% chg. over the last day: -0.20%
The energy crisis is getting worse in Europe. Since early October, European natural gas futures increased to their highest level amid growing concern that Russia's Nord Stream 2 pipeline will not work this winter. Analysts believe that amid rising inflation expectations, the ECB needs to tighten monetary policy as soon as possible, or consumer prices will be even higher.
Trading recommendations
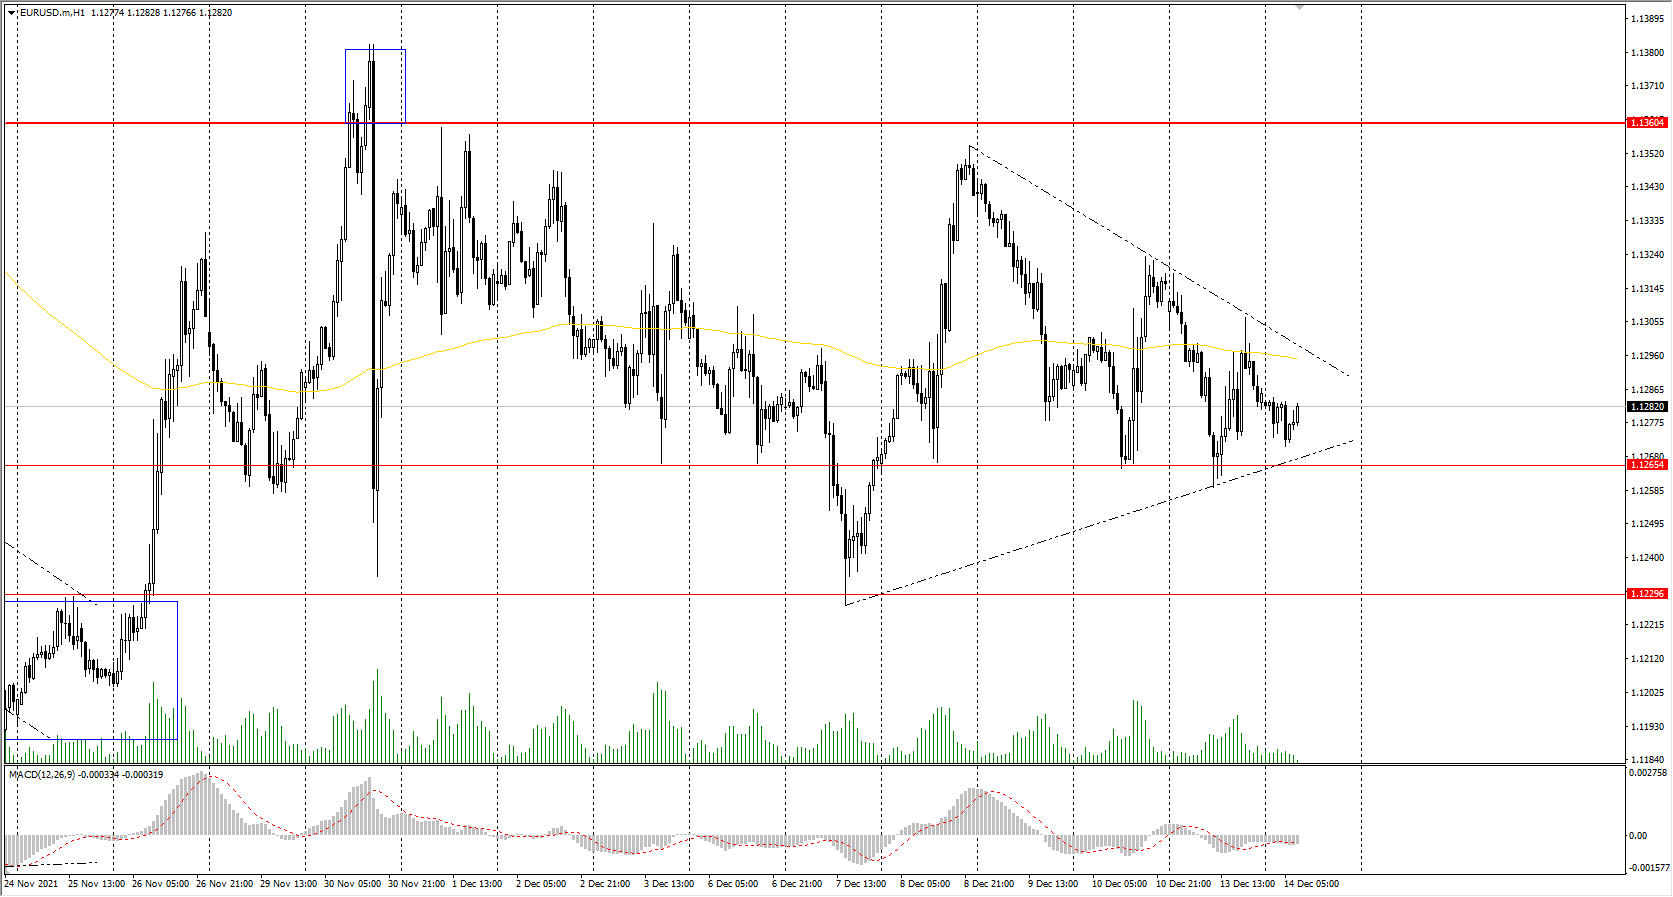
Support levels: 1.1265, 1.1230, 1.1168
Resistance levels: 1.1360, 1.1436, 1.1535, 1.1613, 1.1667, 1.1717
From a technical point of view, the EUR/USD on the hour time frame is still bearish. The price is trading in the corridor, and there is a narrowing of liquidity in the form of a pattern "triangle." The MACD indicator has become inactive. Under such market conditions, traders should consider sell positions from the priority change level of 1.1360 or if the price shows a true breakdown of the triangle pattern. Buy trades can be considered if the price shows a true breakout of the triangle pattern.
Alternative scenario: if the price breaks out through the 1.1360 resistance level and fixes above, the mid-term uptrend will likely resume.
News feed for 2021.12.14:
- Eurozone Industrial Production (m/m) at 12:00 (GMT+2);
- US Producer Price Index (m/m) at 15:30 (GMT+2).
The GBP/USD currency pair
Technical indicators of the currency pair:
Prev Open: 1.3256
Prev Close: 1.3211
% chg. over the last day: -0.34%
British Prime Minister Boris Johnson announced Monday that at least one person has died in the United Kingdom after contracting a variant of the Omicron coronavirus. Last week, Johnson asked the public to work from home and wear masks on public transport if possible. On Sunday, he urged the country to make booster vaccinations to prevent overburdening health services, warning that a new wave of cases was approaching. The UK will report today on the state of the labor market.
Trading recommendations
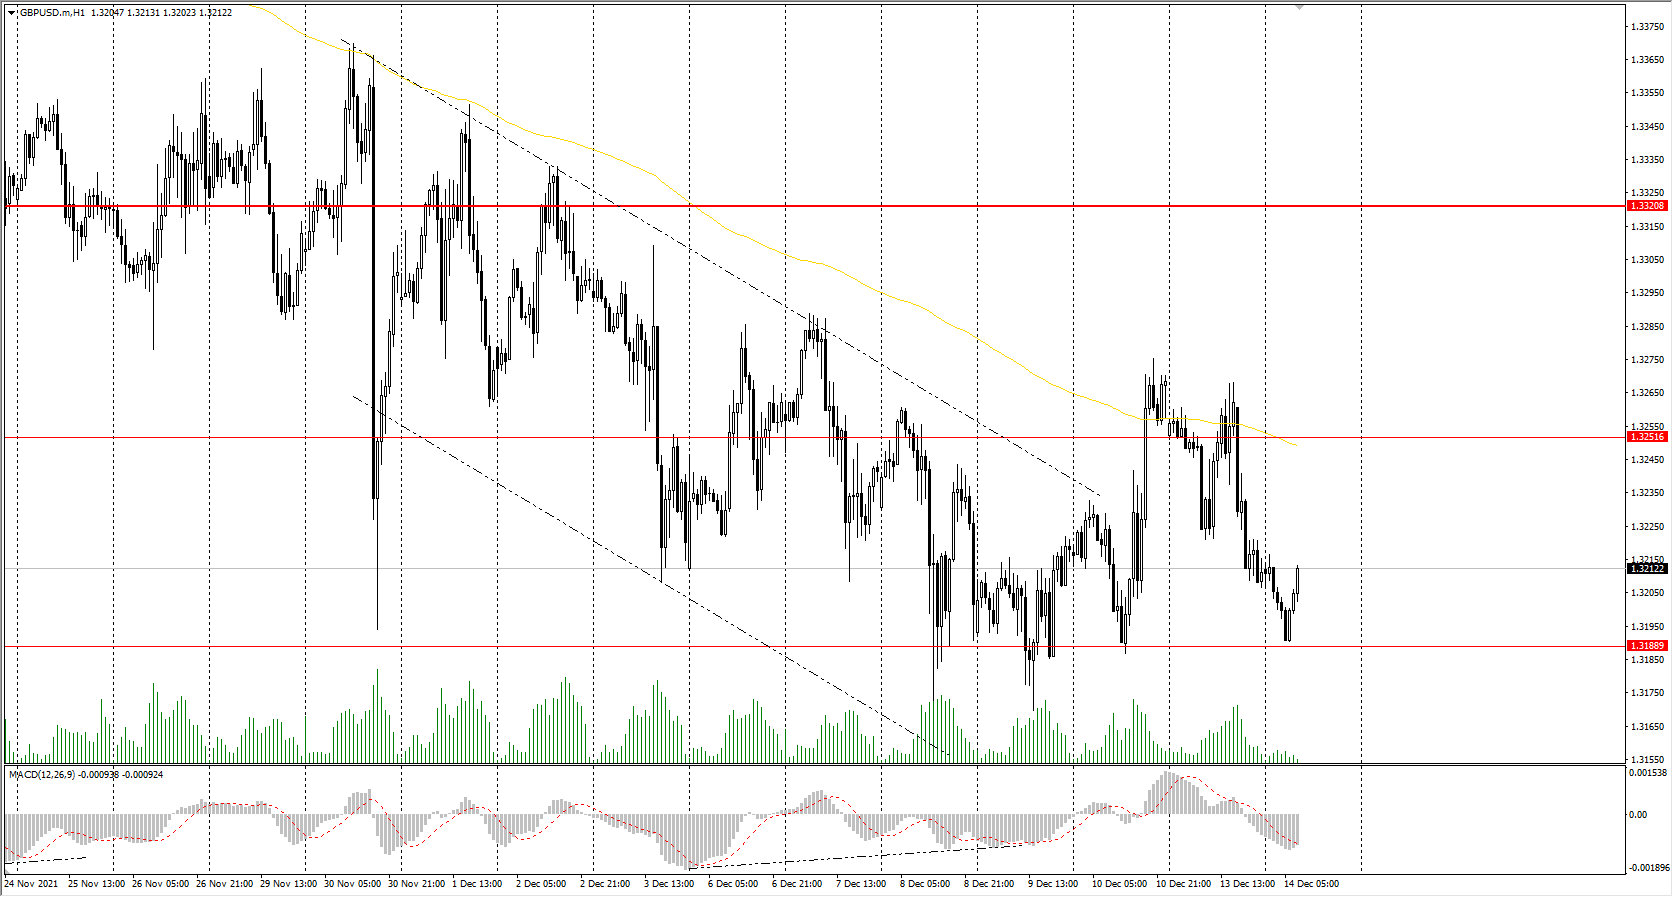
Support levels: 1.3188
Resistance levels: 1.3252, 1.3321, 1.3434, 1.3507, 1.3575, 1.3685
On the hourly time frame, the trend on GBP/USD is bearish. The MACD indicator is negative again. Under such market conditions, traders should consider sell positions from the resistance levels around the moving average. Buy trades should be considered from the support levels on lower time frames, but only with additional confirmation.
Alternative scenario: if the price breaks out through the 1.3321 resistance level and consolidates above, the bullish scenario will likely resume.
News feed for 2021.12.14:
- UK Average Earnings Index (m/m) at 09:00 (GMT+2);
- UK Average Earnings Index (m/m) at 09:00 (GMT+2);
- UK Unemployment Rate (m/m) at 09:00 (GMT+2).
The USD/JPY currency pair
Technical indicators of the currency pair:
Prev Open: 113.27
Prev Close: 113.57
% chg. over the last day: +0.26%
The situation with the Japanese Yen remains the same. Against the background of a large-scale economic stimulation by the central bank of Japan, the fundamental outlook for the yen looks gloomy. Meetings of the central banks of the USA and Japan will take place this week. If the Fed accelerates the reduction of the QE program and the Bank of Japan leaves its monetary policy unchanged, which is highly likely, USD/JPY quotes may return to a bullish trend.
Trading recommendations
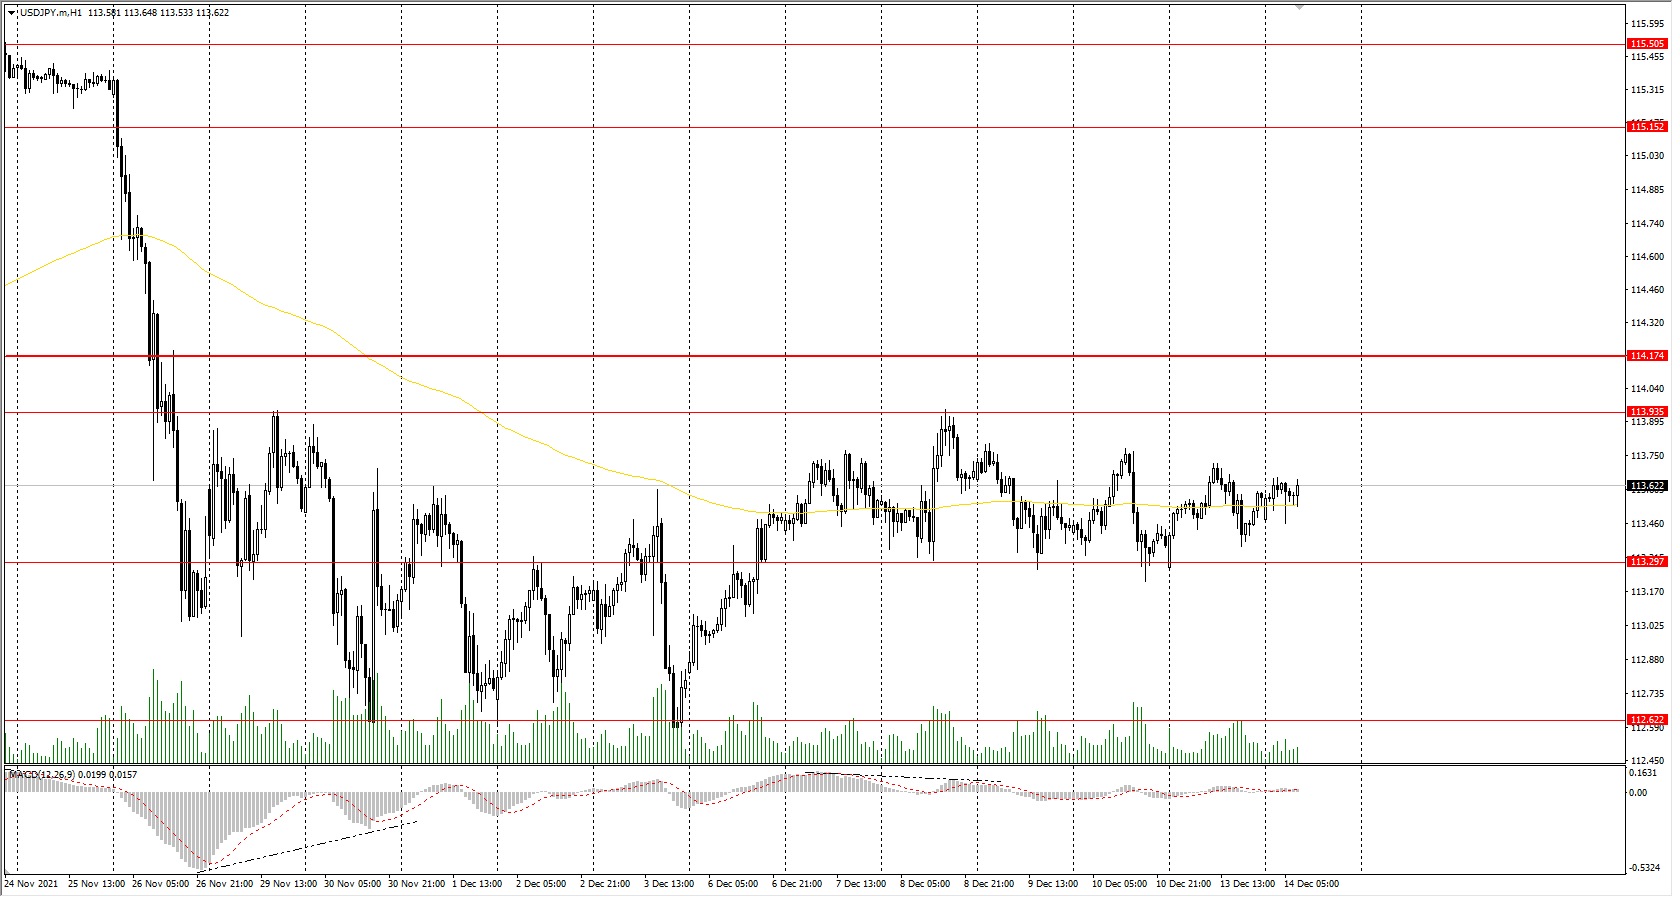
Support levels: 113.30, 112.62, 112.30
Resistance levels: 113.94, 114.17, 115.15, 115.50
The global trend on the USD/JPY currency pair is bearish. The price is trading in a wide corridor. The pressure of buyers is increasing, and the price is approaching the priority change level. Under such market conditions, traders can look for sell positions from the priority change level but with additional confirmation. Buy positions should be considered from the lower border of the corridor, but with additional confirmation in the form of a buyers' initiative or after the price breakout of the priority change level.
Alternative scenario: if the price rises above 114.17, the uptrend will likely resume.
News feed for 2021.12.14:
- Japan Industrial Production (m/m) at 06:30 (GMT+2).
The USD/CAD currency pair
Technical indicators of the currency pair:
Prev Open: 1.2724
Prev Close: 1.2808
% chg. over the last day: +0.66%
Crude oil prices fell on news of the first death in the UK from the Omicron strain and WHO warnings that Omicron poses a "very high" global risk because it is not vaccine-proof. The Canadian dollar is a commodity currency, so amid a decline in oil prices and a rise in the dollar index, USD/CAD quotes increased.
Trading recommendations
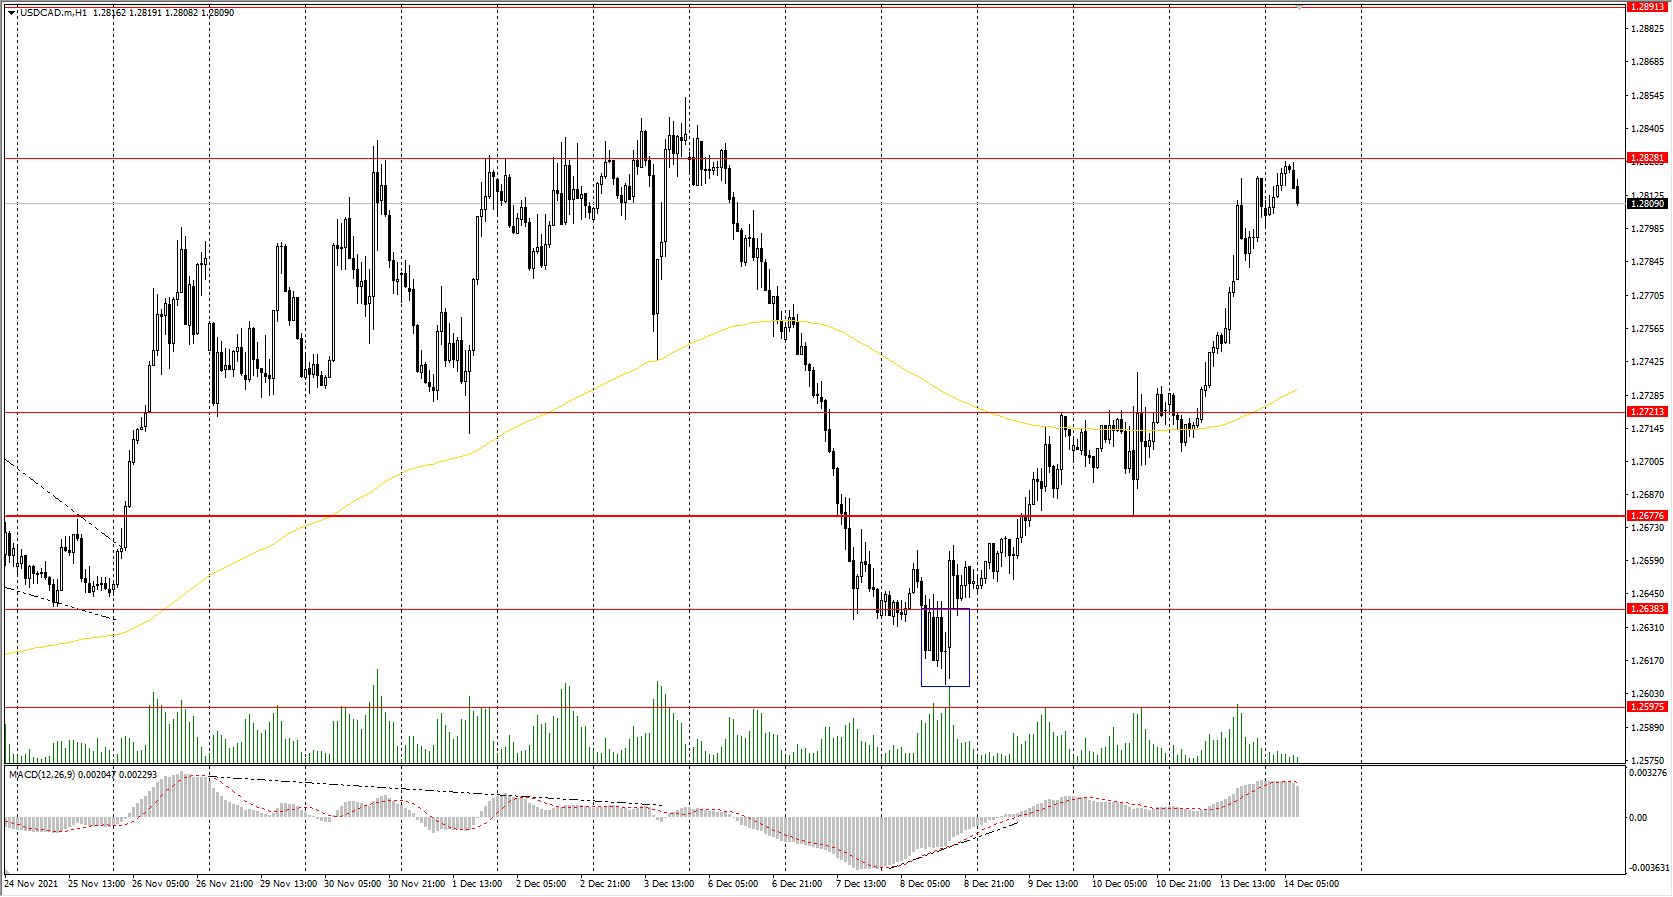
Support levels: 1.2776, 1.2721, 1.2677, 1.2638
Resistance levels: 1.2828
From a technical point of view, the trend of the USD/CAD currency pair has changed to bullish. Yesterday, the price broke through and consolidated above the priority change level. The MACD indicator became positive, and there are no signs of a reversal. Under such market conditions, it is better to look for buy deals from the support levels near the moving average. It is best to look for sell deals from the resistance levels of higher time frames.
Alternative scenario: if the price breaks down through the 1.2677 support level and fixes below, the downtrend will likely resume.
First Omicron Strain Death Increaed Uncertainty About Furhter Global Economic Recovery
The US stock markets fell sharply on Monday amid new concerns about the economic impact of the Omicron Covid-19 variant and in anticipation of a monetary policy update from the US Federal Reserve. Analysts are increasingly inclined to believe that the Fed will accelerate QE program cuts at its meeting tomorrow. The Dow Jones Industrial Average (US30) decreased by 0.89% yesterday, the S&P 500 (US500) fell by 0.9%, and the Nasdaq Composite (US100) lost 1.4%.
Meanwhile, the World Health Organization said Monday that Omicron poses a "very high" global risk because there is evidence that it is not vaccine-resistant.
European Union foreign ministers said Monday that any Russian aggression against Ukraine would have serious economic and political consequences for Russia.
European stock markets also closed lower yesterday. The British FTSE 100 (UK100) decreased by 0.8%, the German DAX (DE30) decreased by 0.01%, the French CAC 40 FR40 lost 0.7%, and the Spanish IBEX 35 (ES35) fell by 0.5%. Europe's energy crisis is getting worse. European natural gas futures increased to their highest level since early October amid growing concern that Russia's Nord Stream 2 pipeline will not work this winter. British Prime Minister Boris Johnson announced on Monday that at least one person had died in the United Kingdom after being infected with a variant of the Omicron coronavirus and warned that a new wave of cases was approaching. The Bank of England is likely to keep monetary policy unchanged at its meeting this week as the latest GDP data was disappointing, and in addition, authorities are imposing new restrictions to curb the spread of COVID-19. Germany has seen an acceleration in the pace of wholesale price growth. Analysts believe that amid rising inflation expectations, the ECB needs to tighten monetary policy in the region as soon as possible; otherwise, consumer prices will become even higher.
Crude oil prices, which increased about 8% last week, fell because of news of the first death in Britain from the Omicron variant and WHO warnings of a new global risk. With restrictions imposed in Europe and Asia, it is clear that Omicron will seriously hamper oil demand, especially before the holidays. Nevertheless, OPEC+ raised its global oil demand forecast for the first quarter of 2022.
Asian stock indices are falling because of new Omicron risks. Hong Kong's Hang Seng Index (HK50) decreased by 1.36%, also driven by lingering concerns about the health of China's real estate sector. Japan's Nikkei 225 stock index (JP225) decreased by 0.73%, and Australia's ASX 200 index (AU200) remained unchanged.
On Tuesday, the Asian Development Bank lowered its growth forecast for developing Asia this year to reflect risks and uncertainties stemming from a variant of the Omicron coronavirus. The Bank of Japan offered to bring a total of $97 billion to the markets by buying temporary government bonds over two days to counter rising short-term interest rates.
Main market quotes:
- S&P 500 (F) (US500) 4,668.97 −43.05 (−0.91%)
- Dow Jones (US30) 35,650.95 −320.04 (−0.89%)
- DAX (DE40) 15,621.72 −1.59 (−0.01%)
- FTSE 100 (UK100) 7,231.44 −60.34 (−0.83%)
- USD Index 96.35 +0.26 (+0.27%)
Important events for today:
- Japan Industrial Production (m/m) at 06:30 (GMT+2);
- UK Average Earnings Index (m/m) at 09:00 (GMT+2);
- UK Claimant Count Change (m/m) at 09:00 (GMT+2);
- UK Unemployment Rate (m/m) at 09:00 (GMT+2);
- Eurozone Industrial Production (m/m) at 12:00 (GMT+2);
- US Producer Price Index (m/m) at 15:30 (GMT+2);
- New Zealand RBNZ Gov Orr’s Speech at 21:00 (GMT+2).
GBPUSD Poised For A Bullish Reversal As Sideways Move Lengthens
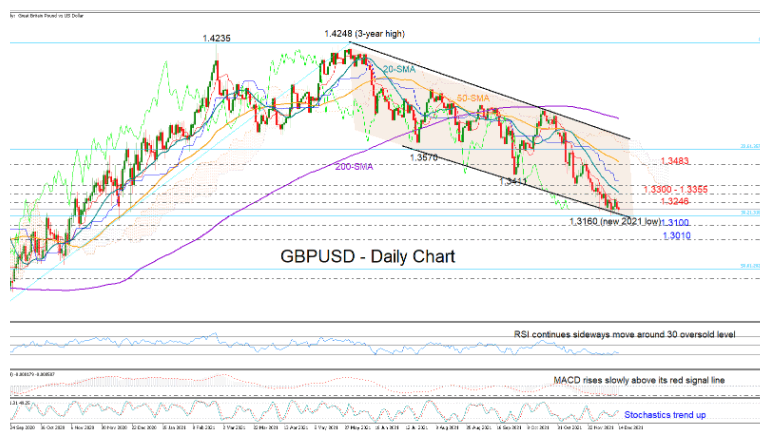
GBPUSD keeps trading indecisively at the bottom of the six-month-old bearish channel and close to its new 2021 low of 1.3160 for almost a week now.
The risk for an upside correction is elevated given the RSI’s prolonged presence around its 30 oversold level and the positive trajectory in the Stochastics, while the gradual recovery in the MACD is another encouraging signal that buying interest is growing.
The fact that the 38.2% Fibonacci retracement of the long-term uptrend from 1.1409 to 1.4248 is adding a floor under the price makes the area around 1.3160 an ideal place for a rebound. That said, for the bullish argument to gain credence, the market will probably need to initially close above the restrictive red Tenkan-sen line at 1.3246 and then surge beyond the 1.3355 - 1.3428 zone, where the 20-day simple moving average (SMA) is placed. If that is the case, the rally could see a sharp extension towards the 50-day SMA and the 1.3483 barrier.
In the event the bearish trend extends below the channel, traders may look for support near the 1.3100 and 1.3000 psychological levels before a more aggressive decline takes place towards the 50% Fibonacci of 1.2828.
In summary, although GBPUSD is maintaining a negative bias, the ongoing sideways move around the channel’s lower boundary increases the odds for an upside reversal, with traders waiting for a sustainable break above 1.3300 to raise exposure in the market.
EURJPY Bears Take A Breather Around 20-Day SMA
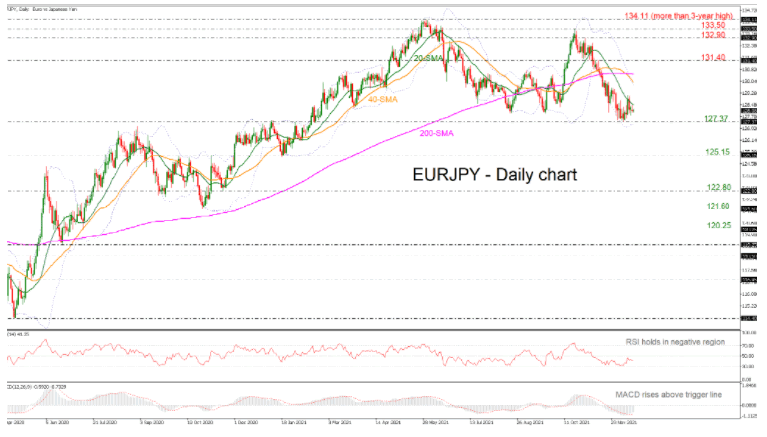
EURJPY opened the week on a neutral note, keeping its footing around the 127.37 level and near the 20-day simple moving average (SMA).
Trend signals remain slightly daunting as the price continues to trade below its simple moving averages (SMAs) and within the Bollinger bands. As regards the market momentum, some optimism seems to be building over an upside correction as the RSI has paused its downtrend and is pointing slightly up, while the MACD is heading above its trigger line in the negative region.
In the event the bulls take control, the immediate 20-day SMA currently at 128.45, will come first into view. A violation at this point may see another challenging battle around the upper Bollinger band and the 40-day SMA at 129.80. If buyers claim that zone this time, the 200-day SMA at 130.50 could immediately add some downside pressure, deterring a continuation towards the 131.40 resistance and 132.90.
Should the bears dominate, driving the price below the 128.00 number, the spotlight will shift to the crucial 127.37 support, where any step lower will put the pair in a bearish position in the medium-term picture, opening the door towards 125.15. The long-term outlook will also face a deterioration if the decline extends below the 122.80 mark.
In brief, although EURJPY continues to face unfavorable trend signals, the odds for an upturn seem to be growing, with the confirmation expected to come above the 200-day SMA at 130.45.
Employment Growth Holding Strong
Markets
Few data on the eco calendar and investors counting down to multiple upcoming central bank meetings was expected to cause cautious trading. European investors initially held to that script and regional equity indices even regained some ground. US investors were less confident. Headlines from across the world that the omicron variant is spreading fast and might need additional measures pushed equities into negative territory. It’s difficult for investors to reconcile omicron-related uncertainty with the Fed and other central banks accelerating efforts to arrest inflation. European indices closed about 0.25%/0.75% lower. US indices underperformed with the Nasdaq losing 1.39%. The risk-off again fueled the well-known flatting trends that already dominated trading for a while. US yields declined between -2.2 bps (2-y) and 7.8 bps (30-y) with the move solely due to lower inflation expectations. German yields also eased 0.1 bp (2-y) to 4.2 bps (30-y). At the -0.38% and 0.08% for the 10-y Bund and for the 10-y swap respectively, the technical picture again looks fragile. Despite the risk-off, intra-EMU spreads narrowed (slightly) further. Investors apparently are confident that bonds of these countries will continue to receive backing from ‘some kind of flexible’ post-PEPP regime. The dollar outperformed on risk-off but the intraday trajectory was a bit bumpy. The DXY index closed near 96.30 (from 96.10). EUR/USD dropped below 1.13, but with a close at 1.1284, damage could have been bigger. The yen didn’t really capitalize on its safe-haven status (close USD/JPY 113.54).
Asian equities join the risk-off repositioning in the US with Hong Kong underperforming, but losses are less than 1.0%. The dollar maintains gains, but with no further upward momentum (DXY 96.97, EUR/USD 1.1280). USD/CNY is holding near 6.3625. For now, the PBOC isn’t pushing for a further turnaround in the CNY strength.
There are no important data in EMU today. US NFIB small business confidence and November PPI are interesting but won’t change markets expectations for the outcome of the 2-day Fed policy meeting that will start later today. On interest rate markets, key question is how far the flattening trend will/can go. The Fed (in language and in dots) signaling a refocus on inflation and at the same time persistent uncertainty on the economic impact of omicron, suggests a real reversal in this trend isn’t around the corner. A flatter US yields curve, with relatively high short-term yields remains favorable for the dollar, especially as long as the ECB continues dragging its feet on inflation. EUR/USD 1.1186 and DXY 96.64/94 are next key levels on the charts. At the moment of writing, UK labour market data are reported solid with jobless claims declining further and employment growth holding strong, albeit slightly slower than expected. In November, the BoE earmarked progress in the labour market as key to start hiking but omicron also complicated this scenario. EUR/GBP is hovering up and down in a short-term 0.85/0.86 corridor.
News headlines
The Bank of England is reintroducing the countercyclical capital buffer for its biggest lenders. After cutting it to zero in March 2020 to support credit flows to the economy, the BoE would raise the buffer to 1% by December next year and to 2% in the second quarter of 2023, provided the economy continues to recover. The BoE said in its Financial Stability Report that “the decision reflects the fact that risks have returned to their pre-Covid level”, adding that major UK banks already have sufficient capital to meet the planned increase. The timing of the buffer’s reintroduction coincides with omicron sparking new uncertainty and the UK recording its first death just yesterday.
The Canadian government renewed the country’s central bank mandate for the next five years. The biggest official change from the 2016 version is that the BoC now formally has been given a license to moderately overshoot its 2% inflation target to support maximum sustainable employment. The mandate puts more emphasis on the use of the 1-3% control range in order to do so instead of exclusively aiming for the 2% over the BoC’s forecast horizon. In practice, however, it only formalizes what the central bank was implicitly already doing, the BoC and government later said. A major overhaul of the framework was studied but with inflation accelerating rapidly, benefits of doing so weakened. The Canadian dollar slipped yesterday (USD/CAD >1.28) but that was solely a risk-off result.
Daily Technical Analysis
EUR/USD
Current level - 1.1275
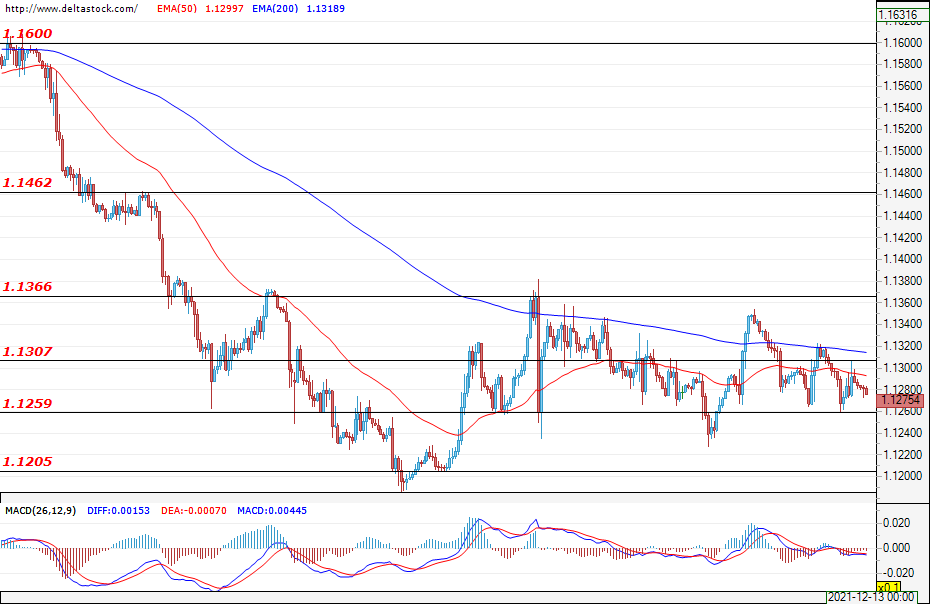
In the last two weeks, the currency pair has formed a range in the narrow channel between 1.1205 - 1.1366. At the time of writing, the single Еuropean currency is on the verge of testing the support zone at 1.1259, and a possible breach could give the bears the necessary incentive to test the main support at 1.1205. The consolidation is likely to continue while a number of economic news this week is expected to have a major impact on the market, with the most important one being the decision of the Federal Reserve to reduce the pace of its bond buying program.
| Resistance | Support | ||
| intraday | intraweek | intraday | intraweek |
| 1.1307 | 1.1460 | 1.1259 | 1.1205 |
| 1.1366 | 1.1500 | 1.1205 | 1.1180 |
USD/JPY
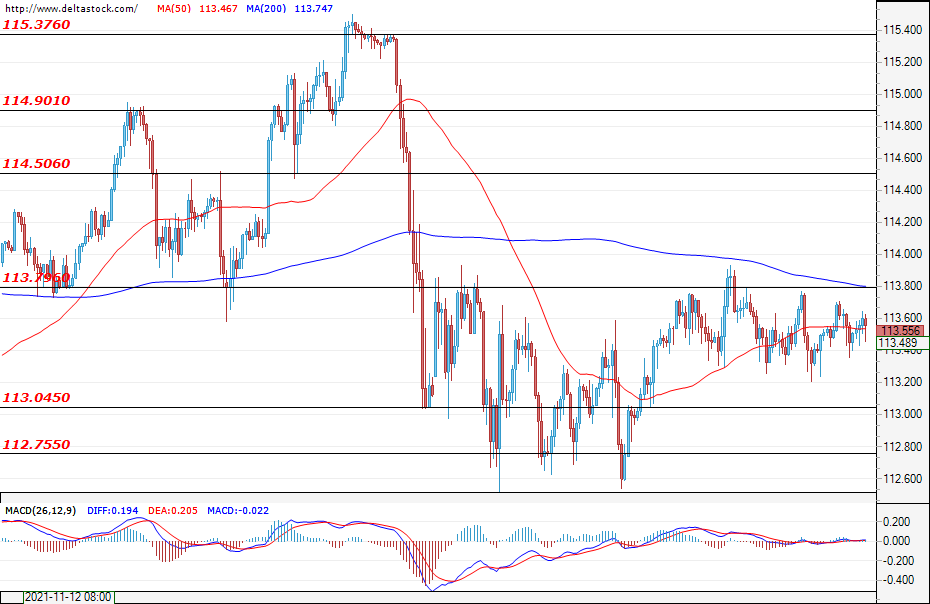
Current level - 113.55
The Ninja continues its movement within the range between 113.04 - 113.80 and, for now, neither the bulls nor the bears manage to prevail and take control. The appreciation of the U.S. dollar against the Japanese yen would lead to a test of the resistance at 113.80 as this is also the first significant zone ahead of the currency pair in the upward direction. On the other hand, in the downward direction, the critical support area is the level at 112.75. A breach of this level could give the bears a significant advantage, which, in turn, would lead the market towards the next significant support from the higher time frames at 110.80.
| Resistance | Support | ||
| intraday | intraweek | intraday | intraweek |
| 113.80 | 114.90 | 113.04 | 112.75 |
| 114.50 | 115.37 | 112.75 | 110.80 |
GBP/USD
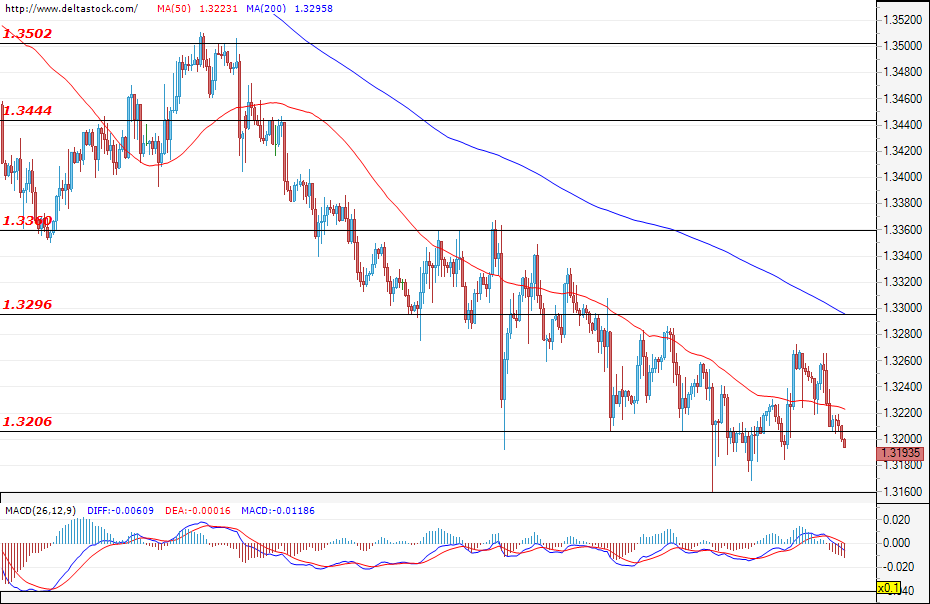
Current level - 1.3193
The bears managed to prevail during the last trading session, leading the price towards a test of the support zone at 1.3206 and, at the beginning of today's session, we witnessed a successful breach of the mentioned support. The breach cannot be confirmed just yet, but if the bears manage to maintain their control over the market, the sell-off might deepen towards the next significant support zone at 1.3100, followed by the zone at 1.2900 coming from the higher time frames.
| Resistance | Support | ||
| intraday | intraweek | intraday | intraweek |
| 1.3206 | 1.3360 | 1.3150 | 1.2900 |
| 1.3296 | 1.3440 | 1.3100 | 1.2800 |
DOW, NASDAQ, And S&P Retreat As Focus Shifts To The Fed
American equities declined sharply on Monday as investors started to refocus on the upcoming interest rate decision by the Federal Reserve. The Dow Jones shed more than 300 points while the S&P 500 and Nasdaq 100 index declined by 45 and 170 points respectively. At the same time, the yield of the 10-year government bond declined to 1.42%. Analysts expect that the Federal Reserve will tighten monetary conditions when it concludes its meeting tomorrow. This tightening will include increasing its tapering and signalling about interest rates.
The US dollar index rose slightly ahead of the upcoming US producer price index (PPI) data. Economists expect that the PPI number rose to a multi-decade high as the supply chain challenges continued. They expect that the headline PPI will rise to about 9.2% while the core PPI will rise to 7.2%. These numbers will come a few days after the US published strong consumer price index (CPI) data. Inflation rose to 6.8% in November, the highest level in decades. The PPI comes as the FOMC starts its meeting.
The British pound tilted lower as the market waits for the latest UK jobs numbers scheduled for this morning. Data compiled by Investing.com shows that analysts expect that the country’s unemployment rate declined to a pandemic-era low of 4.2%. Wages are also expected to have held steady in October. These numbers will come a day ahead of UK inflation numbers. The Bank of England will also start its meeting tomorrow.
EURGBP
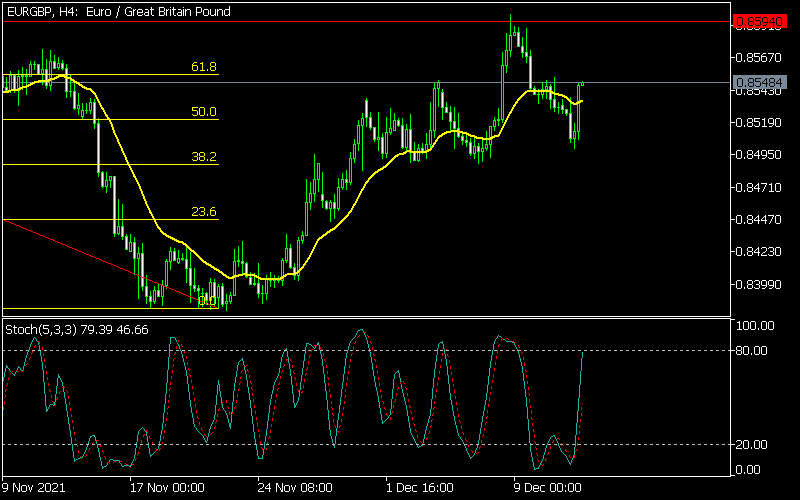
The EURGBP pair rose to an intraday high of 0.8547. On the four-hour chart, the pair has formed a head and shoulders pattern. The current rebound is part of the right shoulder. It has also moved slightly below the 23.6% Fibonacci retracement level. It is also slightly above the 25-day and 50-day moving averages while the Stochastic oscillator has moved higher. Therefore, the pair will likely have a pullback later today.
EURUSD
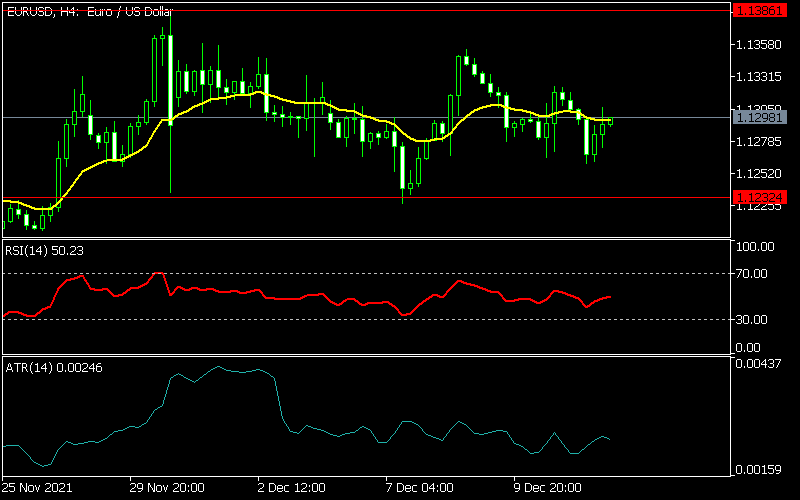
The EURUSD moved sideways as investors refocused on the upcoming Fed and ECB interest rate decisions. The pair is trading at 1.1296, which is along with the 25-day moving average. The Average True Range (ATR) is declining, which is a sign that there is no volatility. The Relative Strength Index is also at the neutral level of 50. Therefore, the pair will likely remain in this range today.
NDX100
The Nasdaq 100 index declined to a low of $16,152, which was lower than last week’s high of $16,422. On the four-hour chart, the index is slightly below the dots of the Parabolic SAR indicator. The MACD has moved slightly below the neutral line while the RSI is pointing lower. Still, the index will likely turn higher in the coming days.

FTSE 100 Another Leg Lower Is Expected To Take Place
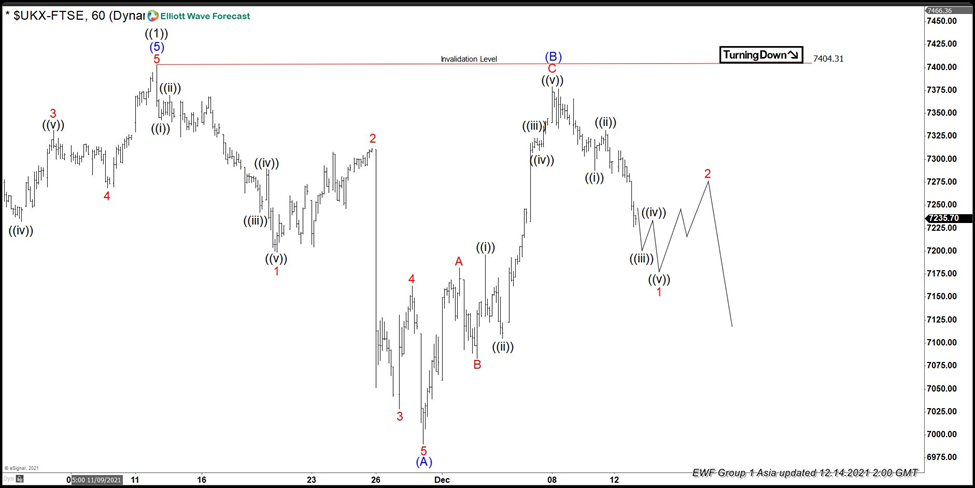
Short-term Elliott Wave view in FTSE suggests that the rally to 7404.31 high ended wave ((1)). Down from there, the index is doing a pullback in wave ((2)) to correct the cycle from the 10/28/2020 low before the upside resume. The internals of that pullback is unfolding as Elliott wave zigzag structure where initial decline to 7198.76 low ended wave 1. Then wave 2 ended at 7311.94 high, wave 3 ended at 7044.3 low. Wave 4 bounce ended at 7161.91 high and wave 5 ended at 6989.66 low thus ended the first leg in wave (A).
Up from there, the index made a short-term bounce in wave (B). The internals of that bounce also unfolded as a lesser degree zigzag structure where wave A ended at 7182.01 high. Wave B ended at 7083.21 low and wave C ended at 7378.92 high. Near-term, as far as bounces fail below 7378.92 high and more importantly below 7404.31 high the index is now expected to start the (C) leg lower. And expected to see more downside towards 6966.22- 6710.86 100%-161.8% Fibonacci extension area of (A)-(B). From there, the next leg higher is expected to take place or should produce a 3 wave bounce at least. Alternatively, if it breaks higher then the index might have done a running flat correction from the August peak.
FTSE 1 hour Elliott Wave chart