Sample Category Title
Market Morning Briefing: Aussie Has Bounced After Testing 0.71
STOCKS
Globally all equity indices fell sharply on Friday but is likely to recover a bit today as the fears of the new Covid variant seems to subside a bit. We may expect a short corrective move today but will need a close watch over the next few session to see if the bounce would sustain or give way to further bearishness in the coming days.
Dow (34899.34, -905.04, -2.53%) plunged due to news of new covid variant and concerns about its possible impact on the economy. A small corrective upmove can be seen today.
DAX (15257.04, -660.94, -4.15%) had fallen sharply too and has room to fall further towards 15200/15100 before we see a rise again.
Nikkei (28746.49,5.13, -0.018%) opened lower at 28335.61 and is now slowly rising up. Nikkei has to rise past 29000-29500 for the view to be bullish again. While below 29000, the danger of seeing a fall to 28000 cannot be negated.
Shanghai (3559.59, -4.50, -0.13%) has fasllen but is still trading above the crucial support at 3550. A bounce from the support can take the index up towards 3600. If the index falls below 3550, then a test of 3500 is possible in the coming sessions.
Nifty (17026.45, -509.80, -2.91%) fell sharply on Friday. The index managed to close above the crucial support at 17000 which can produce a bounce towards 17200/400 now. Failure to sustain above 17000 will make it vulnerable to medium term bearishness.
Sensex (57107.15, -1687.94, -2.87%) also fell sharply on Friday. The index has support at 57000 which if holds can produce a short bounce. Resistances can be seen at 58000/59000 above current levels.
COMMODITIES
Sharp fall was seen in commodities on Friday on fears of new variant of Covid likely to spread fast. But some recovery is seen today as prices bounce back from the last week’s lows. Brent and WTI need to hold above 70 and 68/67 respectively to keep the bullish momentum intact. Gold needs to break on either side of the 1780-1820 region to decide on further direction. Silver has support at 23 and 22 which may hold to produce an eventual bounce towards 24/25 in the medium term. Similarly, Copper also has supports at 4.25 and 4 from where a bounce looks possible towards 4.35/40.
News of new Covid variant on Friday sent Brent (75.92) down as market concerned about the demand in the coming weeks as prices fell in line but much faster than expected, breaking below 78/77. If 70 holds, we may expect a bounce back towards 80-82/83 in the near term else a break below 70 would indicate further bearishness for this week at least.
WTI (71.42) broke below our mentioned 75 to test 67.42 on the downside on Friday. Though we see a slight bounce today, we need to see if the bounce would sustain and take the prices higher or not.
Gold (1794.30) rose sharply from immediate support at 1780 to test 1817 but could not sustain and fell back to close at 1791. We need to see if Gold rises back to 1820 and breaks higher towards 1840 or falls back to break below 1780. Till then a ranged movement within 1780-1820 looks possible.
Silver (23.40) tested immediate support at 23 and if it breaks it can test more important support at 22 before bouncing back to higher levels of 24-25 again.
Copper (4.3540) has important support at 4.25 and can bounce back if the support holds. In case the price breaks below 4.25 (less likely), it can fall to 4 before reversing from there.
FOREX
Currencies have recovered from sharp decline seen on Friday. We need to see if the correction holds or we continue to see bearishness in the medium term. Dollar Index may rise higher again if it breaks above 96.5 and sustains higher in the near term. Euro needs to sustain above support at 1.12 to rise to 1.14/1.1450 before reversing again from there. EURJPY, Aussie and Pound can fall from current levels. USDCNY continues to be ranged within 6.39-4.37. USDINR holds above support at 74.60. We need to see if 75 or higher is tested in the near term.
Dollar Index (96.26) fell to 95.75 on Friday but has bounced back well and trades above 96 again today. While above 95.75/70, there is scope for a rise towards 97.50-98 on the upside but we need to see if the index attempts to test 96.50 or lower before rising higher from current levels. Watch price action to see if the index moves up again above 96.50 and sustains.
Euro (1.1277) rose to 1.13308 before falling off slightly from there. We may expect 1.12 to hold as a decent support just now and produce a bounce towards 1.14-1.1450 before falling from there to 1.12 or lower in the medium term.
EURJPY (128.10) has fallen sharply to re-test support at 128. A fall below 128 if seen could make it vulnerable to a sharp fall towards 126-125/124 on the downside. Watch price action at 128.
Aussie (0.7143) has bounced after testing 0.71. The Aussie can rise to 0.7250/75 on the upside before reversing from there in the medium term.
Pound (1.3333) may hold above 1.33 and see a corrective bounce to 1.34-1.3450 before a fall is again seen in the longer run back to 1.33 or lower. For now watch price action near 1.33.
Dollar-Yen (113.53) is holding above 113 for now and we need to see if t bounce sustains to take the index higher to 114 and above or falls below 113 to head towards 112/111 on the downside.
USDCNY (6.3847) continues to remain within 6.40/39-6.37 range mentioned last week. A break above 6.40, if seen can take the pair up to 6.42 else sideways consolidations could continue between 6.40/39 and 6.37.
{USDINR (74.8750) close at 74.8750 on Friday but the NDF rates shows 75.08 just now. We need to see if the spot opens and rises to 75 and higher or falls back towards 74.80/70. Note that 74.60 is now an important support below current levels.
INTEREST RATES
The US Treasury yields had declined sharply on Friday across tenors. The renewed fear in the markets on the new covid-19 variant has dragged the yields along with the equities. The Treasury yields have room to fall within the expected broad range. The German yields have also reversed sharply lower. The resistances have held very well as expected and a fresh fall is possible from here. The 10Yr and 5Yr GoI have come down and can see further downticks in the coming days.
The US 2Yr (0.55%), 5Yr (1.24%), 10Yr (1.54%) and the 30Yr (1.88%) have come down further sharply on Friday. The 10Yr has declined below 1.6% and can now test 1.5%-1.45% in line with our expectation. The 30Yr has already fallen into the 1.9%-1.85% region much faster than expected. It will have to be seen if it is bouncing back from 1.85% or extending the fall up to 1.75%. As mentioned on Friday, we expect the yields to be in the range of 1.45%-1.65% (narrow) / 1.35%-1.75% (broad) on the 10Yr and 1.75%-2.1%/2.2% on the 30Yr.
The German 2Yr (-0.78%), 5Yr (-0.65%), 10Yr (-0.34%) and 30Yr (0.01%) yields have declined further on Friday. This keeps our view of seeing a reversal and a fresh fall to -0.45% / -0.5% (10Yr) and -0.1% / -0.2% (30Yr). A strong rise past -0.2% (10Yr) and 0.10% (30Yr) is needed to negate the bearish view and in turn take the yields up to -0.1% (10Yr) and 0.2% (30Yr).
The Indian 10Yr GoI (6.3304%) has dipped and tested the 6.34%-6.32% region on Friday as expected. We reiterate that 6.3%-6.38% is the narrow range of trade for now and 6.3%-6.45% is a broad trading range (in case if 6.38% is broken). The bias remains bearish to break 6.3% and see a fall to 6.2% eventually.
The 5Yr GoI (5.6568%) has broken the 5.66%-5.75%/5.78 range on the downside as expected. While this break sustains, a further fall to 5.62%-5.61% is likely in the coming days.
Eco Data 11/29/21
[php_everywhere instance="1"]
Forex and Cryptocurrency Forecast
EUR/USD: Panic Named B.1.1.159
The past week can be divided into two parts: before and after Thanksgiving. Let us remind you that the day Thursday, November 25 was a day off in the United States. And since the lion's share of capital is controlled by banks and funds located in this country, the lull comes in financial markets around the world on this day.
So, what happened before November 25? And there was everything, as predicted by most experts. Divergence in the economic growth of the US and the EU, as well as in the monetary policy of the FRS and the ECB, the energy crisis in Europe continued to push the EUR/USD pair further down. The reanimation of the Brexit theme contributed to its fall. As a result, the pair reached a local bottom at 1.1185 on the evening of November 24. This was followed by holiday Thursday and… the markets woke up on Friday.
And they not just woke up but woke up panicked by the news that a new dangerous strain of coronavirus has been discovered in South Africa that may be insensitive to existing vaccines. WHO convened an urgent meeting, noting that almost 100 cases of infection with the new strain B.1.1.159, which has a "large number of mutations", have already been recorded.
Against the backdrop of this alarming news, investors' expectations for an early increase in the Fed's interest rate went down, and pessimism, on the contrary, rose. According to experts from CME Group, if the likelihood that the rate will remain unchanged until June 2022 was 18% on Thursday, it rose to 34% on Friday.
Compared to November 24, the yield on 10-year Treasuries dipped by almost 10%. Stock indices and cryptocurrency quotes flew down. The markets began to run away from risks. Investor panic and falling US Treasury yields helped EUR/USD bulls to raise the pair to 1.1321, where it ended the working week.
In fact, it is difficult to predict to which of the American or European economies the new wave of coronavirus may do more harm. According to ING Group analysts, it is now important to understand whether the new COVID strain has already reached Europe (which is geographically closer to Africa). This could further worsen sentiment in the Eurozone and put pressure on the euro.
The difference in the monetary policy of the Fed and the ECB will undoubtedly continue to influence the behavior of the EUR/USD pair. Several representatives of the European regulator have recently made it clear that the central bank intends to complete the Pandemic Emergency Purchase Program (PEPP) in March 2022. The pair barely reacted to these comments. But the meeting of the ECB Governing Council on December 2, dedicated to monetary policy, may become the main event of the coming week. Markets expect not just words and hints, but specific decisions on the timing of the completion of the emergency PEPP program and adjusting the volumes of the main Asset Purchase Program (APP), QE analogue. Moreover, the volume of APP can be increased to compensate for the folding of PEPP. It is also possible that the regulator will raise inflation forecasts for 2021-2023.
It is logical to assume that the Fed's hawkish policy and the dovish policy of the ECB will continue to push the EUR/USD pair south in the coming months. Goldman Sachs experts predict that the key USD rate will rise in June, September and December 2022, and the Fed will increase the volume of QE reduction to $30 billion per month starting from January. The rate may be raised twice more in 2023 and will reach 1.5%. The ECB, on the other hand, plans for 2023 to take only the first step. Until then, it will be easy to watch record price growth in the Eurozone countries.
However, it is possible that the December 02 meeting of the Governing Council of the European regulator will bring investors some hawkish surprises. Therefore, the most cautious of them will begin to close short positions in advance, fixing profits, which in the short term will lead to further growth in EUR/USD.
35% of experts who vote for the growth of this pair in the coming week agree with this development. The opposite position is taken by 55% of analysts who believe that the ECB will not make any significant changes to its monetary policy now. The remaining 10% vote for the sideways trend.
Indicators on D1 have a predominantly red color. There are 75% of them both among oscillators and among trend indicators. As for the oscillators, 15% give signals that the pair is oversold, and another 10% have taken a neutral-gray position. As for trend indicators, 25% changed from red to green by the end of the week.
Resistance levels are located in the zones and at levels 1.1300-1.1315, 1.1360, 1.1435-1.1465 and 1525. The nearest support level is 1.1300, then 1.1230, 1.1185-1.1200, then 1.1075-1.1100.
As for the events of the coming week, apart from the ECB meeting, the publication of numerous statistics on the consumer markets of Germany and the Eurozone should be noted. These data will be released on November 29 and 30, December 01 and 03. As for the US, we are expecting a speech by the head of the Fed, Jerome Powell, who held this post for a second term, on Tuesday, November 30, the ADP report on the level of employment in the US private sector and the ISM Manufacturing PMI will be published on Wednesday December 01. And investors traditionally wait for data from the American labor market on the first Friday of the month, including such an important indicator as the NFP: the number of new jobs created outside the US agricultural sector.
GBP/USD: Pound Rescue Is in the Rate Growth
The GBP/USD pair also followed the forecast of the overwhelming majority (75%) of experts until Friday, November 26, falling to 1.3275, the lowest point for the last 5 months. The last chord of the week sounded at 1.3350.
Concerns about Brexit remain the main factor of pressure on the pound. Lord David Frost, the UK minister responsible for implementing the EU deal, said that while there was a desire to find a negotiated solution to the Northern Ireland problem, the gap between the positions of the UK and the EU was very large. The British Government is therefore prepared to use article 16.
As a reminder, the Northern Ireland Protocol was signed two years ago as part of the treaty on the withdrawal of the United Kingdom from the European Union. According to London's statements, it was precisely because of the shortcomings in this document that the country faced supply disruptions and a shortage of goods. For this reason, the British government offered Brussels a new version of the protocol, which European officials saw with hostility.
As for article 16 of the current document, it allows either party to unilaterally take "protective measures" in the event that the protocol leads to "serious economic, social or environmental problems" that persist for a long time.
Fears about a new strain of COVID, which caused investors to flee from risks, are also unlikely to help the British currency. Yes, the GBP/USD pair grew slightly on Friday due to the general weakening of the dollar (the USD DXY index fell to 96.037). But the pound has long been considered a riskier asset than the dollar. And expectations about the increase in interest rates were revised by the market not only in relation to the American, but also the British currency.
Threats of recession and stagflation, combining weak GDP growth and high inflation, are very dangerous for the British economy. According to forecasts of experts from the Bank of England, the annual inflation rate will accelerate to about 5% by April 2022 and will decrease to the target level of 2% as late as by the end of 2022.
These are very high rates, and shortly before the meeting of the Bank of England on November 4, its head Andrew Bailey said that with such indicators, it may be necessary to raise interest rates more quickly than planned. The markets believed that the regulator would raise the key rate in November, and... they were deceived. The Bank of England did not raise the rate, and the GBP/USD pair went further down. And Andrew Bailey told disappointed investors that "we never promised a November rate hike" and that "it's not my job to rule the markets."
Now, in addition to all other worries, there are also concerns about a new wave of the pandemic and the impact of the B.1.1.159 strain on the country's economy. And we are talking about raising the Bank of England rate not in November, but in December. And this is not at all great: while the probability of a rate hike by 15 basis points was estimated at 75% on Wednesday, November 24, then it fell to 55% two days later.
If, following the results of the December meeting, the British regulator still raises the rate, this will push the GBP/USD pair up. 70% of analysts hope so. As for the next week, their opinions are divided equally: 50% expect growth from the pair, 50% expect a fall.
But the indicators on D1 clearly support the bears. 100% of trend indicators point to the south. The same could be said about the oscillators, but 15% of them have reached the oversold zone.
Support levels are 1.3300, 1.3275, 1.3200, the target of the bears is 1.3135. The resistance levels and targets of the bulls are 1.3410, 1.3475, 1.3515, 1.3570, 1.3610, 1.3735, 1.3835.
The head of the Bank of England will make a speech on Wednesday, December 01. Investors hope that Andrew Bailey will clarify the situation with what the future monetary policy of this regulator will be.
USD/JPY: Who Benefits from COVID: Yen Takes Revenge
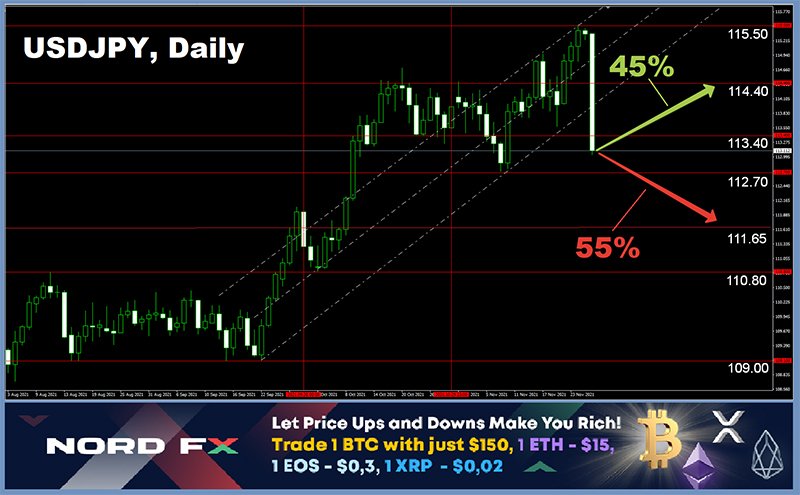
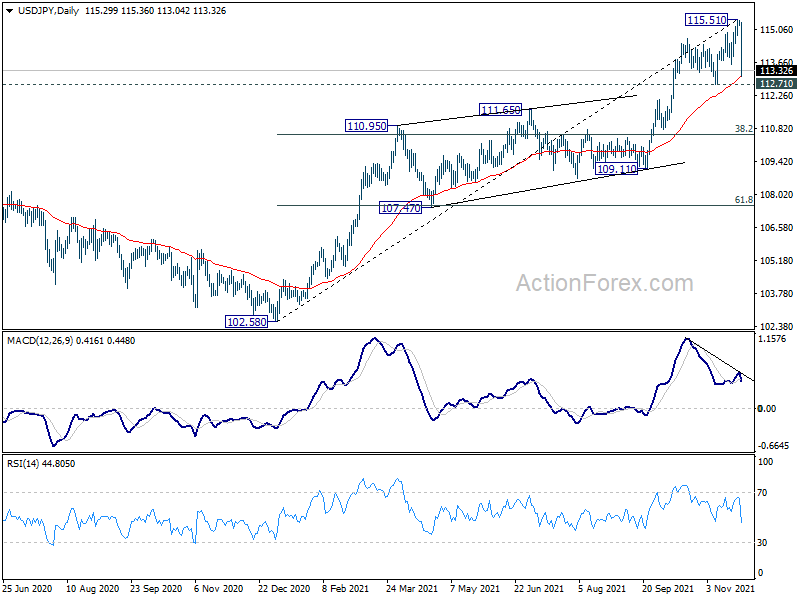
What is bad for risky assets, is good for the yen. This immutable rule worked this time too. The Japanese currency gained 230 pips in just one day, dropping the USD/JPY pair to 113.043. True, it once again renewed its multi-year highs two days earlier, on November 24, reaching a height of 15.514. The pair bulls were hoping this stellar rally would continue. But this didn't happen. We can only guess how many Stop-loss orders were knocked out after such a rapid reversal.
"This is a typical scenario: the flight of investors to the quality of the yen and the Swiss franc due to a new strain of the virus," analysts from Societe Generale explained the incident.
The USD/JPY pair completed the trading session at 113.112. And now there is an intrigue: whether it will return to the trading range 113.40-114.40 or continue falling.
There are slightly more supporters of further movement to the south among experts, 55%. The remaining 45% expect at least a correction in this direction if not returning to a full-fledged upward trend. The indicators do not have even the slightest hint of unity either. As for the oscillators, 25% are colored green, 40% are red, 20% give signals that the pair is oversold, and 15% have taken a neutral position. The trend indicators have the same discord: 50% of them point to the north, the same amount - to the south.
Resistance levels are 113.40, 114.00, 114.40, 114.70, 115.00 and 115.50, the long-term target of the bulls is the December 2016 high of 118.65. The nearest support level is 113.00, then 112.70, 112.00 and 111.65.
As for macroeconomic statistics, retail sales data are due Monday November 29, followed by labor market and industrial production data in Japan the next day.
CRYPTOCURRENCIES: Nobel Prize for Satoshi Nakamoto
We cited the opinion of specialists from the Kraken crypto exchange two weeks ago, according to which the BTC/USD pair could fall to $55,000. The cryptocurrency analyst Altsoin Sherpa called the same figure, $55,000. Another well-known journalist and expert, Willy Woo, cited a wider range from $50,000 to $60,000 as a reliable support. In addition, according to Willie Woo, bitcoin is not yet ripe for impulse growth and renewal of all-time highs.
Now, after a while, we can say that all these experts were generally right: the main cryptocurrency was moving, relying on support in around $55,500 and fixing the local maximum at $60.030 for all the following days, until Friday, November 26. And there was a panic in the markets on Friday. Frightened by the new strain of COVID, investors began to get rid of risky assets, including cryptocurrencies.
The total capitalization of the crypto market fell to $2.460 trillion ($2.590 trillion a week ago). And the Crypto Fear & Greed Index has risen from the fear zone to the center of the scale, up to 47 points. The BTC/USD pair was trading in the $54,350 zone at the time of this writing, on the evening of November 26, having found a local bottom at $53,600 before that.
A report by analyst firm Glassnode (which was released before November 26) showed that the market is not showing massive profit-taking. Analysts point out that the total supply of short-term bitcoin holders is at a multi-year low below 3 million BTC. This, in turn, means that the amount held by long-term holders is at a multi-year high. At the same time, they are constantly building up their positions. The total number of wallets with a non-zero BTC balance in the second half of November also reached an all-time high of 38.76 million.
The data obtained by Glassnode indicates that there are no signs of serious surrender, and that the flagship cryptocurrency may still have a rather long upward rally.
A similar opinion to Glassnode was expressed by the CEO of CryptoQuant Ki Young Ju. Despite the fact that bitcoin has been getting cheaper since the middle of last week, holders are in no rush to sell it. In parallel, there is a steady trend towards the withdrawal of cryptocurrency for autonomous storage. According to CryptoQuant, trading floors currently have the lowest amount of bitcoins since mid-2018.
Moreover, investors are withdrawing not only BTC, but also ethereum, which reduces the supply of the asset and eases the pressure on the market. In the long term, according to Ki Young Ju, this trend will drive the value of leading digital currencies upward.
A well-known trader and analyst known as Credible argues that the current correction of bitcoin is a necessity to continue the bullish trend and rise above $70,000. According to the expert, the first cryptocurrency is in the phase of a healthy correction at the moment.
The bitcoin price may fall to $52,000-53,000 in the near future, where the bottom of the current correction is located, Credible predicts. According to him, the $69,000 mark that bitcoin reached on November 10 cannot be the top of the current bull market, as historically each subsequent cycle of growth has lasted longer than the previous one.
Chief commodity strategist of Bloomberg Intelligence Mike McGlone, as well as Willy Woo, believes that the main support is slightly lower, at $50,000. At the same time, according to the expert, bitcoin will continue to grow in 2022, where it will face strong resistance around $100,000.
Founder of Skybridge Capital investment company Anthony Scaramucci expects that the flagship cryptocurrency "will eventually eclipse gold", and its price will easily reach $500,000. "I think bitcoin is likely to be ten times better than gold... I would not be surprised if bitcoin grows exponentially and gold grows in line," said Anthony Scaramucci.
Mike Novogratz, CEO of investment firm Galaxy Digital Holdings, echoed him saying that gold "was just crushed by bitcoin."
The same target level for BTC, $500,000 was named by the CEO of ARK Invest Katie Wood, confirming her previous forecast. True, at the same time, she made a reservation that such a price could be achieved provided that institutional investors allocate 5% of their portfolios for bitcoin.
So far, 5% is out of the question. Indeed, the interest in digital assets among big business representatives is growing. So, over a quarter of super-wealthy families around the world have already invested in cryptocurrencies. This is evidenced by the results of a survey of the British consulting company Campden Wealth, conducted among representatives of 385 family offices. The average capital managed by such offices is estimated at $1.6 billion.
31% of wealthy households in North America and 28% in Europe invest in cryptocurrencies, while this share is lower in the Asia-Pacific region, 19%. But at the same time, the share of cryptocurrencies in the portfolios of billionaire families is on average only 1%. The majority of those surveyed (68%) said they plan to keep the volume of crypto investments at the current level next year, 28% are going to increase them, and only 4% are going to reduce them.
And at the end of the review, news for Satoshi Nakamoto fans. According to Daniel Leon, COO of the crypto platform Celsius Network, the creator of bitcoin should receive the Nobel Prize in Economics for this invention. "This guy [Nakamoto] has brought hundreds of thousands of people more financial benefits than the bulk of economists in academia," said Daniel Leon.
Now the little thing to do is to find out if Nakamoto really existed. After all, the Nobel Committee is unlikely to decide to reward a person who has never existed...
EUR/USD Weekly Outlook
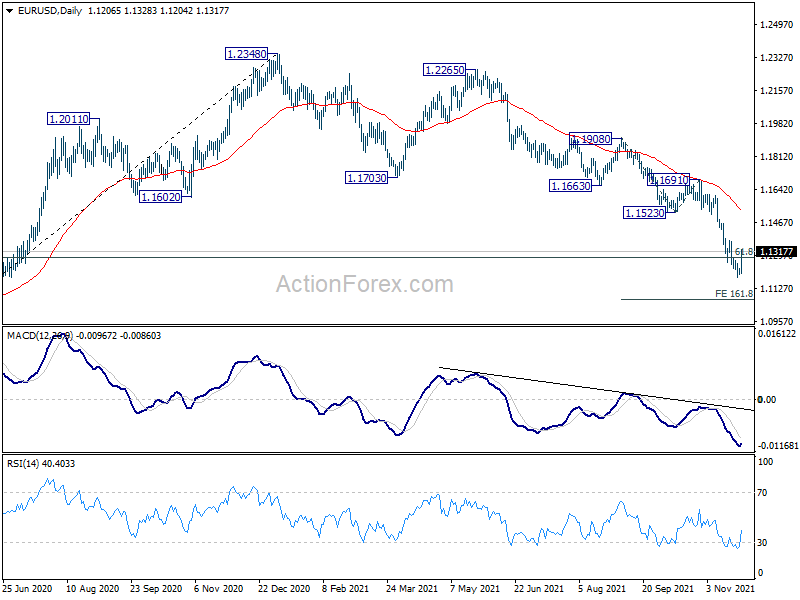
EUR/USD's decline continued last week and hit as low as 1.1185. But as a temporary low was formed, initial bias is neutral this week first. Further decline is still in favor as long as 1.1373 resistance holds. Break of 1.1185 will target 161.8% projection of 1.1908 to 1.1523 from 1.1691 at 1.1068 next. However, firm break of 1.1373 will indicate short term bottoming and turn bias back to the upside for stronger rebound.
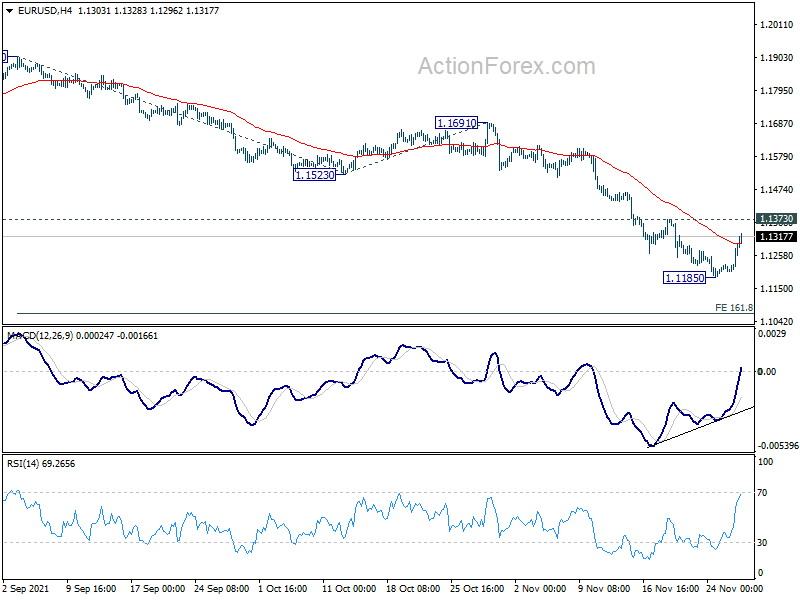
In the bigger picture, there are various ways of interpreting the fall from 1.2348 (2021 high). It could be a correction to rise from 1.0635 (2020 low), the fourth leg of a sideway pattern from 1.0339 (2017 low), or resuming long term down trend. In any case, outlook will now stay bearish as long as 1.1703 support turned resistance holds. Sustained break of 61.8% retracement of 1.0635 to 1.2348 at 1.1289 would pave the way back to 1.0635.
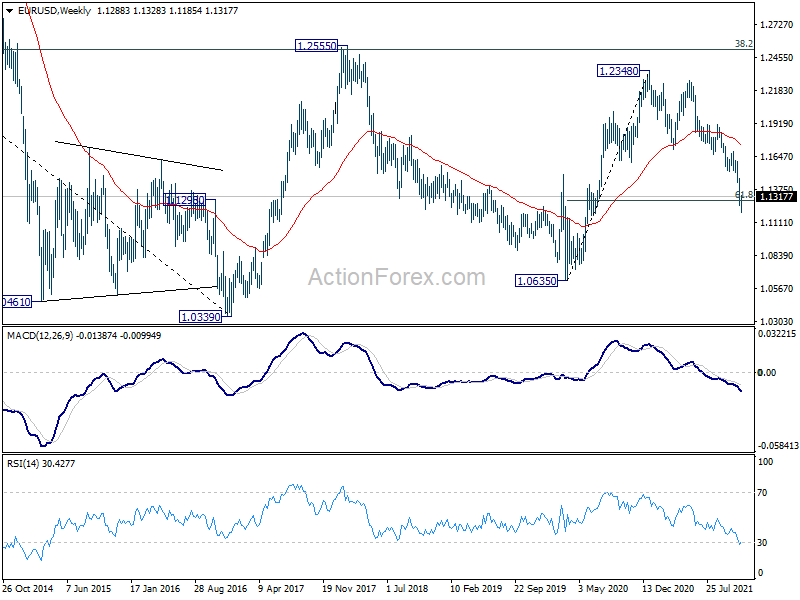
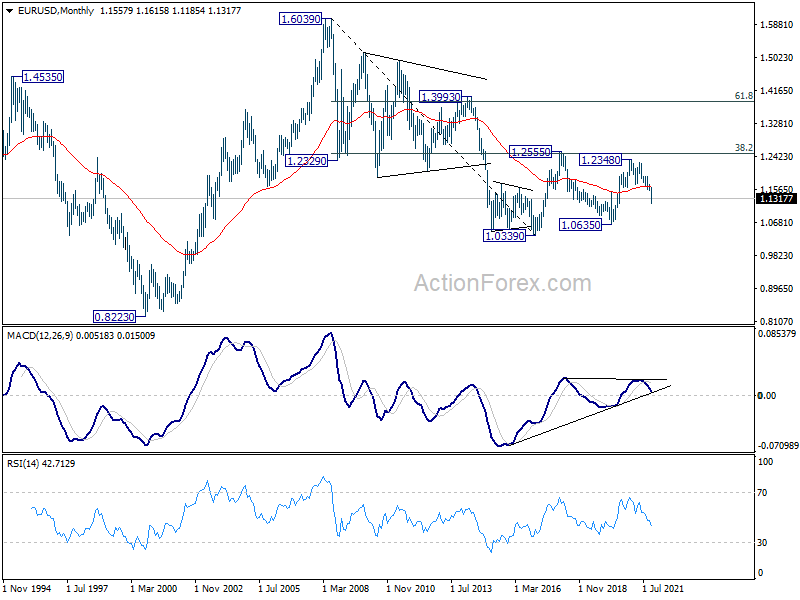
In the long term picture, EUR/USD has possibly failed 1.2555 cluster resistance (38.2% retracement of 1.6039 to 1.0339 at 1.2516) again. Long term outlook will remain neutral as sideway pattern from 1.0339 (2017 low) is extending with another medium term fall. For now, we'd hold back from assessing the chance of downside breakout, and monitor the momentum of the decline from 1.2348 first.
USD/JPY Weekly Outlook
USD/JPY edged higher to 115.51 last week but subsequent sharp fall indicates that a short term top is at least formed. Initial bias is now on the downside this week for 112.71 support first. Sustained break there will argue that it's already correcting whole rise from 102.58. Deeper fall would be seen to 38.2% retracement of 102.58 to 115.51 at 110.57. For now, risk will stay on the downside as long as 115.51 resistance holds, in case of recovery.
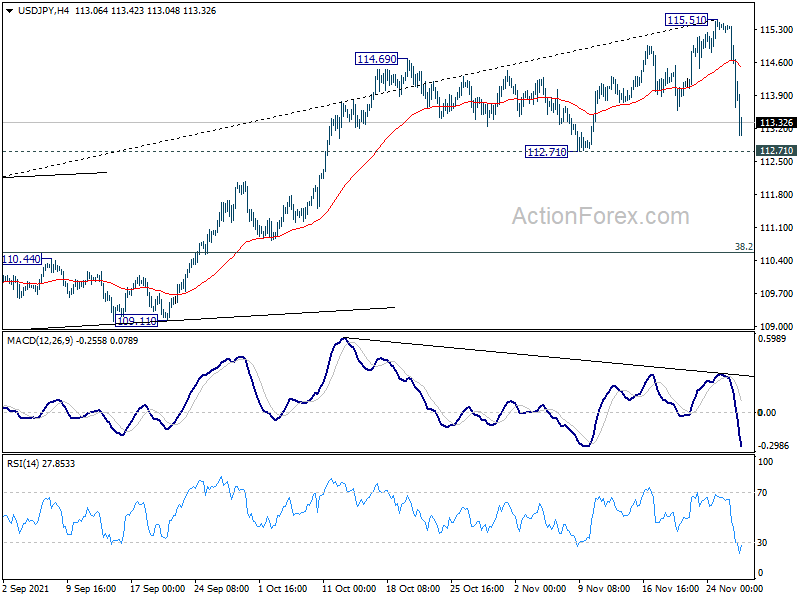
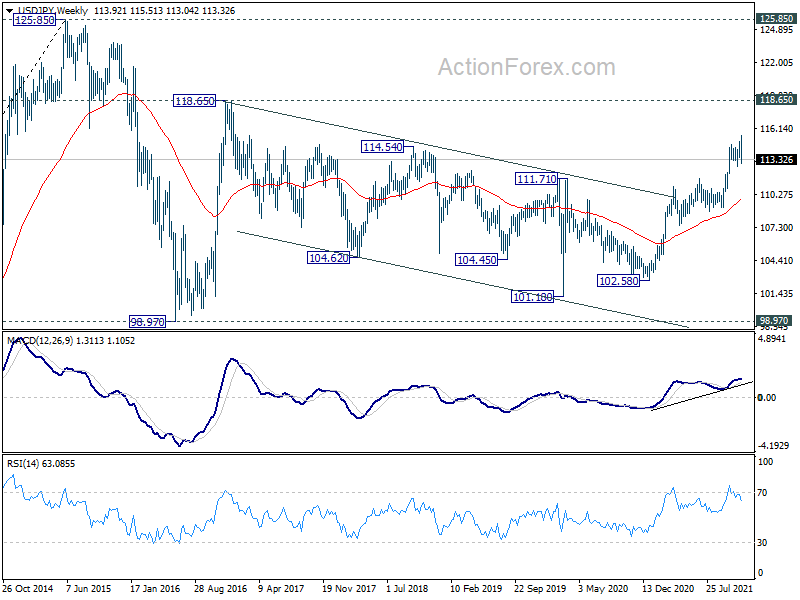
In the bigger picture, no change in the view that rise from 102.58 is the third leg of the up trend from 101.18 (2020 low). Such rally should target a test on 118.65 (2016 high) on resumption. However, firm break of 109.11 structural support will argue that the trend might have reversed and bring deeper fall to 107.47 support and possibly below.
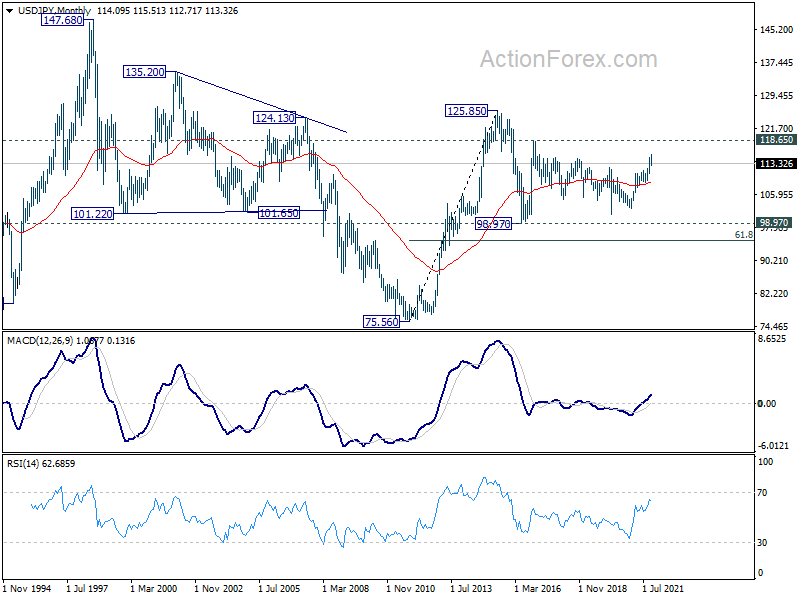
In the long term picture, the rise from 75.56 (2011 low) long term bottom to 125.85 (2015 high) is viewed as an impulsive move, no change in this view. Price actions from 125.85 are seen as a corrective pattern which could still extend. In case of deeper fall, downside should be contained by 61.8% retracement of 75.56 to 125.85 at 94.77. Up trend from 75.56 is expected to resume at a later stage for above 135.20/147.68 resistance zone.
GBP/USD Weekly Outlook
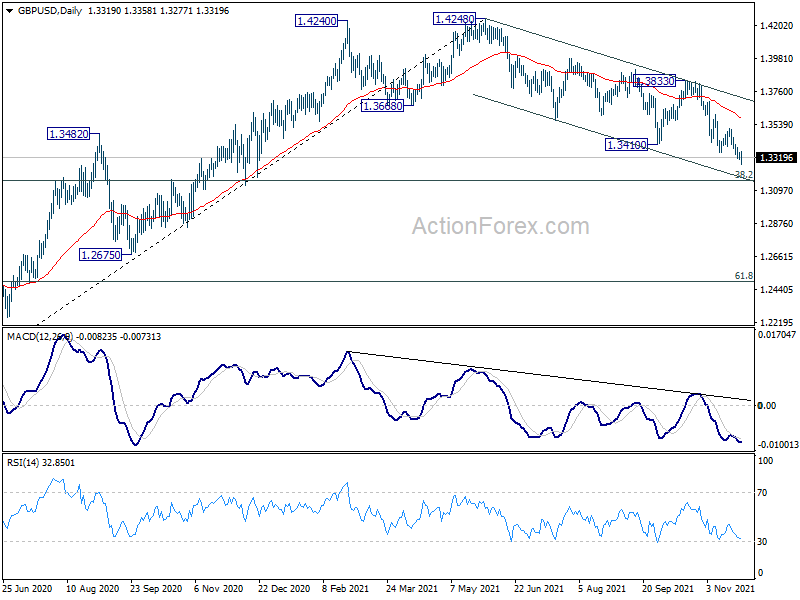
GBP/USD's decline continued last week and hit as low as 1.3277. As a temporary low was formed, initial bias is neutral this week for consolidations first. Upside of recovery should be limited below 1.3512 resistance to bring another fall. Break of 1.3277 will resume the decline from 1.4248 to 1.3164 fibonacci level next.
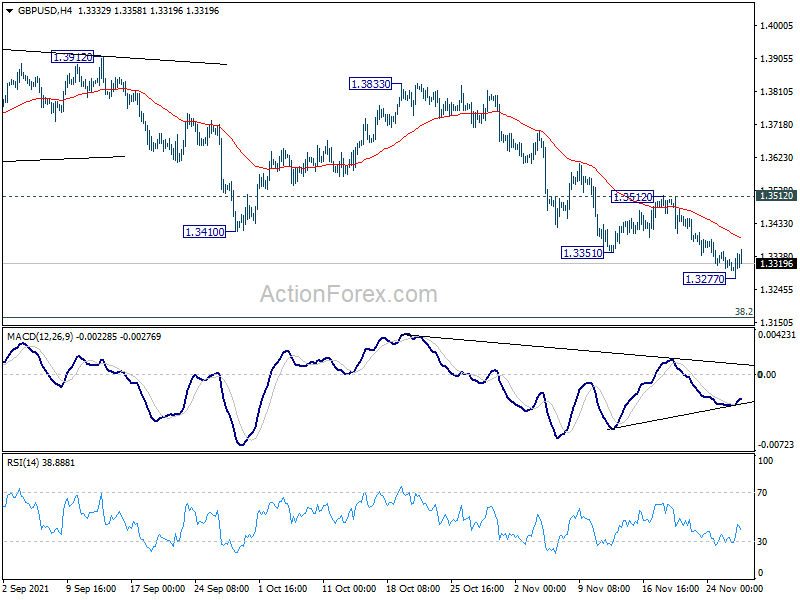
In the bigger picture, the structure of the fall from 1.4248 suggests that it's a correction to the up trend from 1.1409 (2020 low) only. While deeper fall cannot be ruled out yet, downside should be contained by 38.2% retracement of 1.1409 to 1.4248 at 1.3164, at least on first attempt, to bring rebound. On the upside, break of 1.3833 resistance will argue that the correction has completed and bring retest of 1.4248 high. However, sustained trading below 1.3164 will revive some medium term bearishness and target 61.8% retracement at 1.2493.
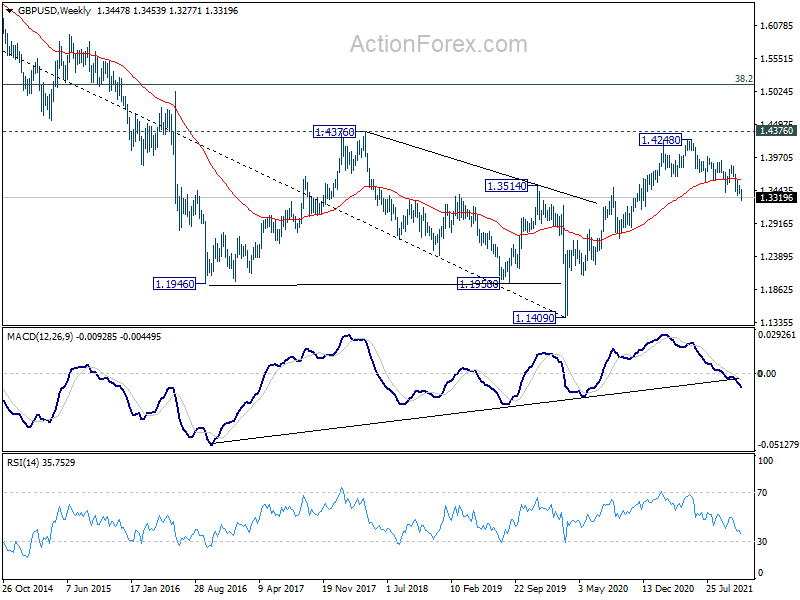
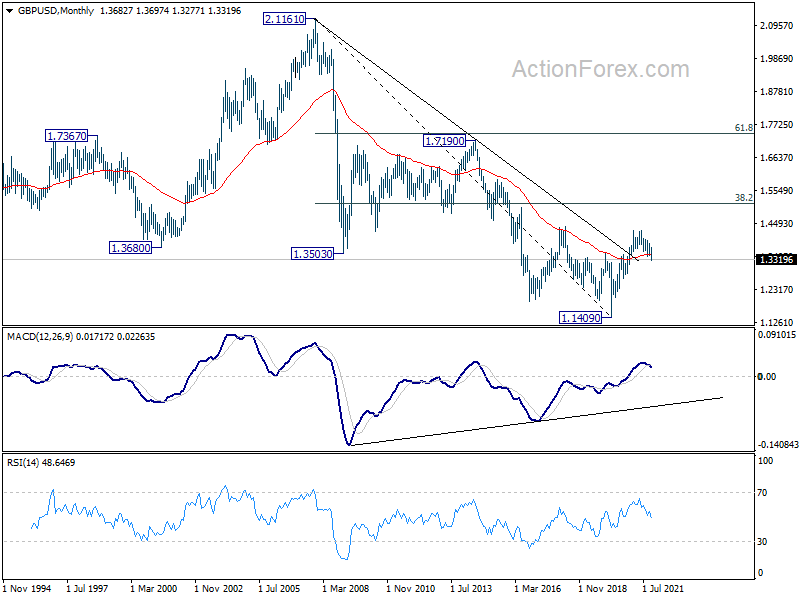
In the longer term picture, a long term bottom should be in place at 1.1409, on bullish convergence condition in monthly MACD. Rise from there would target 38.2% retracement of 2.1161 to 1.1409 at 1.5134. Reaction from there would reveal whether rise from 1.1409 is just a correction, or developing into a long term up trend.
USD/CHF Weekly Outlook
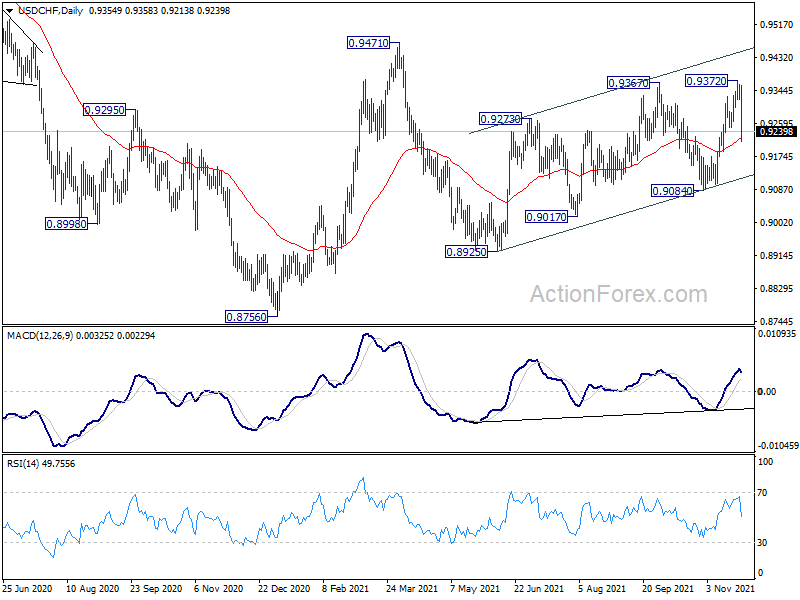
USD/CHF edged higher to 0.9372 last week but reversed and dropped sharply from there. Initial bias remains on the downside this week for 0.9084 support first. Firm break there will argue that choppy rise from 0.8925 has completed, and fall from 0.9471 is resuming. Deeper decline would be seen through 0.8925. For now, risk will stay mildly on the downside as long as 0.9372 resistance holds, in case of recovery.
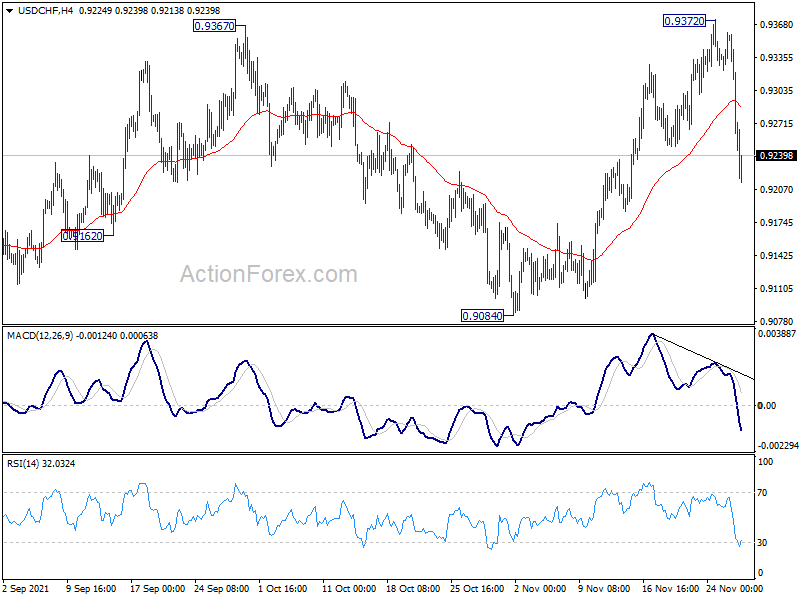
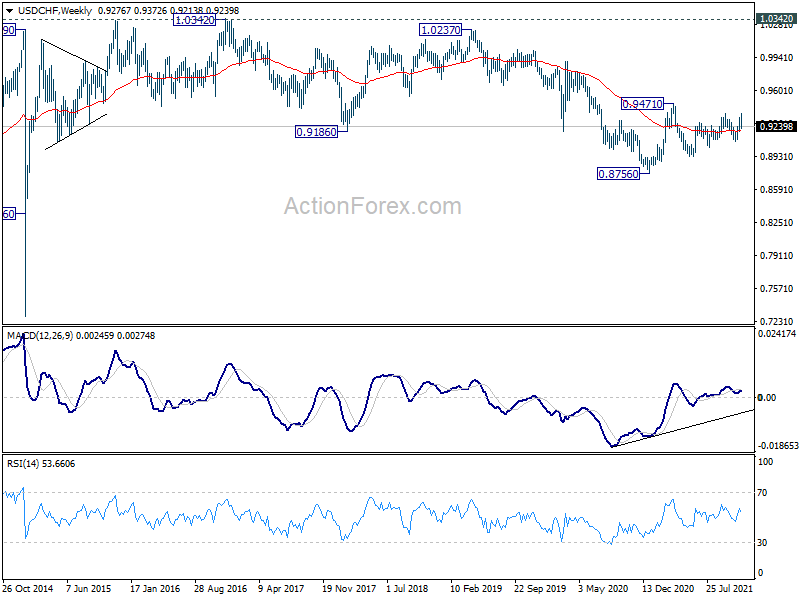
In the bigger picture, the corrective structure of the rebound from 0.8925 argues that fall from 0.9471 is not complete yet. It could either be the second leg of pattern from 0.8756 (2021 low), or resuming larger down trend from 1.0237 (2018 high). We'd pay attention to the downside momentum and assess the odds later. But for now, medium term outlook will be neutral at best as long as 0.9471 resistance holds.
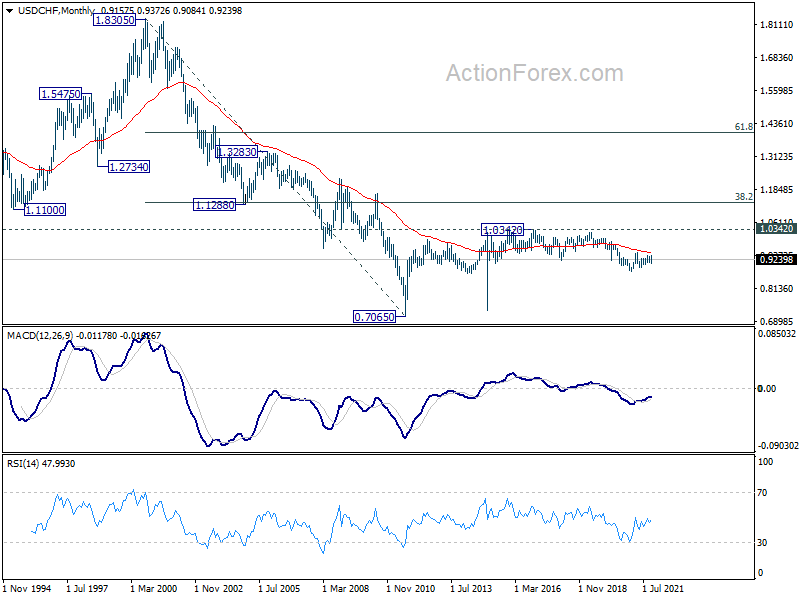
In the long term picture, price actions from 0.7065 (2011 low) are currently seen as developing into a long term corrective pattern, at least until a firm break of 1.0342 resistance.
AUD/USD Weekly Outlook
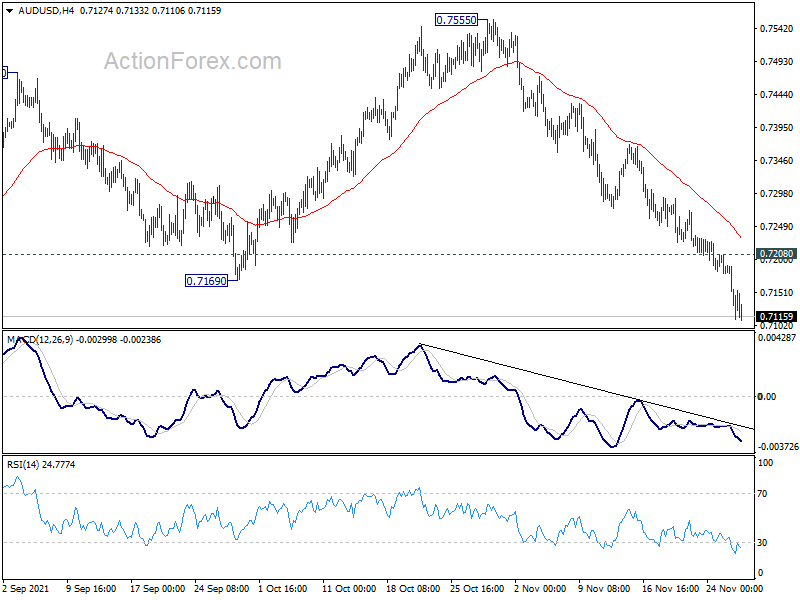
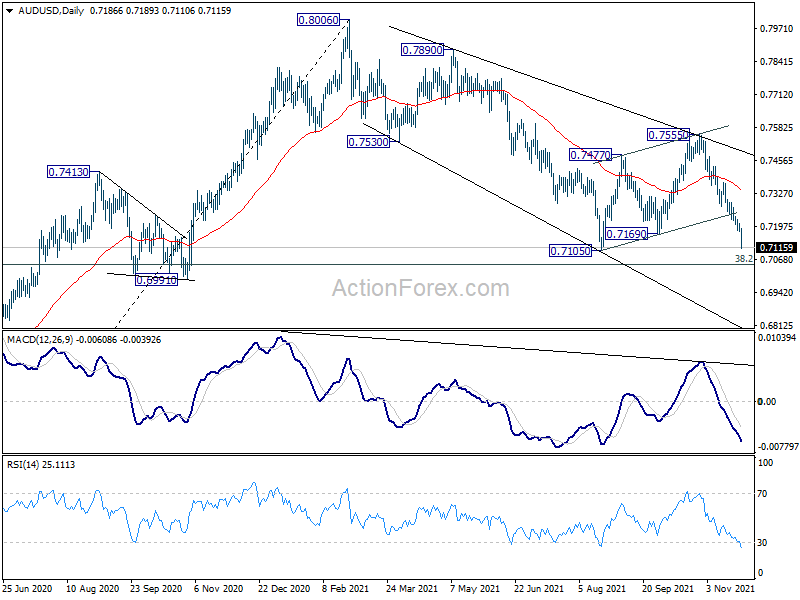
AUD/USD's fall from 0.7555 accelerated to as low as 0.7110 last week. The break of 0.7169 support affirms the case that larger fall from 0.8006 is resuming. Initial bias stays on the downside this week first. Break of 0.7105 will target 0.6991 key support next. On the upside, break of 0.7208 minor resistance will delay the bearish case and turn intraday bias neutral first.
In the bigger picture, with 0.6991 cluster support (38.2% retracement of 0.5506 to 0.8006 at 0.7051) intact, we're seeing price action from 0.8006 as a correction only. That is, up trend from 0.5506 low would resume after the correction completes. However, sustained break of 0.6991 will argue that the whole medium term trend has probably reversed. Deeper fall would be seen to 61.8% retracement at 0.6461.
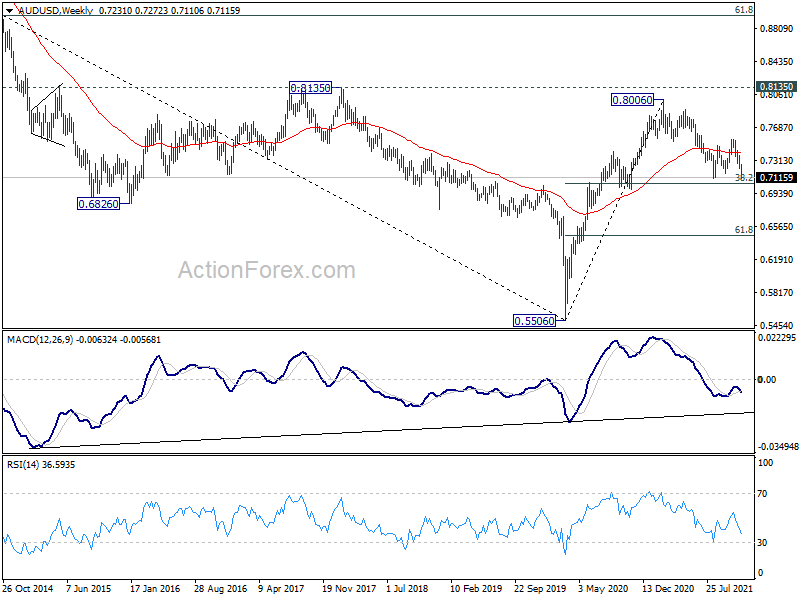
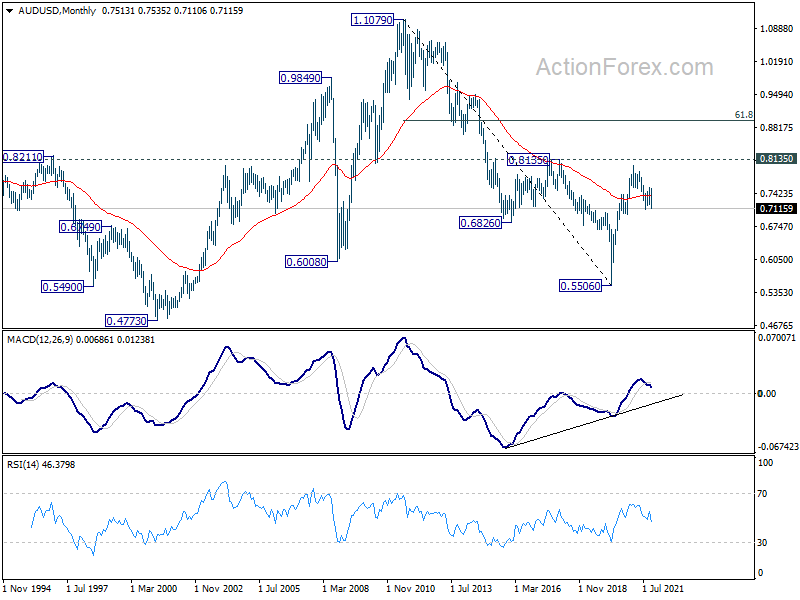
In the longer term picture, focus remains on 0.8135 structural resistance. Decisive break there will argue that rise from 0.5506 is developing into a long term up trend that reverses whole down trend from 1.1079 (2011 high). In that case, further rally would be seen to 61.8% retracement of 1.1079 to 0.5506 at 0.8950 and possibly above. Rejection by 0.8135 will keep long term outlook neutral at best.
USD/CAD Weekly Outlook
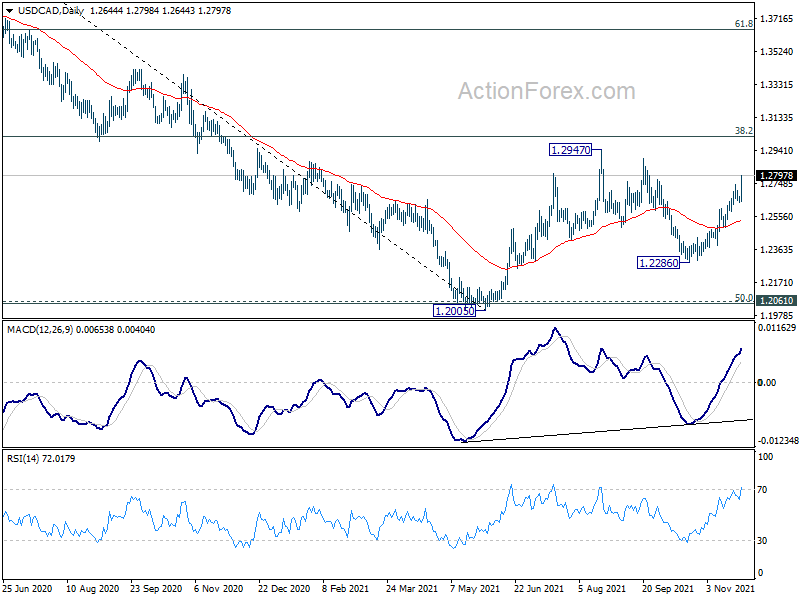
USD/CAD's rally from 1.2286 continued last week and outlook is unchanged. Initial bias remains on the upside for retesting 1.2894/2947 resistance zone. Break there will target 1.3022 long term fibonacci level next. On the downside, break of 1.2639 support is needed to indicate short term topping. Otherwise, outlook will remain bullish in case of retreat.
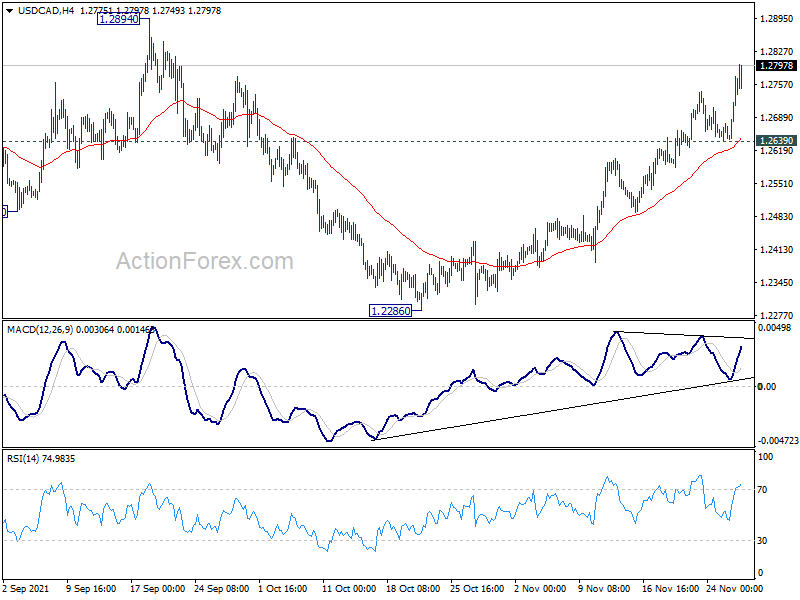
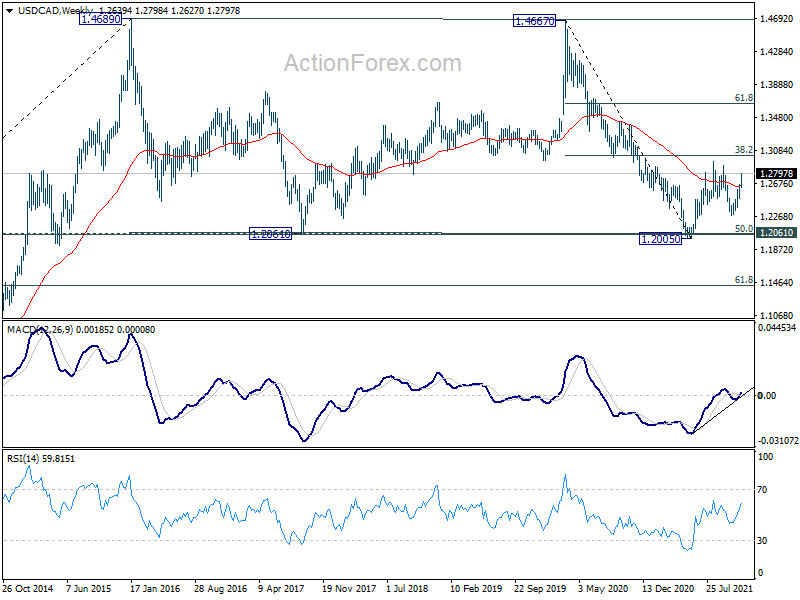
In the bigger picture, medium term outlook is neutral for now. The pair drew support from 1.2061 cluster and rebounded. Yet, upside was limited below 38.2% retracement of 1.4667 to 1.2005 at 1.3022. On the upside, firm break of 1.3022 should affirm the case of medium term bullish reversal. However, break of 1.2286 will turn focus back to 1.2005 low again.
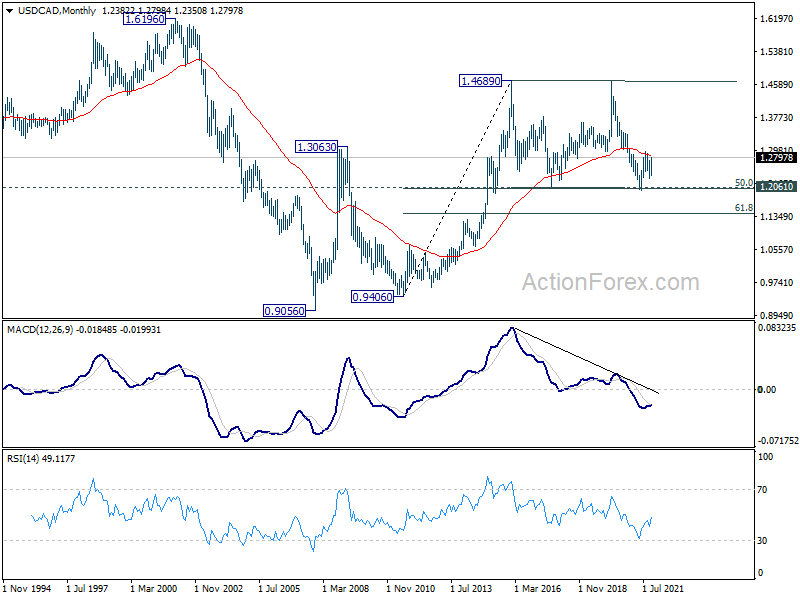
In the longer term picture, we're viewing price actions from 1.4689 as a consolidation pattern. Thus, up trend from 0.9506 (2007 low) is still expected to resume at a later stage. This will remain the favored case as long as 1.2061 support holds, which is close to 50% retracement of 0.9406 to 1.4689 at 1.2048. However, rejection by 55 month EMA, follow by firm break of 1.2061 support, will argue that USD/CAD has already started a long term down trend. Next target is 61.8% retracement of 0.9406 to 1.4689 at 1.1424.
EUR/GBP Weekly Outlook
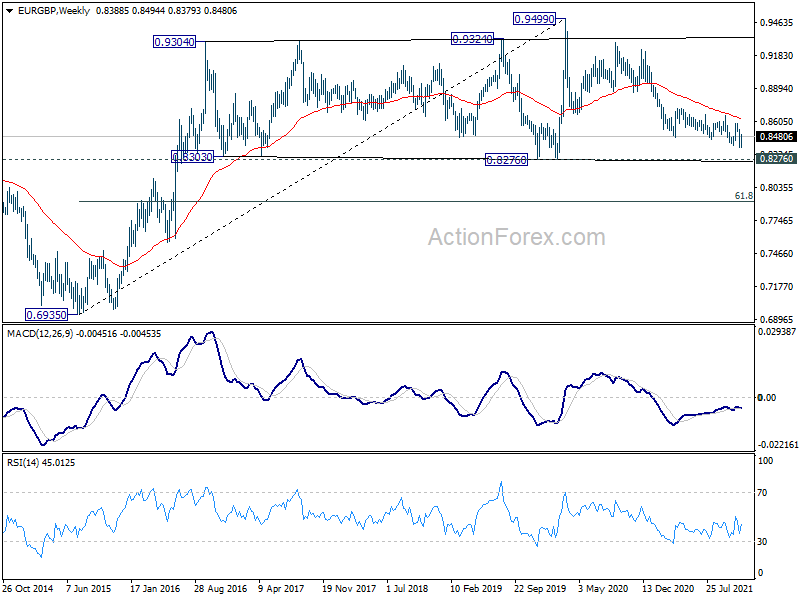
EUR/GBP's strong rebound last week indicates short term bottoming at 0.8379. Initial bias stays on the upside this week. Sustained break of 55 day EMA (now at 0.8486) will target 0.8593 structural resistance. On the downside, though, break of 0.8434 minor support will turn bias back to the downside for retesting 0.8379 low.
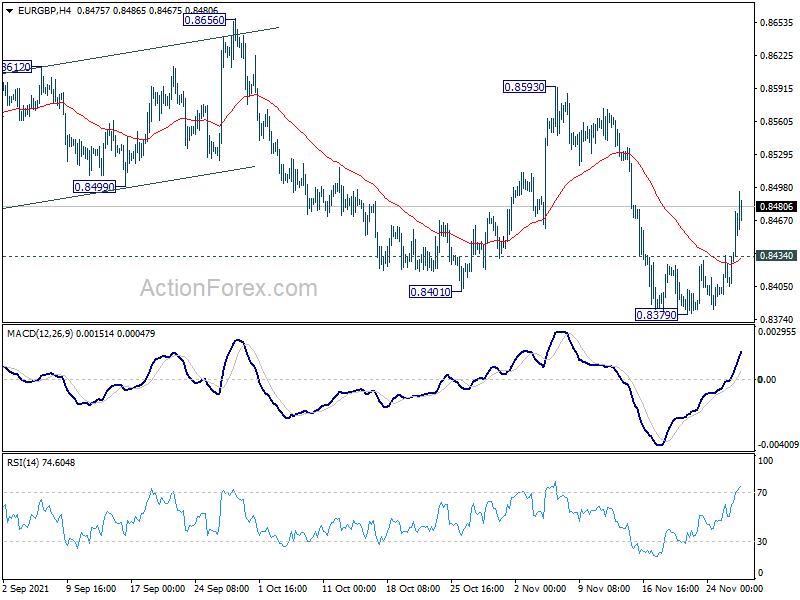
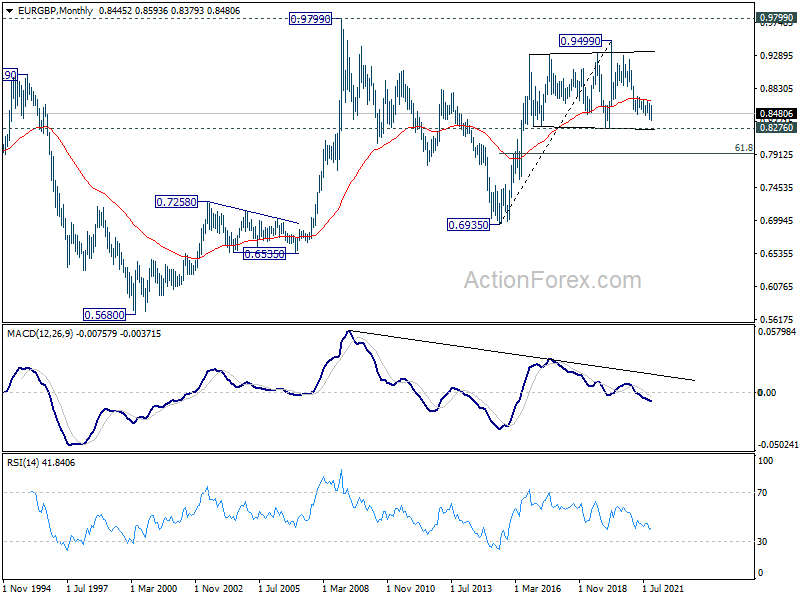
In the bigger picture, price actions from 0.9499 (2020 high) are still seen as developing into a corrective pattern. Deeper fall could be seen as long as 0.8593 resistance holds, towards long term support at 0.8276. We'd look for bottoming signal around there to bring reversal. Meanwhile, firm break of 0.8593 will now be an early sign of medium term bottoming. However, sustained break of 0.8276 will be a sign of long term bearish reversal.
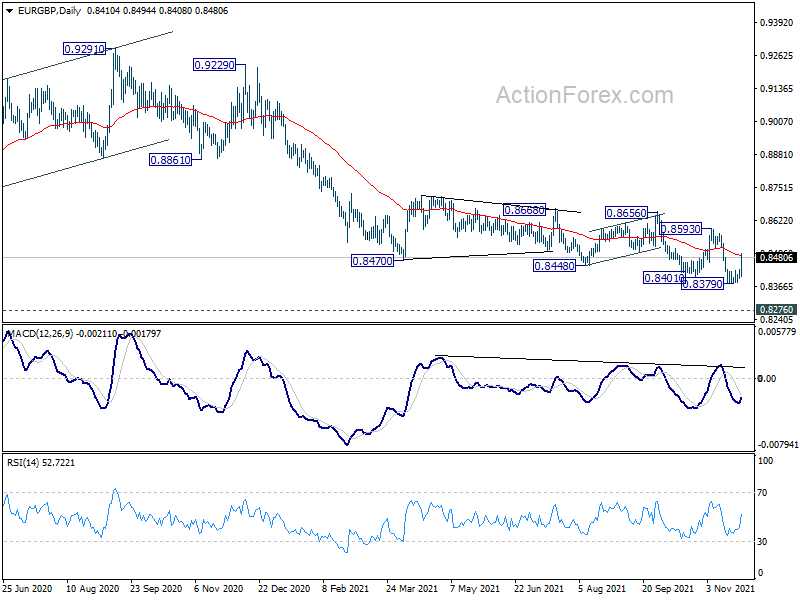
In the long term picture, outlook will stay bullish as long as 0.8276 support holds. Break of 0.9499 is in favor at a later stage, to resume the up trend from 0.6935 (2015 low). However, sustained break of 0.8276 will indicate long term trend reversal, and target 61.8% retracement of 0.6935 to 0.9499 at 0.7917, and possibly below.