Sample Category Title
USD/CAD Reaches New High
The Canadian dollar fell back after the annual inflation rate matched the consensus.
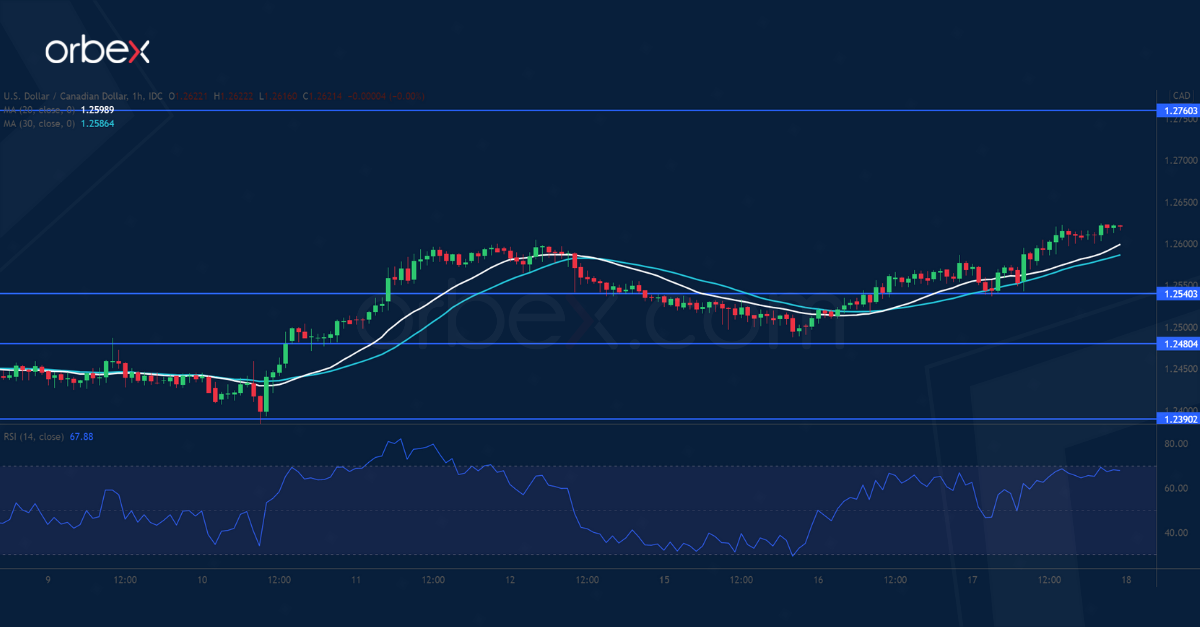
Following the greenback’s rally from the demand zone at 1.2300, a bullish MA cross on the daily chart suggests that the current rebound is picking up steam. As a sign of strong commitment, buyers were eager to keep price action above 1.2480 when the RSI flirted with the oversold area.
A break above 1.2600 may trigger an extended rally towards the daily resistance at 1.2760. 1.2540 is fresh support in case of a pullback.
GBP/USD Bounces Higher
The pound inched higher after the UK’s inflation soared to 4.2% in October.
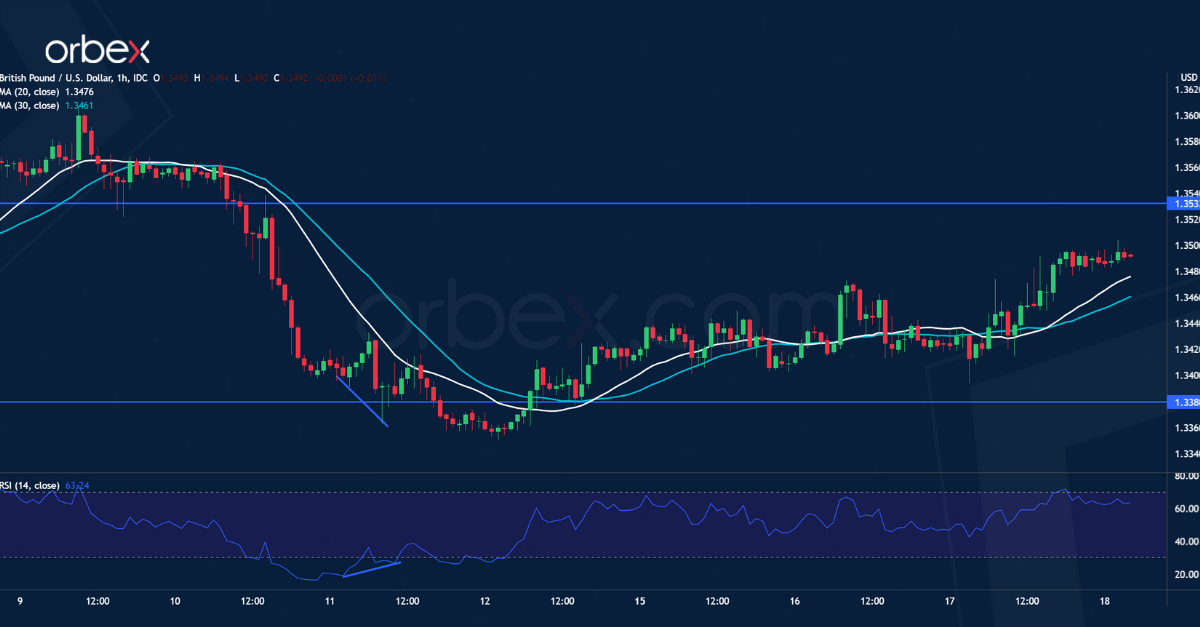
Sentiment remains pessimistic after a botched rebound from the demand zone at 1.3420. However, an oversold RSI has attracted some buying interest. Its bullish divergence suggests a slowdown in the sell-off, prompting momentum traders to take profit and look for the next breakout.
The sterling may bounce back if the bulls succeed in keeping it above 1.3380. 1.3530 would be the first hurdle. Otherwise, a bearish breakout would send the pair to 1.3200.
Hedge Funds Put On Chinese Recovery
In the US, major stock indices declined on Wednesday amid negative trends in the oil and gas, financial and industrial sectors. At the close of the stock exchange, the Dow Jones decreased by 0.58%, the S&P 500 decreased by 0.26%, and the NASDAQ Composite lost 0.33%. The Construction report showed a 0.7% drop as compared to the previous month. Experts predicted the increase in the number of new buildings.
Among the Dow Jones components, the leader of the fall was Visa Inc., which decreased by 4.7%. The world's largest online retailer Amazon.com Inc. said on Wednesday that it would stop accepting Visa credit cards in the UK next year because of high fees.
Yesterday, Tesla's share price increased another 3.3% despite the fact that Elon Musk sold the company's stocks worth $973 million on Tuesday while continuing to cut his stake for the seventh consecutive trading session. He sold Tesla securities for a total of $6.9 billion last week and $930 million on Monday.
Lucid Group Inc. has gained more than $17 billion in capitalization in recent days, surpassing Ford Motor Co. and General Motors Co. EV stock is rising amid a strong investor interest. The electric car industry is one of the most promising for the next few years.
European stock markets traded yesterday without a single trend. The Stoxx Europe 600 composite index of the region's largest companies added 0.14%. Italy's FTSE MIB and France's CAC 40 increased by 0.1% each. Germany's DAX remained about the same. And the British FTSE 100 and Spanish IBEX decreased by 0.5% each. The consumer price index in Europe remained unchanged at 4.1% as expected. Last month, inflation rose the least in Portugal and reached 1.8% in annual terms, Finland and Greece to 2.8% each. The strongest jump in inflation was registered in Lithuania (to 8.2%) and Estonia (to 6.8%). In Germany, consumer prices increased to 4.6%, in France and Italy to 3.2%. At the same time, the ECB's balance sheet continues to grow steadily, which impacts the European currency negatively. The ECB will keep its monetary policy soft until the end of the year, and quite possibly until next spring.
The American Petroleum Institute reported that crude inventories increased by 655,000 barrels last week. The increase in supply is driving down oil prices, but demand is still substantially higher than supply. The White House has asked some of the largest oil consuming countries (China, Japan, India) to consider releasing some of their oil inventories to lower prices and stimulate economic recovery. Oil prices around the world hit seven-year highs late last month.
Major Asian stock indices are trading negative today. In the absence of positive momentum from Wall Street and a relatively calm day in terms of economic data, the mood of investors in the region was subdued. The Japanese index decreased by 0.3%, the Chinese benchmark index CSI 300 decreased by 0.99%, and Hong Kong's Hang Seng lost 1.42%. The only exception is the Australian ASX 200, which is in positive territory +0.13%.
A week ago, Bridgewater Associates, LP, managed by personalities, including Ray Dalio (founder of the fund), Bob Prince, and Greg Jensen, released its Q3 2021 report. The fund significantly increased its stakes in large Chinese companies, including BABA, HTHT, CD, XPEV, YUMC, BIDU, DIDI, and others. Goldman Sachs analysts also put on the recovery of Chinese companies.
Main market quotes:
- S&P 500 (F) 4,688.67 −12.23 (−0.26%)
- Dow Jones 35,931.05 −211.17 (−0.58%)
- DAX 16,251.13 +3.27 (+0.02%)
- FTSE 100 7,291.20 −35.77 (−0.49%)
- USD Index 95.79 −0.13 (−0.14%)
Important events for today:
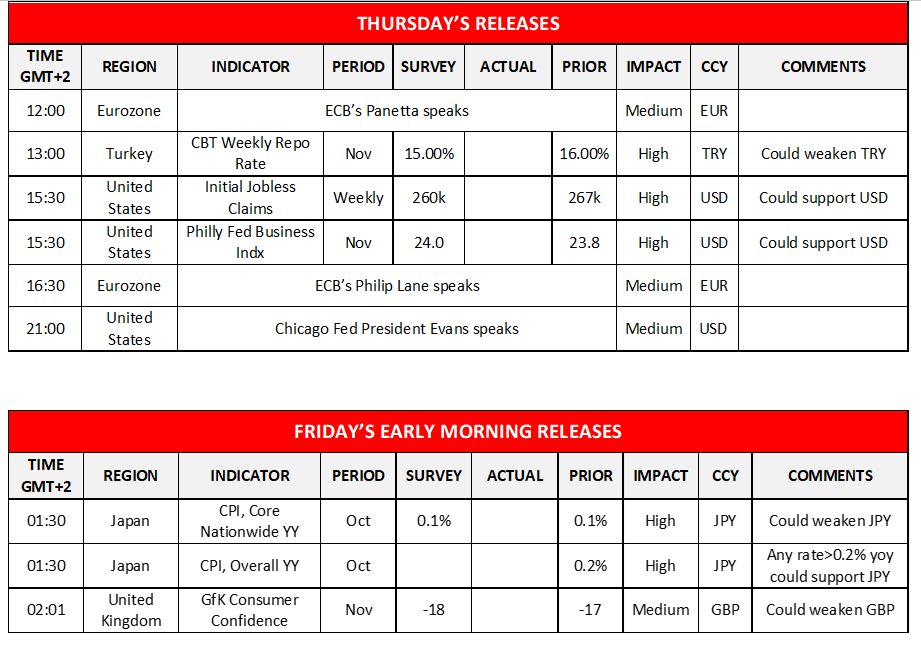
- US Initial Jobless Claims (w/w) at 15:30 (GMT+2);
- US Philadelphia Fed Manufacturing Index (m/m) at 15:30 (GMT+2);
- Natural Gas Storage (w/w) at 17:30 (GMT+2).
WTI Futures Retreat From 7-Year High To The Ichimoku Cloud
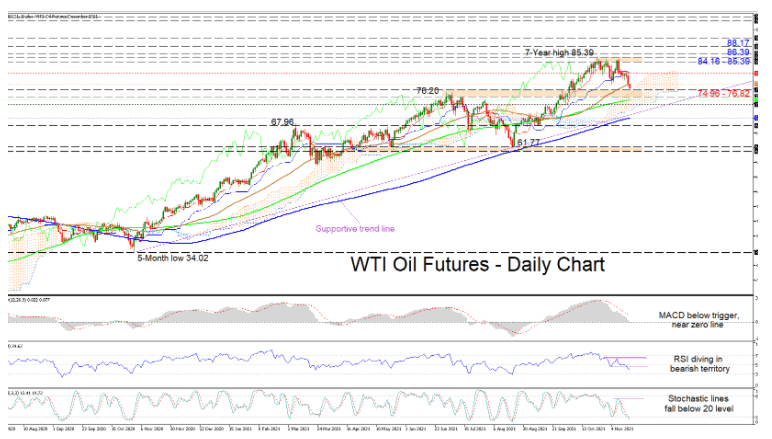
WTI oil futures have logged a minor correction from the fresh 7-year high levels, dipping slightly beneath the 50-day simple moving average (SMA) at 78.38, and nearing the Ichimoku cloud. That said, the longer-term 100- and 200-day SMAs continue to endorse the positive structure.
The Ichimoku lines are indicating a modest loss of power in the upward drive, while the short-term oscillators are suggesting negative momentum is gaining pace. The MACD is falling beneath its red trigger line and has reached the zero threshold. Moreover, the RSI is diving in the bearish region, while the stochastic lines have dipped into oversold territory.
If the current price trajectory holds, the nearby support border of 74.96-76.82 - coupled with the cloud’s upper band - may test sellers’ efforts to push lower. Should this upside defence fail to provide the necessary footing for the price, the 100-day SMA at 74.25 and the 73.00 handle could then step into the spotlight. From here, a deeper pullback stretching underneath the cloud may meet a promising supportive trendline, pulled from the five-month low of 34.02, before targeting the 200-day SMA at 69.39.
Otherwise, if buyers form a foothold off the cloud and the 74.96-76.82 support and push back above the 50-day SMA at 78.38, the next upside constraint could evolve around the Ichimoku lines at 81.16. Overstepping them, the price may then challenge the highs existing in the 84.16-85.39 area, associated with levels last seen 7-years ago. Surpassing this zone, the bulls could then hit the 86.39 barrier before pushing for the 88.17 mark, identified in the early part of October 2014.
Summarizing, in the short-term timeframe, WTI oil futures are sustaining a bullish bias above the 61.77 trough. For negative worries to grow, the price would need to dive below the cloud and the 200-day SMA.
USDJPY Stumbles Around 4½-Year Highs As Bullish Forces Wane
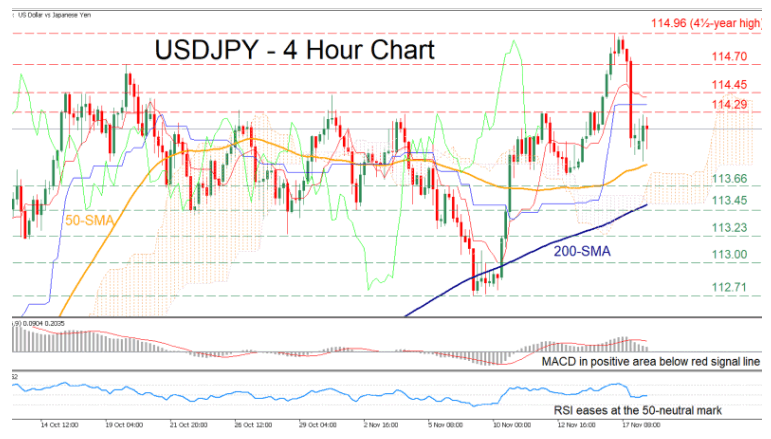
USDJPY has been ramping up after the price encountered strong support at the 112.71 region in early November. However, the pair has been giving up ground since its recent rally halted at the 4½-year high of 114.96.
This recent pullback is likely to continue as the short-term oscillators indicate that the positive momentum is fading. The MACD histogram is above zero but below its red signal line, while the RSI is flatlining in the 50-neutral mark.
Should the selling pressure intensify, the 113.66 level might act as immediate support. A drop below this level would open the way towards the 113.45 region. If sellers overcome this obstacle, 113.23 could prove a strong support barrier for the price before the bears target the 113.00 key psychological mark.
On the flip side, if buyers manage to retake control and the price ascents, the first resistance point might be found at the 114.29 level, which has rejected four price advances in the last month. Overcoming this level, the next hurdle for the pair might be met at 114.45 or even higher at the 114.70 region. Clearing these barricades would signify the resumption of the short-term upsurge, sending the price to challenge its 4½-year high of 114.96.
Overall, USDJPY appears to have run out of steam after posting a 4½-year high, but it still holds its bullish short-term structure. For the positive picture to alter, the price needs to dip below the 113.23 level.
USD Sends Mixed Signals In A Nervous Market
The USD edged lower against a number of its counterparts yesterday, sending some mixed signals with safe haven currencies like JPY and CHF being among the main gainers for the day. US stocks also tended to send mixed signals as worries in the market increased as the US Treasury Secretary Yellen repeated her warning that the US government may run out of money on the 15th of December and despite a temporary solution being found, uncertainty about the issue remains. As for financial releases, the construction data for October sent some mixed signals yesterday and today we note the release of the weekly initial jobless claims figure and the Philly Fed Business Index for November. On the monetary front we note the speech of Chicago Fed President Evans and should he sound more hawkish we may see the USD getting some support.
USD/JPY dropped yesterday, breaking the 114.45 (R1) support line, now turned to resistance before stabilising somewhat. As the pair’s price action has broken the upward trendline guiding it, we switch our bullish outlook in favour of a bias for a sideways movement for the time being. We may see USD/JPY moving between the 114.45 (R1) resistance line and the 113.70 (S1) support level. Please note that the RSI indicator below our 4-hour chart is running along the reading of 50, implying a market that has still to decide on the direction of the price action’s next leg. Should buyers have the upper hand, we may see USD/JPY breaking the 114.45 (R1) resistance line and aim for the 115.20 (R2) resistance level. Should a selling interest be displayed by the market, we may see the pair breaking the 113.70 (S1) support line and aim for the 112.90 (S2) support level which came in action on the 9th to 10th of November.
WTI prices drop after US Government’s call
WTI prices dropped yesterday as news emerged that the US has asked countries such as China, Japan and India, which are heavy users of oil to consider tapping their national oil reserves in a combined effort to bring oil prices down. It was also reported by Reuters that China’s State Reserve Bureau has stated that it was working on a release of crude oil reserves yet did not comment on the reports for the US proposal. It should be noted that oil prices dropped despite the EIA reporting yesterday a surprise decline in the US oil inventories for the past week which under other circumstances could have provoked oil bulls. EIA had reported that increased refining and rising exports were among the main reasons for the reduction of US inventories. Overall, we may see the releases from the strategic oil reserves of various countries actually exercising pressure on the oil prices, yet a correction of the oil market could be achieved only by a rebalancing of supply and demand levels in the long term.
WTI prices dropped yesterday clearly breaking the 79.00 (R1) support line, now turned to resistance and continued lower to test the 76.60 (S1) support line. We tend to maintain a bearish outlook for he pair as long as it remains below the downward trendline incepted since the 9th of November. Please note that the RSI indicator below our chart is at the reading of 30 confirming the bearish sentiment. Should the bears actually remain in control over the commodity’s price, we may see it breaking the 76.60 (S1) support line and aim for the 73.45 (S2) support level. Should the bulls take over we may see WTI reversing course, breaking the prementioned downward trendline, the 79.00 (R1) resistance line and aim for the 82.00 (R2) resistance level.
Other market highlights for today
Today in the late European session we highlight the release of CBT’s interest rate decision. In Turkey the whole situation resembles a negative spiral with inflation being almost at 20% yoy and the bank preparing to proceed with another rate cut. TRY is being in a selloff against the USD and should the bank actually proceed with a deeper than a 100 basis points rate cut expected, or a warning that more rate cuts are to come we may see the Lira sinking further.
USD/JPY H4 Chart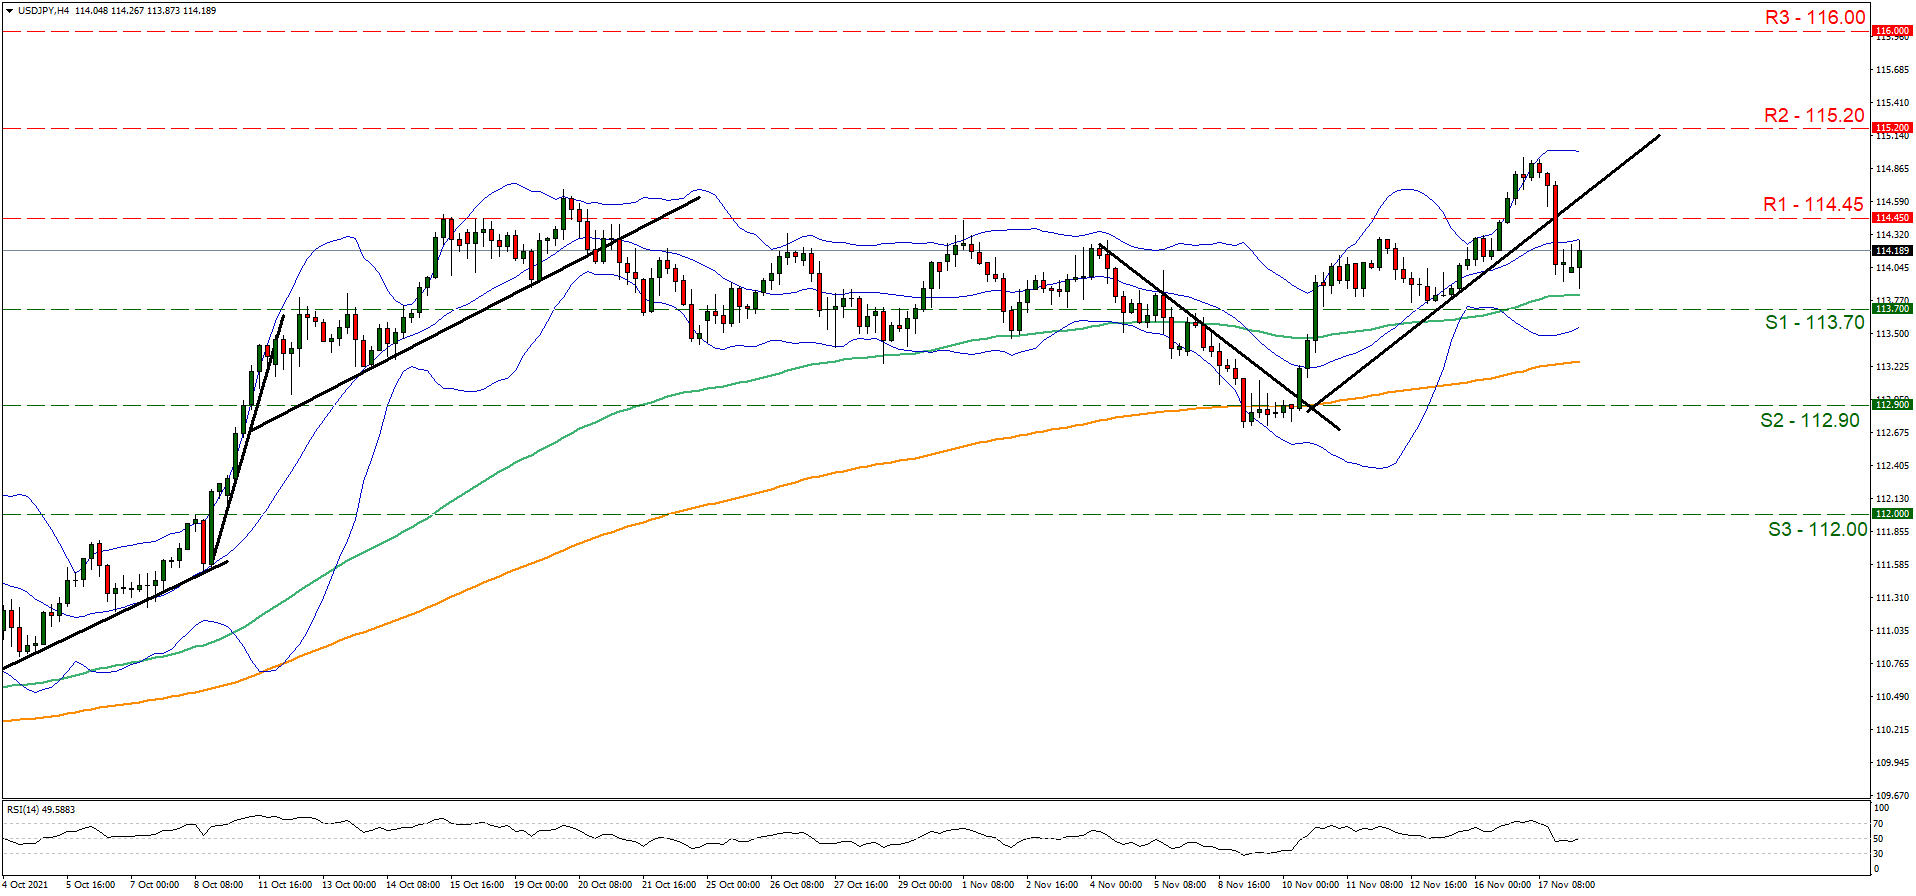
Support: 113.70 (S1), 112.90 (S2), 112.00 (S3)
Resistance: 114.45 (R1), 115.20 (R2), 116.00 (R3)
WTI H4 Chart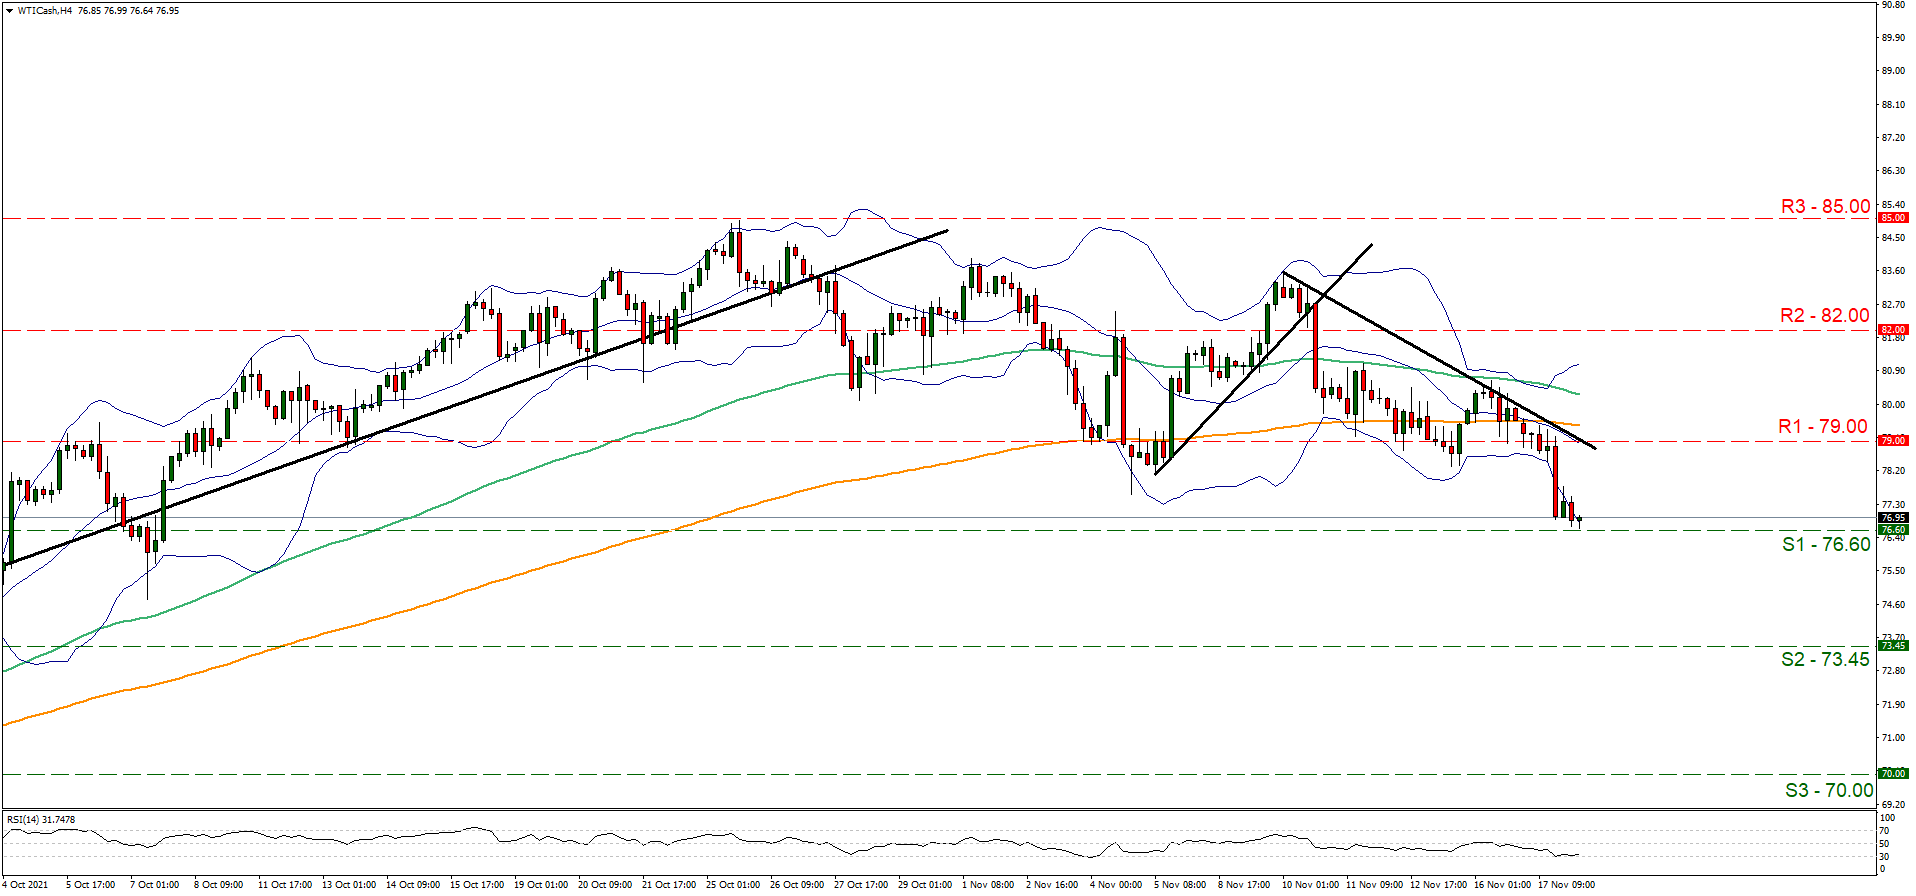
Support: 76.80 (S1), 73.45 (S2), 70.00 (S3)
Resistance: 79.00 (R1), 82.00 (R2), 85.00 (R3)
The Analytical Overview Of The Main Currency Pairs
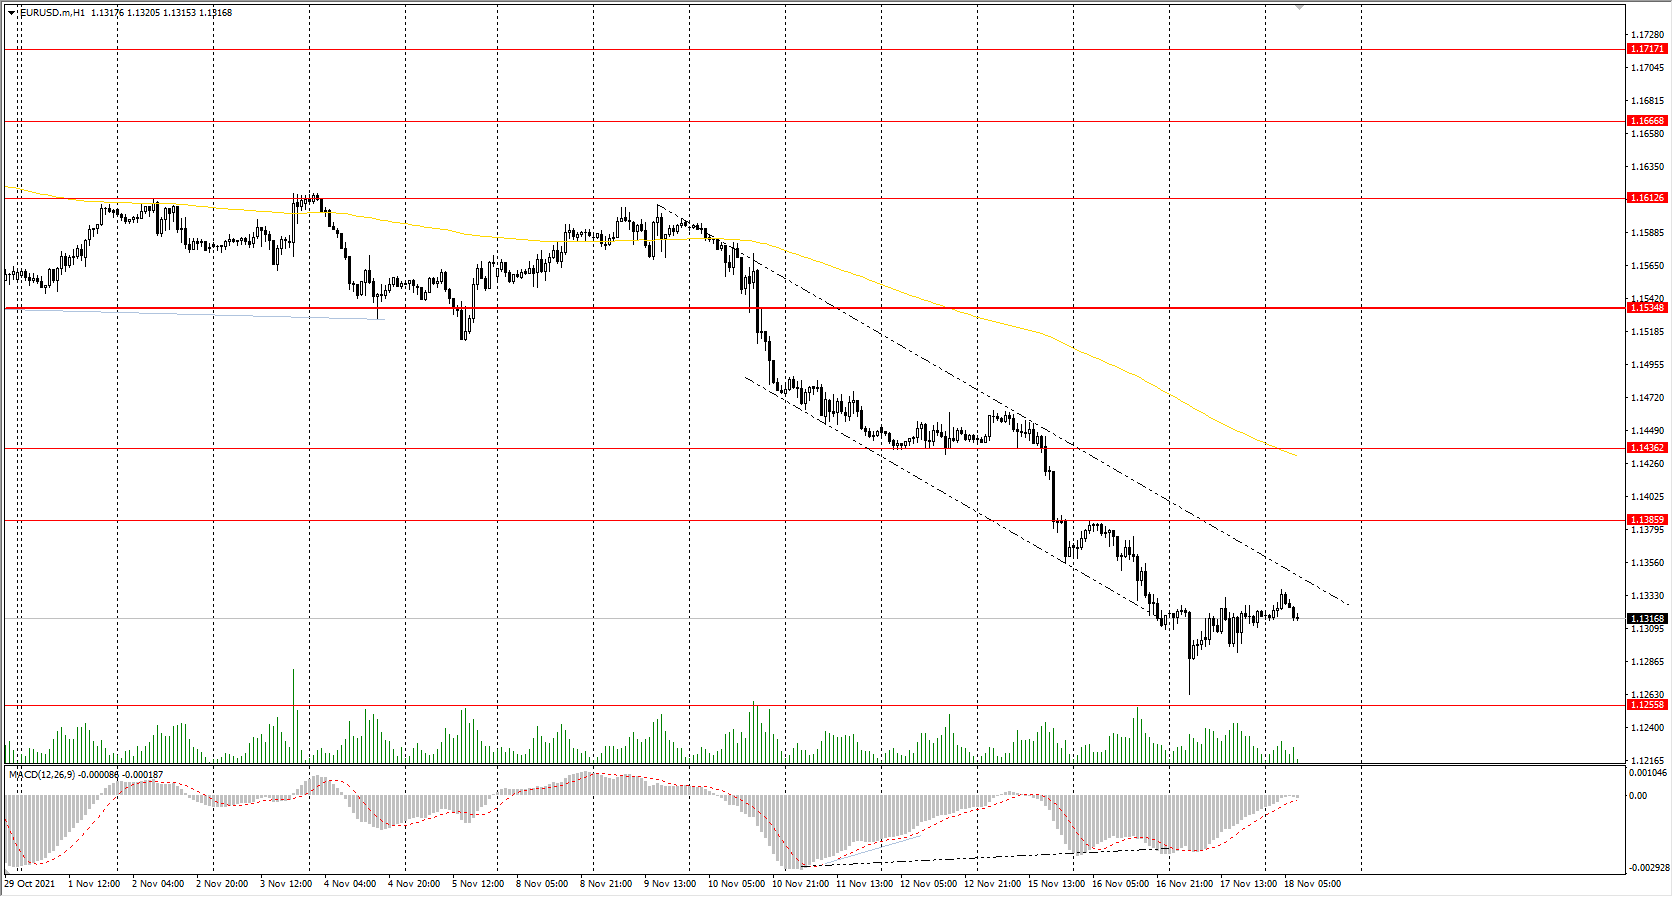
The EUR/USD currency pair
Technical indicators of the currency pair:
Prev Open: 1.1321
Prev Close: 1.1318
% chg. over the last day: -0.03%
The ECB balance sheet continues to rise steadily, which has a negative impact on the European currency. The consumer price index in Europe remained unchanged at 4.1% as expected. The ECB will keep its soft monetary policy until the end of the year and quite probably until next spring.
Trading recommendations
Support levels: 1.1256
Resistance levels: 1.1386, 1.1436, 1.1535, 1.1613, 1.1667, 1.1717
From the technical point of view, the EUR/USD on the hour time frame is bearish. The Euro continues to decline against the US dollar. The MACD indicator is in the negative zone, but there is a divergence on the higher time frame, which indicates a coming correction. For rebound, a support level is required. Under such market conditions, traders should consider sell positions from the resistance levels near the moving average since the price has deviated strongly from the averages. Buy trades should be considered only from the support levels of the higher time frame, given the buyers’ initiative, but only with short targets.
Alternative scenario: if the price breaks out through the 1.1535 resistance level and fixes above, the mid-term uptrend will likely resume.
News feed for 2021.11.18:
- US Initial Jobless Claims (w/w) at 15:30 (GMT+2);
- US Philadelphia Fed Manufacturing Index (m/m) at 15:30 (GMT+2).
The GBP/USD currency pair
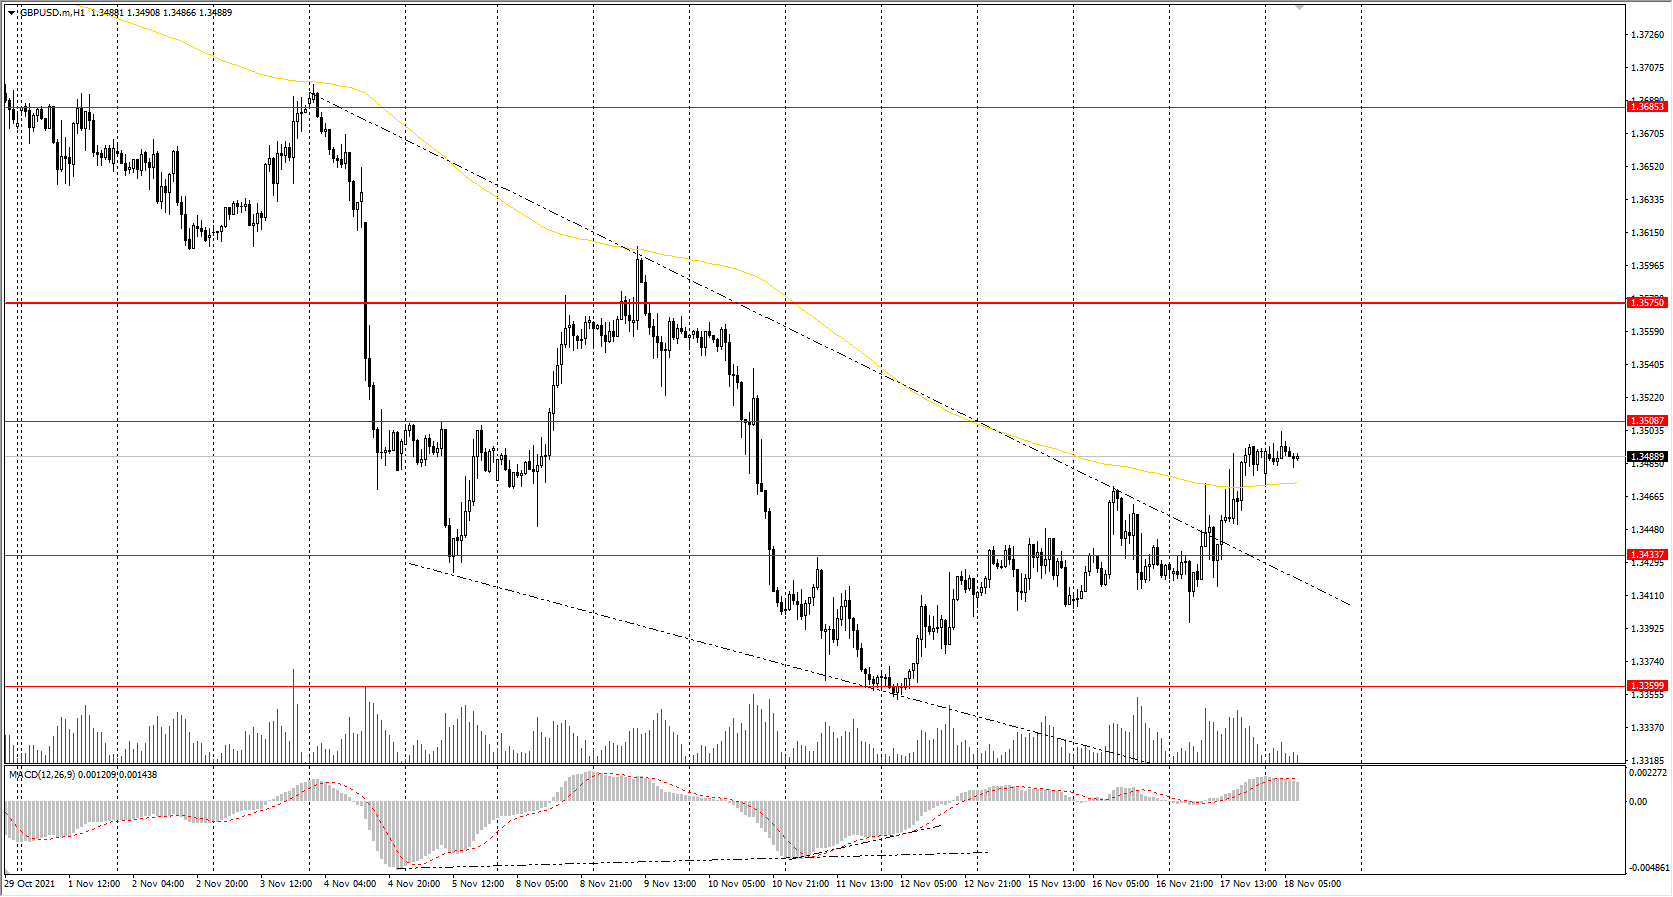
Technical indicators of the currency pair:
Prev Open: 1.3428
Prev Close: 1.3492
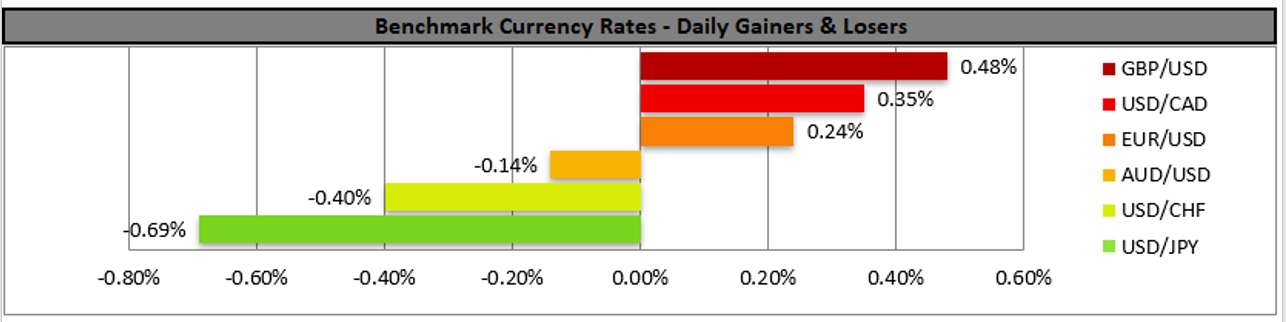
% chg. over the last day: +0.48%
The UK inflation increased faster than expected to the highest level in a decade, increasing pressure on the Bank of England to raise interest rates. Consumer prices rose to 4.2% in annual terms, the fastest pace of growth since November 2011.
Trading recommendations
Support levels: 1.3434, 1.3360
Resistance levels: 1.3507, 1.3575, 1.3685, 1.3748
On the hourly time frame, the trend on GBP/USD is bearish. But the British pound looks more confident than the euro. The MACD indicator has become positive and the price has consolidated above the descending wedge. Under such market conditions, traders should consider sell positions from the resistance levels near the moving average. Buy trades should be considered only from the support levels of the higher time frame, given the buyers’ initiative.
Alternative scenario: if the price breaks out through the 1.3575 resistance level and consolidates above, the bullish scenario will likely resume.
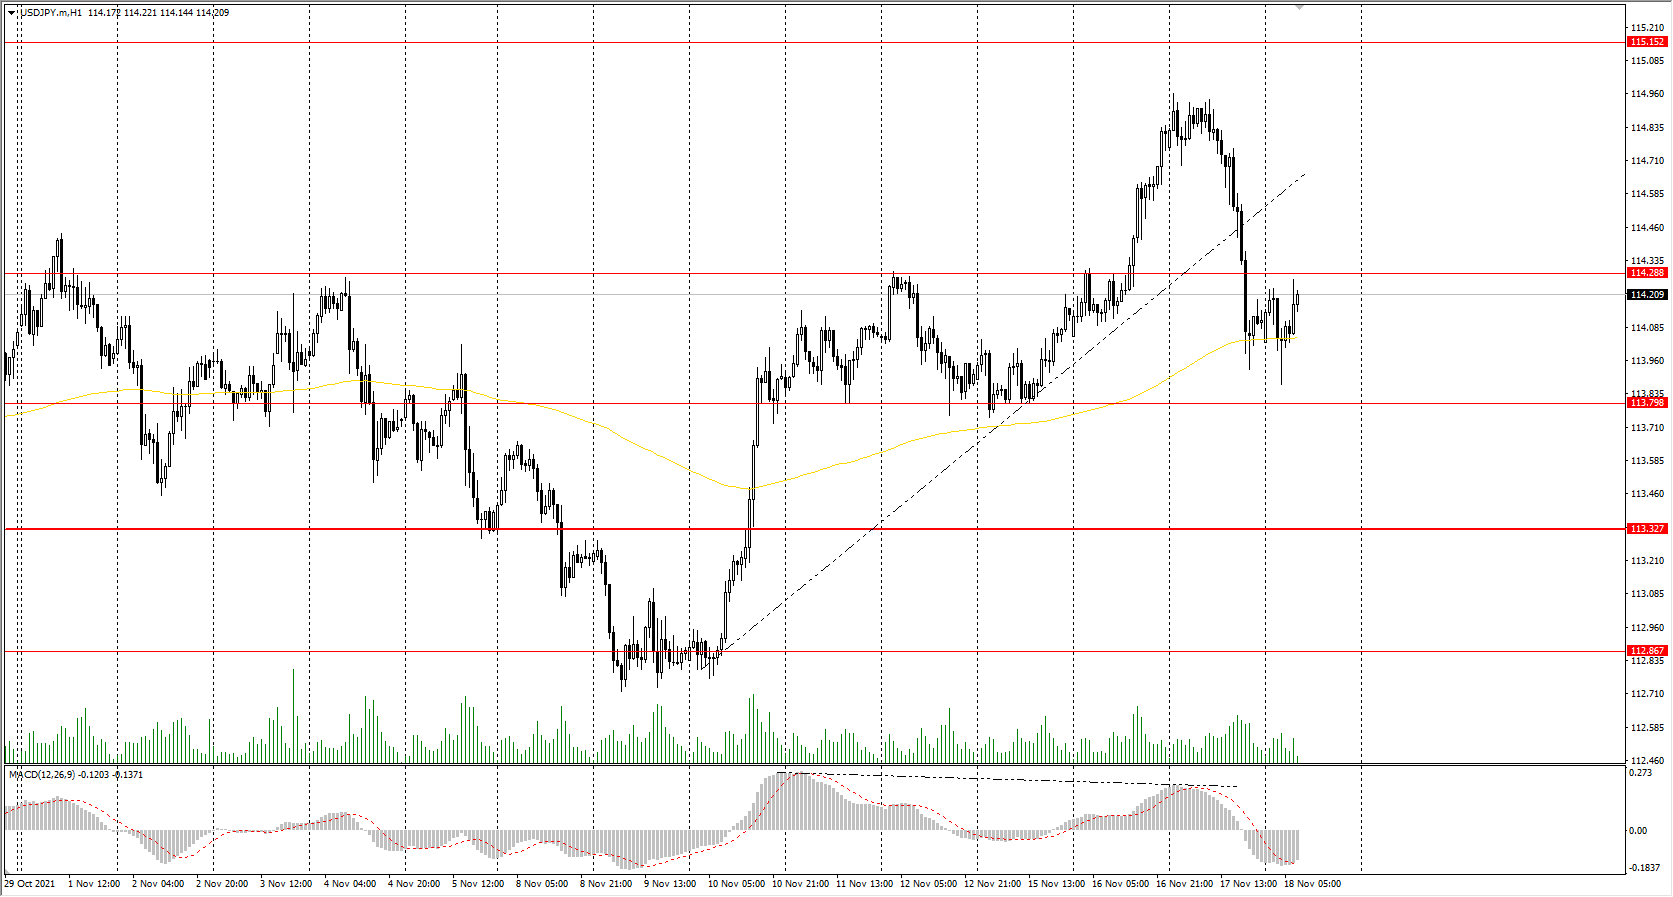
The USD/JPY currency pair
Technical indicators of the currency pair:
Prev Open: 114.76
Prev Close: 114.11
% chg. over the last day: -0.57%
Japan is lagging behind other economies in recovering from the pandemic recession, forcing policymakers to maintain massive fiscal and monetary support even as other advanced economies have already reduced such programs. Japan's new stimulus package will include a record $488 billion in spending.
Trading recommendations
Support levels: 113.79, 113.32, 112.87, 112.30
Resistance levels: 114.29, 115.15, 115.50
The global trend on the USD/JPY currency pair is bullish. However, yesterday, the price decreased sharply on the news about the new stimulus program and broke down the local uptrend. The MACD indicator has become negative. Under such market conditions, it’s better to look for buy positions from the buyers' initiative zone near the moving average. Sell positions should be considered from the resistance levels of higher time frames, given there is sellers' initiative, but only with short targets.
Alternative scenario: if the price falls below 113.32, the uptrend will likely be broken.
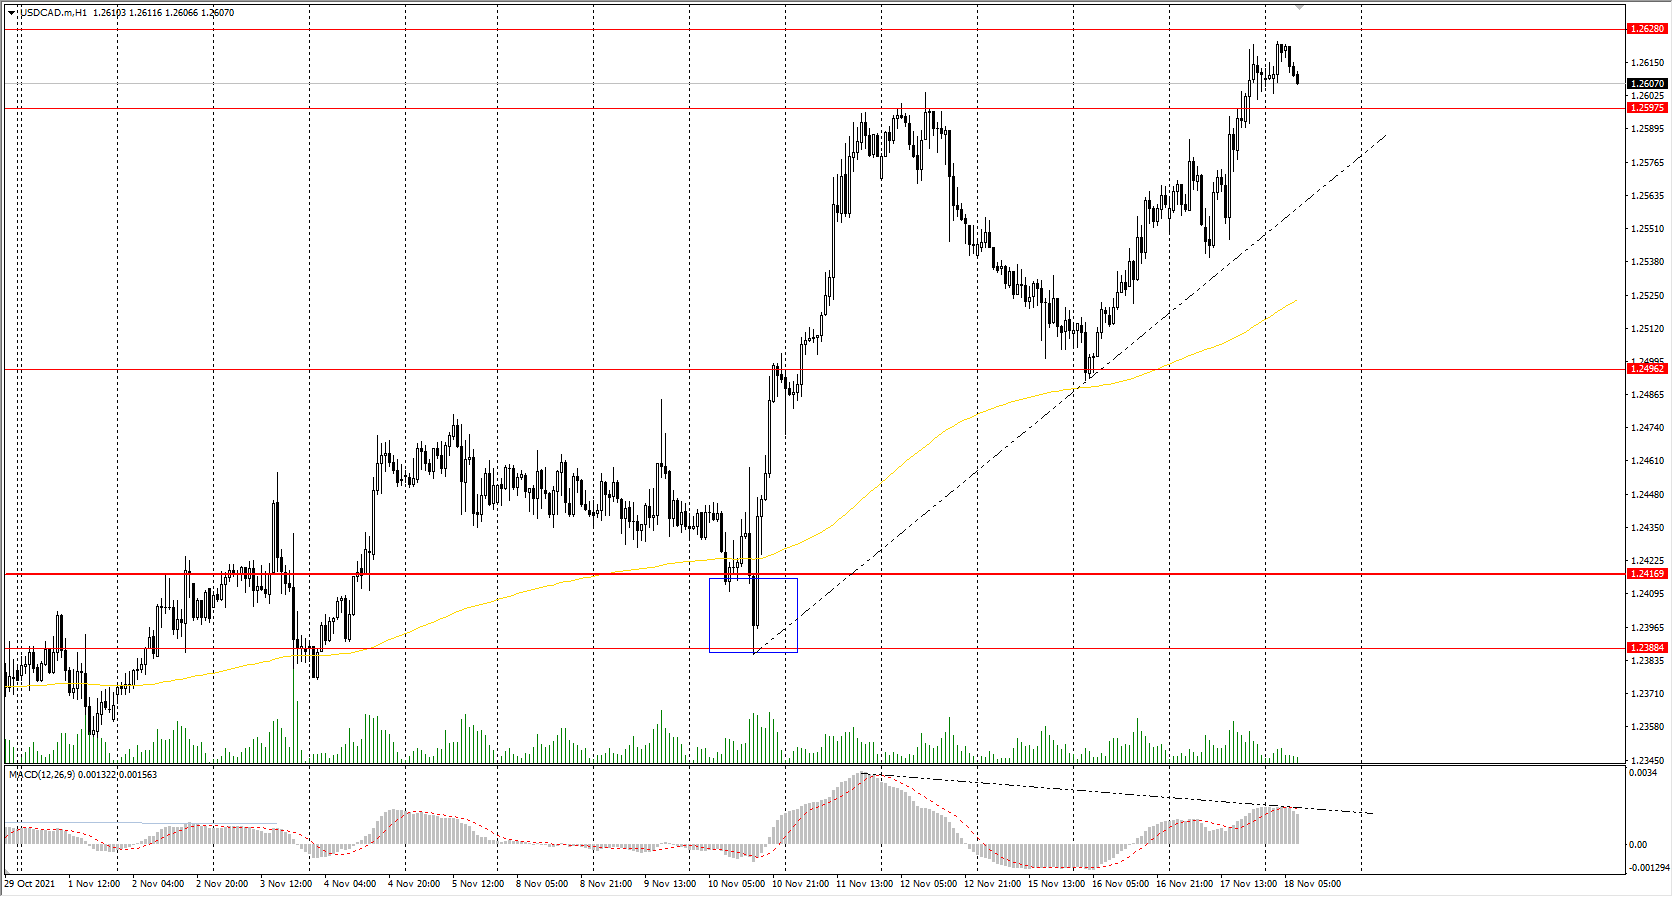
The USD/CAD currency pair
Technical indicators of the currency pair:
Prev Open: 1.2555
Prev Close: 1.2610
% chg. over the last day: +0.44%
The Canadian dollar is a commodity currency, so the USD/CAD currency pair highly depends on the dollar index dynamics and oil prices. Yesterday, the dollar index increased while oil prices went down on the reserves report. As a result, the USD/CAD currency pair increased because of the strengthening of the US currency. Fundamentally, both the dollar index and oil quotes have an upward trend now, so USD/CAD will be traded flat in the medium term.
Trading recommendations
Support levels: 1.2598, 1.2496, 1.2416, 1.2388
Resistance levels: 1.2628, 1.2729
From a technical point of view, the trend of the USD/CAD currency is bullish. The MACD indicator is in the positive zone, but there are signs of divergence, which indicates the weakness of the buyers. Under such market conditions, it is better to look for buy trades from the support levels near the moving average. Sell deals should be considered from the resistance levels of the higher time frame or after the price returns to the corridor of 1.2496-1.2598.
Alternative scenario: if the price breaks down through the 1.2416 support level and fixes below, the downtrend will likely resume.
EURJPY Descending Move Continues As Bearish Forces Linger
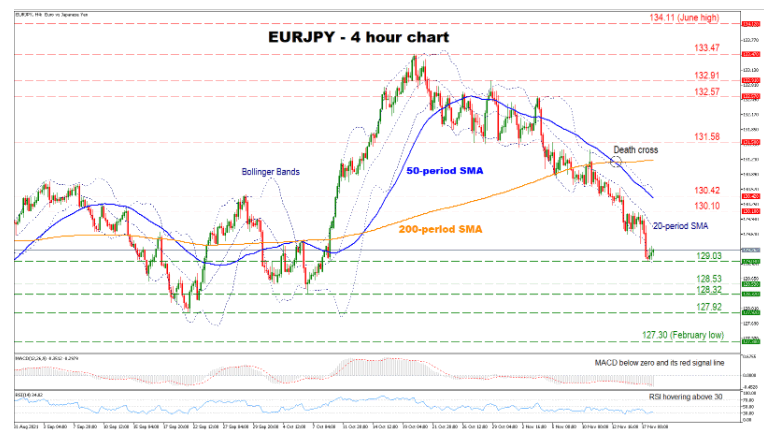
EURJPY continues its descending move after the October high, powered by lingering negative forces. Moreover, its 50-period simple moving average (SMA) has crossed below the 200-period SMA completing a ‘death cross’ and increasing fears of a sustained bearish outlook.
The short-term oscillators are transmitting a negative bias, reflecting the pair’s recent price depreciation. The RSI is found slightly above its 30 oversold region, while the MACD is found below zero and its red signal line.
If the price crosses below its 129.03 support, the bears may then target the 128.53 barrier. A further descending movement from this level could intensify selling pressures, sending the price to test its 128.32 region. Breaking below this point could strengthen the pair’s negative momentum, paving the way towards the 127.92 support.
On the flip side, should the bulls regain control, initial support might be found at the 20-period SMA currently found at 129.76. Surpassing this level could open the door towards the 130.10 barrier before testing the congested region which encapsulates the 50-period SMA and the 130.42 resistance. Advancing beyond that region could send the pair towards its 200-period SMA currently at 131.19.
In brief, the overall outlook for the pair is bearish. For that to change, the buyers would need to breach the 200-period SMA.
AUDUSD Rebounds Off Ascending Line After The Declining Move
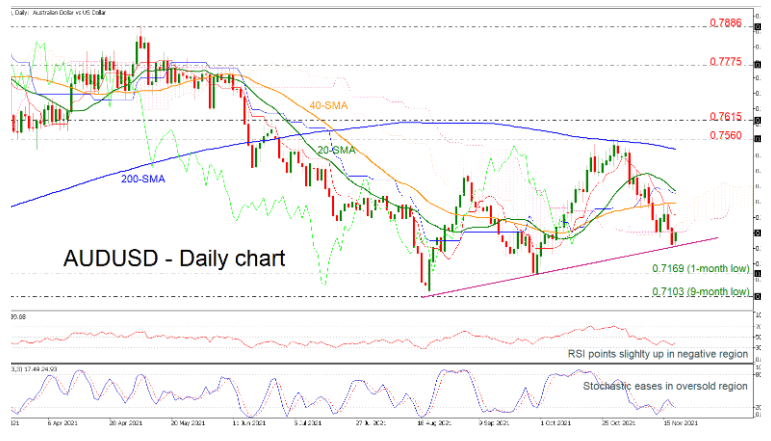
AUDUSD is creating a downward movement after the bounce off the 0.7560 resistance, dropping beneath the 20- and 40-day simple moving averages (SMAs). Despite that decline, the pair found support at the short-term uptrend line and any moves below that line could endorse a negative outlook.
The stochastic oscillator is confirming the falling move, approaching the oversold territory with a bearish cross within the %K and %D lines. However, after the recent upside session, the RSI is pointing up in the negative region.
If the pair continues the selling interest below the Ichimoku cloud, immediate support could come from the one-month low of 0.7169 ahead of the nine-month trough of 0.7103.
On the other hand, a jump beyond the Ichimoku cloud could take the market towards the 40- and 20-day SMAs at 0.7374 and 0.7410 respectively. Rising further, the price could reach the 200-day SMA at 0.7530 before visiting the 0.7560 barrier.
To sum up, AUDUSD has been in a descending move over the last three weeks and only an advance above the 200-day SMA may shift this outlook to positive.
Daily Technical Analysis
EUR/USD
Current level - 1.1319
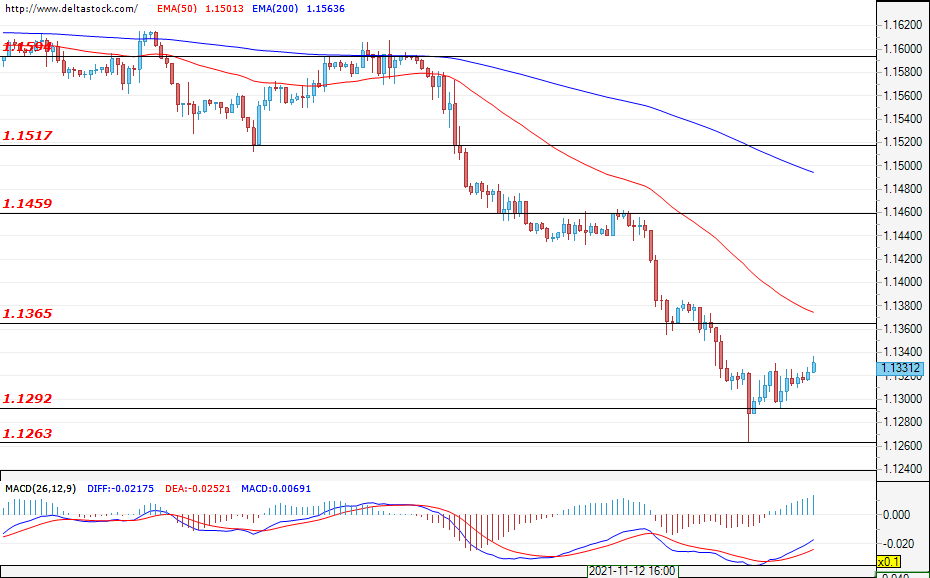
Sell-offs for the pair slowed and were limited by the support zone at around 1.1292. The market seems to be oversold and the momentum is coming to an end. The EUR/USD is expected to enter a deeper and more complex correction. A new test is possible of the area between 1.1292 and 1.1263, from where prices are expected to rebound towards the resistance at 1.1365. If a deeper correction develops, the zone should be extended and the bulls would possibly be limited by the resistance at 1.1517. Around this resistance, a resumption of the downtrend, with a potential target of 1.1180, can be expected. Today, increased activity can be expected around the release of the weekly initial jobless claims data for the United States at 13:30 GMT.
| Resistance | Support | ||
| intraday | intraweek | intraday | intraweek |
| 1.1365 | 1.1517 | 1.1292 | 1.1260 |
| 1.1460 | 1.1600 | 1.1260 | 1.1180 |
USD/JPY
Current level - 114.89
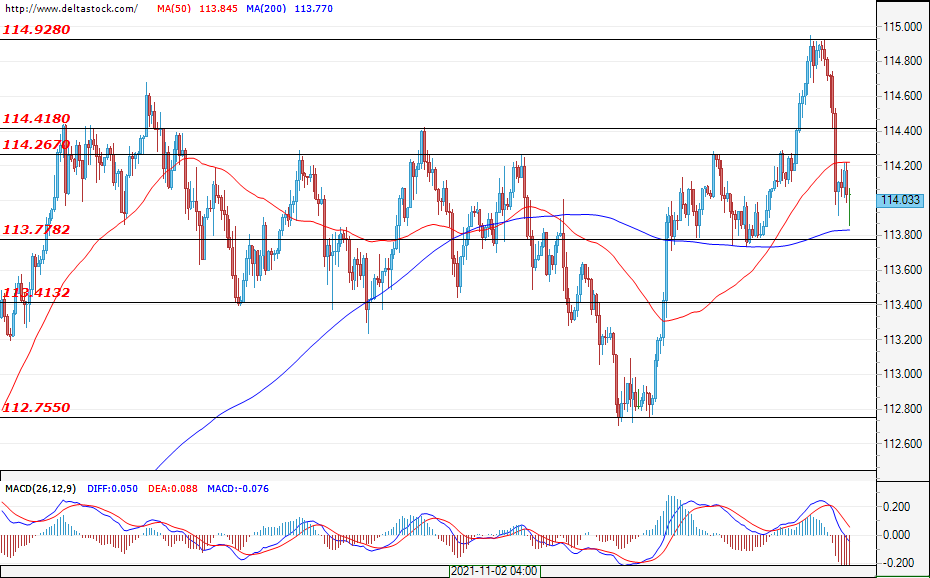
The dollar lost most of the week's gains after a wave of sell-offs around 114.92. The pair is thus again finding itself in the range between 113.41 and 114.41. Currently, the sentiment is rather neutral, with the bears prevailing if prices fall below 113.77. In such a scenario, a breach of 113.41 and a test of the support at around 112.75 can be expected. The bulls still have a chance to test the 114.92 resistance again, and a weekly close around this zone would significantly increase the odds of a new rally developing. Should sentiment shift to safe haven assets instead, there may be more declines coming for the Ninja.
| Resistance | Support | ||
| intraday | intraweek | intraday | intraweek |
| 114.92 | 115.50 | 114.41 | 113.40 |
| 115.50 | 117.00 | 113.77 | 112.75 |
GBP/USD
Current level - 1.3425
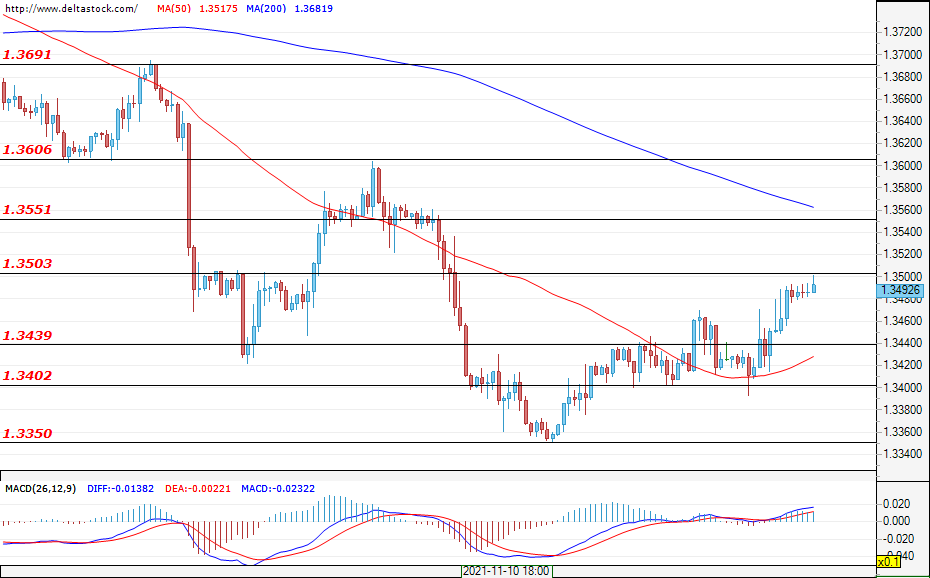
The sterling managed to breach the resistance at around 1.3439 and, in the early hours of today, the pair is gravitating around the resistance of 1.3500. A corrective phase of the market is currently under development, and expectations are for it to remain below 1.3600. A test of the 1.3440 support is possible, with the short-term expectations being for the zone to be confirmed and for the prices to bounce towards 1.3550. Investors estimate a potential rise in interest rates by the Bank of England on fresh rising inflation worries. If the sentiment persists, there could be a trend reversal from the current levels.
| Resistance | Support | ||
| intraday | intraweek | intraday | intraweek |
| 1.3500 | 1.3600 | 1.3440 | 1.3350 |
| 1.3550 | 1.3690 | 1.3400 | 1.3200 |