Sample Category Title
Japanese Yen Drifting as FOMC Looms
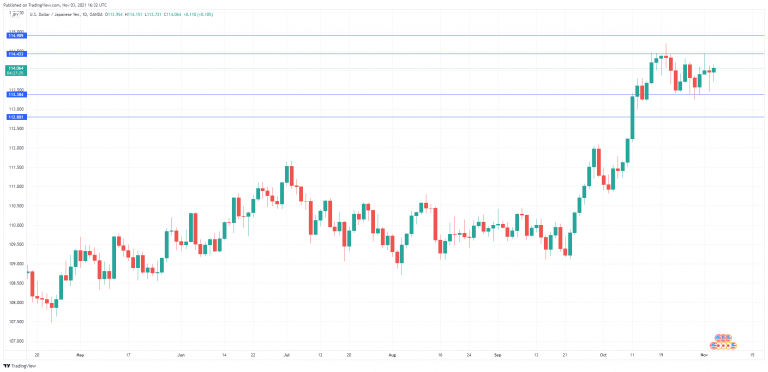
Japanese markets are closed for a holiday today and the Japanese yen is having a quiet day. USD/JPY is currently trading at 114.07, up 0.10% on the day.
FOMC expected to taper
The FOMC holds a crucial today, with the Fed very likely to scale back its USD 120 billion/mth bond purchase program (QE). The key question is just how much the Fed plans to trim QE. The markets are expecting a cut of USD 15 billion/mth, and anything else could shake up the currency markets. A smaller taper would be considered a dovish move and would weigh on the greenback, while a larger reduction would make the equity markets nervous and put upward pressure on the US dollar.
As for a rate hike, that is a whole different story. Fed Chair Jerome Powell has taken pains to remind the markets that a Fed taper does not mean that a rate hike is imminent. Still, traders have already priced in at least two rate hikes in 2022, which most Fed members do not see a rate hike before 2023. This shows a significant disconnect between market expectations and Fed guidance. The markets have been much more hawkish about inflation, which has hit its highest level in 30 years. The Fed had insisted that inflation was transitory and would ease up, but inflation has not shown any signs of cooling. Will Powell cling onto the “transitory” view in his rate statement or press conference? If so, the dollar could come under pressure. Conversely, an acknowledgment by the Fed that inflation isn’t going anywhere anytime soon could be understood by the markets as a signal that the Fed is accelerating its forward guidance, which would be bullish for the US dollar.
USD/JPY Technical
- There is resistance at 114.43. Above, there is resistance at 114.90
- There is support at 113.38. This is followed by support at 112.80
USDCHF bullish forces unable to gain advantage; bias bearish
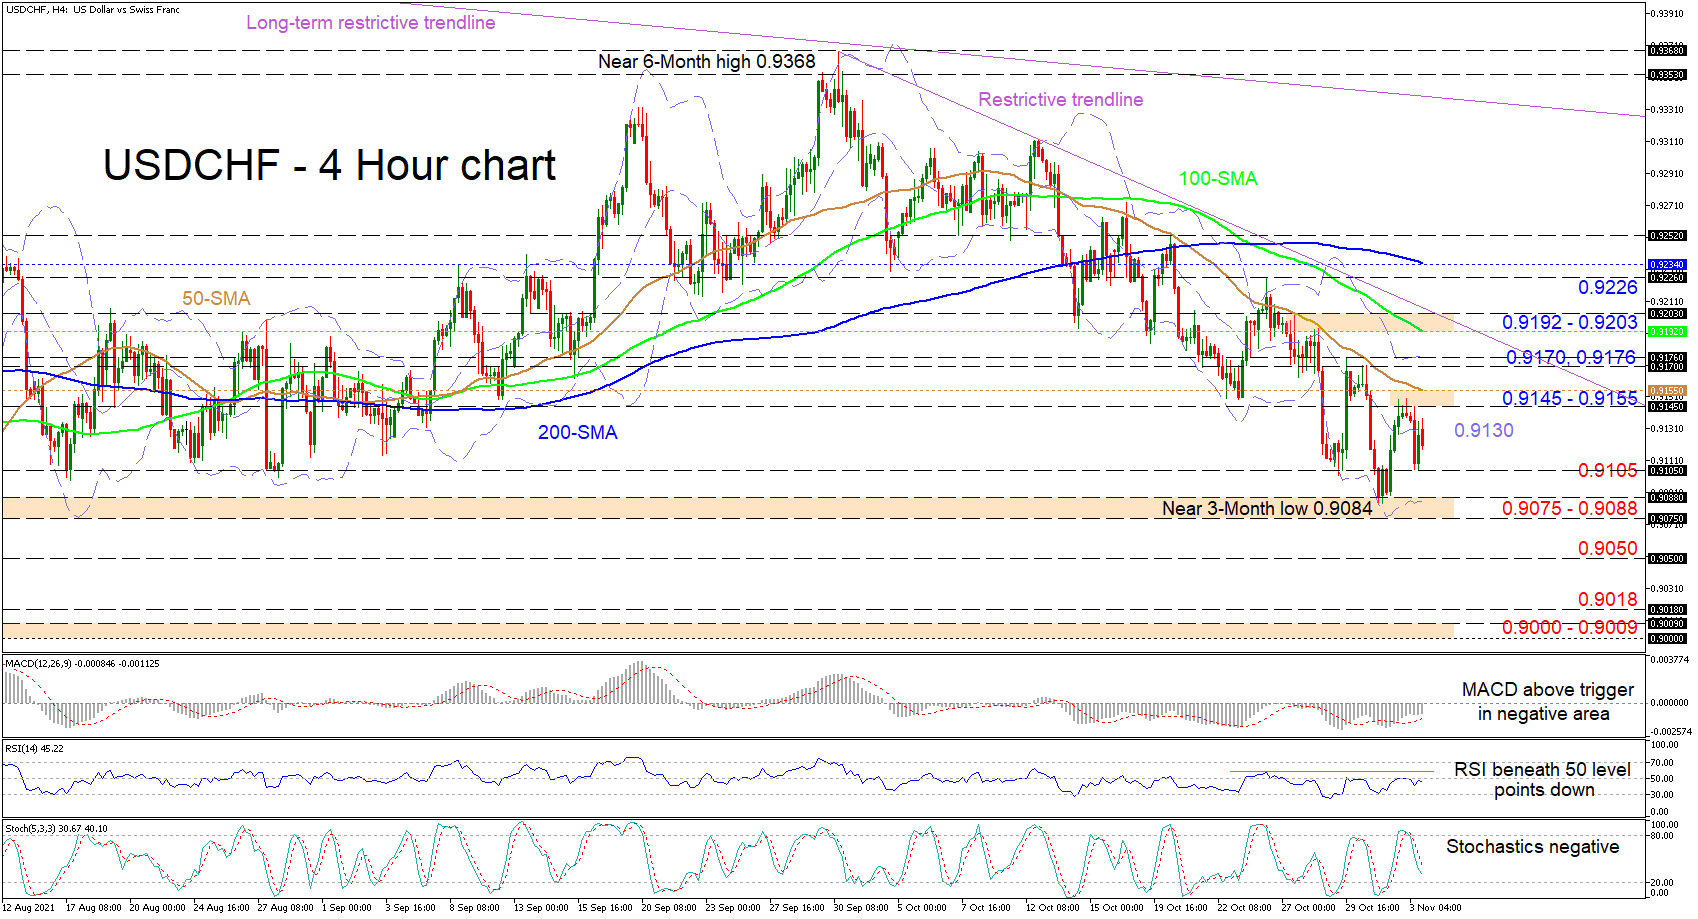
USDCHF has been deteriorating for a month after the pair hit a near 6-month peak just shy of the long-term trendline pulled from the April 2019 high of 1.0235. The price is currently steady at the mid-Bollinger band at 0.9130 and is adhering to a one-month decline. The bearish 50- and 100-period simple moving averages (SMAs) are nourishing the descent, while the gradual falling of the 200-period SMA is signalling that the pair is cementing its negative bearing.
The short-term oscillators are slightly skewed to the downside. The MACD, some distance below the zero mark, is showing that positive momentum remains feeble, while the dip in the RSI, just underneath the 50 threshold is suggesting negative momentum could return sooner rather than later. The negatively charged stochastic oscillator is also endorsing bearish price action in the pair.
If the descent remains on course, prompt downside friction could stem from the 0.9105 low ahead of the support barrier of 0.9075-0.9088, which includes a near three-month low and the lower Bollinger band. If sellers drive the price beneath this hardened obstacle, the price may snag at the August 5 border of 0.9050. Sinking further, the bears could then target the 0.9018 trough and the adjacent support boundary of 0.9000-0.9009.
To the upside, a price push over the mid-Bollinger band at 0.9130 could meet initial resistance from the area of 0.9145-0.9155, the latter being the 50-period SMA. Thrusting higher, the bulls could test the 0.9170 and 0.9176 nearby highs, where the upper Bollinger band also currently lies. Should buying interest intensify, the price may challenge the minor restrictive trendline, drawn from the 0.9368 peak, and the 0.9192-0.9203 resistance section. Successfully conquering these overlapping borders, buyers could propel the price towards the 0.9226 high and the 200-period SMA at 0.9234.
Summarizing, USDCHF is sustaining a bearish trajectory below the SMAs and the 0.9176 high. A break below the 0.9075-0.9088 barrier could reinforce negative pressures, while a price jump above the 0.9226 high is required to refuel positive belief.
Pound Edges Higher ahead of FOMC
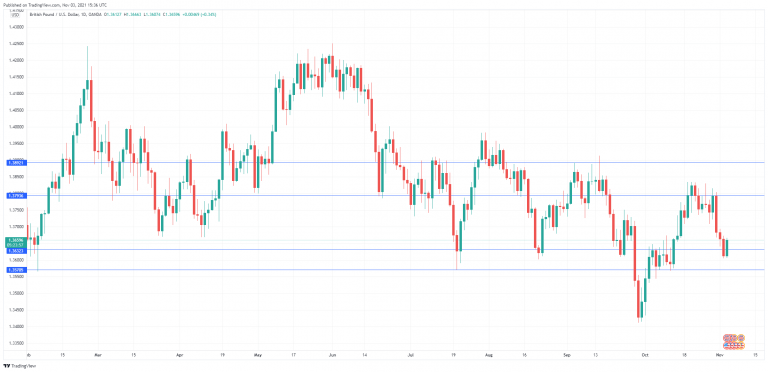
The British pound has edged higher in the Wednesday session. GBP/USD is currently trading at 1.3644, up 0.22% on the day.
FOMC will likely taper, but by how much?
The FOMC holds a key policy meeting later today, with the Fed widely expected to press the taper trigger and scale back its USD 120 billion/mth bond purchase program. The magic question which will be answered shortly is how far will the Fed go? The markets are expecting a trim of USD 15 billion/mth, and anything else could shake up the US dollar. A smaller taper would be considered a dovish move and would weigh on the greenback, while a larger reduction would make the equity markets nervous and put upward pressure on the US dollar.
What about interest rates? Fed Chair Jerome Powell has not shied away from reminding the markets that a Fed taper does not mean that a rate hike is imminent, but that won’t stop the markets from speculating on the timing of a rate hike. It would be a surprise if Powell gives a timeline for a rate hike, as the Fed appears split on when to start hiking. There is a significant disconnect between market expectations and the Fed on rate policy, with the markets pricing in a move in 2022, while some FOMC members are looking at 2023 or even 2024.
Will BoE raise rates?
The BoE follows with a policy meeting on Thursday. This is shaping into one of the most unpredictable meetings in years, as it is unclear whether the bank will raise rates or maintain the current rate of 0.10%. A hike would likely be limited to 15 basis points, but such a move would mark the first hike by a major central bank since the Covid pandemic hit in early 2019.
BoE Governor Andrew Bailey and two other MPC members are in favor of a hike; two members have voiced strong opposition to the move and four members have not stated their views. Analysts are split on which way the vote will go, which means there is a strong chance of volatility from the pound, whatever the outcome of the vote.
GBP/USD Technical Analysis
- GBP/USD faces resistance at 1.3793 and 1.3892
- There are support levels at 1.3632 and 1.3570
U.S. Services Sector Surges, Setting Records on Several Fronts
The ISM services index climbed higher to 66.7 in October from 61.9 in September, reaching a new high. This was much better than market expectations for a more modest increase to 62.0. Despite the decline in the manufacturing reading, the ISM composite reading moved to 66.1 from 61.8 in September.
Demand is booming with two major components setting all-time highs. The business activity sub-index rose by 7.5 points to 69.8 and new orders grew by 6.2 points to 69.7. The new export orders sub-index also moved higher to 62.3 – a 2.8 point increase.
Supply chain issues remain problematic. The supplier deliveries sub-index was 6.9 points higher at 75.7, suggesting that deliveries slowed significantly in October (a higher reading indicates slower deliveries). Meanwhile, the backlog of orders sub-index jumped to 67.3 from 61.9 in September, also setting an all-time high record.
Inventories are down again by 3.9 ppts to 42.2, while inventory sentiment dropped to 37.3 (-9.0 ppts), setting another record – the lowest reading in history.
The employment sub-component slowed for the fourth consecutive month, but remains in expansionary territory with a reading of 51.6 (from 53.0 in September).
The prices paid component expanded to 82.9 in October, just 0.6 points short of the all-time high record in September 2005. All 18 industries reportedly paid higher prices for inputs.
All 18 industries expanded in October.
Key Implications
The ISM services index surprised with another record reading in October. Moreover, two major subcomponents registered all time highs, confirming that consumer demand for services remains robust. Somewhat disappointing is the loss of momentum in the employment sub-index as it indicates that labor supply pressures will continue for the time being.
Other indicators of supply-side challenges moved higher too. Elevated backlogs of orders and longer supplier deliveries at a time when demand continues to accelerate leaves little chance for prices to weaken. Should supply side pressures fail to abate while consumer spending preferences continue to reorient towards services, accelerated price growth may become broader and longer-lasting. We expect that the inflationary pressure will be sustained for some time and the Fed will need to address it by raising the fed funds rate in the summer of 2022
Sunset Market Commentary
Markets
When the Fed meets, markets stop trading. So it seems, at least. Instead of risking to be wrongfooted ahead of chair Powell presenting the conclusions of tonight’s policy meeting, investors simply sought the sidelines of the trading arena. It took a blow-out ADP job report and likewise non-manufacturing ISM to cause ripples in the stoic market sea. According to the “unofficial payrolls”, employment grew with 571k in October, crushing estimates of 400k even if we account for the downward revision for last month (532k from 568k). Leisure and hospitality (185k) pulled the services sector with professional and business services (+88k) and trade & transportation (+78k). In goods-producing, construction (+54k) and manufacturing (+53k) both thrived. The US non-manufacturing ISM was outright strong with new orders jumping from 63.5 to 69.7 and business activity from 62.3 to 69.8. Together with an increase in supplier deliveries (from 68.8 to 75.7), they make up the bulk of the steep rise in the headline figure from 61.9 to a record high of 66.7. Short-term US bond rates jump with the 2y yield up 4.3 bps for the day. Longer tenors pared all (10y, +1 bp) or much of the previous declines (-1.7bps, 30y). The German curve bull flattens as well, with changes up to -2 bps (30y). Peripheral spreads narrow 3 (Greece) to 4 bps (Italy). The dollar trades mixed against its majors yet gains against the JPY and EUR. EUR/USD edges lower towards the 1.156 area. USD/JPY trades north of 114. Stock markets trade slightly in the defensive in the US and more or less unchanged in Europe.
Packed with the recent strong data, the Federal Reserve is all but certain to announce the start of tapering tonight. We foresee a pace of $15bn/month (10bn govies, 5bn MBS) to end net-buying mid-2022. Other policy tweaks are unlikely given the meeting goes without new growth, inflation and policy rates projections. That said, we do keep an eye at the central bank’s narrative on inflation. Will it stick in camp “team temporary” – much like the ECB last Thursday – or will we spot a gentle shift towards acknowledging the more persistent nature of current price pressures? The latter may come under the form of subtle wording changes that downplay the temporary element or via clearer hints that could include the Fed’s vigilance on inflation. This is not unreasonable to expect given Powell’s closely watched inflation indicators, outlined at Jackson Hole in August, are at the very least flashing orange. Such a scenario would favour US yields and the USD. Look out for key support in EUR/USD at 1.1495.
News Headlines
Inflation in Turkey rose 2.39% M/M and 19.89% Y/Y (from 19.58%) in October, the highest level since January 2019. In a yearly perspective, food and beverages (27.41%), hospitality (25.23%) and household equipment (23.03%) were the main drivers. Core inflation slowed marginally to 1.79% M/M to 16.82% Y/Y. On the other hand, PPI inflation accelerated to 5.24% M/M and 46.31% Y/Y, suggesting that price pressures are still building. The Turkish lira lost modest ground after the data (EUR/TRY trading near 11.20). Higher inflation makes the real policy rate more negative. Recently some communication of the Turkish central bank (CBRT) focused on more on core inflation rather than the headline measure. This makes markets ponder the risk whether the small ‘decline’ in core inflation might cause renewed political pressure on the CBRT to cut rates further after 3% cumulative rate cuts since September.
The US Treasury announced that it will reduce the quarterly sale of long-term debt in the November-January quarter. Next week’s sale of 3-y, 10-y and 30-y bonds will amount to $120 bln, $6 bln less than the first auction series of bonds with a similar maturity in the previous quarter. Treasury statement reads: ‘Based on the latest fiscal outlook, current auction sizes are projected to provide excess borrowing capacity over the intermediate term [allowing it to start] with modest reductions over the upcoming November 2021 to January 2022 quarter.’ ‘The changes in nominal coupon and FRN auction size […] will result in a $84 billion reduction of issuance to private investors during the November 2021-January 2022 quarter compared to the August-October 2021 quarter’.
US oil inventories rose 3.3m barrels, WTI staying in sideway consolidation
US commercial crude oil inventories rose 3.3m barrels in the week ending October 29, above expectation of 1.9m. At 434.1m barrels, oil inventories are about 6% below the five year average for this time of year. Gasoline inventories dropped -1.5m barrels. Distillate rose 2.2m barrels. Propane/propylene rose 0.4m barrels. Commercial petroleum inventories rose 0.6m barrels.
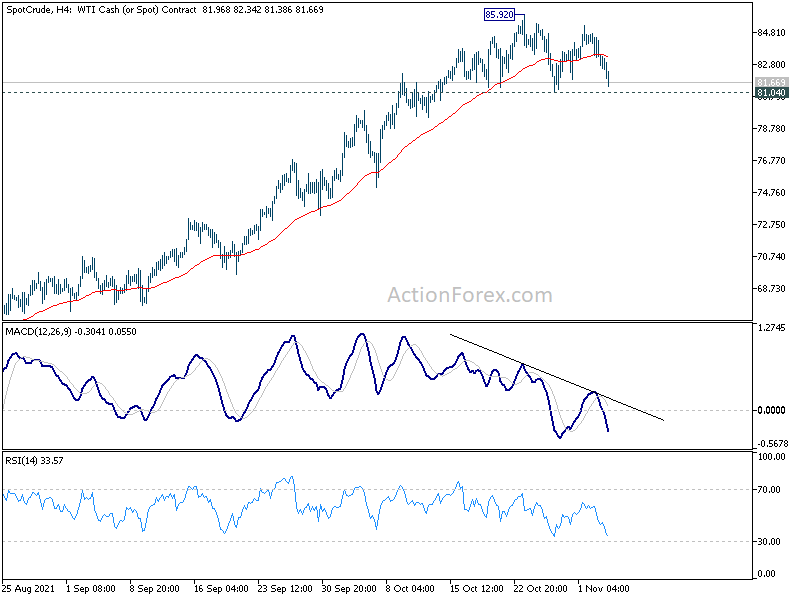
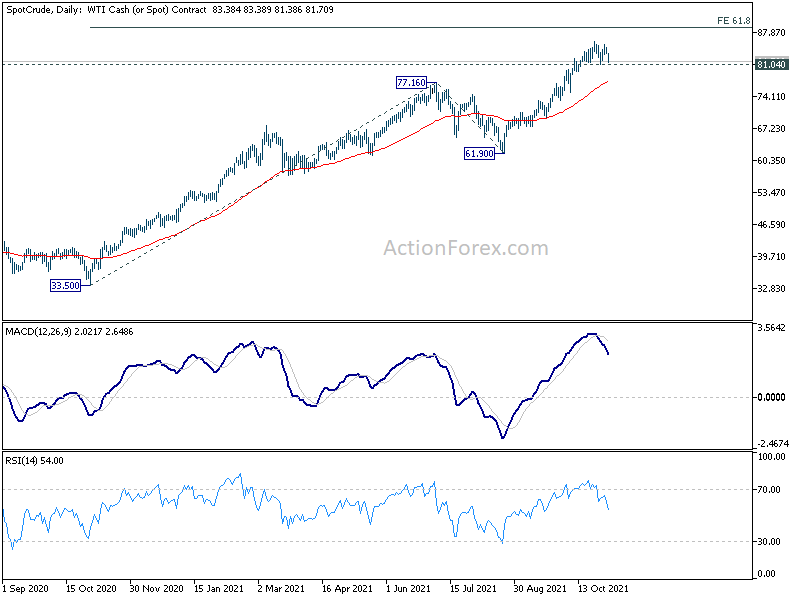
WTI crude oil is staying in consolidation from 85.92 for the moment. Such consolidation should be relatively brief as long as 81.04 support holds. Break of 85.92 will resume larger up trend to 61.8% projection of 33.50 to 77.16 from 61.90 at 88.88. However, break of 81.04 will bring deeper correction to 55 day EMA (now at 77.12) before up trend resumption.
Gold Plunges Below Supportive Trendline
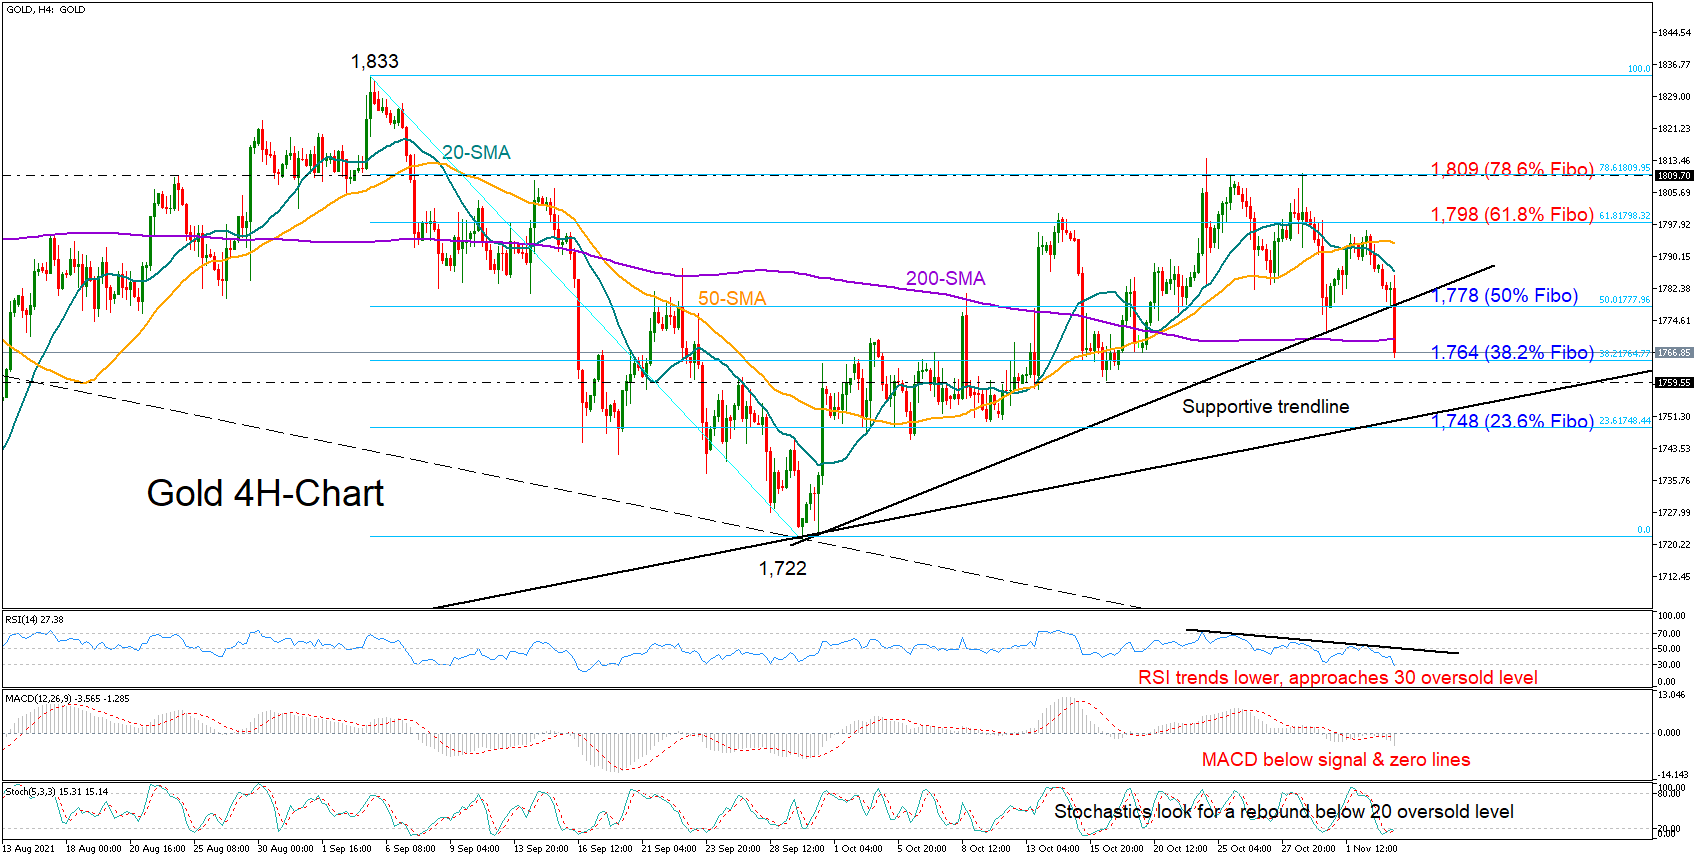
Gold slid aggressively below the ascending trendline in the four-hour chart on Wednesday, signalling more negative sessions ahead. The 50% Fibonacci retracement of the 1,833 – 1,722 downleg at 1, 777 is also positioned in the same region, making any violation important to watch.
With the RSI extending its downtrend towards its 30 oversold level, and the MACD hovering below its signal and zero lines, the odds look to be against the market. Encouragingly, though, the Stochastics suggest the sell-off could only be temporary as the indicator is already flirting with oversold levels.
A close below the 200-period simple moving average (SMA) could immediately stall near the 38.2% Fibonacci of 1,764. The way lower, however, could be even trickier for the bears, as the longer-term ascending trendline drawn from the August lows could put the brakes on the sell-off as it strictly did at the end of September.
On the upside, the 50% Fibonacci of 1,778 and the broken trendline may shift into a resistance role if the bulls resurface. A successful violation at this point could meet the 20-period SMA at 1,787, while higher, the rally may advance towards the 61.8% Fibonacci of 1,798. If more upside movements unfold, the spotlight would turn to the 78.6% Fibonacci of 1,809.
To sum up, gold is at a disadvantageous position in the short-term picture, with support expected to next develop around 1,764.
US ISM services rose to 66.7 in Oct, corresponds to 6.1% annualized GDP growth
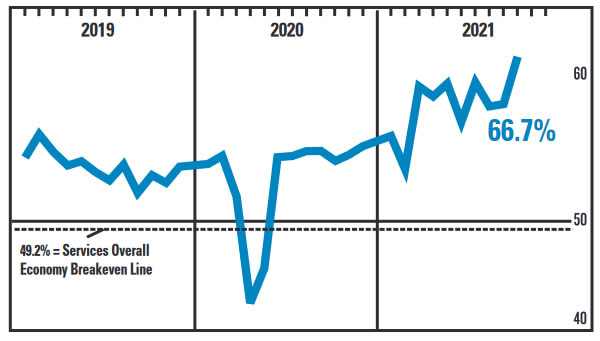
US ISM Services PMI rose to 66.7 in October, up from 61.9, well above expectation of 62.0. Business activity/production rose from 62.3 to 69.8. New orders rose from 63.5 to 69.7. Employment dropped from 53.0 to 51.6. Supplier delivers rose from 68.8 to 75.5. Prices rose from 77.5 to 82.9.
ISM said: "The past relationship between the Services PMI and the overall economy indicates that the Services PMI for October (66.7 percent) corresponds to a 6.1-percent increase in real gross domestic product (GDP) on an annualized basis."
USD/JPY Mid-Day Outlook
Daily Pivots: (S1) 113.56; (P) 113.85; (R1) 114.24; More...
USD/JPY is staying in consolidation from 114.69 and Intraday bias remains neutral. On the upside, firm break of 114.69 will resume the larger up trend to 100% projection of 102.58 to 111.65 from 109.11 at 118.18 next. Break of 113.24 will bring deeper pull back, but downside should be contained above 112.07 resistance turned support to bring rebound.

In the bigger picture, corrective decline from 118.65 (2016 high) should have completed at 101.18 already. Rise from the 102.58 is seen as the third leg of the up trend from 101.18. Next target is 114.54 resistance and then 118.65 high. This will now be the preferred case as long as 109.11 support hold, even in case of deep pull back.

USD/CHF Mid-Day Outlook
Daily Pivots: (S1) 0.9106; (P) 0.9128; (R1) 0.9168; More....
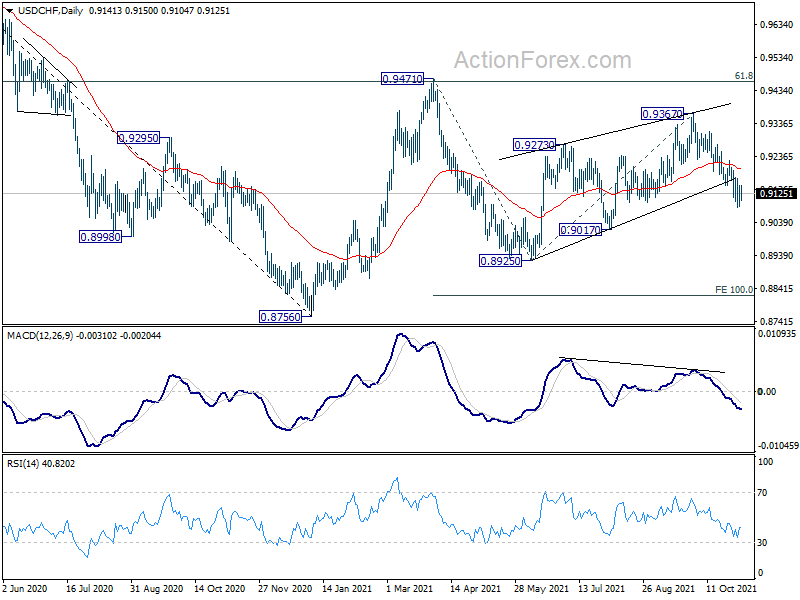
No change in USD/CHF's outlook and further fall is expected with 0.9174 resistance intact. Decline from 0.9367 should target 0.9017 support first and then 0.8925. On the upside, however, break of 0.9174 resistance will indicate short term bottoming and turn bias back to the upside for stronger rebound instead.
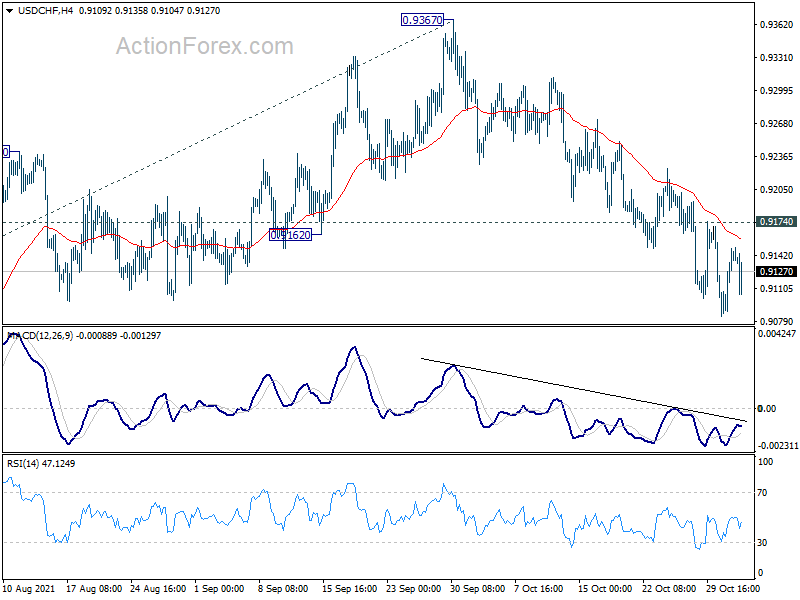
In the bigger picture, the corrective structure of the rebound from 0.8925 argues that fall from 0.9471 is not complete yet. It could either be the second leg of pattern from 0.8756 (2021 low), or resuming larger down trend from 1.0237 (2018 high). We'd pay attention to the downside momentum and assess the odds later. But for now, medium term outlook will be neutral at best as long as 0.9471 resistance holds.