Sample Category Title
Nikkei Surges on LDP’s Election Win, Yen Trades Lower
Japan's Nikkei index surges sharply by over 2% in Asian session, in very positive response to the easy win of the Liberal Democratic Party in Sunday's election. Prime Minister Fumio Kishida's LDP retained comfortable majority in the House of Representatives, ensuring continuity of the economic policies. While other Asian markets are mixed, Yen is trading slightly lower following the risk-on sentiment. Dollar is currently the stronger one for the day.
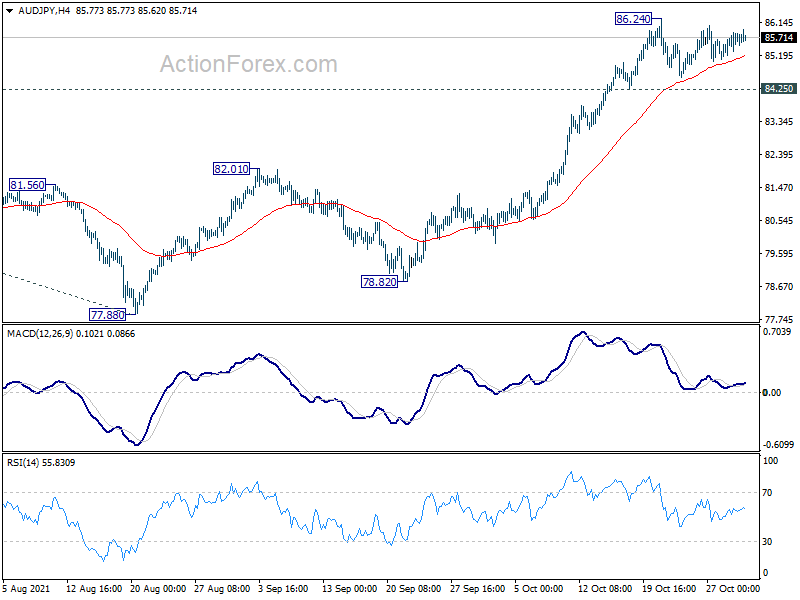
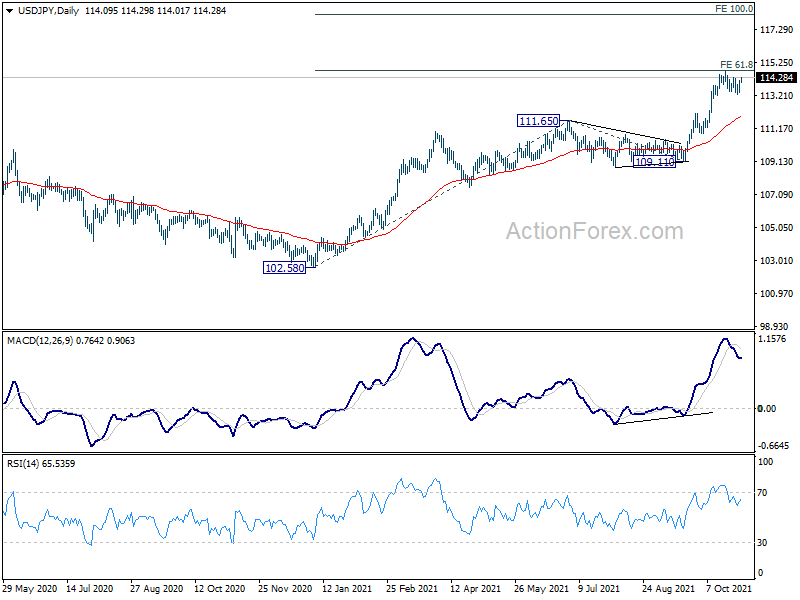
Technically, USD/JPY would be a focus for today, as corrective pull back from 114.69 might be finished at 113.24. Current rebound could extend to retest 114.69 and break there will confirm up trend resumption. If that happens, we'd also monitor if other Yen crosses follow. For example, AUD/JPY would also break through 86.24 to resume medium term up trend.
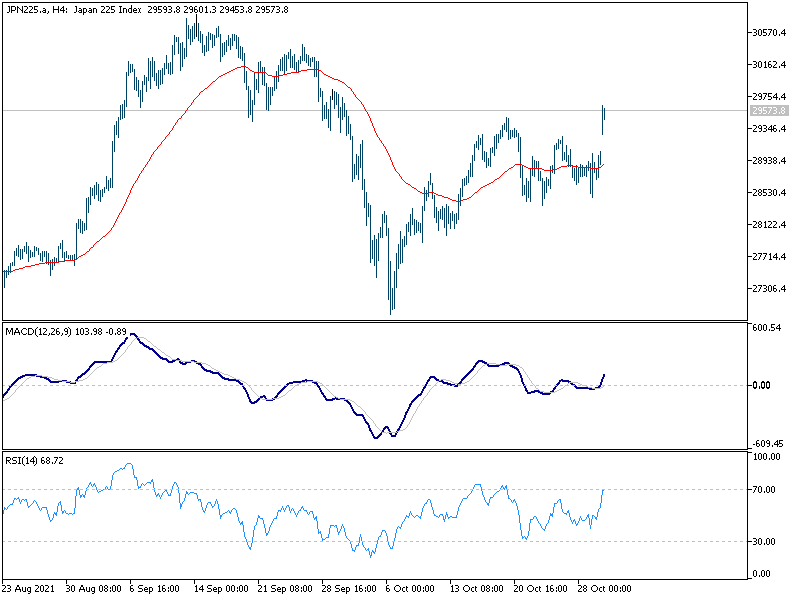
In Asia, at the time of writing, Nikkei is up 2.31%. Hong Kong HSI is down -1.10%. China Shanghai SSE is up 0.07%. Singapore Strait Times is up 0.83%. Japan 10-year JGB yield is up 0.008 at 0.108.
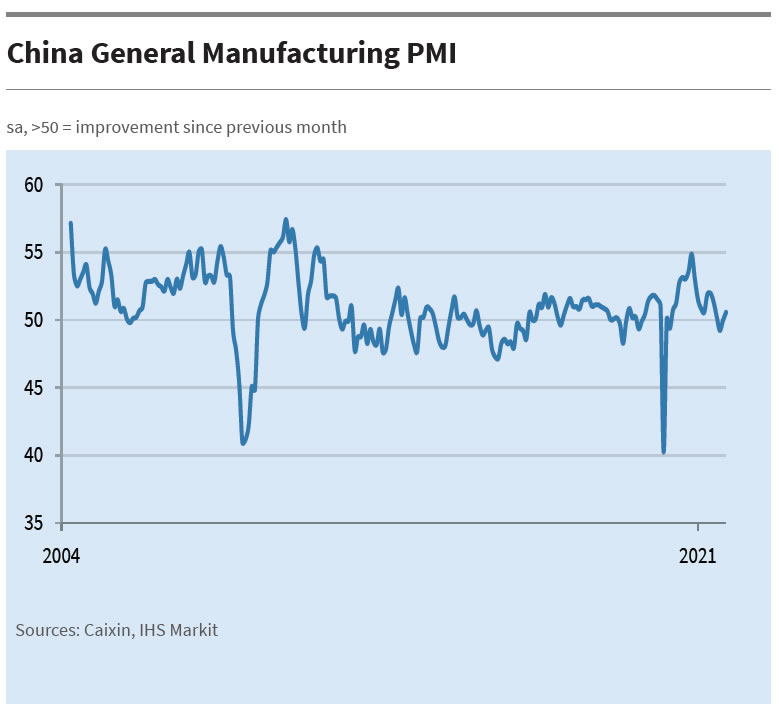
China Caixin PMI manufacturing rose to 50.6, supply strains became the paramount factor
China Caixin PMI Manufacturing rose to 50.6 in October, up from 50.0, above expectation of 50.6. Caixin noted total new work had the strongest increase in four months. Production fell modestly amid rising costs and reduced power supply. Average lead times rose at fastest rate since March 2020.
Wang Zhe, Senior Economist at Caixin Insight Group said: "To sum up, manufacturing recovered slightly in October from the previous month. But downward pressure on economic growth continued. We noticed that the pandemic's impact on manufacturing faded from late September to mid-October as the number of new Covid-19 cases dropped, which boosted demand.
"However, supply strains became the paramount factor affecting the economy. Shortages of raw materials and soaring commodity prices, combined with electricity supply problems, created strong constraints for manufacturers and disrupted supply chains. Input costs for manufacturers have risen much faster than output prices for several months, putting a lot of pressure on downstream enterprises."
Released over the weekend, official PMI Manufacturing dropped to 49.2 in October, down from 49.6, below expectation of 49.7. PMI Non-Manufacturing dropped to 52.4, down from 53.2, below expectation of 53.0.
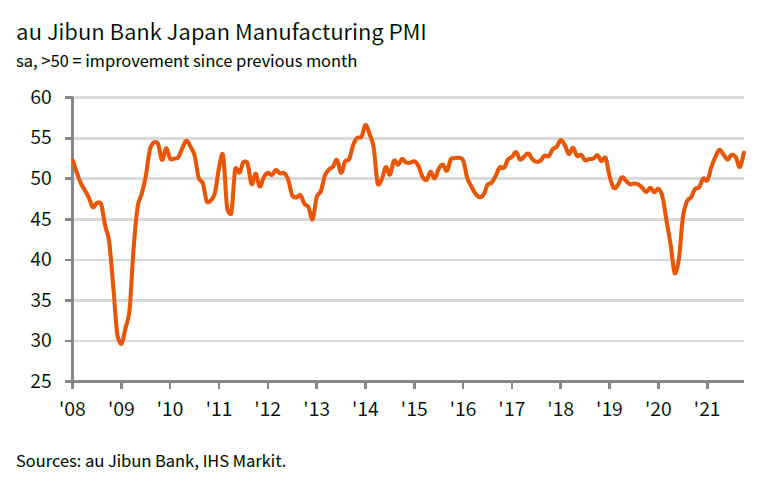
Japan PMI manufacturing finalized at 53.2 in Oct, record business optimism
Japan PMI Manufacturing was finalized at 53.2 in October, up from September's 51.5. Markit said there were renewed rises in output and new orders. Input prices and output charges rose at quickest rate in over 13 years. Business optimism accelerated to series-record high.
Usamah Bhatti, Economist at IHS Markit, said: "October PMI data pointed to a stronger expansion in the Japanese manufacturing sector at the start of the fourth quarter... Overall, the headline Manufacturing PMI was at its highest reading since April and the second-highest in the year to date...
"Material shortages and delivery delays induced sharp rises in input prices, as average cost burdens rose at the sharpest pace since August 2008. This contributed to higher charges for clients in attempts to cover margins, with factory gate inflation quickening to a 13-year high..
"Confidence about the outlook reached the highest level since the series began in July 2012, as hopes that the end of the pandemic would stimulate a broad market recovery gathered pace. This is broadly in line with the IHS Markit forecast for industrial production to grow 7.1% this year and 4.3% in 2022."
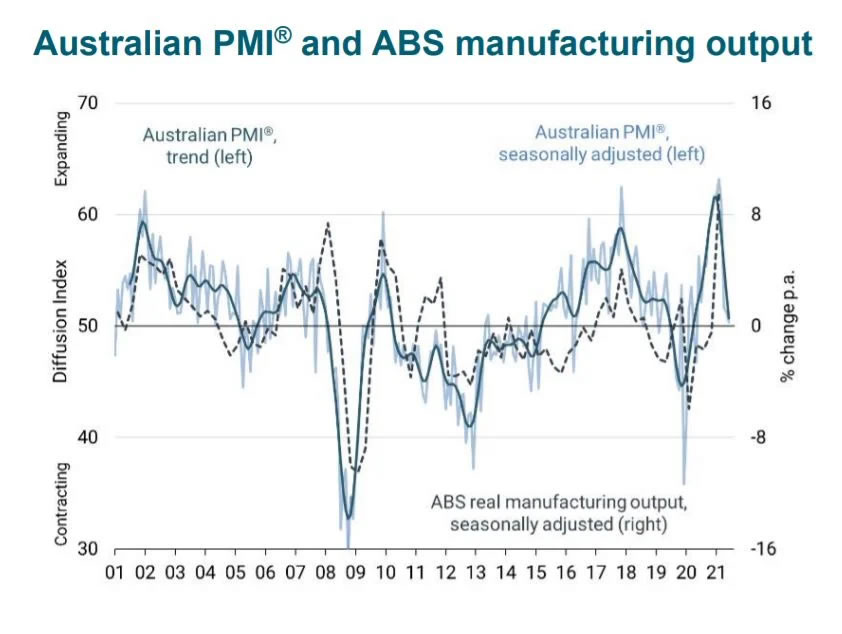
Australia AiG manufacturing dropped to 50.4, but encouraged by rise in new orders
Australia AiG Performance of Manufacturing Index dropped -0.8 to 50.4 in October. That's the fourth consecutive month of decline and lowest reading since September 2020. Looking at some details, production dropped -5.3 to 47.8. Employment rose 0.9 to 48.0. New orders rose 6.3 to 58.3. Exports dropped -5.8 to 46.1. Input prices rose 3.7 to 81.8. Selling prices dropped -0.8 to 63.9. Average wages rose 10.8 to 63.7.
Ai Group Chief Executive Innes Willox said: "Although restrictions began to be eased, vaccination rates rose and the country edged towards a living with COVID approach, the year-long run of improving manufacturing performance was put on hold in October.... Although October was nothing to write home about, manufacturers will be encouraged by the sharp lift in new orders received and by the further progress towards removing COVID restrictions.
Looking for wild reactions to RBA, Fed and BoE
Three central banks will meet this week, and reactions could be wild.
RBA meeting has become interesting after it refrained defending its yield curve control. Yield on April 2024 Australia government bonds surged to close at 0.775%, way above target of 0.1%. The development prompted speculation that RBA could have a hawkish shift this week. An adjustment to the bond purchase program, currently at AUD 4B per week until at least February 2022, is an option. Or RBA could also signal that the conditions for rate hike would come earlier than 2024. And of course, RBA would also just do nothing. Volatility of Aussie cold be wild if RBA takes any of these paths.
As for Fed, it should now be ready to announce the long awaited tapering. The question is on the pace of reduction in asset purchases, and the FOMC's expectation on when to end it. For now, Chair Jerome Powell should maintain that rate hike is a complete separate decision to tapering. He would also reiterate that even though the temporary factors driving up prices might last longer than expected, the current surge in inflation is still transitory.
BoE is clearly getting closer to a rate hike, after some policy makers including Governor Andrew Bailey said monetary policy "will have to act and must do", if medium term inflation expectations are getting out of control. And they didn't object to the idea that rate hike could come before the end of asset purchases, which completes on December 31. So as new Chief Economist Huw Pill put, November is "finely balanced" and "live". Even if there is no rate hike delivered, hawkish voting could also continue to support Sterling.
On the data front, there will be US ISMs and non-farm payroll, Canada employment, Eurozone unemployment rate, Swiss CPI and retail sales, Australia trade balance, New Zealand employment and China PMIs. It's a very busy week and here are some highlights:
- Monday: Australia AiG manufacturing; Japan PMI manufacturing final; China Caixin PMI manufacturing; Swiss PMI manufacturing; UK PMI manufacturing final; US ISM manufacturing, construction spending.
- Tuesday: Japan monetary base, BoJ minutes; RBA rate decision; Swiss CPI, retail sales; Eurozone PMI manufacturing final.
- Wednesday: Australia AiG construction, building approvals; New Zealand employment, labor cost index; China Caixin PMI services; UK PMI services final; Eurozone unemployment rate; US ADP employment, ISM services, factory orders, FOMC rate decision.
- Thursday: Australia retail sales, trade balance; Swiss SECO consumer climate; Germany factor orders; Eurozone PMI services final, PPI; UK PMI construction, BoE rate decision; Canada trade balance; US trade balance, jobless claims, non-farm productivity.
- Friday: Australia AiG services, RBA monetary policy statement; Japan household spending; Germany industrial production; France industrial production; Swiss foreign currency reserves; Eurozone retail sales; Canada employment, Ivey PMI; US non-farm payrolls employment.
USD/JPY Daily Outlook
Daily Pivots: (S1) 113.55; (P) 113.82; (R1) 114.25; More...
USD/JPY rebounds today but stays in range below 114.69. Intraday bias remains neutral first. On the upside, firm break of 114.69 will resume the larger up trend to 100% projection of 102.58 to 111.65 from 109.11 at 118.18 next. In case of deeper pull back, downside should be contained above 112.07 resistance turned support to bring rebound.
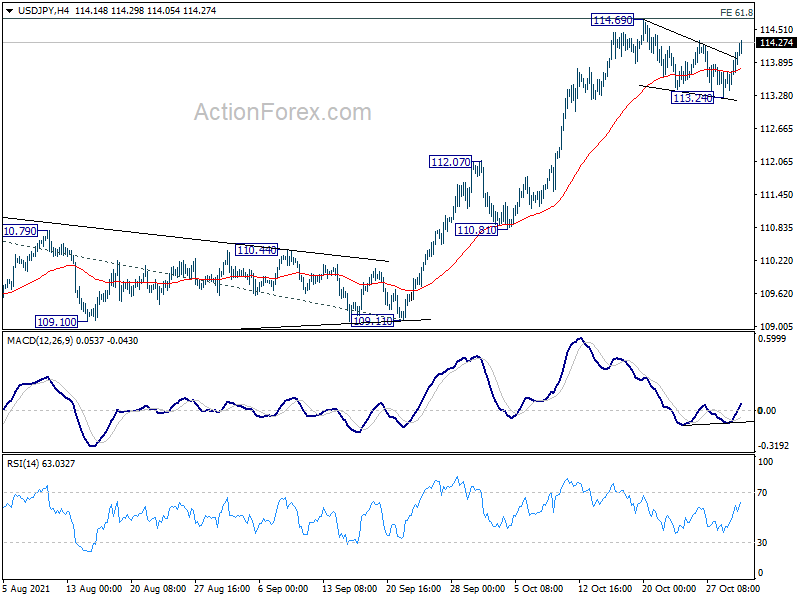
In the bigger picture, corrective decline from 118.65 (2016 high) should have completed at 101.18 already. Rise from the 102.58 is seen as the third leg of the up trend from 101.18. Next target is 114.54 resistance and then 118.65 high. This will now be the preferred case as long as 109.11 support hold, even in case of deep pull back.
Economic Indicators Update
| GMT | Ccy | Events | Actual | Forecast | Previous | Revised |
|---|---|---|---|---|---|---|
| 21:30 | AUD | AiG Performance of Manufacturing Index Oct | 50.4 | 51.6 | ||
| 0:30 | JPY | Manufacturing PMI Oct | 53.2 | 53 | 53 | |
| 1:45 | CNY | Caixin Manufacturing PMI Oct | 50.6 | 50.2 | 50 | |
| 7:00 | EUR | Germany Retail Sales M/M Sep | 0.60% | 1.10% | ||
| 8:30 | CHF | SVME PMI Oct | 65.5 | 68.1 | ||
| 9:30 | GBP | Manufacturing PMI Oct F | 57.7 | 57.7 | ||
| 13:30 | CAD | Manufacturing PMI Oct | 57.2 | 57 | ||
| 13:45 | USD | Manufacturing PMI Oct F | 59.2 | 59.2 | ||
| 14:00 | USD | ISM Manufacturing PMI Oct | 60.4 | 61.1 | ||
| 14:00 | USD | ISM Manufacturing Prices Paid Oct | 82.5 | 81.2 | ||
| 14:00 | USD | ISM Manufacturing Employment Index Oct | 50.2 | |||
| 14:00 | USD | Construction Spending M/M Sep | 0.50% | 0.00% |
China Caixin PMI manufacturing rose to 50.6, supply strains became the paramount factor
China Caixin PMI Manufacturing rose to 50.6 in October, up from 50.0, above expectation of 50.6. Caixin noted total new work had the strongest increase in four months. Production fell modestly amid rising costs and reduced power supply. Average lead times rose at fastest rate since March 2020.
Wang Zhe, Senior Economist at Caixin Insight Group said: "To sum up, manufacturing recovered slightly in October from the previous month. But downward pressure on economic growth continued. We noticed that the pandemic's impact on manufacturing faded from late September to mid-October as the number of new Covid-19 cases dropped, which boosted demand.
"However, supply strains became the paramount factor affecting the economy. Shortages of raw materials and soaring commodity prices, combined with electricity supply problems, created strong constraints for manufacturers and disrupted supply chains. Input costs for manufacturers have risen much faster than output prices for several months, putting a lot of pressure on downstream enterprises."
Japan PMI manufacturing finalized at 53.2 in Oct, record business optimism
Japan PMI Manufacturing was finalized at 53.2 in October, up from September's 51.5. Markit said there were renewed rises in output and new orders. Input prices and output charges rose at quickest rate in over 13 years. Business optimism accelerated to series-record high.
Usamah Bhatti, Economist at IHS Markit, said: "October PMI data pointed to a stronger expansion in the Japanese manufacturing sector at the start of the fourth quarter... Overall, the headline Manufacturing PMI was at its highest reading since April and the second-highest in the year to date...
"Material shortages and delivery delays induced sharp rises in input prices, as average cost burdens rose at the sharpest pace since August 2008. This contributed to higher charges for clients in attempts to cover margins, with factory gate inflation quickening to a 13-year high..
"Confidence about the outlook reached the highest level since the series began in July 2012, as hopes that the end of the pandemic would stimulate a broad market recovery gathered pace. This is broadly in line with the IHS Markit forecast for industrial production to grow 7.1% this year and 4.3% in 2022."
Australia AiG manufacturing dropped to 50.4, but encouraged by rise in new orders
Australia AiG Performance of Manufacturing Index dropped -0.8 to 50.4 in October. That's the fourth consecutive month of decline and lowest reading since September 2020. Looking at some details, production dropped -5.3 to 47.8. Employment rose 0.9 to 48.0. New orders rose 6.3 to 58.3. Exports dropped -5.8 to 46.1. Input prices rose 3.7 to 81.8. Selling prices dropped -0.8 to 63.9. Average wages rose 10.8 to 63.7.
Ai Group Chief Executive Innes Willox said: "Although restrictions began to be eased, vaccination rates rose and the country edged towards a living with COVID approach, the year-long run of improving manufacturing performance was put on hold in October.... Although October was nothing to write home about, manufacturers will be encouraged by the sharp lift in new orders received and by the further progress towards removing COVID restrictions.
EUR/USD Could Extend Losses Below 1.1500
Key Highlights
- EUR/USD failed to settle above the 1.1650 and 1.1665 resistance levels.
- It broke a major rising channel with support near 1.1595 on the 4-hours chart.
- GBP/USD is moving lower and struggling to stay above 1.3650.
- The US ISM Manufacturing Index could decline from 61.1 to 60.4 in Oct 2021.
EUR/USD Technical Analysis
The Euro attempted an upside break above 1.1665 against the US Dollar. However, EUR/USD failed to gain momentum and formed a high near 1.1692.
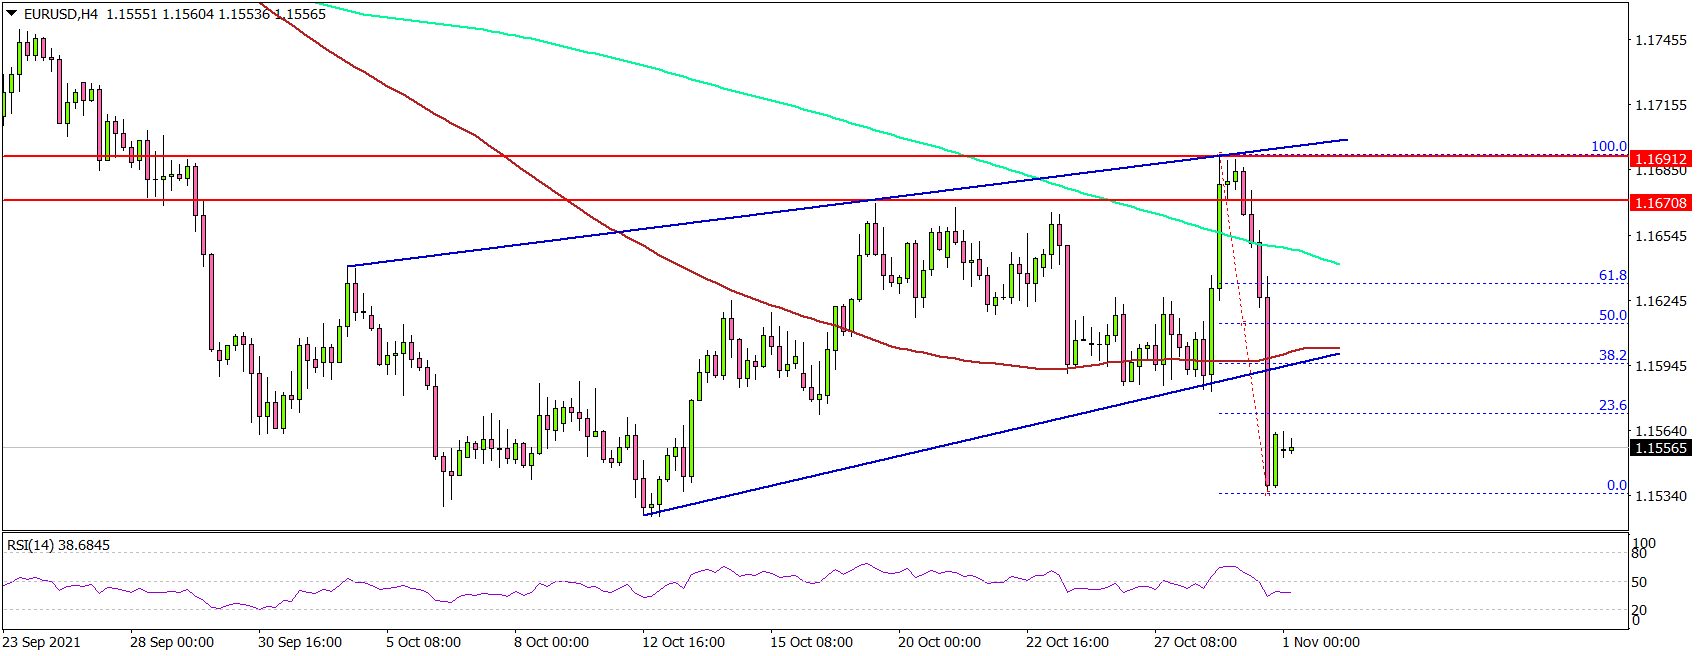
Looking at the 4-hours chart, the pair started a fresh decline below the 1.1665 level. There was a sharp decline below the 1.1620 support. The pair even settled below 1.1600, the 100 simple moving average (red, 4-hours) and the 200 simple moving average (green, 4-hours).
Besides, there was a break below a major rising channel with support near 1.1595 on the same chart. It retested the 1.1535 level and is currently consolidating losses.
On the downside, an initial support is near 1.1535 level. The next major support is near 1.1500. A close below the 1.1520 level might push the pair towards the 1.1450 support.
On the upside, an immediate resistance is near the 1.1600 level and the 100 SMA. The next major resistance is near the 1.1620 level, above which the pair might rise towards the 1.1665 level. A close above 1.1665 could open the doors for a steady increase.
Looking at GBP/USD, the pair failed to clear the 1.3830 level and started a fresh decline. It is now struggling to stay above the 1.3650 support.
Economic Releases
- US Manufacturing Index for Oct 2021 – Forecast 59.2, versus 59.2 previous.
- US ISM Manufacturing Index for Oct 2021 – Forecast 60.4, versus 61.1 previous.
RBA Should Lift Forecasts; Abandon Specific Guidance
As discussed last week tomorrow’s RBA Board meeting should be used to abandon the specific guidance that rates are on hold until 2024. Associated with that would be to abandon the Yield Curve Control Policy. This guidance was adopted at a time of an extreme emergency which has now passed.
The Reserve Bank Board meets tomorrow for what is becoming a very important meeting.
Last week we confirmed our view that the cash rate is expected to remain on hold until the February Board meeting in 2023.
But tomorrow’s meeting will be about the Board’s guidance and any implications for unconventional monetary policy.
We want to see a significant revision to the Bank’s economic forecasts.
Last week we noted our expectation that the Bank will revise up its forecast for core inflation (Trimmed Mean) from the current 1.75% in 2022 to 2.5%.
That will still be below Westpac’s forecast of 2.8% but will also lay the foundation for a further lift to 2.75% by the end of 2023 (current forecast is 2.25%, an increase of 0.5% over 2023)
The Bank’s current forecast for wages growth by end 2022 is 2.5% building to 2.75% by end 2023.
As noted, last week Westpac’s current forecast is 2.75% by end 2022 and it is reasonable that the Bank will lift its wages forecast to near the Westpac forecast.
For the unemployment rate the Bank is forecasting 4.25% by end 2022; Westpac is forecasting 3.8%. It is also reasonable that the Bank will lower its unemployment forecast to nearer 4.0% – the level that we assess is consistent with full employment.
An important factor in the likely lowering of the unemployment rate forecast and the faster increases in wages and prices growth is likely to be a significant lift in the forecast economic growth rate for 2022 from the Bank’s current 4.25% to around 6% (Westpac’s current forecast is 7.4%).
There has been a very important change in RBA policy that will be the defining condition for the upcoming cycle.
That change is to not begin the rate hike cycle until the core inflation rate has reached 2.5% and looks to be holding there on a sustainable basis.
It will also be necessary to have achieved full employment with associated clear evidence that wage inflation is materially higher than currently – a 3% target has been noted in various speeches from RBA executives.
For these reasons we can see, based on their current forecasts, why the Governor has consistently signalled that the necessary conditions for the rate hike will not be reached until 2024.
But if the Bank adopts the more upbeat outlook that aligns fairly closely with Westpac’s forecasts, then the 2024 condition would not be consistent with the revised forecasts.
As discussed last week, we expect that the appropriate guidance that will be delivered in the Governor’s Statement following the Board meeting tomorrow will be to exclude the 2024 guidance.
If that is done it is unlikely that the unconventional approach of setting a date would be retained.
As I noted last week.” Personally, I would strongly applaud acceptance that the Governor now expects that the conditions necessary to begin the move away from the emergency policy settings will be achieved earlier than previously expected. The strong existing guidance, particularly during 2020, was key to underpinning confidence in the RBA’s commitment to doing everything reasonably within its powers to protect the Australian economy.”
But setting specific dates for policy changes has not been a standard policy for the RBA in previous cycles.
Now that the emergency has passed; the economy is reopening; and there are early signs that the Board may be closer to achieving its objectives the time is right to move away from such a rigid policy approach.
Of course, if the “2024 guidance” is removed then the complementary policy – Yield Curve Control- would also have to be removed.
Indeed, if the “2024” guidance is maintained then the Bank is likely to have to persevere with the YCC policy to maintain its credibility.
With probably only around $10 billion of April 2024 bonds not already in the hands of the RBA, persevering with YCT would not be a hugely expensive exercise but clearly disruptive for markets, given recent developments.
Nominating an earlier period for the lifting of the cash rate and an associated YCT target for a shorter bond would also be highly unlikely.
As discussed, the naming of a lift off date was part of a set of emergency measures that does not need to be perpetuated given the current normalisation of economic conditions and the positive economic outlook.
Conclusion
The emergency policy measures of nominating a date for the beginning of the rate hike cycle and the complementary Yield Curve Control policy has been important for strengthening expectations of a long period of low rates at a time when the economy was facing a major crisis.
Now that those uncertainties have passed the time is right to move back to a standard approach of not setting specific dates for the policy outlook or needing to emphasise the strength of that commitment with the YCCT policy.
Market Morning Briefing: Aussie Has Immediate Resistance Near 0.7550
STOCKS
Equities seem to have recovered from crucial supports. Dow can test crucial resistance at 36000/100 before falling from there in the medium term. Dax can rise towards 15900 before again falling off from there. Nikkei has risen well and looks bullish for a rise to 30000/31000 on sustained trade above 29500. Shanghai is bullish while above 3500. Fall in Nifty can be limited to 17400 for now before a bounce back to 18000 or higher is seen. Sensex can remain within 59000-60000 for now.
Dow (35819.56, +89.08, +0.25%) has risen and is headed towards crucial resistance near 36000/100. While that holds, a decline back to 35500-35000 is possible in the medium term. A range of 35000/500-36000/100 can hold for the near term.
DAX (15688.77, -7.56, -0.048%) has dipped further. The range of 15900-15400 is holding well. A strong break on either side is needed for further directional clarity. But while below 15900, view remains bearish for the medium term.
Nikkei (29538.15, +645.46, +2.23%) has risen sharply today, breaking above the resistance at 29250/500. Any pull back can take it down to 28500-28000 in the near term. Else an eventual rise to 30000/31000 looks possible in the medium term.
Shanghai (3545.83, -1.51, -0.045%) has bounced from 3500 after falling sharply for 3-consecutive sessions from 3625. While above 3500, a rise to 3600 looks possible else we night have to look at lower targets of 3400.
Nifty (17671.65, -185.6, -1.04%) went up to make a high of 17915.85 and has come down sharply from there. A break below 17600 can take the index down towards 17400 in the near term. 17400 is a good support which can hold for now and produce a bounce towards 18000 in the medium term. In case 17400 breaks, the view would be further bearish towards 17000 before any reversal is seen. Preferred is to see a bounce from 17400/600 levels.
Sensex (59306.93, -677.77, -1.13%) has come down further on Friday. The view is to see a dip towards 59000/58500 before we see a bounce towards 60000/61000 again. A fall below 59000, if seen can pull the index towards lower support at 57000.
COMMODITIES
Crude prices have dipped with WTI rising more than Brent and reducing the Brent-WTI spread. As the spreads fall it could indicate an eventual fall in crude prices going forward. Gold can be ranged within 1810-1755 both being important resistance and support levels. Silver can be ranged within 23.50-25 while Copper is bullish towards 4.50 while above support at 4.30.
Brent (83.47) and WTI (83.17) have dipped again. While above 80 the view is bullish to see a rise towards 85/86 in Brent and 84/85 in WTI. The Brent-WTI spread (0.3) has come down sharply and could be indicative of a possible fall in crude prices in the near term.
Gold (1787.60) has immediate resistance at 1810 and support near 1760/55. A range of 1810-1755 may hold for the near term. While Dollar trades strong, Gold can come off to the lower end of the mentioned range in the near term before attempting to bounce back again in the longer run.
Silver (23.91) can rise towards 25 if the price holds above immediate support near 23.50. A range of 23.50-25 may hold for the near term.
Copper (4.3905) has support at 4.30 which if holds can produce a rise towards 4.50/55 in the near term. View is to see a rebound while above 4.30.
FOREX
Volatility picks up in currencies as Dollar Index rose sharply from levels below 93.50 to head to 94+ now. There is scope for a further rise to 95. Euro is pulled down to levels below 1.16 as resistance near 1.17 is holding well. Further bearishness towards 1.15 initially and lower towards 1.14 is a possibility. Pound and Aussie trade lower on Dollar strength. Dollar Yen has bounced well and can move up eventually. USDCNY may trade within 6.38-6.41/42. USDINR may trade within 74.70/80-75.00 for the next 3-sessions but we would keep a close watch for any breakout.
Dollar Index (94.168) rose sharply from 93.28 seen last week and has scope to rise towards 95-95.50 while above 94. Watch if the index sustains above 94 to rally higher.
Euro (1.1557) rose sharply to 1.1692 on Thursday but all gains were wiped off as resistance at 1.17 seem to hold well pushing the Euro sharply down to levels below 1.16 again now. Note that 1.17-1.1750 may hold as strong resistance for the medium term keeping price lower. Sustained trade below 1.16 may open up chances of a fall to 1.15 or even towards 1.1450 on the downside. Such a fall can be accompanied by Dollar Index rising towards 95.
EURJPY (131.84) is holding above 131.50 just now and has resistance near 133.50 on the upside which if holds can keep the pair within 131.50-133.50 for the near term. A break above 133.50, if seen in the medium term would again be bullish, For now a consolidation looks likely within the mentioned levels.
Aussie (0.7512) has immediate resistance near 0.7550 which if holds can push the exchange down towards 0.7450 or lower in the coming sessions. A break above 0.7550, if seen would break above the immediate resistance indicating a rally towards 0.78 in the longer run, but that looks less likely for now.
Pound (1.3684) fell sharply from levels above 1.38 as Dollar Index rebounded from levels below 93.50. While below immediate resistance at 1.3850, view is bearish for a fall to 1.355-1.35.
Dollar-Yen (114.08) is holding above our mentioned support at 113-113.25 and while that holds, a rise back to 114.50-115 or higher cannot be negated. The rise in Dollar-Yen would be in line with Dollar strength for the near term.
USDCNY (6.4044) has risen well and could face rejection from 6.41/42 in the near term which could lead to a corrective fall to 6.39/38 before again resuming the upmove. Overall tend looks bullish for the longer run while above 6.3750-6.38.
USDINR (74.88) can continue to range within 74.70/80-75.00 region for this week, as India enters the Diwali mood and week remains short with three sessions to go. Watch for any break on either side of the mentioned range.
INTEREST RATES
US Treasury Yields have dipped at the far-end. The chances are high for the 10Yr and 30Yr to dip further ahead of the US Federal Reserve meeting on Wednesday. The outcome of this meeting might be key in deciding whether the yields will sustain above their crucial supports or will break below it. The German Yields look mixed. The 10Yr is range bound while the 30Yr continues to fall and has room to dip further in the coming days. The 10Yr GoI is inching up towards the upper end of our expected 6.3%-6.4% range while the 5Yr looks relatively much stronger and can see a fresh rise breaking the 5.66%-5.76% range on the upside.
The US 2Yr (0.50%) and the 5Yr (1.18%) Treasury yields remain stable while the 10Yr (1.55%) and the 30Yr (1.93%) have dipped. On the charts, the chances are looking high for the 10Yr and the 30Yr to test 1.5% and 1.85% respectively on the downside ahead of the US Federal Reserve meeting on Wednesday. A strong break below 1.5% (10Yr) and 1.85% (30Yr) is needed to see a deeper fall. Else a bounce-back move to 1.65%-1.7% (10Yr) and 2% (30Yr) cannot be ruled out.
The German 2Yr (-0.60%), 5Yr (-0.39%) and the 10Yr (-0.11%) yields have moved up while the 30Yr (0.13%) has dipped. The 30Yr keeps intact the near-term bearish view of testing 0.1%-0.05% on the downside. The 10Yr on the other hand is oscillating between -0.1% and -0.2% for now. But the bias is bearish to break -0.2% and fall to -0.3% and -0.4% eventually.
The Indian 10Yr GoI (6.3718%) remains higher but stable. A test of the upper end of our expected range of 6.3%-6.4% looks likely now. It will have to be seen if the 10Yr GOI can breach 6.4% and extend the rise to 6.45%-6.5% which is needed to negate our view of seeing a fall to 6.2%.
The 5Yr GoI (5.7529%) looks relatively stronger than the 10Yr GoI. The chances are looking high for it to break the 5.66%-5.76% range on the upsisde and see a rise to 5.80%-5.82% and even higher in the coming days.
Eco Data 11/1/21
[php_everywhere instance="1"]
Forex and Cryptocurrencies Forecast
EUR/USD: After ECB Meeting, Ahead of Fed Meeting
Last time the EUR/USD review was titled "In a state of uncertainty", as confirmed by the previous week. Starting at 1.1643, the pair dipped to 1.1581, then rose to 1.1691, and ended the session with a new drop, this time to the 1.1560 level.
The main event last week was the European Central Bank meeting. As expected, the interest rate remained unchanged at 0%. Therefore, the commentary of the ECB management on monetary policy was of much greater interest. After the US Federal Reserve and the Bank of England outlined the timing of the start of curtailing their monetary stimulus (QE) programs, investors wanted to hear similar statements from the ECB. But… they didn't hear them: the regulator's press release practically repeated the previous one of September.
According to Bloomberg insider information, there is currently a split among ECB Governing Council members. First and foremost, this concerns estimating the extent of the upcoming inflation. ECB President Christine Lagarde's assurances that the recent rise in inflation to 3.4% is temporary does not suit all. Even more so, they look doubtful against Germany's 28-year inflation peak (4.6%) and Spain's 37-year peak (5.5%). The statement of the bank's management that the analysis does not confirm the need to raise the interest rate in 2022 also looks dubious.
All of the above has led investors to feel that the withdrawal of monetary stimulus in the Eurozone will not begin until late 2022 and early 2023. Against this backdrop, the European currency should have to weaken sharply. But if we look at the chart, we will see a sharp increase of the EUR/USD pair: the EUR/USD pair rose 110 points on October 28. Surprising but true!
The main reason lies in the macro statistics from the US, which came out at the same time as the ECB chief's press conference began. According to preliminary estimates, US GDP in Q3 will be 2.0%, well below not only the previous 6.7% but also the 2.7% forecast. The growth rate of the US economy fell from 12.2% to 4.9%. The figures tempered investor optimism and caused the dollar to weaken, with the USD index (DXY) falling from 93.86 to 93.33, and the Dow Jones and S&P500 stock indices almost returning to their historic highs. Falling gas and coal prices also played against the dollar, reducing the likelihood of an energy collapse in Europe.
At the end of the week, on Friday October 29, the dollar was able not only to win back losses, but also pushed the EUR/USD pair down to three-week lows. Investor positioning was key to this after the release of the US Fed's report on economic conditions, known as the Beige Book, ahead of the regulator's meeting next week. "With the Fed set to move to reduce asset purchases and flexibility, which is likely to be a key feature of future policy, the risk/return ratio becomes more positive for the dollar," TD Securities analysts explained.
The dollar was also supported by a monthly gain on risk assets, a rise in bond yields to 1.672% (the highest since May) and good macro statistics from the US: the rise in the underlying PCE (Personal Consumption Expenditure) remained at 3.6% in September, in line with August. However, the European statistics caused another anxiety attack at investors, showing an acceleration in inflation and a sharp slowdown in GDP growth.
Despite the fluctuations of EUR/USD over the past few weeks, 100% of the trend indicators on D1 are looking south. But among oscillators, these fluctuations caused a certain amount of confusion: only 40% of them point south, 30% look north and 30% east. There is no unity among experts either. 30% vote for the growth of the pair, 55% for its fall, and 15% for lateral movement. Support levels are 1.1520, 1.1485, 1.1425 and 1.1250. Resistance levels are 1.1580, 1.1625, 1.1670, 1.1715, 1.1800, 1.1910.
As for important events and the release of macroeconomic statistics, there will be a lot of both in the coming week. German retail sales volumes and the ISM business activity index in the US manufacturing sector will be released on Monday November 01. The value of ISM in the service sector, as well as the ADP report on the level of employment in the US, will become public on Wednesday November 03. We will have such a key event as the Fed meeting on the same day, including the interest rate decision, as well as comments from its management on the US Central bank monetary policy. Christine Lagarde, head of the European Central Bank, is scheduled to speak on Wednesday and Thursday.
As usual, the first Friday of the month, November 05, will see data from the US labour market, including such an important indicator as the NFP, the number of jobs created outside the US agriculture sector. Eurozone retail sales statistics will be released the same day.
GBP/USD: Ahead of Fed and Bank of England Meetings
The Consumer Price Index (CPI), which reflects the retail price performance of goods and services that make up the consumer basket of United Kingdom residents, and is a key inflation indicator, was +0.3% in September (vs. +0.4% and +0.7% in August). On a year-on-year basis, the UK CPI grew by +3.1% (vs. +3.2% forecast and +3.2% in August). Although indicators showed inflation slowing in September, analysts expect it to accelerate sharply in October due to high energy prices, utility tariffs and a partial increase in VAT.
The coming week is not only the week of the Fed meeting, but also of the Bank of England, which will take place on Thursday November 04. According to a number of experts, the slowdown in inflation in September is unlikely to force the UK regulator to stop raising its key interest rate in the coming months (now at 0.1%).
The threat of stagflation, combining weak GDP growth and high inflation, is highly dangerous for the British economy, which is still being pressured by the effects of Brexit. According to the Bank of England experts, the annual inflation rate will accelerate to around 5% by April 2022 and fall to the 2% target as late as by the end of 2022. This is a very fast pace, and the head of the central bank, Andrew Bailey, has recently said that at such rates, it may be necessary to act and raise interest rates faster than originally planned.
Many investors now believe that the interest rate on the pound could reach 0.45% by the end of 2021 and 0.95% by June 2022, which is supposed to lead to a stronger pound. However, in the current substandard situation, things are not so simple, and the curtailment of monetary stimulus could lead to a deterioration in the British economy, deepening crisis and a drop in living standards of the UK residents. Retail sales volumes (excluding fuel), as determined by the Office for National Statistics, have shown a year-on-year decline of -0.9% to -2.5% for three consecutive months, suggesting that people have started saving.
The last week and a half shows that the bullish momentum on the GBP/USD pair that started on September 30 has dried up and, thanks to the same factors listed for EUR/USD, the pound ended the trading session at 1.3685 a month later.
Intrigue as to how the market will react to plans by the US Fed and Bank of England to wind down QE remains for now. But it's safe to say that coming Wednesday and Thursday, when these regulators meet, promise to be very interesting, high volatility is guaranteed. At the same time, 40% of experts are betting on the bears winning, 30% along with the graphical analysis on D1 support the bulls, and the remaining 30% have taken a neutral position.
As many as 50% of the oscillators are neutral grey. The readings of the rest oscillators are divided equally: 25% for the red and 25% for the green. As for trend indicators on D1, reds win with a clear advantage, they are 80%. Support levels are 1.3765, 1.3675, 1.3600, 1.3575, 1.3525 and 1.3400. The resistance levels and targets of the bulls are 1.3725, 3770, 1.3810, 1.3835, 1.3900 and 1.4000.
USD/JPY: The Yen Has Its Own Path

Charts from the past two and a half weeks show that the upward momentum has dried up for USD/JPY as well.Only if, in the case of GBP/USD, the dollar has been weakening against the pound since the end of September, on the contrary, it has been strengthening against the yen.
The Japanese currency is a safe haven currency for investors. And its recent weakening fits logically into a stable inverse relationship between the yen rate and the growing risk appetite of the market. It should also be added that another trigger for the yen's weakening was the shift in Japan's trade balance towards imports, due to a spike in energy and metal prices. And, of course, one cannot ignore such an important factor influencing the USD/JPY quotes as the yield of US Treasury bonds. However, it is also directly related to the market's risk-aversion.
USD/JPY upgraded its four-year high on October 20 to reach 114.70 high, the very point where it was in November 2017. After that, the enthusiasm of the bulls subsided, and the pair went down, ending last week at 113.95.
At this stage, 70% of analysts expect the pair to first return to the 113.00 horizon, and then drop to the 111.00-112.00 zone by the end of November. The remaining 30% of experts adhere to the opposite point of view, expecting the next update of multi-year highs and the rise of the pair to the range 115.00-116.00.
The resistance levels are 114.35, 114.70 and 115.50, the long-term target of the bulls is the December 2016 high of 118.65. The nearest support levels are 113.85, 113.40 and 113.25, then 112.00 and 111.65.
As for the events of the coming week, the release of the report of the Bank of Japan's Monetary Policy Committee meeting on Tuesday November 02 could be noted. However, it is likely the market will react to it fairly calmly. Especially since this event will take place just one day before the US Fed meeting, which will be the focus of all investors and speculators.
CRYPTOCURRENCIES: Ethereum Renews Its High
The historical record of $66,925 set by bitcoin on October 20 has not yet been broken. The imminent correction that followed taking that height brought forward a fierce bull and bear fight. The forces proved to be about equal. As a result, after swaying in the $57,590—63,645 range, the pair returned on Friday October 29 to roughly where it had been seven days earlier, to the $62,000 zone. The total crypto market capitalization is also unchanged at $2.6 trillion, but bitcoin's share has decreased somewhat: its dominance index has dropped from 45.94% to 44.15%. This was due to capital flows into altcoins, primarily ethereum, which rose from 18.72% to 19.61% over the week. The Crypto Fear & Greed Index is still in the Greed zone at 70 points (75 weeks ago).
Most analysts believe that the upward trend of the BTC/USD pair will continue. This is supported by statistics. Coin outflows from the exchanges have resumed, according to Glassnode. Bitcoin network hash rate has almost recovered after China's mining ban, which caused it to drop by 50%. At the same time, bitcoin supply is quite low: miners and investors are holding their reserves in the expectation of further price growth.
The macroeconomic background is also favourable. The New York Stock Exchange continues to list bitcoin-related ETFs. True, there is information that the Securities and Exchange Commission (SEC) is likely to reject Valkyrie's application to launch a leveraged ETF. Other of the 40 filings currently under consideration by the SEC, apart from applications to launch ETFs on bitcoin futures, will not receive the green light either. But those that will be approved are quite enough to ensure a solid inflow of funds into this sector from investors saving their capital from inflation.
The good news for BTC is that payments giant Mastercard will soon announce cryptocurrency support on its network. This includes bitcoin wallets, credit and debit cards, and loyalty programs where points can be converted into digital assets.
The American company Walmart Inc., which operates the world's largest wholesale and retail chain, has also turned to the main cryptocurrency and launched a pilot program to sell bitcoins in its stores.
Crypto trader and analyst known as Altcoin Sherpa is confident that bitcoin will not fall below the $54,000 zone where the strong support is located and, pushed back from it, will update its historic high in November, exceeding $80,000.
Another prominent analyst, PlanB, also expects a parabolic increase in the price of bitcoin. As a reminder, PlanB is the creator of the Stock-to-Flow (S2F) model, which predicts the price of the flagship cryptocurrency, and which allowed it to accurately predict BTC prices in August and September. And if bitcoin continues to follow this model, it will reach $98,000 in November and $135,000 in December. "So, it's going to be a really good Christmas this year," declared PlanB. At the same time, the expert believes that the flagship cryptocurrency is unlikely to be able to avoid another major correction that historically follows each major bull cycle.
Another popular cryptanalyst and trader Lark Davis expects that "the next six months are likely to be mega-crazy for bitcoin and cryptocurrencies! Many of you will get the chance to completely change your financial destiny," he tweeted.
Davis does not advise investors to get carried away with speculative altcoins and NFTs in the current situation, but to bet on time-tested coins. "Let the winners win, double and even triple your positions and cut the losers. Do it mercilessly, there is no point in keeping dubious assets," writes Lark Davis.
In his view, BTC could increase investor savings by 20 times over the next 10 years, but individual altcoins could generate comparable returns much sooner. "Altcoins are for making money, BTC is for storage," the expert explains.
The leading altcoin seemed to have heard Lark Davis's words. While bitcoin was hovering around $60,000-61,000, ethereum renewed its all-time high, peaking at $4,447 on October 29. The previous record of $4,360 was set back in May.
The ETH/USD pair is bursting up for the fifth week in a row, having added more than 65% since September 21. The reason for this growth is the coin-burning process that takes ETH tokens out of circulation. Another factor that pushed this altcoin up was the news of the successful start of the Ethereum 2.0 Altair update for the Beacon Chain, which brought the moment of the full launch of ETH 2.0 even closer.
And another piece of news that will be of interest for those who think not only about their future, but also the future of their children and loved ones. Russian insurance company Renaissance Life and InDeFi SmartBank have started jointly developing smart contracts to help inherit digital assets. With the growth of the cryptocurrency market, the problem of inheriting such property has become quite acute. Since cryptocurrencies are decentralized, in the event of the death of the owner, the heirs simply cannot dispose of the property of the deceased without access to the cryptocurrency wallet. Smart contracts under development should solve this problem by enabling the client to transfer the disposal of digital assets to their designated heir in the event of their death.
CFTC Commitments of Traders – GBP Futures Turned to Net Long as BOE Might Hike Rate Next Week
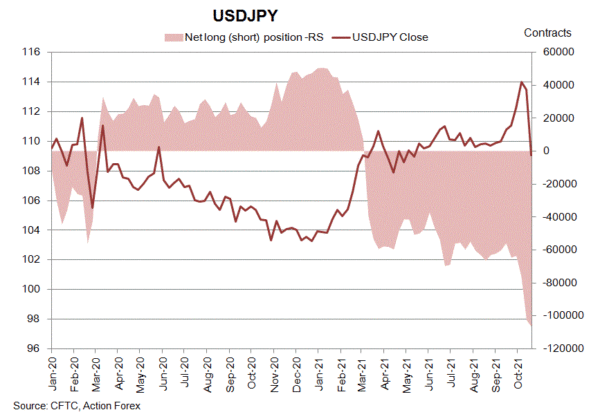
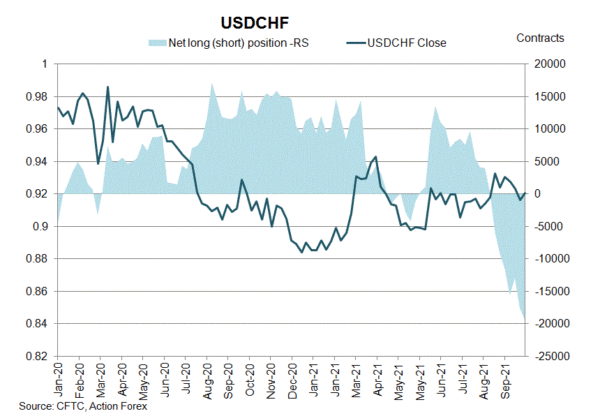
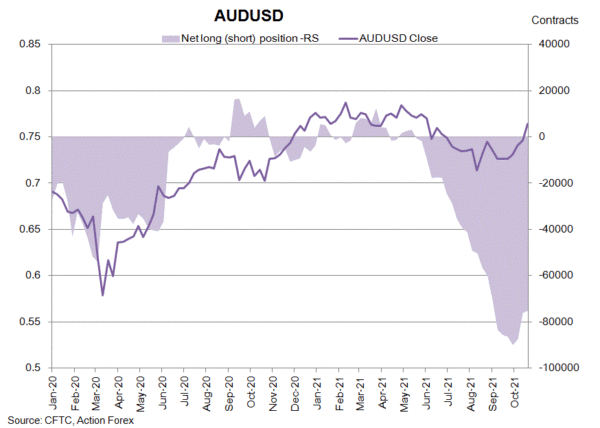
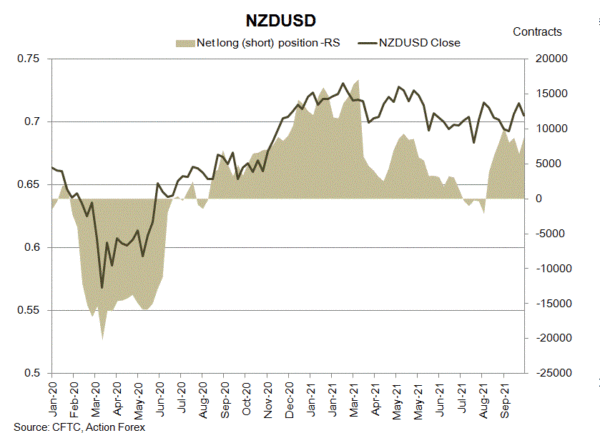
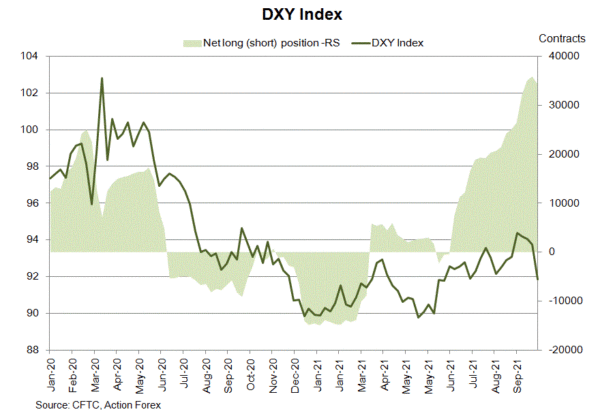
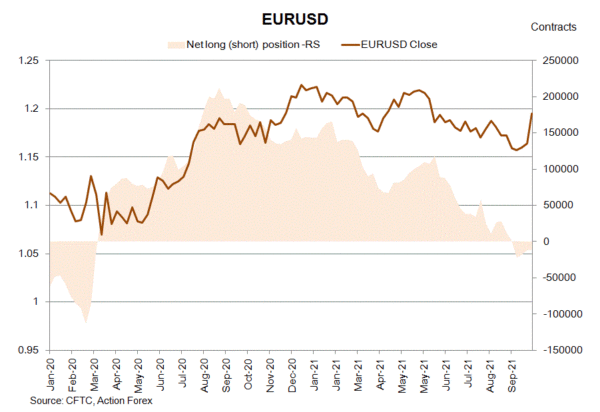
As suggested in the CFTC Commitments of Traders report in the week ended October 26, NET LENGTH of USD index futures dropped -1 477 contracts to 34 457. Bets decreased on both sides. Concerning European currencies, NET SHORT of EUR futures slipped -851 contracts to 11 256. ECB President reiterated to keep interest rates at historically low levels despite rising inflation. Yet, the market did not appear to be convinced. NET LENGTH of GBP futures jumped +13 338 contracts to 14 953. The BOE is facing increasing pressure to raise the policy rate on mounting inflation concerns.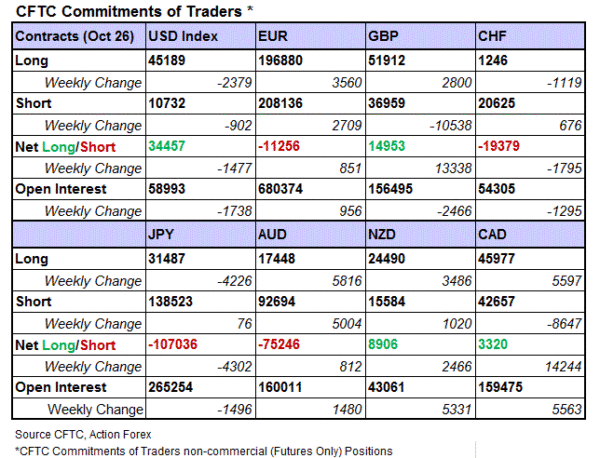
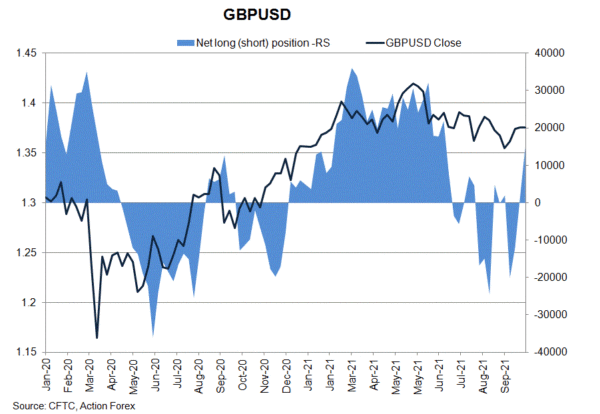 On safe-haven currencies, NET SHORT of CHF future gained +1 795 contracts to 19 379 while that of JPY futures rose +4 302 contracts to 107 036. Concerning commodity currencies, NET SHORT of AUD futures dropped -812 contracts to 75 246. NET LENGTH for NZD futures increased +2 466 contracts to 8 906 during the week. CAD futures drifted o NET LENGTH of 3 320 contracts. The loonie should remain supported after BOC's hawkish surprise.