Sample Category Title
Stocks Continue To Ignore Warning Signs
Central banks across the globe are taking steps toward normalising monetary policies. Economic growth already seems to have peaked; inflation is trending higher, short term interest rates are surging across developed economies, and some of the largest tech companies delivered negative earnings surprises last week. These are all good ingredients for a long overdue stock market correction, but investors do not seem to be giving up on risk assets just yet.
A year ago, markets doubted that developed central banks would ever reach their inflation targets. Today, they doubt their dovish rhetoric and see interest rates much higher than the banks’ own forecasts as inflation looks out of control.
Emerging markets policymakers have already taken serious steps to combat rising prices. Brazil, for example, has raised interest rates from 2% to 7.75% in eight months. Russia has followed a similar path, raising rates six times since April last year and sending its benchmark policy rate to 7.5% from 4% earlier in 2020. Other emerging markets are also likely to take aggressive steps in tightening policy, which shows the magnitude of the threat created by inflation.
It isn’t much different in developed market economies. The Bank of England (BoE) is very likely to raise interest rates when the Monetary Policy Committee meets on Thursday. The Reserve Bank of Australia (RBA) appears to have abandoned its yield curve control policy, the Bank of Canada surprisingly suspended its QE last week, and the European Central Bank isn’t able to convince markets about their forward guidance.
What started as transitory inflation due to the pandemic is now broadening according to the latest data, and if central banks remain accommodative for another year, they risk losing their grip on rising prices. That would require extremely aggressive action from monetary policymakers and hence drag the global economy into a recession.
This week we’ll likely see the BoE raise rates and the RBA adjust policy, but the Fed will as always, be the main risk event and under every trader’s and investor’s spotlight. The FOMC is expected to begin the process of tapering bonds purchases, which is fully priced into markets. The big question is their take on inflation and how strong the argument towards transitory factors remains. Chair Powell’s press conference on Wednesday will help shape interest rate expectations even if the statement doesn’t reveal much. Fed fund futures are already anticipating at least two rate hikes by the end of 2022, so it will be interesting to see how or if Powell comments on this.
Despite tightening monetary policies being considered a negative factor for equities, global markets and especially those in the US have continued to make new highs. If you ask any investor why you are buying stocks, the simple answer is “there is no alternative”. Of course, there are few alternatives when investing in government bonds generates negative real returns and corporate bonds look unattractive.
Another factor supporting equity prices is the current strong earnings season, with 82% of S&P 500 companies reporting a positive EPS surprise. However, this trend in profit growth is likely to slow significantly in the final quarter of the year and heading into 2022. Given the changing dynamics, investors may need to consider taking some risk off the table or consider hedging their portfolios so they won’t get caught off-guard.
EUR/USD Down Below The Order Block: The Drop Should Continue Further
EUR/USD technical analysis
- Bearish rejection as analysed.
- EUR/USD is very bearish.
- Possible retest of order block.
- W L5 has been reached.
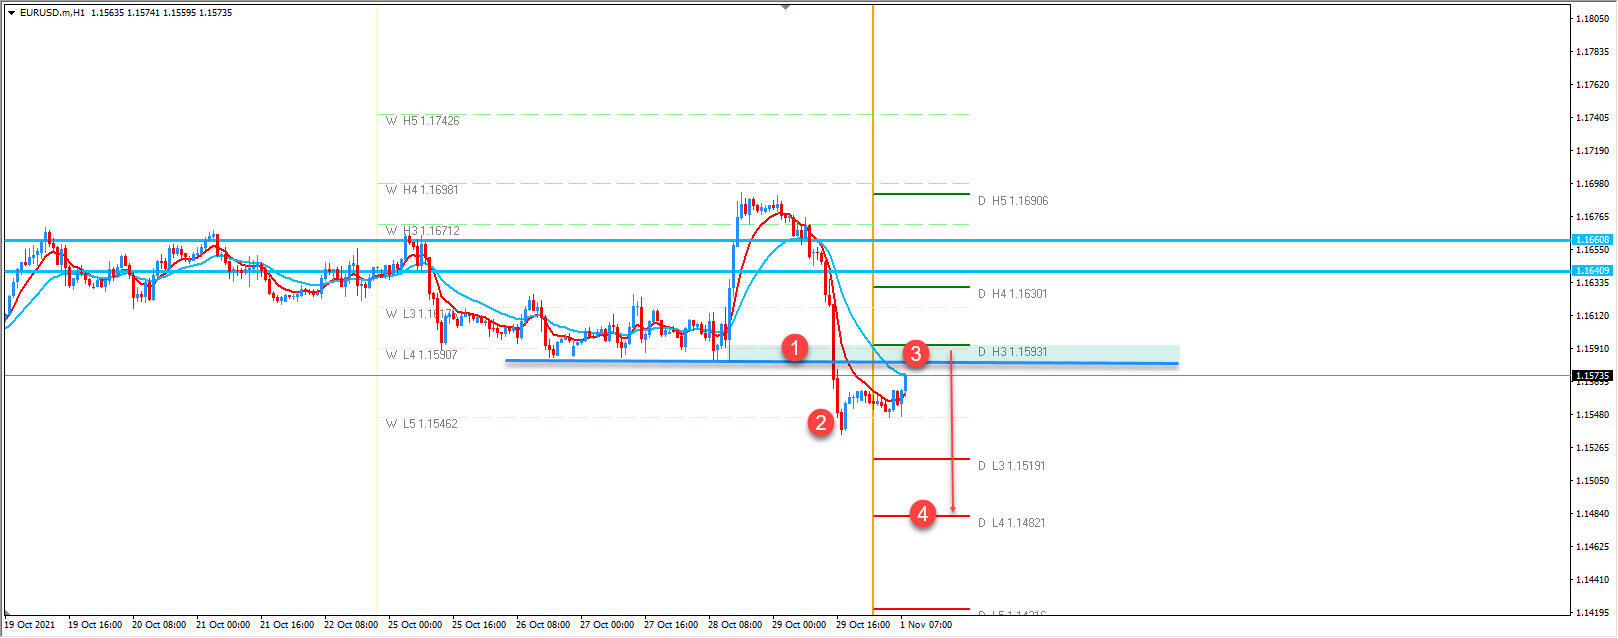
- Bearish order block
- Breakout
- Retest
- Target
The price is in a downtrend. There is nothing bullish here. As shown in the previous analysis, the EUR/USD went exactly as expected. The Weekly target has been reached. As you can see in the picture the W L5 has already reached 1.1546 and the price now is trying to go for a retest of a bearish order block. If the market doesn't break higher above the D H3, we should see another move down below the point 2, towards point 4. D L4 - 1482. Sell the rallies and keep the shorts running is the strategy to go with.
USD/JPY Outlook: Bulls Tighten Grip And Look For Retest Of 2021 High
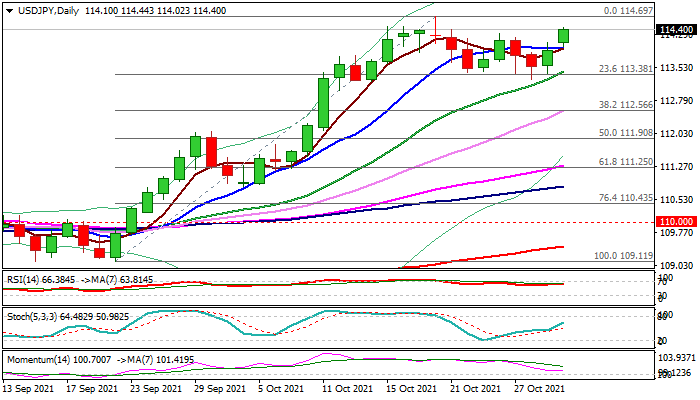
The USDJPY maintains firm tone and extends last Friday’s jump, looking for retest of 2021 high at 114.69, posted on Oct 20.
Repeated downside rejections at 113.40 zone (Fibo 23.6% of 109.11/114.69 rally) left a higher base after subsequent rebound signaled an end of shallow pullback.
Daily studies remain in full bullish setup and gain fresh positive momentum, while Friday’s bullish engulfing adds to positive signals.
The pair ended October with nearly 2.5% advance (the biggest monthly gain since March) marking the third straight month in green.
Bulls look for a firm break of cracked strong 114.60 resistance zone (Fibo 76.4% of 118.66/101.18 / 2017 peaks) to open way for extension through psychological 115 barrier and signal continuation of an uptrend from 102.59 (2021 low).
Converged 5/10DMA’s offer immediate support at 113.97, guarding more significant 113.40 higher base (reinforced by rising 20DMA), which needs to hold to keep bulls in play.
Res: 114.69, 115.00, 115.50, 116.00.
Sup: 113.97, 113.40, 113.00, 112.56.
USD Remains Strong After Hawkish Expectations
The USD gained on Friday against a number of its counterparts as the high inflation on a year-on-year level for September, intensified expectations for a more hawkish approach by the Fed at its next meeting on Wednesday. We also note the release of the US employment report for October with its NFP figure on Friday, while attention is now turned to the release of the US ISM manufacturing PMI figure for October later today.
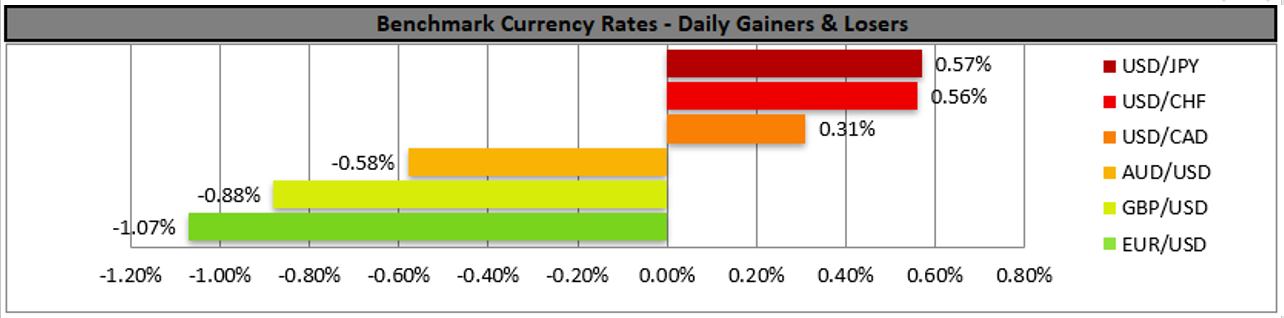
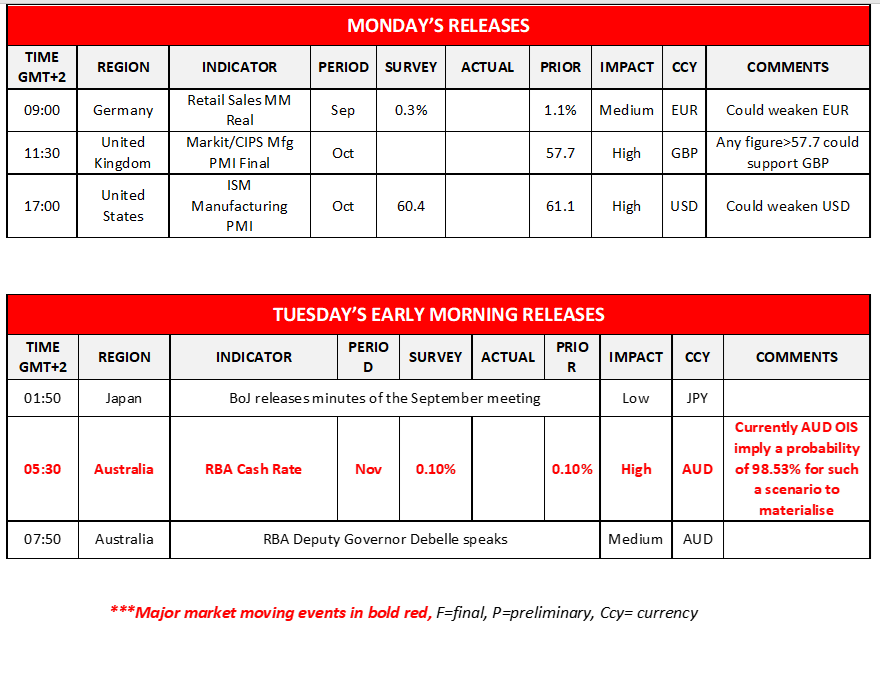
Aussie traders on the other hand are to keep a close eye on RBA’s interest rate decision early tomorrow and while the bank is expected to remain on hold at 0.10%, investors are interested to see whether the bank will signal earlier interest rate hikes. On second note Japan’s ruling party LDP scored an unexpected comfortable election victory, which dismissed worries for the possibility of political instability and tended to weaken the JPY against the USD. The common currency tended weaken against the greenback as the area’s preliminary GDP rate for Q3 slowed down more than expected and in conjunction with the high US inflation, tended to create diverting tendencies for the two currencies. As for precious metals gold tended to weaken as the USD gained and we expect their negative correlation to remain on display for the coming days. US stockmarkets tended to remain in the greens with Dow Jones and S&P 500 reaching new record highs while Nasdaq stabilised on Friday. WTI prices dropped somewhat as China released some of its gasoline and diesel reserves in an effort to ease the tight supply of the commodity, yet we note that expectations for rising demand and lower supply levels could push the commodity’s price higher once again.
USD/JPY rose breaking the 113.70 (S1) resistance line, now turned to support. Yet the pair’s upward movement tended to reaffirm our current bias for a sideways motion. Should the bulls regain control we may see the pair breaking the 114.55 (R1) resistance line and aim for the 115.20 (R2) resistance level. Should the bears be in charge, we may see the pair breaking the 113.70 (S1) line and aim for the 112.90 (S2) level.
AUD/USD retreated from the highs of the 0.7540 (R1) resistance line. We tend to maintain a bias for a sideways motion for the pair as long as it remains between the 0.7540 (R1) and the 0.7475 (S1) level. Should buyers take the initiative, we may see the pair breaking the 0.7540 (R1) resistance line and aim for the 0.7600 (R2) level. Should the pair come under the selling interest of the market, we may see the pair breaking the 0.7475 (S1) support line and aim for the 0.7420 (S2) level.
Today’s events and expectations
Besides the releases mentioned today we also note Germany’s retail sales growth rate for September as well as the final UK Markit/CIPS manufacturing PMI figure for October.
As for the rest of the week
On Tuesday, we note the release of the RBA’s interest rate decision, Switzerland’s inflation rates for October, Germany’s final manufacturing PMI reading for October and New Zealand’s employment data for Q3. On Wednesday we get Australia’s building approvals for September, China’s Caixin Services PMI for October, UKs’ Nationwide house prices for October, UK’s final Services PMI figure for October, the US ADP National Employment figure for October, the US Factory orders for September, the ISM non-manufacturing PMI figure for October and we highlight the release of FOMC interest rate decision. On Thursday, we note Australia’s trade data for September, Germany’s industrial orders for September, from Norway Norgesbank’s interest rate decision, from the UK BoE’s interest rate decision, the US initial jobless claims figure, Canada’s trade data for September and from the Czech Republic CNB’s interest rate decision. On Friday we note the release of Germany’s industrial output for September, UK’s Halifax House prices for October, Canada’s employment data for October and most importantly the US employment report for October.
USD/JPY H4 Chart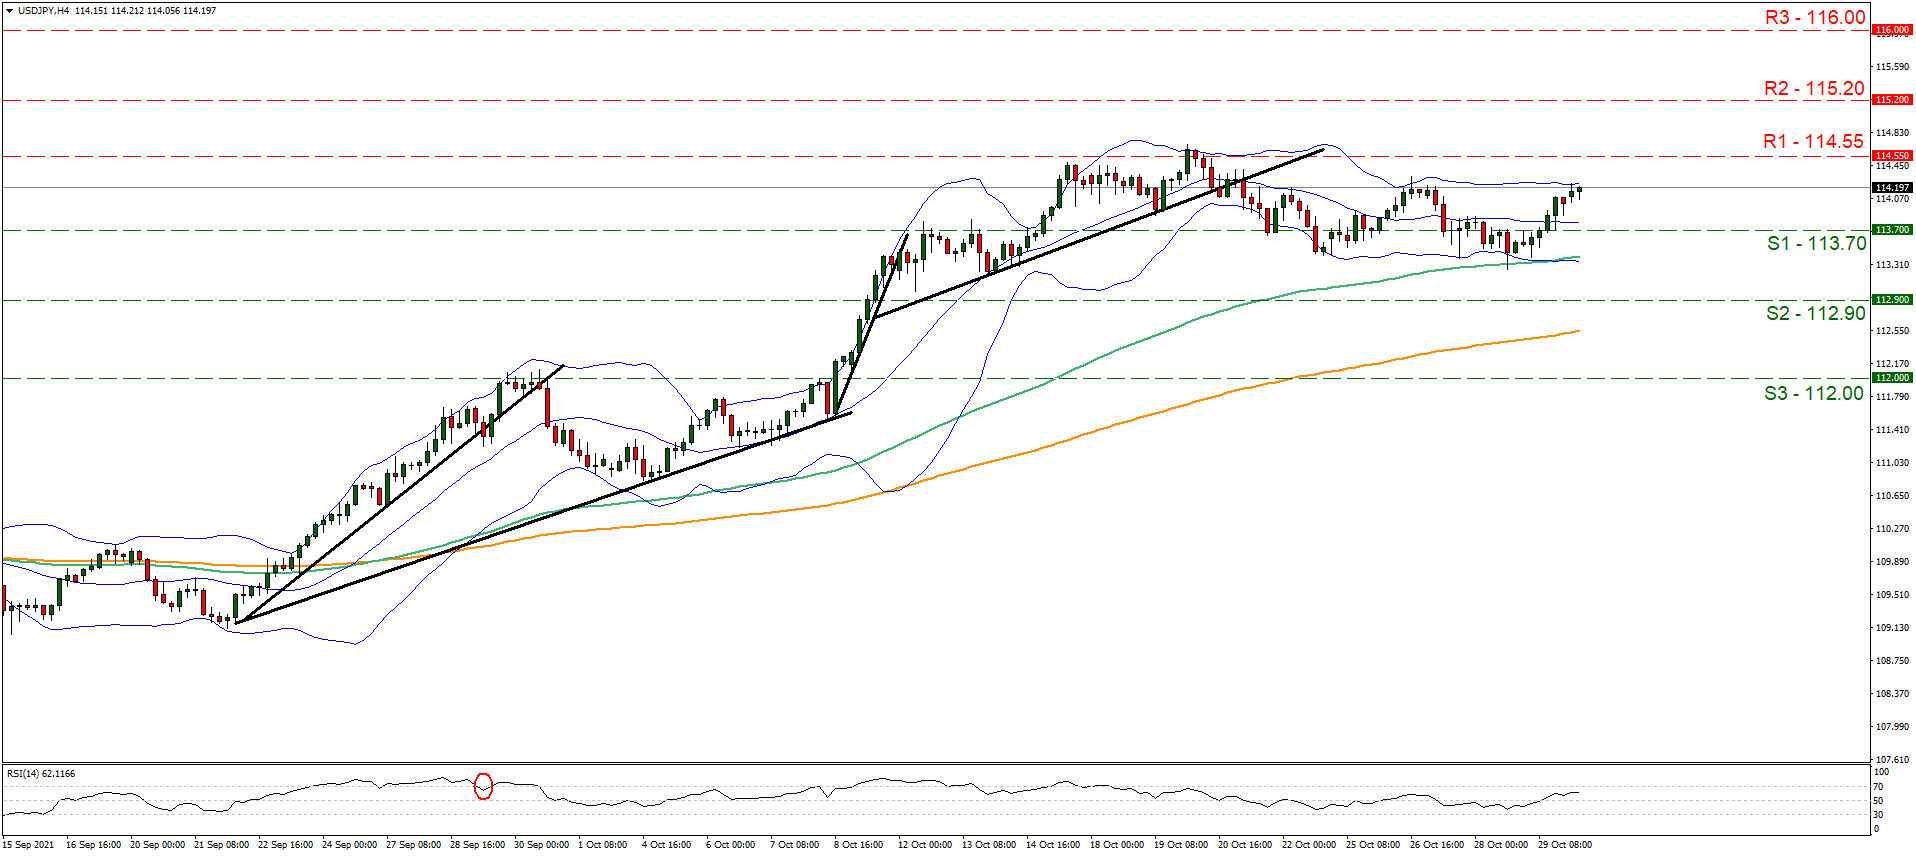
Support: 113.70 (S1), 112.90 (S2), 112.00 (S3)
Resistance: 114.55 (R1), 115.20 (R2), 116.00 (R3)
AUD/USD H4 Chart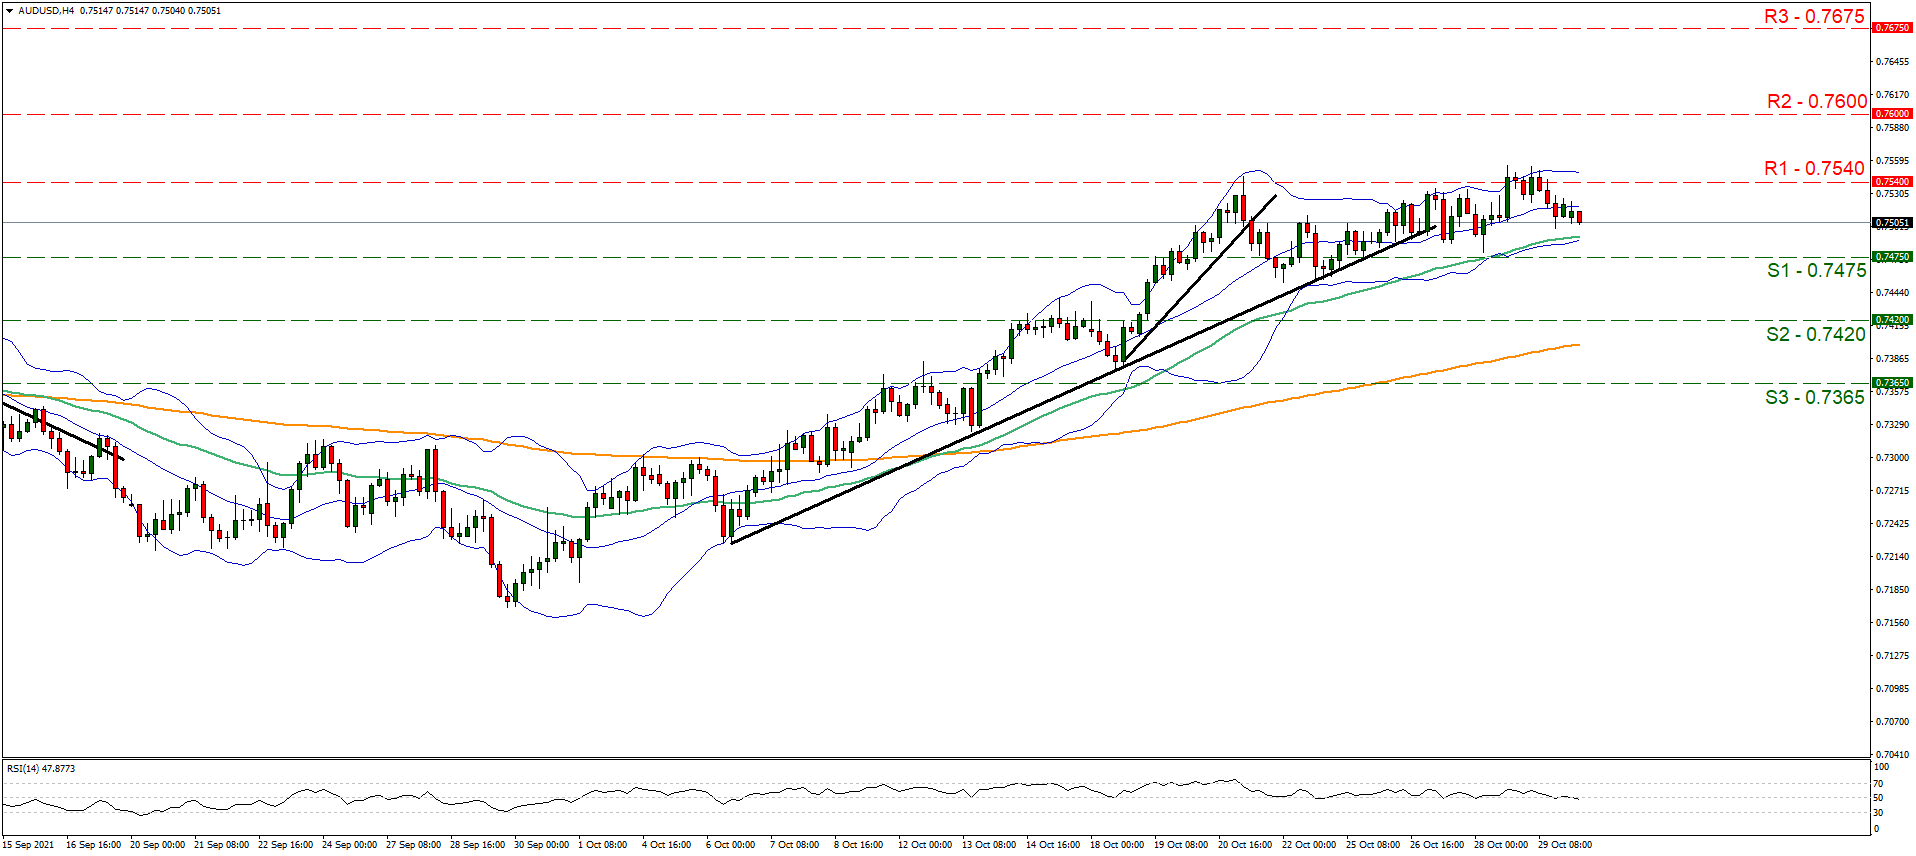
Support: 0.7475 (S1), 0.7420 (S2), 0.7365 (S3)
Resistance: 0.7540 (R1), 0.7600 (R2), 0.7675 (R3)
GER 40 Finds Support
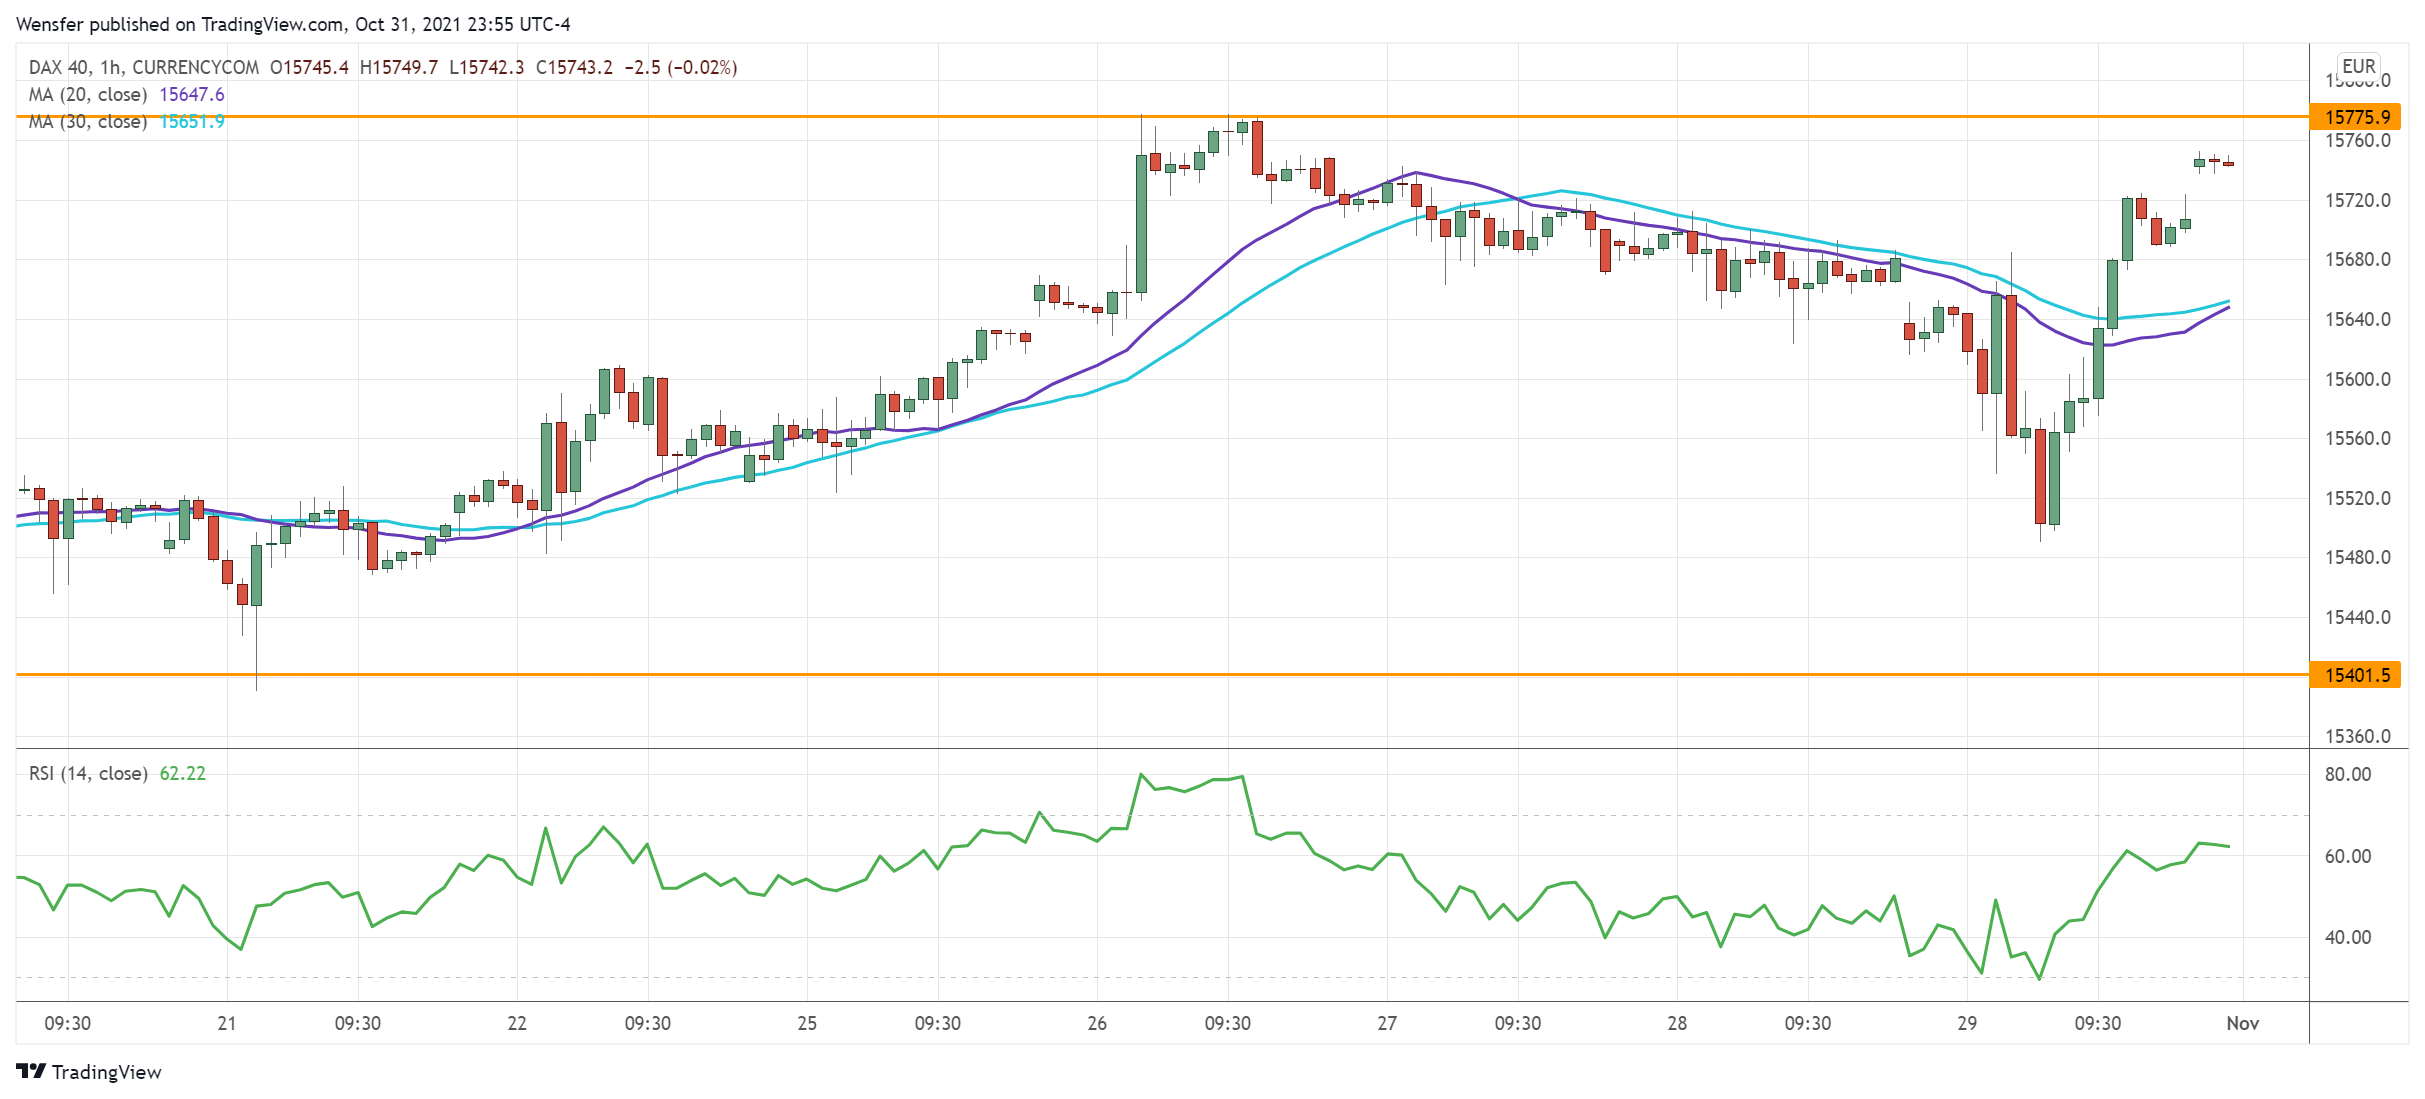
The Dax 40 bounces back thanks to upbeat European stock earnings.
A bullish MA cross on the daily chart is a sign of recovery. Though the index has hit a speed bump at 15775 which is a major resistance from last September’s sell-off.
The drop below 15630 has led intraday buyers to bail out, driving short-term price action downward. As the RSI ventured into the oversold zone, the pullback attracted dip-buying interest at the lower range of the previous consolidation (15400). This is a congestion area along the MA cross.
EUR/GBP Attempts To Rebound
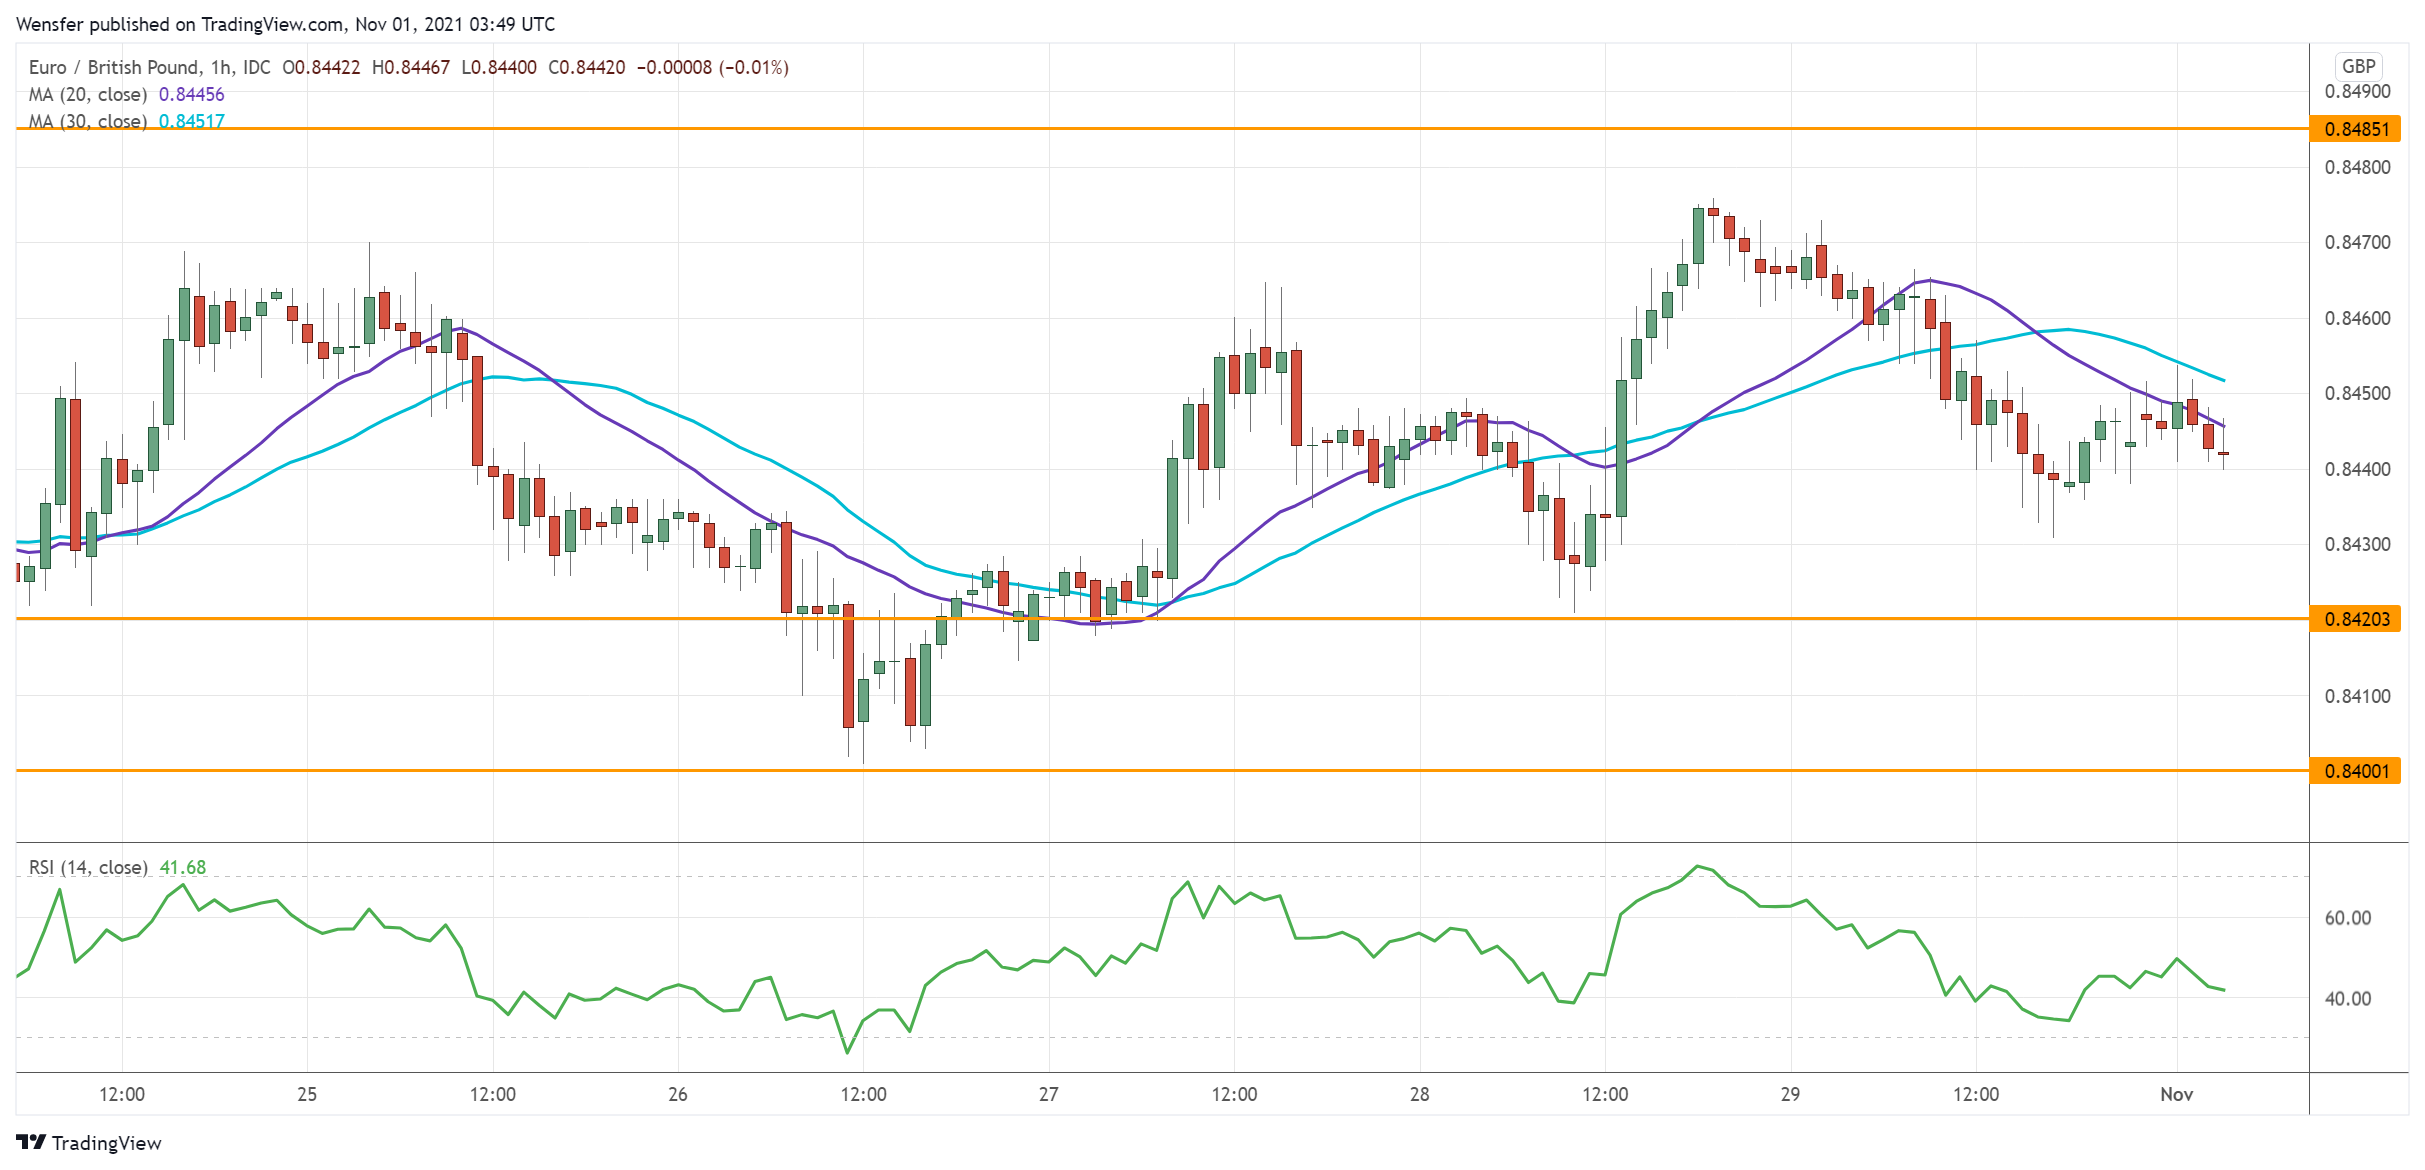
The euro found support from better-than-expected growth and inflation data. A bullish RSI divergence suggests that the downtrend may have lost its momentum.
A break above 0.8470 has prompted sellers to cover some of their bets. But the RSI’s overbought situation has so far tempered the optimism.
The bulls will need to lift offers around 0.8485 which sits on the 30-day moving average before they could turn the tables. Failing that, a drop below the demand zone between 0.8400 and 0.8420 would deepen the correction.
USD/CHF Bounces Off Demand Zone
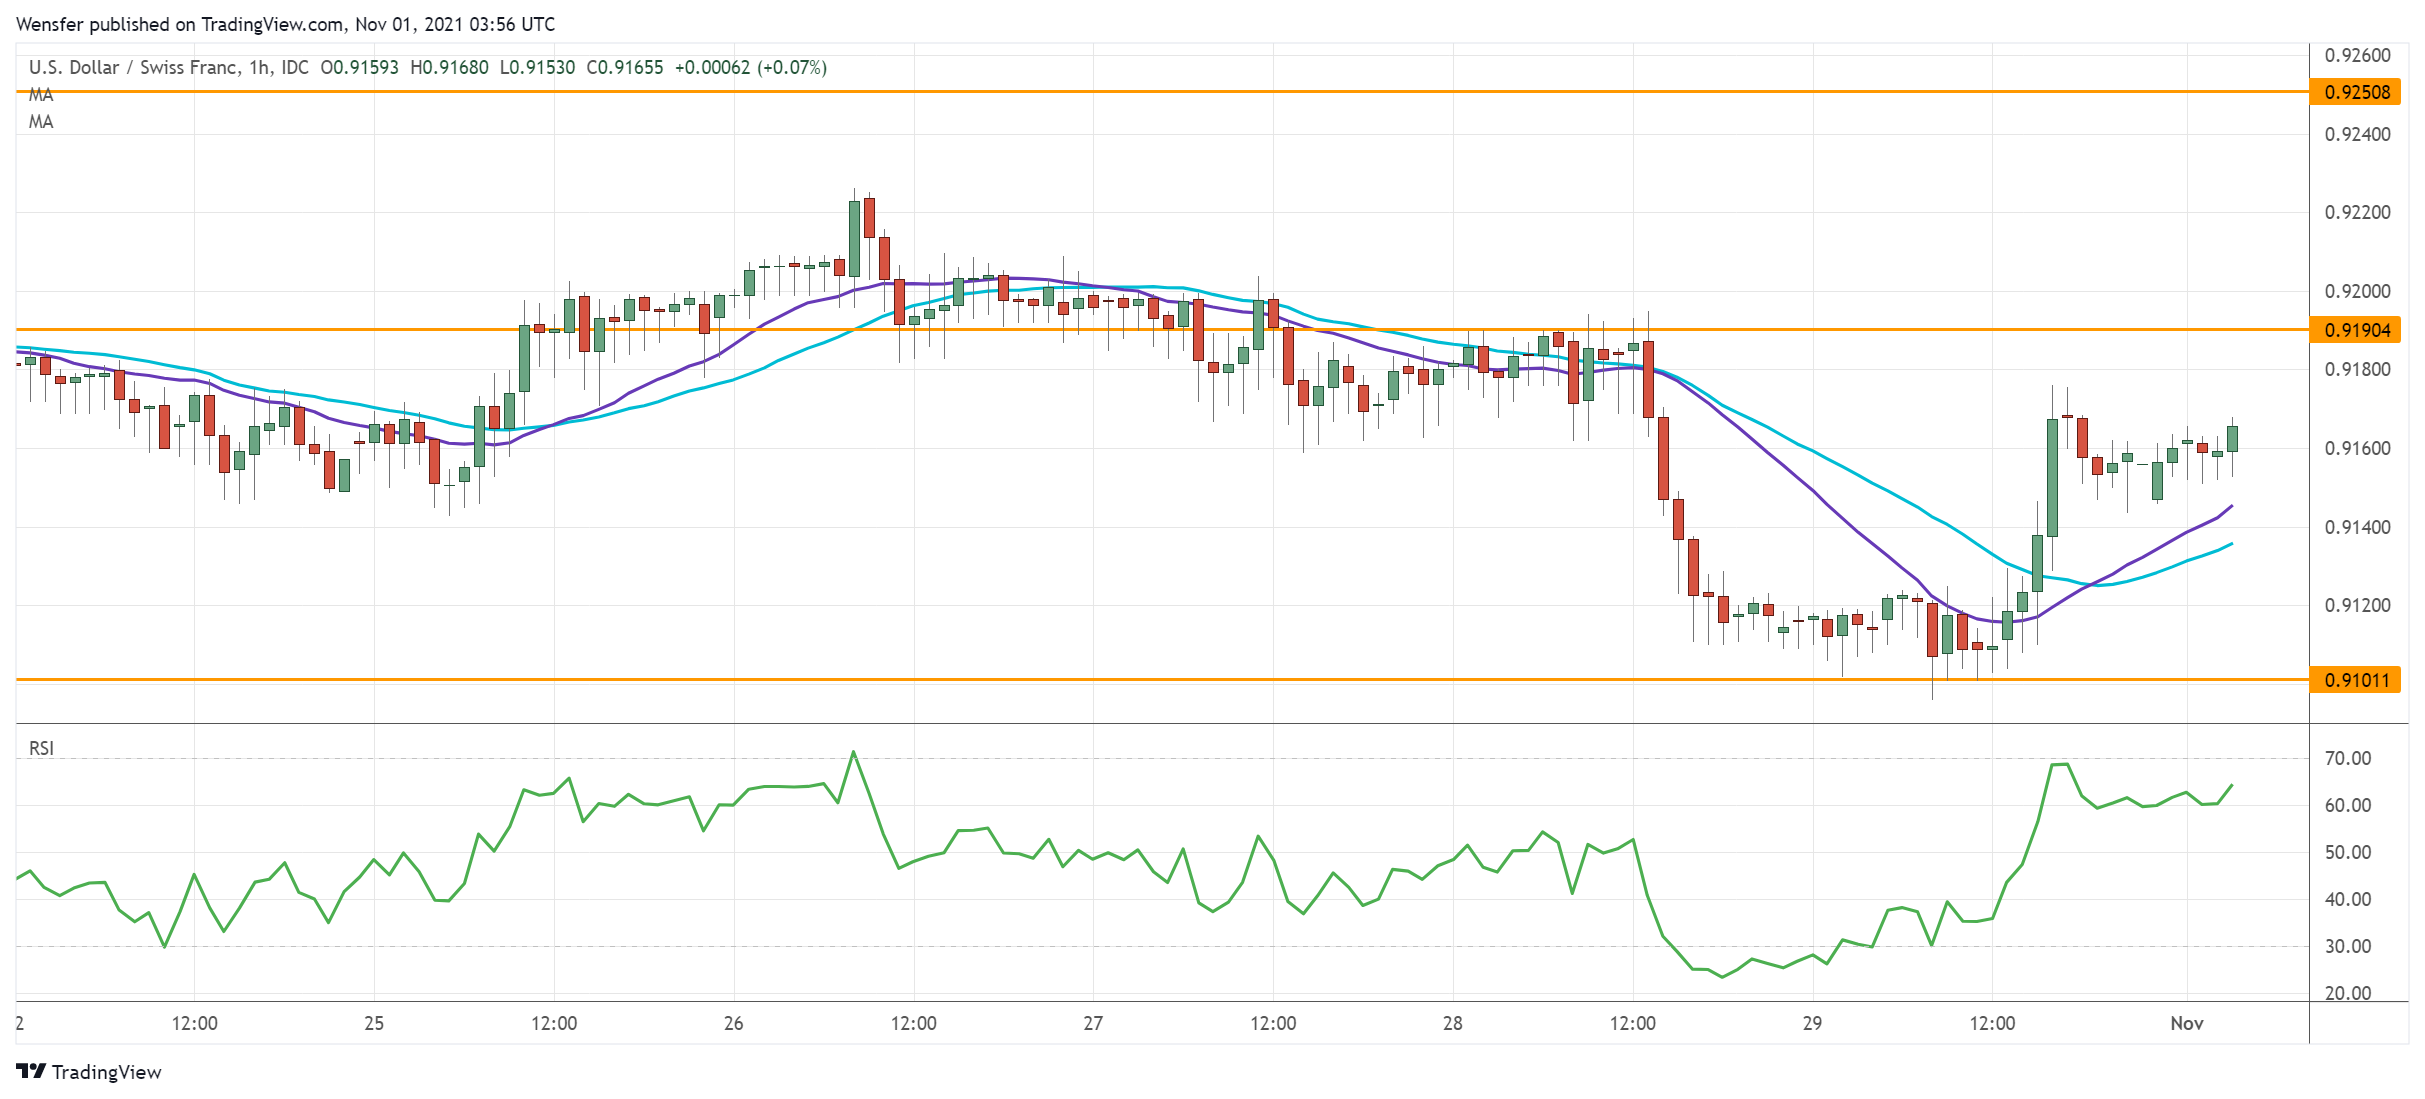
The US dollar inched higher after a solid core PCE reading in September. The pair is testing the major demand area from last August’s lows (0.9100).
A bearish MA cross on the daily chart has dented buyers’ optimism. An oversold RSI may attract a ‘buying-the-dips’ crowd while short-term sellers take some chips off the table.
However, 0.9190 could be a challenging hurdle to lift as the bears would be eager to fade the rebound. A new round of sell-off would send the greenback to the daily support at 0.9020.
USD/CAD Passes SMAS
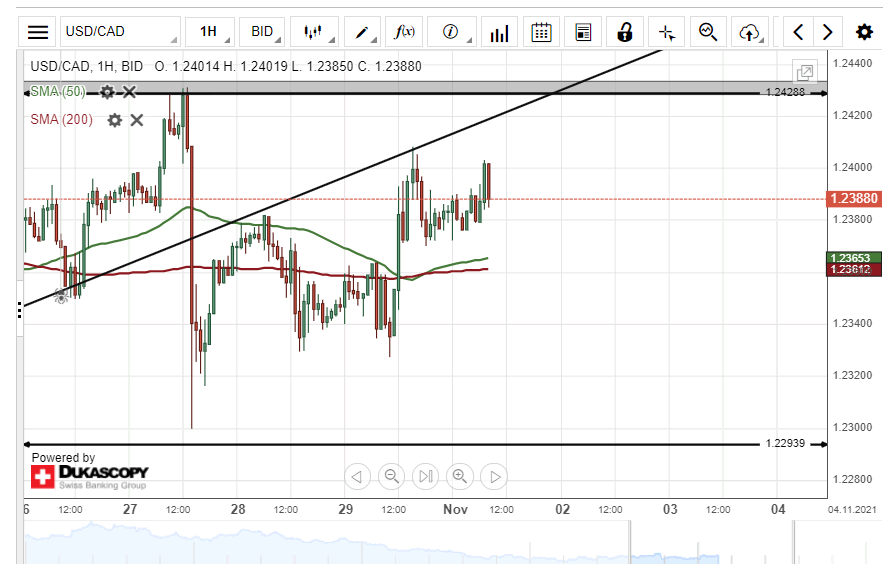
At mid-day on Friday, the USD/CAD currency exchange rate passed the resistance of the 55 and 200-hour simple moving averages near 1.2360. It resulted in a surge, which found resistance in the previously passed trend line at 1.2408. Since the encountering of the resistance, the rate has been trading below the 1.2400 mark.
A surge of the USD/CAD rate might find resistance in the 1.2400 mark. Afterwards, the resistance zone near the 1.2430 might keep the pair down.
On the other hand, a decline of the pair could look for support in the 55 and 200-hour simple moving averages near 1.2360. Below the SMAs, the 1.2330 level might act as a support level.
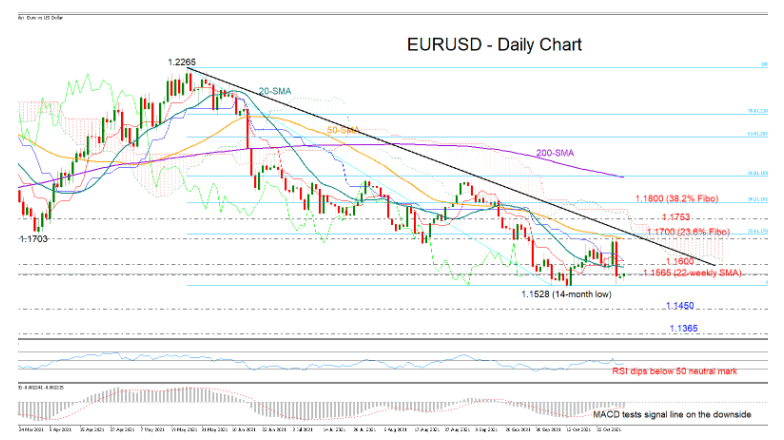
EURUSD Pauses Near 200-Weekly SMA After Harsh Decline
EURUSD's rally was harshly rejected just below the 1.1700 level and near the 50-day simple moving average (SMA) on Friday, with the price crossing all the way down to test the 14-month low of 1.1528.
The short-term risk is looking neutral to bearish as the RSI is trying to regain strength after dipping below its 50 neutral mark and the MACD is set to cross back below its red signal line in the negative territory. A clear bearish cross between the red Tenkan-sen and Kijun-sen lines could further darken the short-term outlook in the coming sessions.
Technically, however, the bears may not take full control unless the floor between 1.1565 and 1.1528 cracks. This is where the 200-weekly SMA is currently flattening, therefore any decisive close lower could motivate fresh selling, with the price likely tumbling towards the key 2020 resistance zone of 1.1450. Breaching that base too, the next stop could be near 1.1365.
On the upside, the bulls could get congested around the 1.1600 level and the 20-day SMA. If not, all the attention will then shift back to the 50-day SMA and the crucial descending trendline seen around the 1.1700 number. The 23.6% Fibonacci retracement is also positioned in the same location. Hence, a violation at this point will be closely watched for an acceleration, likely towards the 1.1753 hurdle.
Summarizing, EURUSD has resumed a bearish bias in the short-term picture, but only a clear fracture of the 1.1565-1.1528 zone could activate new selling orders.
GBP/JPY Confirms Previous Support
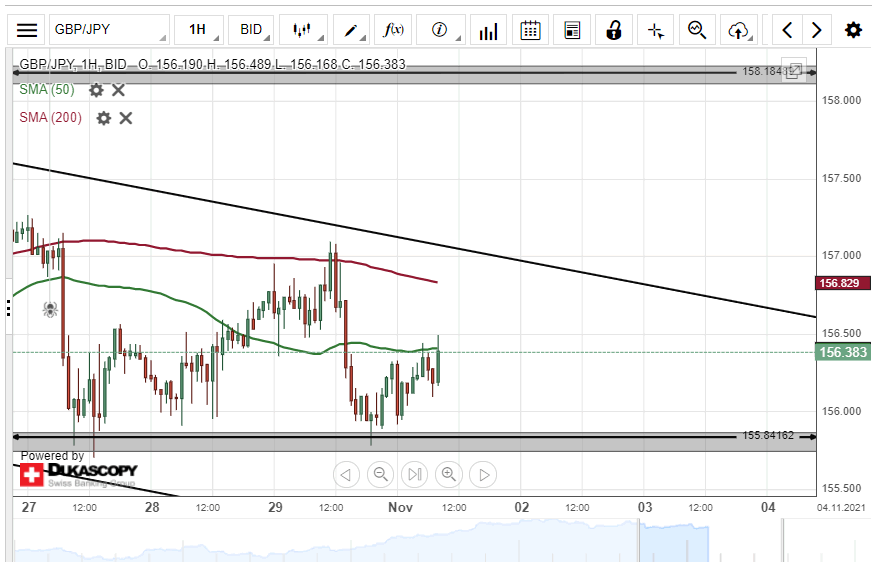
At mid-day on Friday, the surge of the GBP/JPY pair ended at the 157.00 mark. Afterwards, a decline occurred, which found support in the 155.75/155.85 zone. On Monday morning, the pair was testing the resistance of the 55-hour simple moving average at 156.40.
If the pair manages to pass the resistance of the 55-hour SMA, next target for the surge would be the 200-hour SMA near 156.80. Above the SMA, a resistance line of a channel down pattern might be encountered near 157.00.
However, a decline of the GBP/JPY rate might look for support in the 155.75/155.85 zone. Below the support zone, the rate might find support in the lower trend line of the channel pattern near 155.00.