Sample Category Title
USDJPY’s Positive Drive Debatable as Sellers Resurface
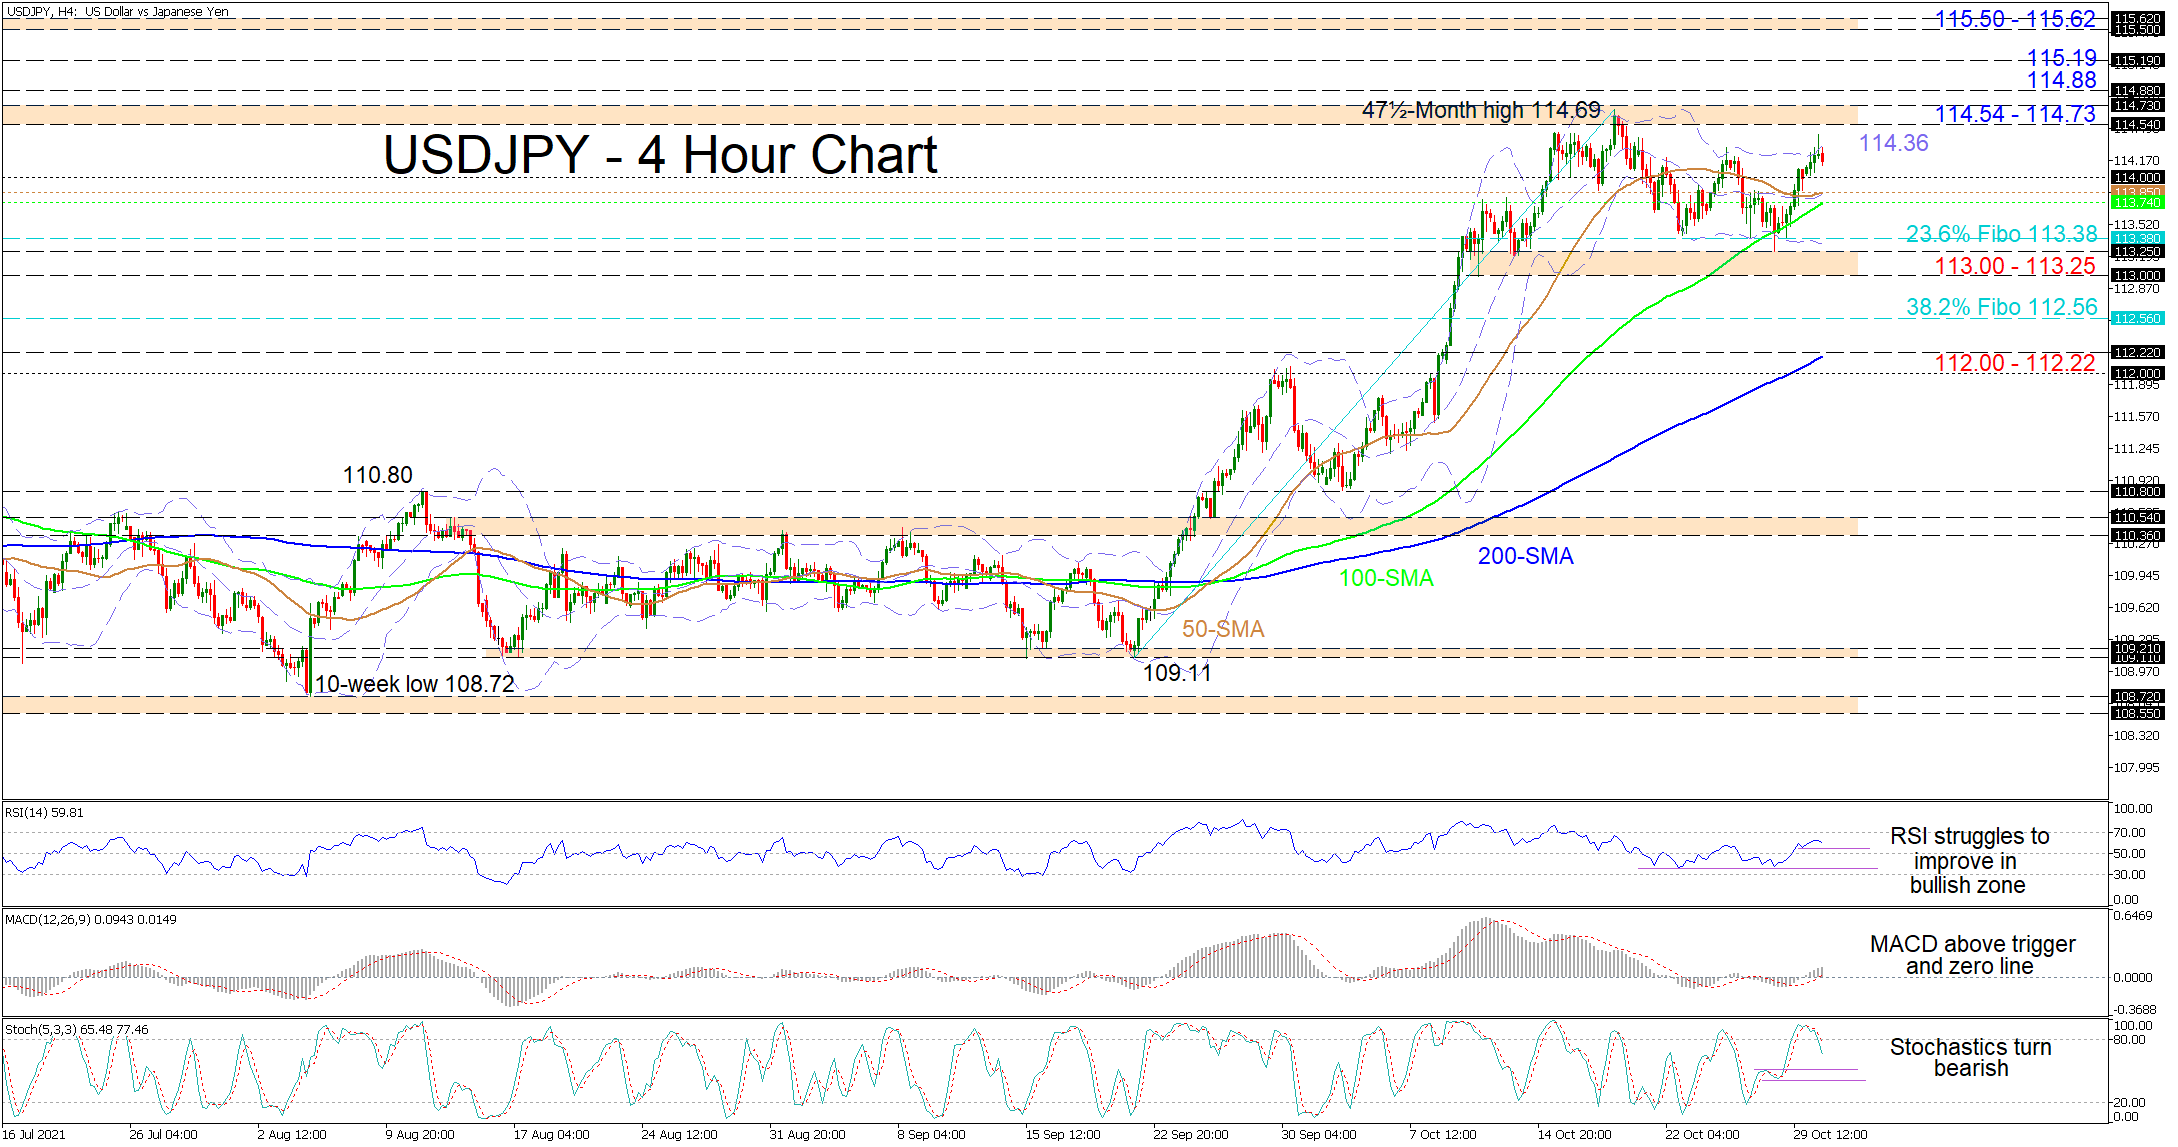
USDJPY has recently regained its buoyancy with a bounce off the base of 113.00-113.25, but bullish forces are looking vulnerable around the upper Bollinger band at 114.36 and ahead of the near 4-year high of 114.69. The 50-period simple moving average (SMA) is exhibiting a slight preference to the upside, while the advancing longer-term SMAs are endorsing the positive trend in the pair.
The short-term oscillators are reflecting conflicting messages in directional impetus. The falling RSI and stochastic lines are suggesting negative price action is increasing, while the MACD is strengthening above its red trigger line in the positive region.
If bullish potency diminishes, the pair could meet initial downside constraints around the 114.00 handle. If USDJPY continues to show signs of positive waning, the pair may encounter a zone of support from the 50-period SMA at 113.85 until the 100-period SMA at 113.74. Should the 100-period SMA fail to defend the positive structure, the price could drop towards the 113.38 level, bordering the lower Bollinger band, the former being the 23.6% Fibonacci retracement of the up leg from 109.11 until 114.69. In the event the price sinks beneath the key buffer zone of 113.00-113.25, sellers may target the 38.2% Fibo of 112.56 before their focus turns to the 112.00-112.22 reinforced support boundary.
Otherwise, if buying interest intensifies, the upper Bollinger band at 114.36 could delay the test of the 114.54-114.73 resistance band, shaped between the rally peaks of October 2018 and November 2017. Moving higher, the 114.88 and 115.19 barriers in March 2017 could come under fire. Leaving the 115.00 hurdle in the rear mirror, buyers could then challenge the 115.50-115.62 resistance belt formed by the highs of March and January of 2017.
Summarizing, USDJPY is exhibiting some weakness in upside momentum, showing a possible retest of the 114.00 mark and the 50- and 100-period SMAs. Nonetheless, the pair’s bullish bearing remains intact above the 113.00-113.25 foundation.
Elliott Wave Analysis: EUR/USD Eyes South Towards 1.1500-1.1450 Level
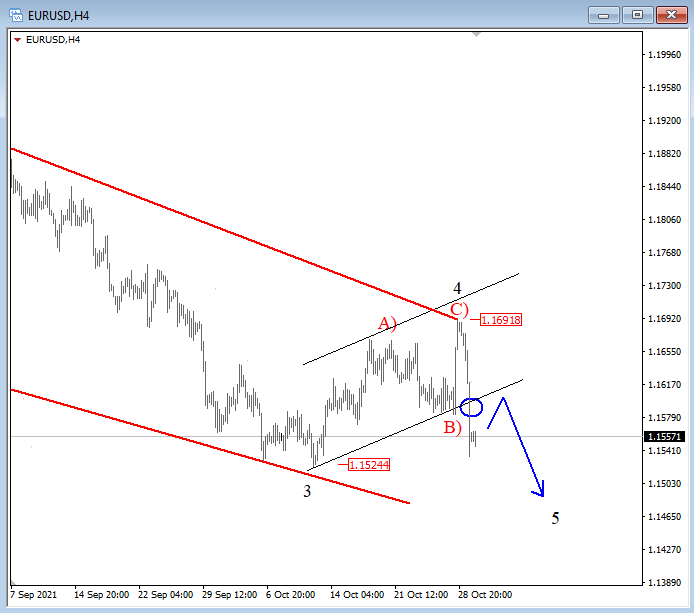
EURUSD has seen a sharp reversal lower last week and finished the Friday below trendline support which means that trend can be turning bearish now, especially as the drop looks impulsive. As such we will look for more weakness after a rally in three waves. The first resistance is at 1.1580-1.16 and the second area is at 1.1610-1.1640.
On 4h chart, EURUSD is coming sharply down after the pair stopped at 1.1690/1.17 resistance last week, which was a swing low from March and April. So, it seems that bears are still alive and back in full progress as the rise from 1.1524 was in three waves, plus broken trendline support. This is a very strong bearish pattern, so we favor more weakness now towards 1.1450-1.15, especially after any intraday rallies.
EUR/USD 4h Elliott Wave analysis
EUR/USD Mid-Day Outlook
Daily Pivots: (S1) 1.1502; (P) 1.1596; (R1) 1.1657; More...
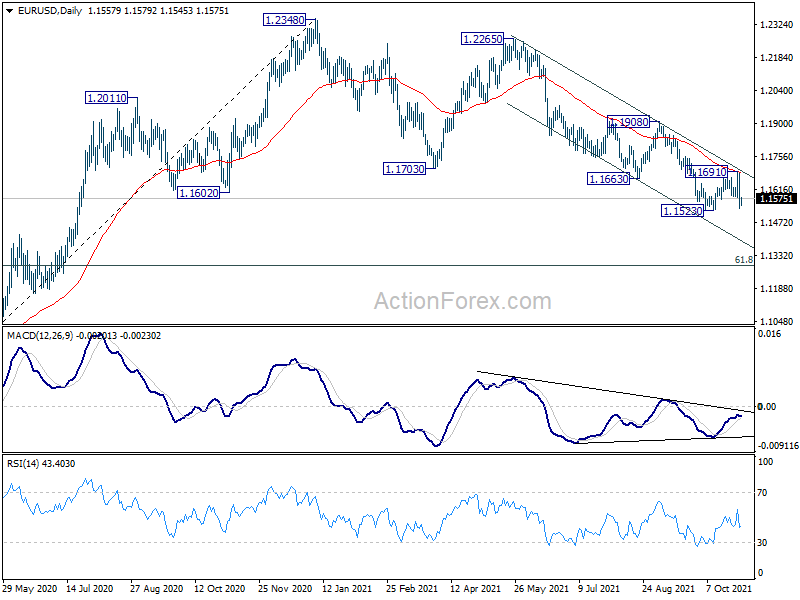
Intraday bias in EUR/USD stays mildly on the downside for 1.1523 support first. Break there will resume the fall from 1.2265, and that from 1.2348 too, for long term fibonacci level at 1.1289 next. For now, further decline is expected as long as 1.1691 resistance holds, in case of recovery.
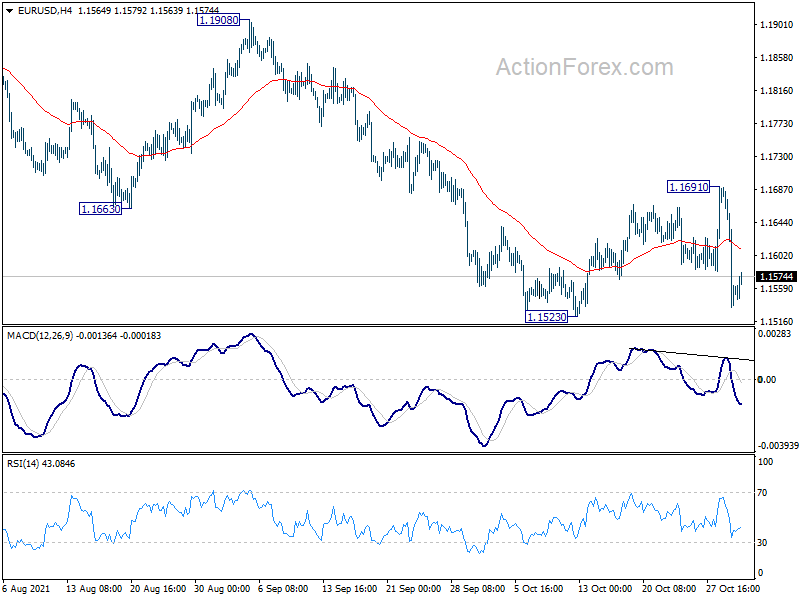
In the bigger picture, price actions from 1.2348 should at least be a correction to rise from 1.0635 (2020 low). As long as 1.1908 resistance holds, deeper fall would be seen to 61.8% retracement of 1.0635 to 1.2348 at 1.1289. Nevertheless break of 1.1908 resistance will revive medium term bullishness and turn focus back to 1.2348 high.
GBP/USD Mid-Day Outlook
Daily Pivots: (S1) 1.3641; (P) 1.3722; (R1) 1.3776; More...
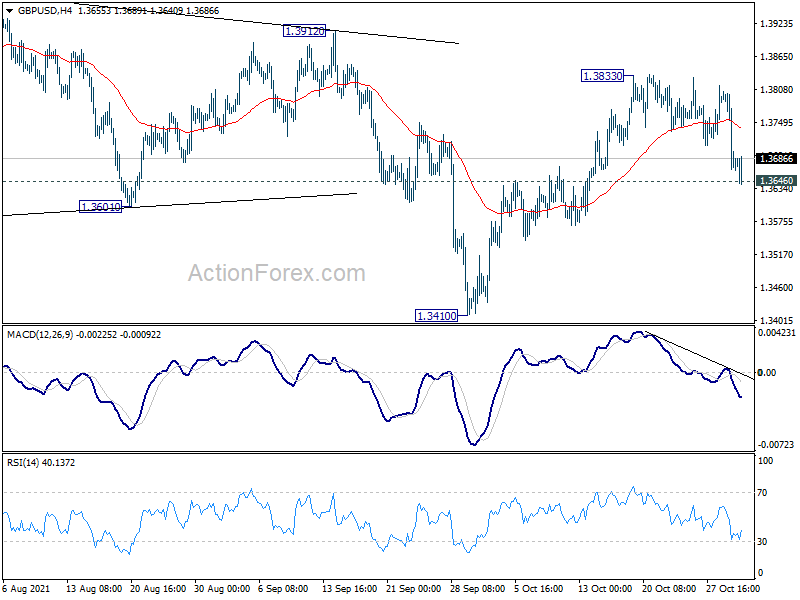
GBP/USD drops notably today but it's still defending 1.3646 support. Intraday bias remains neutral first. On the upside, above 1.3833 will resume the rebound from 1.3410 to 1.3912 key structural resistance. Firm break there will indicate that the correction from 1.4248 is complete with three waves down to 1.3410. On the downside, however, break of 1.3646 will turn bias to the downside for retesting 1.3410 low instead.
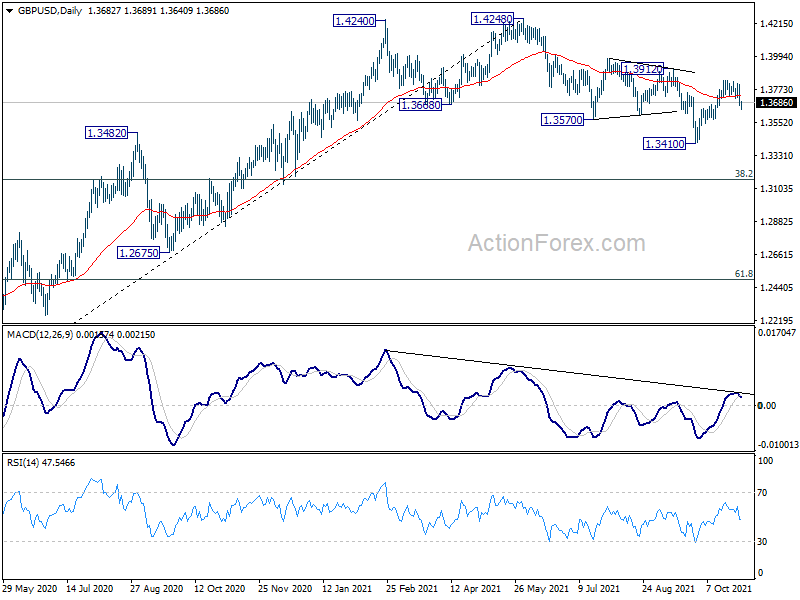
In the bigger picture, the structure of the fall from 1.4248 suggests that it's a correction to the up trend from 1.1409 (2020 low) only. While deeper fall cannot be ruled out yet, downside should be contained by 38.2% retracement of 1.1409 to 1.4248 at 1.3164, at least on first attempt, to bring rebound. On the upside, firm break of 1.4376 key resistance (2018 high) will add to the case of long term bullish reversal. However, sustained trading below 1.3164 will revive some medium term bearishness and target 61.8% retracement at 1.2493.
USD/CHF Mid-Day Outlook
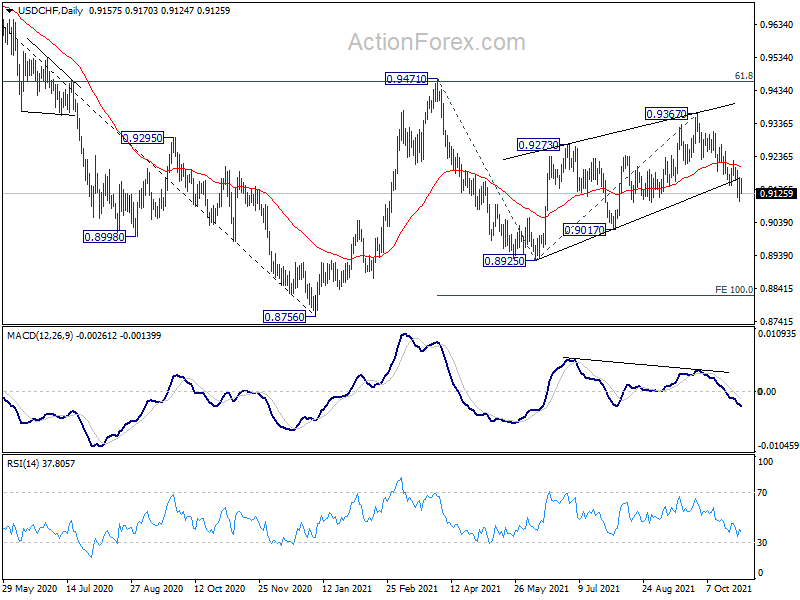
Daily Pivots: (S1) 0.9111; (P) 0.9144; (R1) 0.9184; More....
Intraday bias in USD/CHF stays neutral first, and further decline is expected with 0.9225 resistance intact. On the downside, break of 0.9101 will target 0.9017 support, and then 0.8925. On the upside, however, break of 0.9225 resistance will turn bias back to the upside for 0.9367 resistance instead.
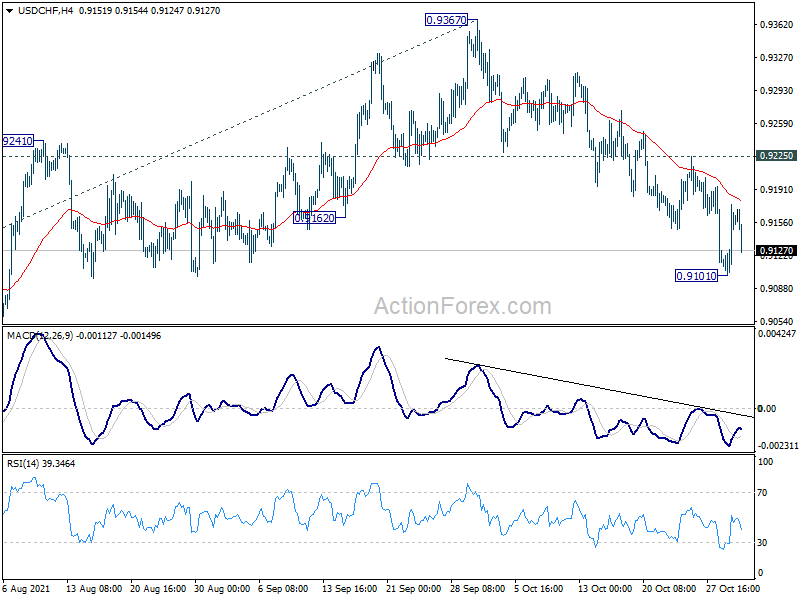
In the bigger picture, the corrective structure of the rebound from 0.8925 argues that fall from 0.9471 is not complete yet. It could either be the second leg of pattern from 0.8756 (2021 low), or resuming larger down trend from 1.0237 (2018 high). We'd pay attention to the downside momentum and assess the odds later. But for now, medium term outlook will be neutral at best as long as 0.9471 resistance holds.
USD/JPY Mid-Day Outlook
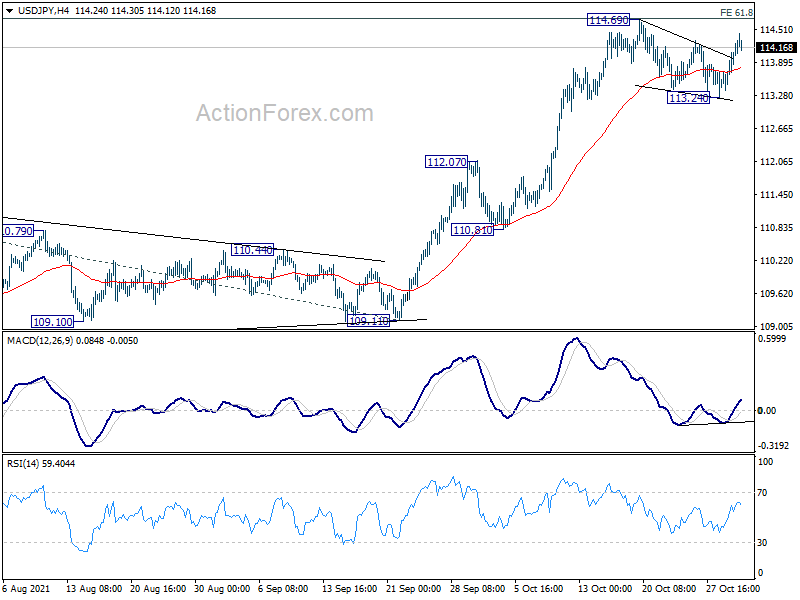
Daily Pivots: (S1) 113.55; (P) 113.82; (R1) 114.25; More...
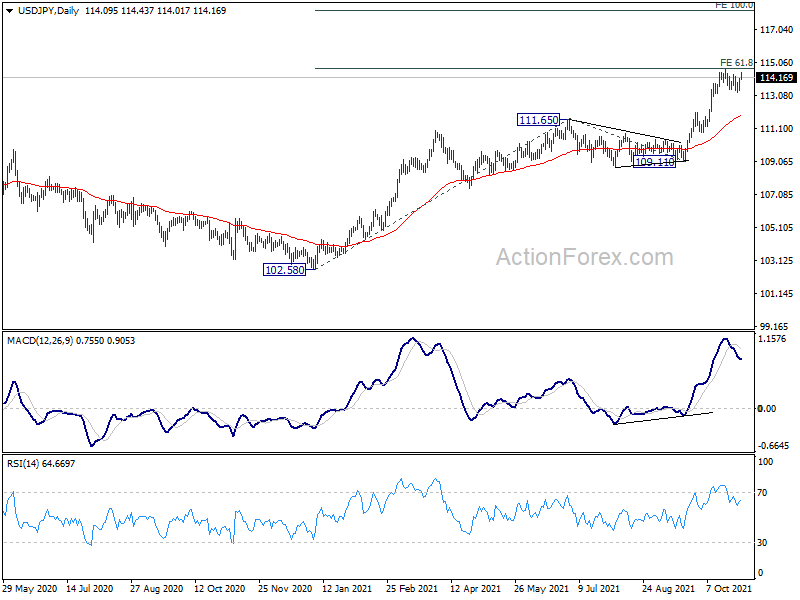
Intraday bias in USD/JPY remains neutral for the moment. On the upside, firm break of 114.69 will resume the larger up trend to 100% projection of 102.58 to 111.65 from 109.11 at 118.18 next. In case of deeper pull back, downside should be contained above 112.07 resistance turned support to bring rebound.
In the bigger picture, corrective decline from 118.65 (2016 high) should have completed at 101.18 already. Rise from the 102.58 is seen as the third leg of the up trend from 101.18. Next target is 114.54 resistance and then 118.65 high. This will now be the preferred case as long as 109.11 support hold, even in case of deep pull back.
FOMC Preview – Tapering to Formally Begin
The November FOMC meeting would see the Fed making a formal announcement on QE tapering. We expect the plan would begin immediately and is expected to end by mid-2022. The Fed funds rate will stay unchanged at 0-0.25%. The market has priced in over 60% of a rate hike in June 2022. This appears unlikely unless the QE program is scheduled to finish earlier. We look for the Fed's forward guidance regarding this.
Economic Developments
Economic growth surprised to the downside. GDP expanded an annualised +2% q/q in 3Q21, compared with consensus of +2.6% and +6.7% in 2Q21. Supply chain disruption and the spread of delta variant were the key reasons for the disappointment. Consumer spending grew +1.6%, down sharply from +12% in 2Q21 but better than consensus of +0.9%. Leading indicators signaled that the momentum has picked up again in the fourth quarter. For instance, Conference Board’s consumer confidence index improved to 113.8 in October, beating consensus of 108 and September’s 109.3. University of Michigan sentiment climbed +0.3 point to 71.7 in October. The ISM activity indices due next week is closely watched.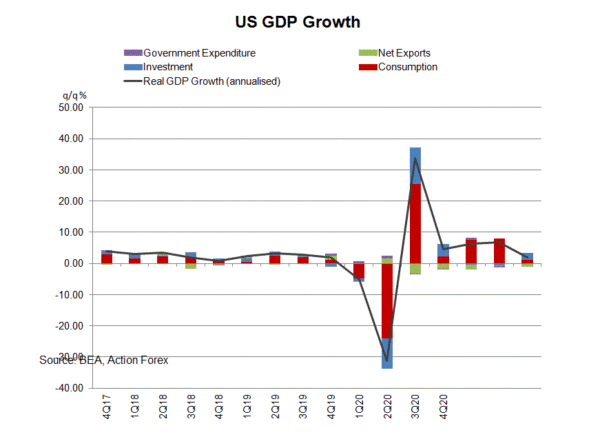
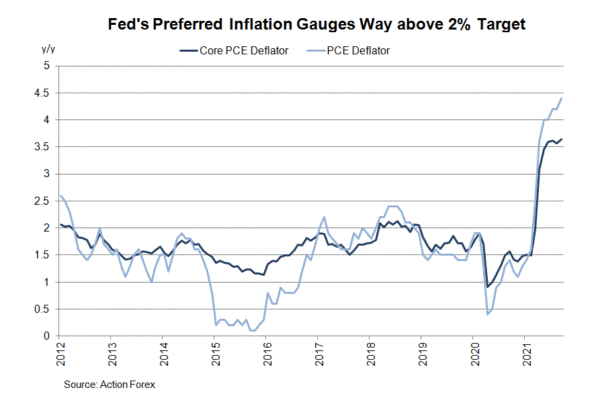
Inflation continued to accelerate. Headline CPI rose to +5.4% y/y in September, from +5.3% in August. Core CPI steadied at +4%. Meanwhile, the Fed preferred inflation gauge, PCE deflator rose to +4.4% y/y in September, from +4.2% a month ago. Core PCE deflator steadied at +3.6% y/y in the month. Strong inflation pressure proves more persistent than previously anticipated. At a virtual conference hosted by the South African Reserve Bank, Fed Chair Jerome Powell warned of the risk of "longer and more persistent bottlenecks and thus to higher inflation”. He also pledged to “use our tools to guide inflation back to 2%”, although noting that hiking interest rates was “premature”.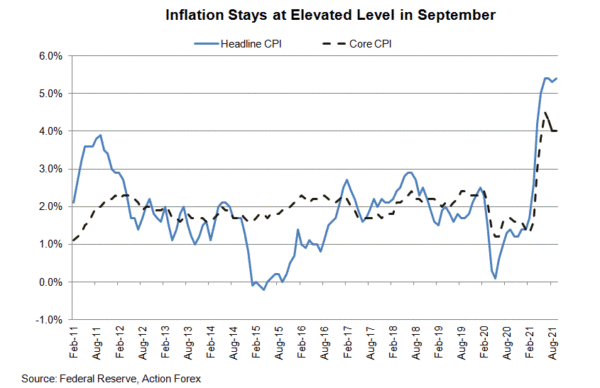
Monetary Policy
At the minutes of the September meeting, the Fed noted that tapering of asset purchases “could commence with the monthly purchase calendars beginning in either mid-November or mid-December”. The Fed is widely anticipated to formally announce the tapering plan at the upcoming meeting and we expect the tapering to begin immediately. The September minutes also indicated that the pace would be “monthly reductions in the pace of asset purchases, by US$10B in the case of Treasury securities and US$5B in the case of agency mortgage-backed securities (MBS)”. The pace would lead to a completion of the entire asset purchases by mid -2022. A hawkish surprise – monthly reduction at a faster pace- cannot be ruled out given the inflationary pressure.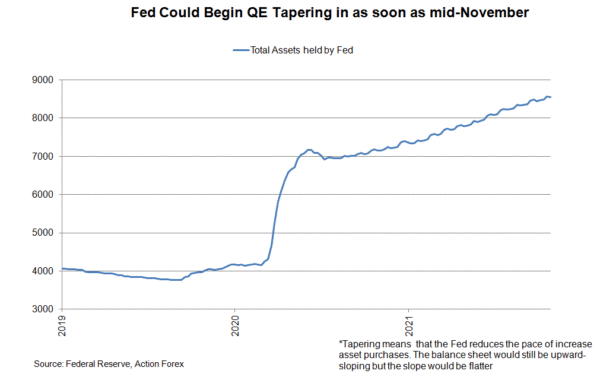
With tapering a done deal, the focus would be on the timing of the first rate hike. In September, the median dot plot revealed that half of the members had anticipated a rate hike in 2022. Meanwhile, the market has priced in futures have priced in over 60% of a rate hike by June 2022 (CME’s 30-day Fed funds). While the next median dot plot will not come until December, we are of interest to see if the Fed would comment on the market pricing.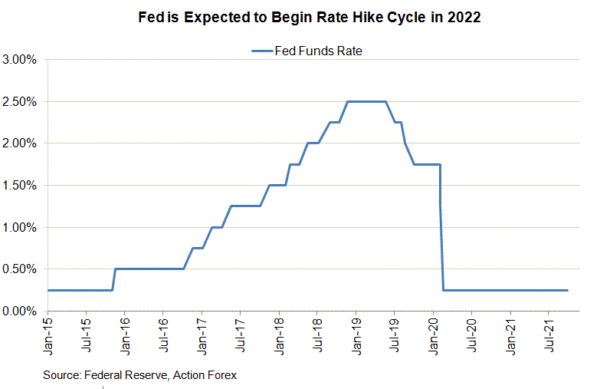
EUR/CHF Mid-Day Outlook
Daily Pivots: (S1) 1.0549; (P) 1.0603; (R1) 1.0635; More....
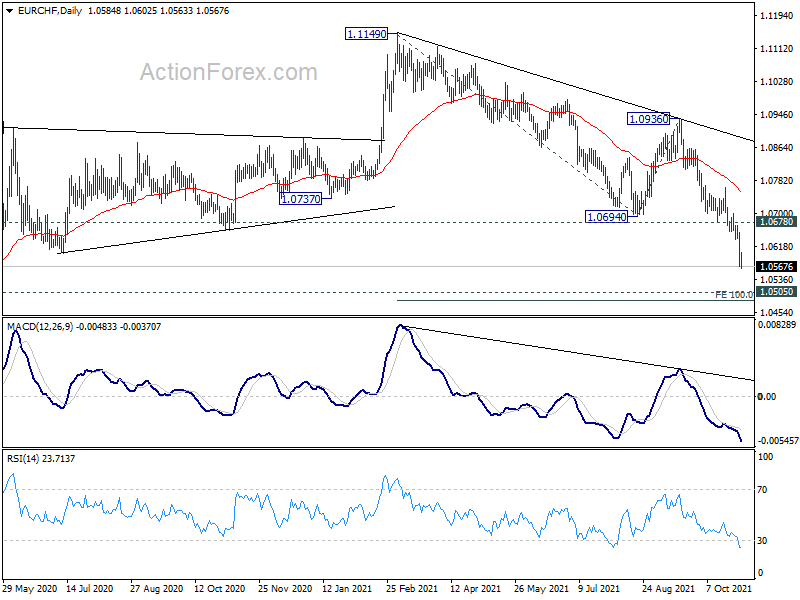
EUR/CHF's down trend continues today and hit as low as 1.0563 so far. Intraday bias stays on the downside for 100% projection of 1.1149 to 1.0694 from 1.0936 at 1.0481. On the upside, break of 1.0678 support turned resistance is needed to indicate short term bottoming. Otherwise, outlook will stay bearish in case of recovery.
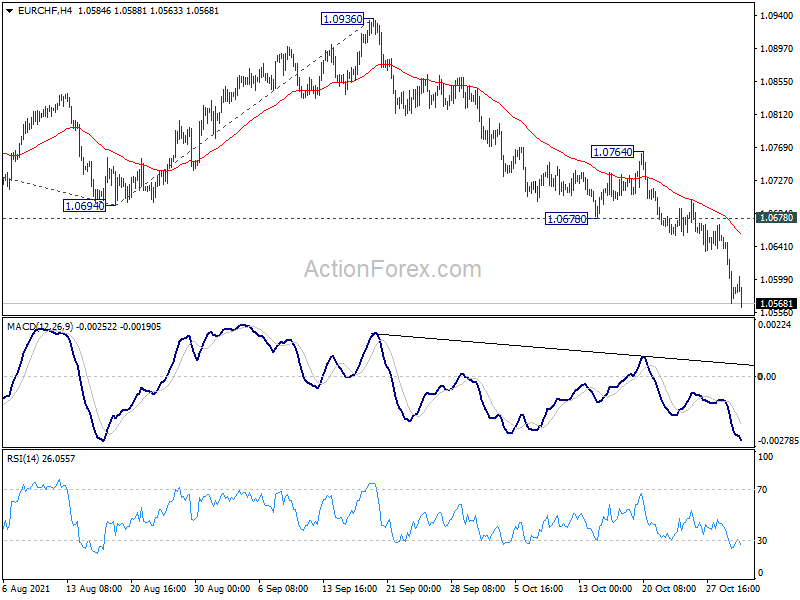
In the bigger picture, current downside momentum argues that fall from 1.1149 is probably resuming the downside from 1.2004 (2018 high). Next focus is 1.0505 (2020 low). Decisive break there will confirm this bearish case and target 61.8% projection of 1.2004 to 1.0505 to 1.1149 at 1.0223 next. Strong support from 1.0505 will bring rebound first. But outlook will stay bearish as long as 1.0936 resistance holds.
Swiss Franc Rallies Against Euro and Sterling, Dollar Mixed
Swiss Franc is strengthening notably today, but selling focus has somewhat shifted from Euro to Sterling. Still, the franc is outshone by New Zealand Dollar, which is overwhelming the strongest. On the other hand, Yen is the weaker one following extended risk-on sentiments from Japan to Europe. Sterling is following closely as second weakest. Dollar is mixed with Canadian.
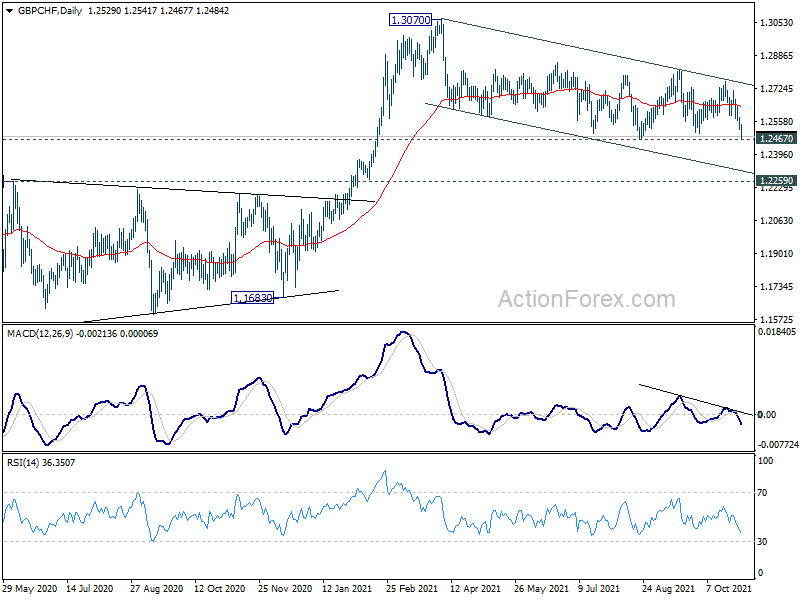
Technically, selloff in GBP/CHF today suggests that corrective pattern from 1.3070 is ready to resume. Break of 1.2467 support will target 1.2259 resistance turned support next. If that happens, we'd pay attention to 1.3646 support in GBP/USD, 0.8474 resistance in EUR/GBP, as well as 0.9101 support in USD/CHF. Price actions in these pairs should reveal whether it's Sterling's weakness, or Franc's strength, or both.
In Europe at the time of writing, FTSE is up 0.36%. DAX is up 0.67%. CAC is up 0.74%. Germany 10-year yield is up 0.031 at -0.073. Earlier in Asia, Nikkei rose 2.61%. Hong Kong HSI dropped -0.88%. China Shanghai SSE dropped -0.08%. Singapore Strait Times rose 0.65%. Japan 10-year yield dropped -0.0030 to 0.097.
UK PMI manufacturing finalized at 57.8, low growth environment met with inflationary pressures
UK PMI Manufacturing was finalized at 57.8 in October, slightly up from September's 57.1. That's, nonetheless, the first rise in five months. Market said new order growth ticked higher despite dropped in new export work. But selling prices rose at record pace.
Rob Dobson, Director at IHS Markit, said: " Strained global supply chains are disrupting production schedules, while staff shortages and declining intakes of new export work are also stymieing the upturn. This low growth environment is occurring in tandem with a severe upshot in inflationary pressures, with manufacturers reporting both a near-record increase in input costs and record rise in selling prices."
China Caixin PMI manufacturing rose to 50.6, supply strains became the paramount factor
China Caixin PMI Manufacturing rose to 50.6 in October, up from 50.0, above expectation of 50.6. Caixin noted total new work had the strongest increase in four months. Production fell modestly amid rising costs and reduced power supply. Average lead times rose at fastest rate since March 2020.
Wang Zhe, Senior Economist at Caixin Insight Group said: "To sum up, manufacturing recovered slightly in October from the previous month. But downward pressure on economic growth continued. We noticed that the pandemic's impact on manufacturing faded from late September to mid-October as the number of new Covid-19 cases dropped, which boosted demand.
"However, supply strains became the paramount factor affecting the economy. Shortages of raw materials and soaring commodity prices, combined with electricity supply problems, created strong constraints for manufacturers and disrupted supply chains. Input costs for manufacturers have risen much faster than output prices for several months, putting a lot of pressure on downstream enterprises."
Released over the weekend, official PMI Manufacturing dropped to 49.2 in October, down from 49.6, below expectation of 49.7. PMI Non-Manufacturing dropped to 52.4, down from 53.2, below expectation of 53.0.
Japan PMI manufacturing finalized at 53.2 in Oct, record business optimism
Japan PMI Manufacturing was finalized at 53.2 in October, up from September's 51.5. Markit said there were renewed rises in output and new orders. Input prices and output charges rose at quickest rate in over 13 years. Business optimism accelerated to series-record high.
Usamah Bhatti, Economist at IHS Markit, said: "October PMI data pointed to a stronger expansion in the Japanese manufacturing sector at the start of the fourth quarter... Overall, the headline Manufacturing PMI was at its highest reading since April and the second-highest in the year to date...
"Material shortages and delivery delays induced sharp rises in input prices, as average cost burdens rose at the sharpest pace since August 2008. This contributed to higher charges for clients in attempts to cover margins, with factory gate inflation quickening to a 13-year high..
"Confidence about the outlook reached the highest level since the series began in July 2012, as hopes that the end of the pandemic would stimulate a broad market recovery gathered pace. This is broadly in line with the IHS Markit forecast for industrial production to grow 7.1% this year and 4.3% in 2022."
Australia AiG manufacturing dropped to 50.4, but encouraged by rise in new orders
Australia AiG Performance of Manufacturing Index dropped -0.8 to 50.4 in October. That's the fourth consecutive month of decline and lowest reading since September 2020. Looking at some details, production dropped -5.3 to 47.8. Employment rose 0.9 to 48.0. New orders rose 6.3 to 58.3. Exports dropped -5.8 to 46.1. Input prices rose 3.7 to 81.8. Selling prices dropped -0.8 to 63.9. Average wages rose 10.8 to 63.7.
Ai Group Chief Executive Innes Willox said: "Although restrictions began to be eased, vaccination rates rose and the country edged towards a living with COVID approach, the year-long run of improving manufacturing performance was put on hold in October.... Although October was nothing to write home about, manufacturers will be encouraged by the sharp lift in new orders received and by the further progress towards removing COVID restrictions.
EUR/CHF Mid-Day Outlook
Daily Pivots: (S1) 1.0549; (P) 1.0603; (R1) 1.0635; More....
EUR/CHF's down trend continues today and hit as low as 1.0563 so far. Intraday bias stays on the downside for 100% projection of 1.1149 to 1.0694 from 1.0936 at 1.0481. On the upside, break of 1.0678 support turned resistance is needed to indicate short term bottoming. Otherwise, outlook will stay bearish in case of recovery.
In the bigger picture, current downside momentum argues that fall from 1.1149 is probably resuming the downside from 1.2004 (2018 high). Next focus is 1.0505 (2020 low). Decisive break there will confirm this bearish case and target 61.8% projection of 1.2004 to 1.0505 to 1.1149 at 1.0223 next. Strong support from 1.0505 will bring rebound first. But outlook will stay bearish as long as 1.0936 resistance holds.
Economic Indicators Update
| GMT | Ccy | Events | Actual | Forecast | Previous | Revised |
|---|---|---|---|---|---|---|
| 21:30 | AUD | AiG Performance of Manufacturing Index Oct | 50.4 | 51.6 | ||
| 0:30 | JPY | Manufacturing PMI Oct | 53.2 | 53 | 53 | |
| 1:45 | CNY | Caixin Manufacturing PMI Oct | 50.6 | 50.2 | 50 | |
| 7:00 | EUR | Germany Retail Sales M/M Sep | -2.50% | 0.60% | 1.10% | |
| 8:30 | CHF | SVME PMI Oct | 65.4 | 65.5 | 68.1 | |
| 9:30 | GBP | Manufacturing PMI Oct F | 57.8 | 57.7 | 57.7 | |
| 13:30 | CAD | Manufacturing PMI Oct | 57.2 | 57 | ||
| 13:45 | USD | Manufacturing PMI Oct F | 59.2 | 59.2 | ||
| 14:00 | USD | ISM Manufacturing PMI Oct | 60.4 | 61.1 | ||
| 14:00 | USD | ISM Manufacturing Prices Paid Oct | 82.5 | 81.2 | ||
| 14:00 | USD | ISM Manufacturing Employment Index Oct | 50.2 | |||
| 14:00 | USD | Construction Spending M/M Sep | 0.50% | 0.00% |
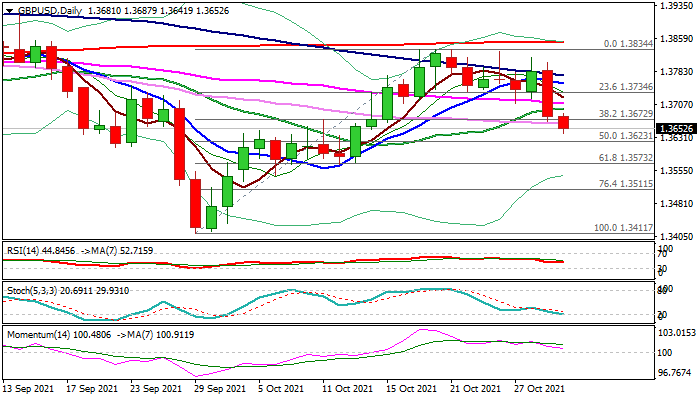
GBP/USD Outlook: Close Below Key Fibo To Confirm Bearish Signal And Risk Deeper Fall
British pound remains firmly in red on Monday and dips to the lowest in nearly three weeks, in extension of Friday’s 0.8% fall (the biggest one-day drop since Sep 29).
Negative weekly close formed reversal pattern on weekly chart, following repeated failures to sustain break above the top of thick weekly cloud, while Friday’s drop and close below converging 20/55DMA’s) weakened near-term structure.
Fresh bearish signal was generated on today’s break below pivotal Fibo support at 1.3672 (38.2% of 1.3411/1.3834), reinforced by 30DMA, with close below here to strengthen bears for extension through 1.3623 (50% retracement) towards a higher base at 1.3570 zone (also Fibo 61.8% of 1.3411/1.3834).
Upticks should stay under 1.3700 zone (20/55DMA’s) now reverted to resistance, to keep bears in play.
Res: 1.3672, 1.3709, 1.3734, 1.3754
Sup: 1.3641, 1.3623, 1.3600, 1.3570