

Sample Category Title
Stocks Defy Gravity, Oil Storms Higher, Dollar Retreats
- Stock markets hover near record highs despite mounting risks
- Dollar pulls back, sterling in BoE limbo, Turkish lira collapses
- Action-packed week ahead with three central banks and tech earnings
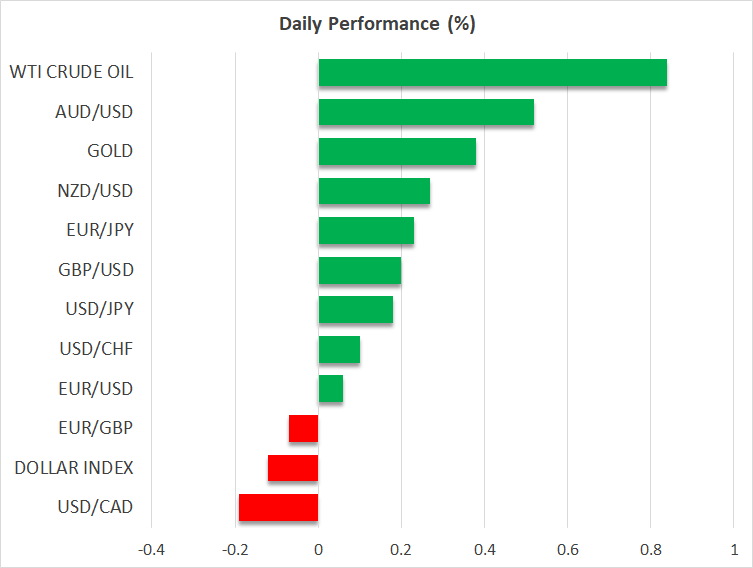 It's still about inflation
The overarching market theme continues to be how persistent this inflation episode will be and whether central banks will go into battle to suppress it. Hopes that price pressures will fade by themselves have all but vanished as the energy crisis burst into the spotlight, propelling inflation expectations higher.
With investors anticipating higher inflation for longer, the timing of rate increases has been brought forward across the world. The risk is that central banks might step on the brakes too hard, normalizing just as economies are slowing to fight an inflation ghost that might not exist in a couple of years as supply chains finally correct and more energy production comes back online.
Therefore, it is quite surreal to see stock markets trading just a sliver away from their record highs even as oil prices and inflation expectations keep marching higher. This resilience might reflect the cheerful earnings season so far, complemented by investors pricing out the risk of corporate tax increases in America after the Democrats shelved those plans to reach a deal on social spending.
Still, the macroeconomic environment looks fragile. Rising yields, a slowdown in China as the property sector cleans up its balance sheet, consumers getting squeezed by higher energy bills, and no imminent relief for paralyzed supply chains seems like a recipe for greater volatility from record heights.
Pound uncertain, dollar inches lower
Over in the FX stadium, the British pound is all the rage as investors grapple with the prospect of a Bank of England rate increase next month to tame rising inflation expectations. However, that also risks choking the economic recovery by prematurely cooling demand.
Ergo, the outlook for sterling seems rather risky here. Market pricing around the Bank of England is already super-aggressive, with four rate increases priced in by the end of next year. This allows plenty of scope for disappointment moving forward, especially since the latest PMIs imply the UK might struggle to maintain its current momentum.
Meanwhile, the dollar has been on the back foot recently, which likely boils down to the joyful mood in equity markets eroding demand for defensive plays. This allowed euro/dollar to push higher but the latest round of PMIs suggests the risks remain tilted to the downside, as the energy shock continues to torment the Eurozone much more.
The Turkish lira has been blown to smithereens by the latest moves from President Erdogan, who essentially strong-armed the central bank into cutting rates despite an inflationary supernova and then expelled the ambassadors of many Western nations. With an escalating diplomatic crisis and the central bank unable to control soaring inflation, there isn't much that can rescue the lira from its doom-loop, outside of capital controls.
Huge week ahead
The economic calendar is low-key today but the rest of the week promises to be quite explosive, with central bank meetings in the Eurozone, Canada, and Japan alongside earnings results from the tech heavyweights. Facebook will get the ball rolling today after Wall Street's closing bell.
Among the central banks, the Bank of Canada could be the most exciting. The Canadian economy is absolutely roaring, enjoying the rally in oil prices and strong fundamentals. Employment is back to pre-crisis levels, which suggests wage growth could fire up soon to keep inflation dynamics rolling.
Finally, oil prices have gone ballistic, hitting new seven-year highs after the Saudi Arabian energy minister suggested that OPEC might not ride to the market's rescue by raising production. His comments could keep the relentless rally going as traders position for next week's crucial OPEC+ meeting.
Gold Fails To Leave 1,800 Level In The Dust, Upside Shaky
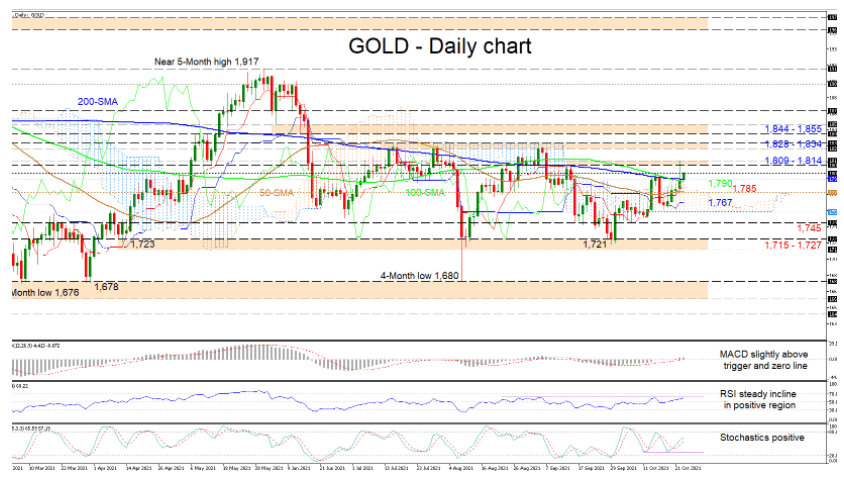
Gold is struggling to convincingly conquer the 1,800 handle and thus some doubt has been thrown into gold’s positive picture as sellers pushed back heavily in Friday’s trading session. The simple moving averages (SMAs) are overall on a horizontal trajectory and are converging, endorsing a more neutral price demeanour.
The Ichimoku lines are showing that bullish pressures have not fully disappeared, while the short-term oscillators are reflecting an increase in positive momentum. The MACD is making additional progress above its red trigger line nudging into the positive region, while the RSI is improving in bullish territory. The upbeat stochastic oscillator is promoting an upwards drive in the commodity.
If the price closes above the 1,800 barrier, nearby upside hindrance could stem from the resistance belt of 1,809-1,814. Overstepping the highs from September 14 and October 22 that form this obstacle, buyers may jump to challenge the ceiling of 1,828-1,834 that has kept the commodity consolidating since mid-July. Triumphing over this reinforced border, the price could then meet the resistance boundary of 1,844-1,855.
To the downside, sellers face an immediate region of support beginning from the 200-day SMA at 1,794 until the 50-day SMA at 1,779. Should the price sink beneath this reinforced buffer zone, the blue Kijun-sen line at 1,767 could come into focus ahead of the Ichimoku cloud’s floor at 1,757. Retreating further underneath the cloud and the neighbouring lows until 1,745, the bears could then make efforts to test the support section of 1,715-1,727.
Summarizing, gold’s short-term outlook remains neutral. That said, the precious metal is making attempts to decisively close north of the 1,800 border. A break above 1,834 could bolster upside momentum, while a drop below 1,715 is needed to reinforce negative tendencies.
Powell’s Taper Supports Greenback
Dollar boosted by Powell taper comments
Jerome Powell signalled that he was on board with starting the Fed taper on Friday, which gained the US dollar a temporary stay of execution. The dollar index finished down 0.1% at 91.60. However, the US dollar has resumed its easing path in Asia as those comments faded, falling 0.09% today to 93.52, just above support at 93.50. Although US yields eased on Friday, the 10-year remains well above 1.60% and although the greenback could weaken towards 93.00 this week if US tech-heavyweight earnings produce, a looming FOMC meeting and taper, I believe, will signal the end of the US dollar correction lower.
EUR/USD has edged higher to 1.1660 today but is continuing to find headwinds ahead of 1.1700. It needs a daily close above 1.1700 to signal more gains, although the single currency remains more vulnerable than most to the Fed taper, as this week ECB policy meeting is unlikely to risk the easy money forever boat. GBP/USD gave back some recent gains, falling 0.30% on Friday as Covid-19 cases spiral amid and fears of new restrictions. It has rallied by 0.25% to 1.3785 today though, as progress has apparently been made on the Northern Ireland Brexit protocols, and amid general dollar weakness. It needs to overcome strong resistance at 1.3835 to signal new gains while remaining vulnerable to news surrounding minimum wage hikes.
The fall in US yields on Friday saw USD/JPY quickly retreat by 0.45% to 113.50 on Friday. Only a retreat through 113.00 changes the bullish outlook for the pair. Some risk-hedging buying by local buyers of yen ahead of the weekend election may cap gains this week, but otherwise, USD/JPY remains entirely at the mercy of the US/Japan rate differential. USD/JPY may resume its rally after another lower forever BOJ policy meeting this week as well.
USD/CNY remains calm, with a neutral fixing by the PBOC today leaving USD/CNY unchanged at 6.3820. The PBOC signalled a large liquidity injection today was related to upcoming tax and debt payments by the private sector. China seemingly remains unconcerned about yuan strength, probably with one eye on its imported energy bill. USD/KRW has fallen by 0.80% today to 1168.00 with 1200.00 its key pivot point. The Thai baht rally continues as it reopens, USD/THB has fallen 0.60% to 33.122, while the Malaysian ringgit and Indonesian rupiah continue to find support from strong commodity and energy prices.
Oil Rises, Gold Flirts With 1800
Oil strengthens in Asia
Oil prices rose on Friday as Jerome Powell signalled that supply chain disruptions and the “transitory” inflation will be us for quite some time yet. Brent crude rose 1.10% to USD 85.70, and WTI leapt by 1.95% to USD 84.15 a barrel, taking out resistance at USD 84.00 a barrel. With the Saudi Arabia Energy Minister signalling over the weekend that OPEC+ will remain cautious on production increases, both Brent crude and WTI have tracked higher in Asia from the get-go. News that the US Democrats are close to a final spending package, along with sharp jumps in natural gas and coal this morning, are also boosting oil’s positive outlook. Brent crude has risen by 0.60% through resistance at USD 86.00 to USD 86.20 a barrel. WTI has risen by 0.50% to USD 84.55 a barrel.
Although the relative strength indexes (RSIs) on both contracts have moved back into overbought territory, it is physical market demands, and not technical factors, that are driving price movements right now. Although a sharp correction lower on a bearish headline cannot be ruled out in either contract, and a sell-off is likely to be followed by an equally sharp rally as the buy-the-dippers, speculative and physical, pile in.
A daily close of Brent crude and WTI above USD 86.00 and USD 84.00 a barrel this evening would be a bullish technical indicator, signalling that the next move higher in oil prices is underway. In the bigger picture, only a fall through their respective trendline supports at USD 83.25 for Brent, or USD 80.00 a barrel for WTI, changes the bullish outlook.
Gold rollercoaster session
Gold had a rollercoaster session on Friday, rising as high as USD 1814.00 an ounce at one stage as the break of USD 1800.00 triggered stop-loss, momentum and model buying. The Powell taper comments put a floor under the US dollar and saw an intra-day retreat, but gold still finished 0.54% higher at USD 1792.50 an ounce. In Asia, gold has resumed its rally, climbing 0.30% to USD 1798.00 an ounce.
The price action on Friday, a vicious rally, followed by an equally vicious sell-off, highlights how non-sticky the fast-money players are in gold when it starts to see some intra-day volatility. The whipsaw price action suggests that any rally in gold will struggle to maintain a multi-day outlook while those types of flows dominate volumes. However, Mr Powell did say that “transitory” inflation pressures will be with for some time to come, and it is increasingly looking like some sort of inflation hedging is being built into gold prices. Gold’s challenge will be whether it can weather an FOMC tapering announcement next week, especially if, as expected, US yields and the US dollar start their move higher again. I frankly, have my doubt.
That said, gold is slowly but surely forming what appears to be the second shoulder of an inverse head and shoulders pattern through a series of higher daily lows. In the bigger picture, a rise through USD 1835.00 an ounce, would trigger the multi-month inverse head-and-shoulders technical pattern and swing gold’s outlook back to positive, targeting a move back above USD 2000.00 an ounce.
There is no doubt the shorter-term technical picture looks bullish though, especially as gold has now closed and remained above the 100 and 200-day moving averages at USD 1791.00 and USD 1793.85 an ounce. A daily close above this zone tonight should signal more gains. Behind them, gold has support at USD 1780.00 an ounce. Resistance appears initially at the overnight high around USD 1814.00 before gold faces a formidable zone of multi-month daily highs between USD 1832.00 and USD 1835.00 an ounce.
EUR/USD Order Block Zone: The Price Is At The Crossroads
EUR/USD technical analysis
- EUR/USD is close to the ordering block zone.
- It will be either a bounce or a drop.
- 1.1770 is an upside target.
- 1.1538 is a downside target.
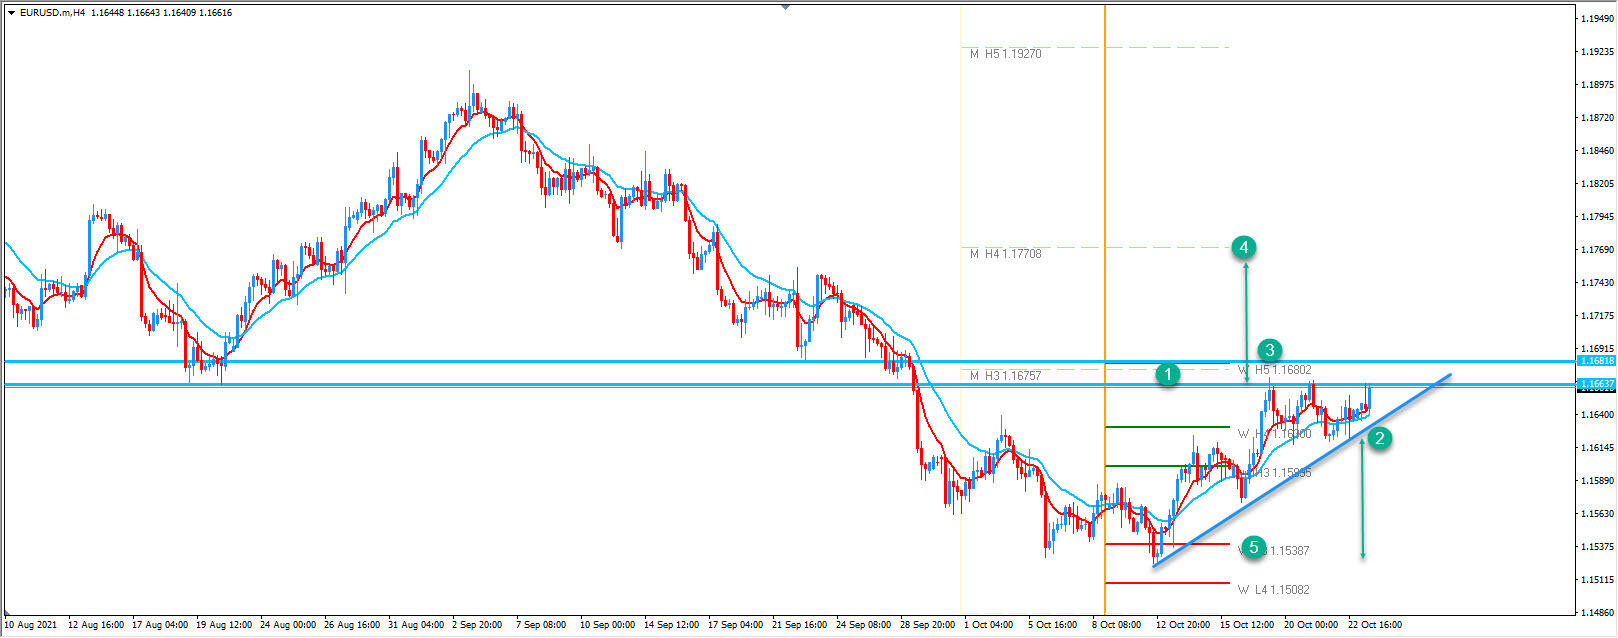
- Order block zone.
- Trend line breakout.
- Order block breakout.
- Upside target.
- Downside target.
The price is on the verge of a possible move up or down. We can clearly see the structure here which is showing us possible move up or break of the trend line lower. The EUR/USD is still bearish and this looks like a retracement. If the market starts to drop on H4/D1 timeframe we should definitely see the move down in the main trend direction. The target for the move up is 1.1770 and for the move down it's 1.1538. Watch for price action today.
EUR/USD Analysis: Bounces Off Resistance Zone
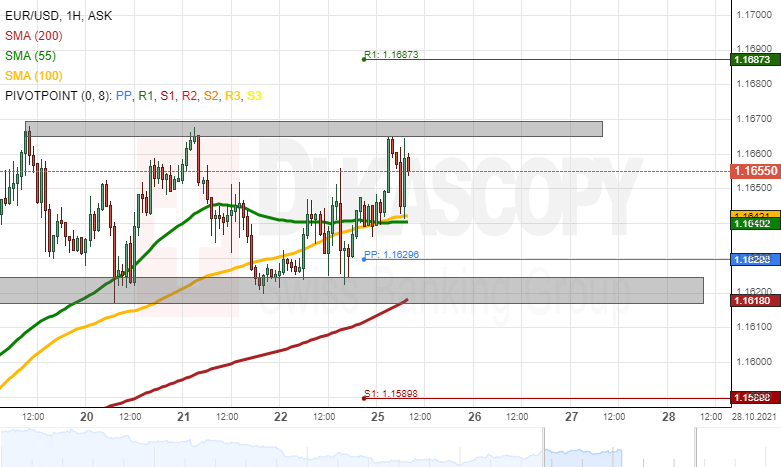
On Monday morning, the EUR/USD made an attempt to pass the resistance zone of 1.1665/1.1670. The rate failed at its attempt and declined to the combined technical support of the 55 and 100-hour simple moving averages at 1.1640.
In the case of a surge, the pair would once again test the resistance of the 1.1665/1.1670 zone. A passing of the resistance zone might reach for the weekly R1 simple pivot point at 1.1687.
On the other hand, a decline below the 55 and 100-hour SMAs at 1.1640, could look for support in the weekly simple pivot point at 1.1630. Below the pivot point, the last week's low level zone and the 200-hour SMA might act as support.
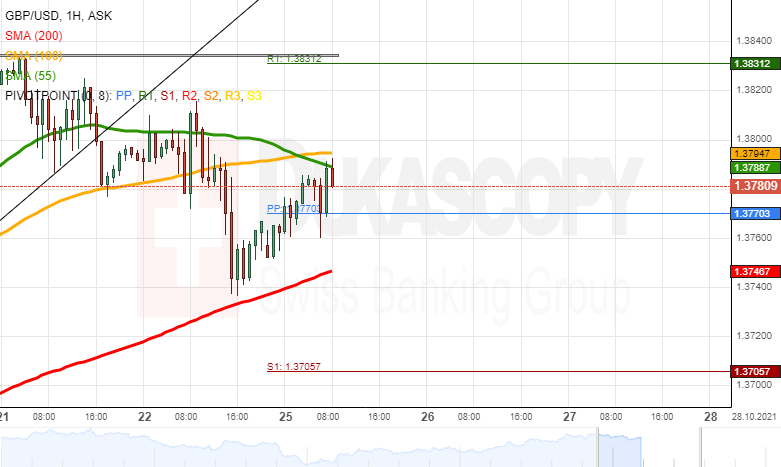
GBP/USD Analysis: Trades Below 1.3800
Since GMT midnight to Monday, the GBP/USD currency exchange rate was finding support in the 1.3760 mark. Meanwhile, resistance was being provided by the combination of the 55 and 100-hour simple moving averages at 1.3790 and 1.3795.
If the GBP/USD passes the resistance of the 55 and 100-hour simple moving averages and the 1.3800 mark, the pair could reach the resistance of the weekly R1 simple pivot point at 1.3831 and the previous week's high at 1.3835.
However, a decline of the rate would most likely first look for support in the 1.3760 level. Afterwards, the 200-hour SMA near 1.3750 might keep the pair up.
USD/JPY Analysis: Reaches Below 113.50
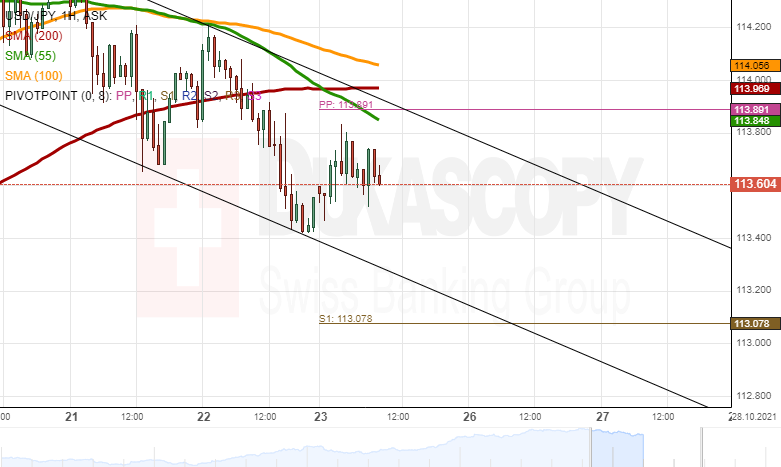
The USD/JPY currency exchange rate bounced off the resistance of the 55 and 100-hour simple moving averages on Friday morning. The event resulted in a decline, which reached the 113.40 level. The 113.40 mark provided support and caused a recovery to the 113.80 level.
In the near term future, the pair might decline due to the approaching resistance of the 55-hour simple moving average. A potential decline might look for support in the 113.40 level. Meanwhile, note that the pair has no technical support as low as the weekly S1 simple pivot point at 113.08.
However, a surge of the rate would most likely encounter the resistance of the 55-hour SMA near 113.80, the weekly simple pivot point at 113.89 and the 100 and 200-hour simple moving averages near 114.00.
Gold Analysis: Increases Volatility
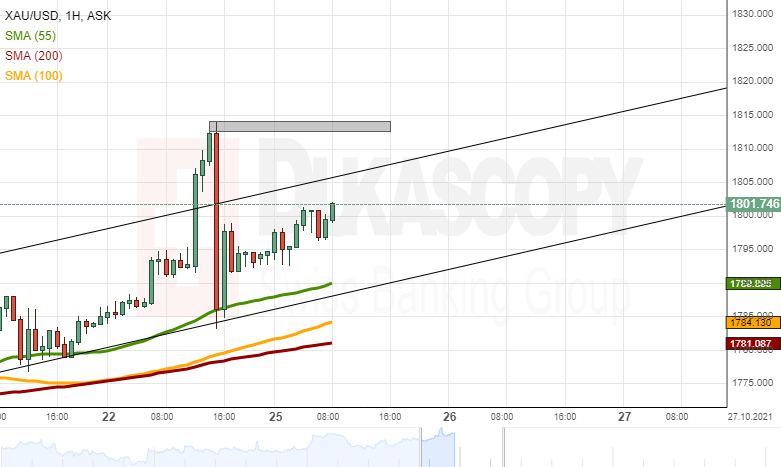
On Friday, at 12:15 GMT, gold suddenly surged broke the channel up pattern and pierced the 1,800.00 level. The following surge stopped at the 1,812.60/1,814.20 zone. At 15:00 GMT, the yellow metal's price plummeted to the support of the broken channel pattern near 1,785.00.
By the middle of Monday's European trading hours, the price for gold had reached the 1,800.00 level. If the metal continues to surge, it could once again reach the 1,821.60/1,814.20 zone.
On the other hand, the commodity price might decline and look for support in the trend line near 1,790.00. In addition, the 55, 100 and 200-hour simple moving averages could act as support levels.
Markets Cautious Ahead Of A Packed Week
Inflation risks, earnings from US Big Tech, ongoing Delta ‘Plus’ Covid concerns, and the upcoming ECB meeting are all on investors’ radars this week.
Stocks in Asia were mixed in early Monday trade and US futures were flat after the S&P 500 and Dow Jones Industrial Average hit new record highs last week. Positive earnings surprises have been the biggest factor contributing to the equity rally, with 84% of the 117 companies that have already announced results managing to beat forecasts. If we continue to see similar results until the end of the earnings season, profit growth is likely to hit 32% to 35% for the third quarter.
All eyes are on Facebook and Twitter this week after Snap shares fell as much as 23% on Friday due to changes to Apple’s privacy tracking settings. It will be interesting to see how those privacy changes impacted other social media platforms. Heavyweights Apple, Amazon, and Microsoft are also announcing results this week.
Dealing with inflation risks is slowly returning to center stage after US five-year breakevens hit 3% for the first time. In simple terms, bond investors are now pricing consumer inflation to an average of 3% over the next five years. Fed Chair Jerome Powell last week also seems more concerned about higher inflation for longer, given supply constraints, energy prices, and wage pressures.
Despite the rise in inflation expectations, stocks remained investors’ most favored asset class, given real yields remain stuck in negative territory. US 10-year real yields are holding near -1% suggesting there is little to no alternative for investors other than equities. This could possibly change if the Fed becomes more hawkish when policymakers meet for their next monetary policy decision next week. There is a high chance that more Fed members join the hawkish camp as some inflation factors now look more persistent than transitory.
Before the FOMC meets, the ECB’s Thursday policy meeting will reveal how far one of the most dovish central banks can push against the idea of tightening policy. The ECB does not want to follow in the footsteps of the Fed or the Bank of England. The latter is likely to raise rates before year-end. A cautious ECB should keep the euro under pressure for the remaining two months of 2021.