Sample Category Title
Evergrande Given Extension On Payment
Evergrande secures debt payment extension
As I write financial provider REDD is breaking a story that Evergrande has been granted an extension to its coupon payment due this Saturday. There has been no official announcement as yet and its shares briefly traded down over 10% this morning when trading resumed. The Hang Seng, where it is listed, remains over 1.0% lower for the day despite the news. Mainland China markets, however, have drifted back into the green with the Shanghai Composite 0.05% higher and the CSI is up 0.15%. Realistically, ahead of the central committee meeting in early November, I expect China’s “national team” to be on the bid on mainland exchanges should equity prices dip.
Overnight US equities finished mixed although the strong procession of quarterly earnings keeps the bullish fires alive. The S&P 500 finished 0.37% higher but healthcare dragged the Nasdaq to a fall of 0.05%, while the Dow Jones outperformed, rising 0.45%. Momentum has waned in Asia though with futures on all three indexes falling by around 0.20%, adding to what is a sombre mood in Asia generally.
Nerves around Evergrande and the China property sector appear to be weighing on sentiment in Asia today, with a weak Nasdaq performance having a negative impact on the closely correlated North Asia heavyweights. The Nikkei 225 has slumped by 1.90% with concerns increasing about the combination of a weak yen and rapidly rising energy prices. The ongoing eruption of Mt Aso and election campaigning, with some polls suggesting a close race, also seem to be prompting Japan investors to head to the sidelines. The Kospi is 0.30% lower while Taipei is down 0.05%.
Singapore has edged 0.15% lower with Kuala Lumpur falling 0.45% after yet another glove manufacturer had products seized by US Customs over labour practises. Jakarta is just 0.05% lower with Bangkok creeping 0.10% higher. Australian markets, with one eye on weaker US futures, Evergrande nerves and easing commodity prices is trading sideways. The ASX 200 and All Ordinaries are hovering near unchanged for the day.
AUD/USD Outlook: Bulls Are Taking A Breather But Supported By Weekly Failure Swing
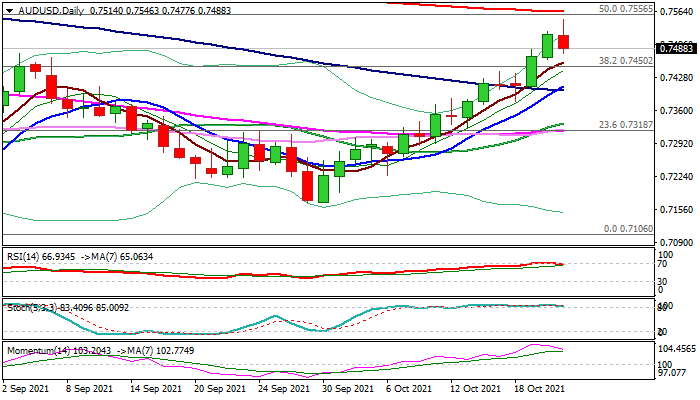
The Australian dollar eases on Thursday, following strong bullish acceleration in past two days, as bulls started to lose traction on approach to key barriers at 0.7556/63 (50% retracement of 0.8007/0.7106 downtrend / 200DMA).
Bulls remain firmly in play on daily and weekly chart, signaling further advance, with brief corrections expected to provide better buying opportunities.
Break above former recovery high (0.7478, Sep 3) looks for weekly close above this level to complete failure swing pattern on weekly chart and spark fresh acceleration higher, with close above 0.7556/63 pivots to confirm signal.
Bull-cross of 10/100DMA (0.7401) additionally supports the action, with extended dips to find ground here and keep bulls in play.
Res: 0.7556, 0.7563, 0.7599, 0.7616.
Sup: 0.7465, 0.7401, 0.7378, 0.7360.
The Analytical Overview Of The Main Currency Pairs
The EUR/USD currency pair
Technical indicators of the currency pair:
Prev Open: 1.1631
Prev Close: 1.1651
% chg. over the last day: +0.17%
The ECB's balance continues to grow despite the rising inflationary pressures. The total assets increased by another €22.4 billion, reaching a new level of €8,336.7 billion. The ECB continues to fill the economy with "cheap" money.
Trading recommendations
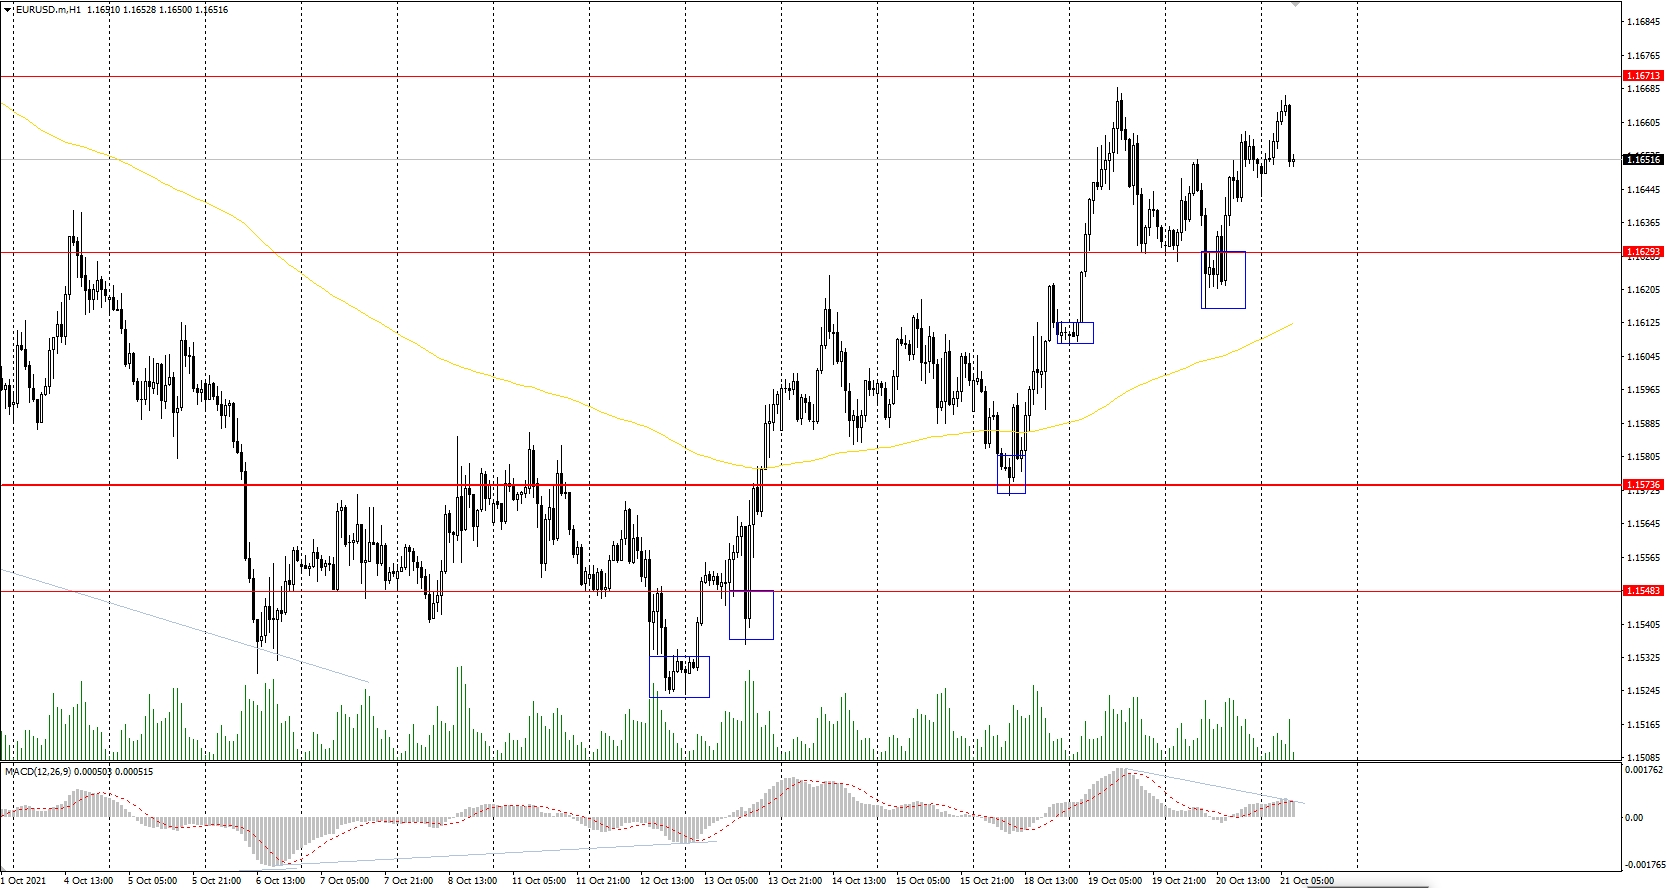
Support levels: 1.1629, 1.1548, 1.1502, 1.1453
Resistance levels: 1.1671, 1.1717, 1.1772, 1.1802, 1.1835
From the technical point of view, the EUR/USD on the hour timeframe is bullish. The MACD indicator is in the positive zone, but there are signs of buyer's weakness. Under such market conditions, traders should consider buying positions from the support levels near the moving average or from the buyer's initiative areas. It is best to look for sell trades from the resistance levels of the higher timeframe.
Alternative scenario: if the price breaks down through the 1.1548 support level and fixes below, the mid-term uptrend will likely be broken.
News feed for 2021.10.21:
- US Philadelphia Fed Manufacturing Index (m/m) at 15:30 (GMT+3);
- US Initial Jobless Claims (w/w) at 15:30 (GMT+3).
The GBP/USD currency pair
Technical indicators of the currency pair:
Prev Open: 1.3789
Prev Close: 1.3823
% chg. over the last day: +0.25%
The UK Consumer Price Index was 3.1% (previous 3.2%), indicating that inflation in the United Kingdom is slowing. Core inflation, which excludes food and energy prices, also declined from 3.1% to 2.9%. The UK Secretary of State for Business, Kwasi Kwarteng, is confident that the government will contain inflation.
Trading recommendations
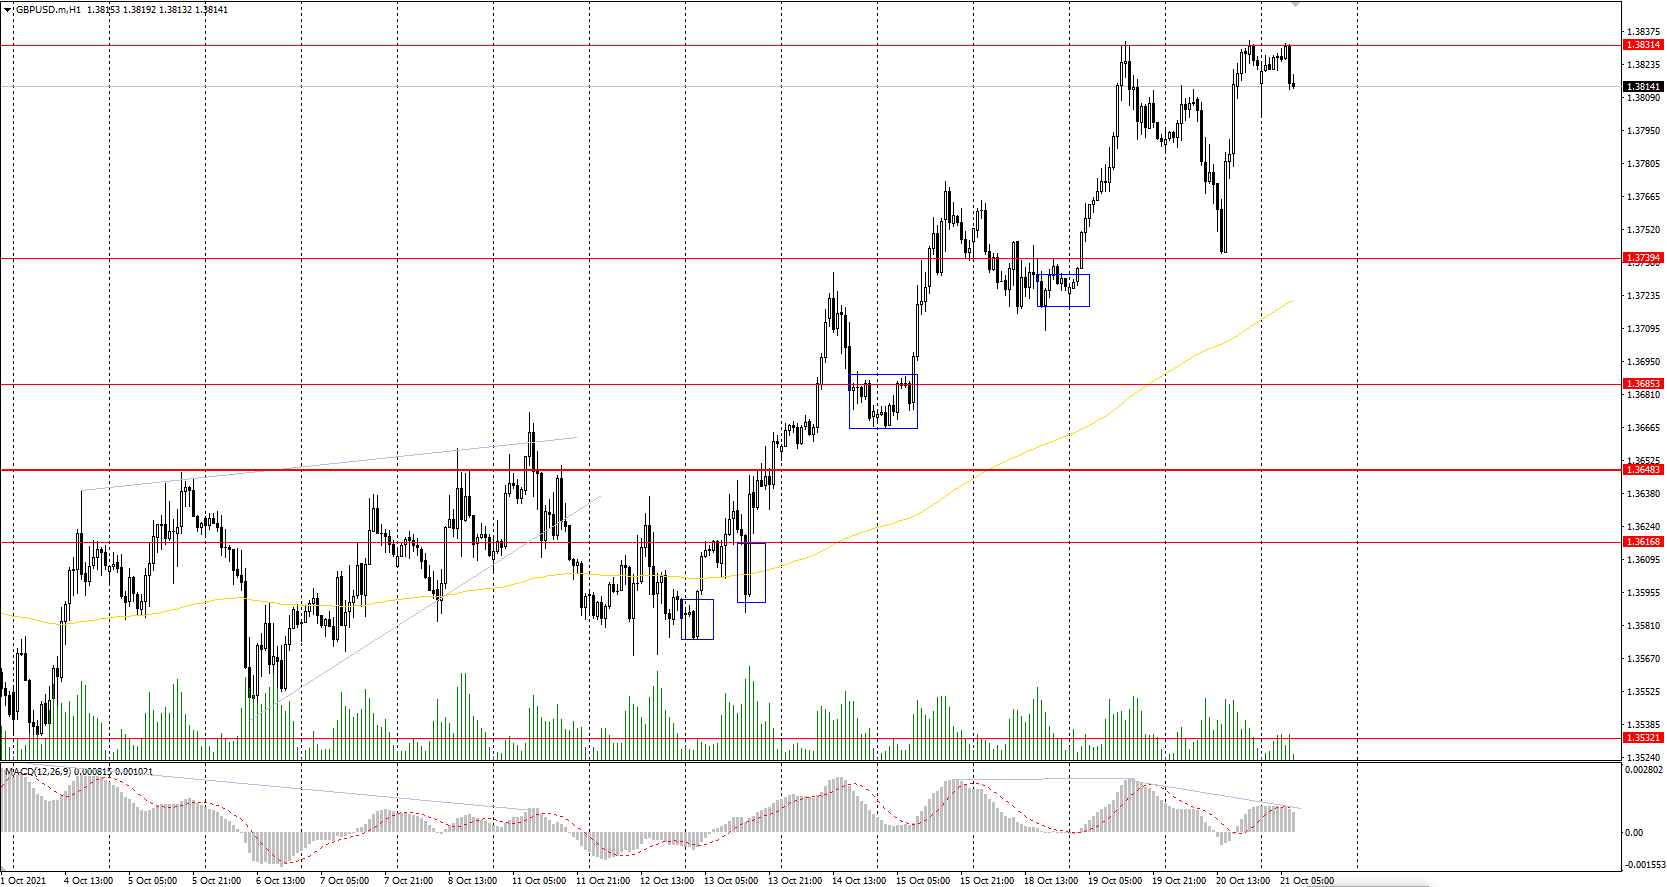
Support levels: 1.3739, 1.3685, 1.3648, 1.3617, 1.3532, 1.3457, 1.3360, 1.3282
Resistance levels: 1.3831, 1.3886
On the hourly time frame, the GBP/USD trend is bullish. The British pound is strengthening due to its direct correlation with oil prices and the weakness of the dollar index. The MACD indicator is in the positive zone, but there are the first signs of buyers' weakness. Buy trades should be considered only within the day and only from the initiative zone of the buyers. It is better to look for sell deals from the resistance levels of the higher timeframe, but after an additional confirmation in the form of a sellers' initiative because the buyers' pressure is higher now.
Alternative scenario: if the price breaks down through the 1.3648 support level and consolidates below, the bullish scenario is likely to be broken.
The USD/JPY currency pair
Technical indicators of the currency pair:
Prev Open: 114.32
Prev Close: 114.32
% chg. over the last day: 0.00%
Concerns about high energy prices are growing in Japan as it leads to lower corporate profits. The Japanese yen is still trading at highs against the US dollar, and this trend might intensify further.
Trading recommendations
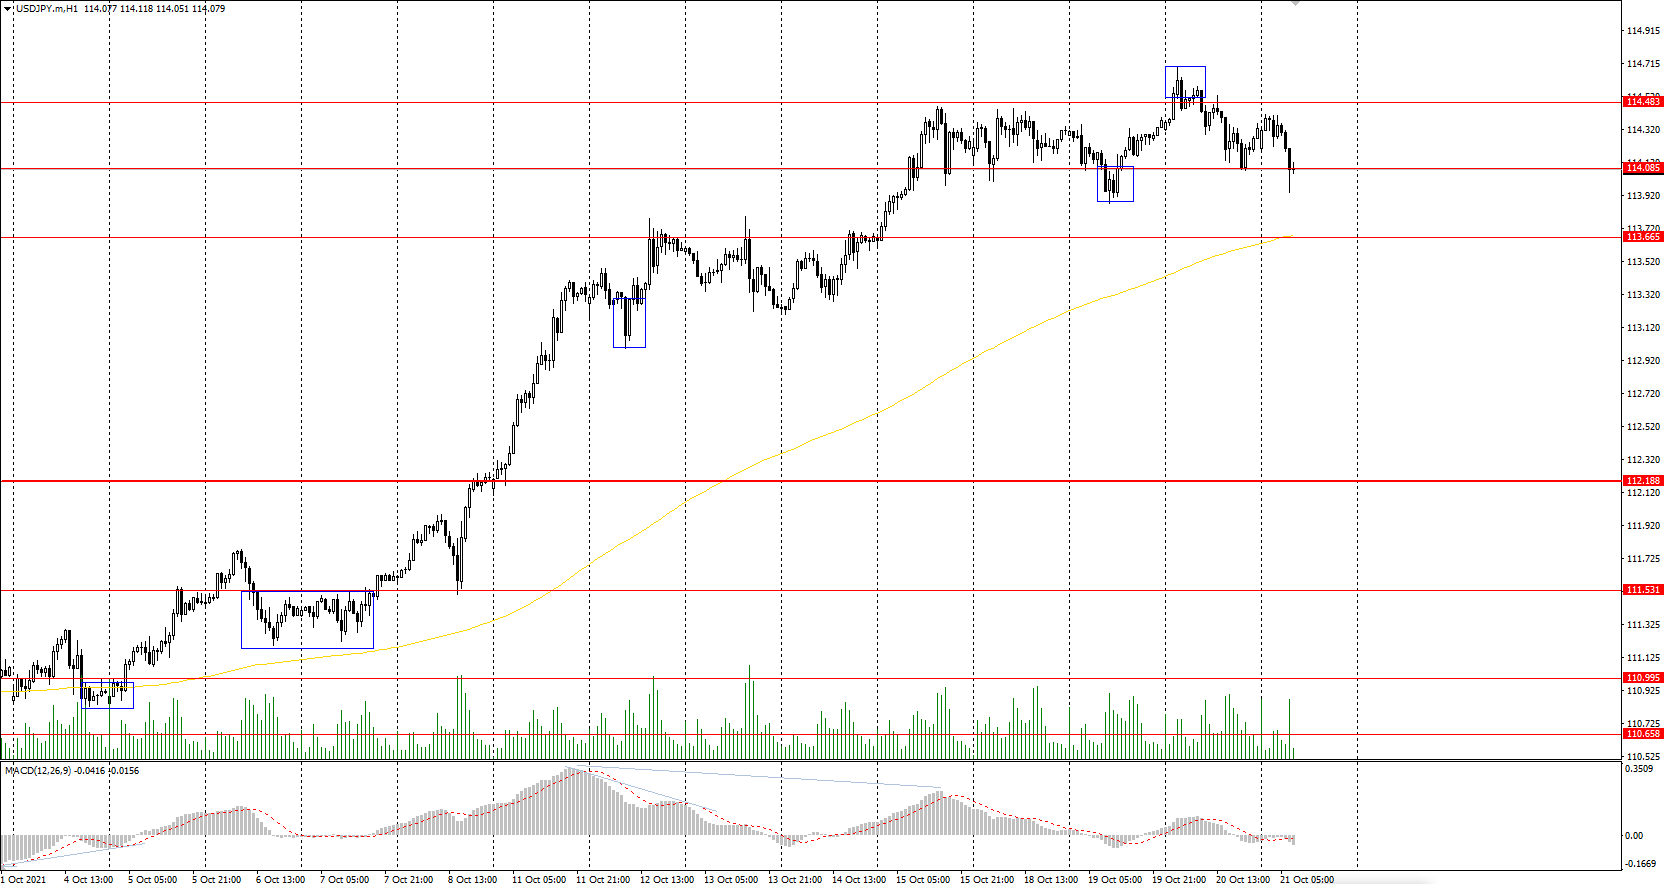
Support levels: 114.08, 113.66, 112.19, 111.53, 110.99, 110.65
Resistance levels: 114.48, 115.15
The main trend of the USD/JPY currency pair is bullish. At the moment, the price is trading flat and has formed false break zones on both sides. The MACD indicator has become inactive. However, there is still a divergence on higher time frames, which means that growth is limited, and correction is expected soon. Under such market conditions, it's better to look for buy positions from the support levels near the moving average or the buyers' initiative zones on the lower timeframes. Sell positions should be considered from the resistance levels of a higher timeframe, given there is sellers' initiative.
Alternative scenario: if the price falls below 112.19, the uptrend is likely to be broken.
The USD/JPY currency pair
Technical indicators of the currency pair:
Prev Open: 114.32
Prev Close: 114.32
% chg. over the last day: 0.00%
Concerns about high energy prices are growing in Japan as it leads to lower corporate profits. The Japanese yen is still trading at highs against the US dollar, and this trend might intensify further.
Trading recommendations
Support levels: 114.08, 113.66, 112.19, 111.53, 110.99, 110.65
Resistance levels: 114.48, 115.15
The main trend of the USD/JPY currency pair is bullish. At the moment, the price is trading flat and has formed false break zones on both sides. The MACD indicator has become inactive. However, there is still a divergence on higher time frames, which means that growth is limited, and correction is expected soon. Under such market conditions, it's better to look for buy positions from the support levels near the moving average or the buyers' initiative zones on the lower timeframes. Sell positions should be considered from the resistance levels of a higher timeframe, given there is sellers' initiative.
Alternative scenario: if the price falls below 112.19, the uptrend is likely to be broken.
Food Shortages Could Be The Next Supply Chain Crisis
The US stock market traded yesterday without a single trend. By the close of the New York Stock Exchange, the Dow Jones index increased by 0.43% and updated a price high again, the S&P 500 index added 0.37%, and the NASDAQ technology index decreased by 0.05%. According to the Beige Book report, the US economy expanded at a moderate-to-moderate pace in September. However, several Federal Reserve Banks (FRBs) noted a slowdown in the recovery due to supply chain problems, labor shortages, and uncertainty over the COVID-19 delta strain. According to 22 out of 40 economists surveyed, persistently high inflation is the biggest risk for the US economy.
European stock indexes closed yesterday in the green zone. The British FTSE 100 gained 0.08%, German DAX added 0.05%, French CAC 40 increased by 0.54%, Italian FTSE MIB added 0.94% and Spanish IBEX 35 increased by 0.24%. Strong corporate reports of some European companies were a growth trigger. Husqvarna's shares, a Swiss machinery and tools' manufacturer, gained more than 8% on the strong report, while Nestle SA jumped by 2.7%.
Food shortages could be the next supply chain crisis. Sellers warn about periodic delays in various product categories. Labor issues and port congestion are also affecting food shipments.
US oil reserves showed another decrease of 431,000 barrels within the week. Supply shortages affect the increase in oil prices. OPEC+ is now discussing ways to balance oil prices, but the decision to increase production beyond the agreed levels was not made so far. Saudi Arabia has said that any additional oil from the OPEC+ cartel will do little to reduce rising natural gas and oil prices.
In Europe, gas prices increased by 58.9%, and electricity prices increased by 23.0% compared to the previous year. The gas storage in Germany is filled up about 70%, and the EU averages about 77%, comparable to 2015 levels.
Gold increased for the second day in a row as the US dollar continued to decline. Investors are waiting for comments from Federal Reserve officials this week that could provide insight into the prospects for tightening monetary policy.
In China, the Bank's 5-year interest rate remained unchanged at 4.65% (forecast 4.65%, previous 4.65%). The annual interest rate remained unchanged (3.85% actual, forecast 3.85%, previous 3.85%). The slowdown in China's real estate sector is hurting economic growth, and it is unclear if there are any new growth factors to fill the gap. Asian stock markets have been mostly down since the opening. Japan's Nikkei 225 decreased by 1.82% from the open, China's blue-chip index CSI 300 is trading flat, South Korea's KOSPI lost 0.29%, Hong Kong's Hang Seng decreased by 0.78%, but Australia's ASX 200 added 0.02%.
Today's most anticipated earning report releases are AT&T, Intel, Snap, Southwest, American Airlines, Danaher.
Main market quotes:
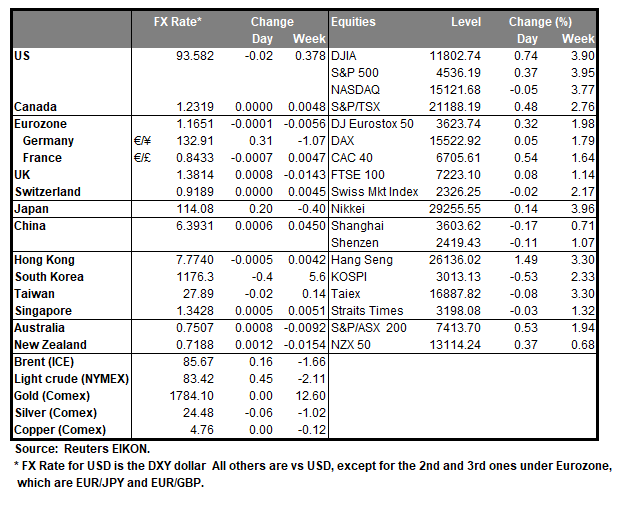
- S&P 500 (F) 4,536.19 +16.56 (+0.37%)
- Dow Jones 35,609.34 +152.03 (+0.43%)
- DAX 15,522.92 +7.09 (+0.05%)
- FTSE 100 7,223.10 +5.57 (+0.08%)
- USD Index 93.62 −0.11 (−0.12%)
Important events for today:
- US Philadelphia Fed Manufacturing Index (m/m) at 15:30 (GMT+3);
- US Initial Jobless Claims (w/w) at 15:30 (GMT+3);
- US Natural Gas Storage (w/w) at 17:30 (GMT+3);
- Australia RBA Governor Lowe Speaks at 22:00 (GMT+3).
Evergrande Jitters Return, Yen Climbs, Dollar Steady
- Evergrande shares plunge after sale of unit falls through, mood sours in equities
- Treasury yields ease back as Fed dampens early rate hike talk
- Yen bounces back, dollar edges up but commodity currencies take a tumble
 Stocks under pressure as Evergrande default risks grow
Equity markets were feeling the strain of a fresh panic about China’s heavily indebted property sector after troubled real estate giant – Evergrande – told investors that the sale of its property services unit for $2.6 billion had collapsed. Evergrande is desperately trying to raise the finances it needs to meet the bond interest payments on its $305 billion of debt and the sale of Evergrande Property Services Group was seen as being vital to avoiding a default.
The company has until Monday to settle a coupon payment of $83.5 million on an offshore bond as the 30-day grace period is set to expire at the end of this week. A default could have a huge domino effect on China’s entire real estate market and the wider construction industry. And although it’s unclear how big the international spillover would be, the prospect alone of the Chinese economy slowing even further than it already is could cast a massive shadow over the growth outlook globally.
Shares in Evergrande group were last down 12.5%, however, the Hang Seng index in Hong Kong managed to rebound from its session lows and China’s CSI 300 index ended the day in positive territory. While the Evergrande saga is far from over, assurances from the government that the debt crisis is unlikely to escalate into something bigger appears to be helping in maintaining some order in the markets for now.
A stock market panic or profit taking?
Stocks in Europe opened in the red and US futures slipped but the losses were modest. Although the renewed jitters are certainly weighing on sentiment on Thursday, markets were due a correction following six straight days of gains for the S&P 500. The tech-heavy Nasdaq indices have already run out of steam, closing lower on Wednesday even as the Dow Jones Industrial Average flirted with record territory.
Unless the Evergrande crisis really does blow up into a major catastrophe, Wall Street still has plenty of support that could keep the rally going for a while longer. Democrats are closing in on a deal on a key part of President Biden’s economic agenda. The social spending bill looks almost certain to have a price tag that’s much lower than the original figure of $3.5 trillion, but anything above $1 trillion combined with the infrastructure bill of $1.2 trillion should nevertheless provide a substantial stimulus to the flagging US economy, which appears to be slowing.
In the meantime, some soothing words from Fed policymakers that a rate hike is a long way off is also likely putting a floor under stocks. Speaking on Wednesday, both Mester and Quarles suggested it was too early to start talking about rate hikes, easing the upward pressure on 10-year Treasury yields, which had climbed to five-month highs yesterday.
The recent surge in inflation expectations in the US and elsewhere have been boosting long-dated government bond yields. But today’s pullback in yields is likely to be short-lived as the US 5-year breakeven inflation rate has shot up to 2.9% and is showing no sign of easing.
Commodity currencies take a hit as dollar and yen climb
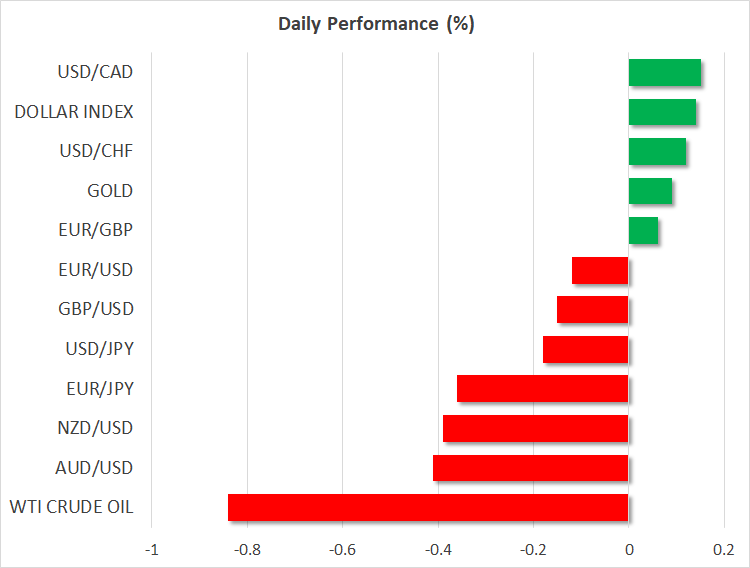
The US dollar, however, edged up on Thursday despite the softer yields, as the increased risk-off drew some safe-haven demand. The Japanese yen also benefited from safe-haven flows, pushing the dollar to below the 114-yen level.
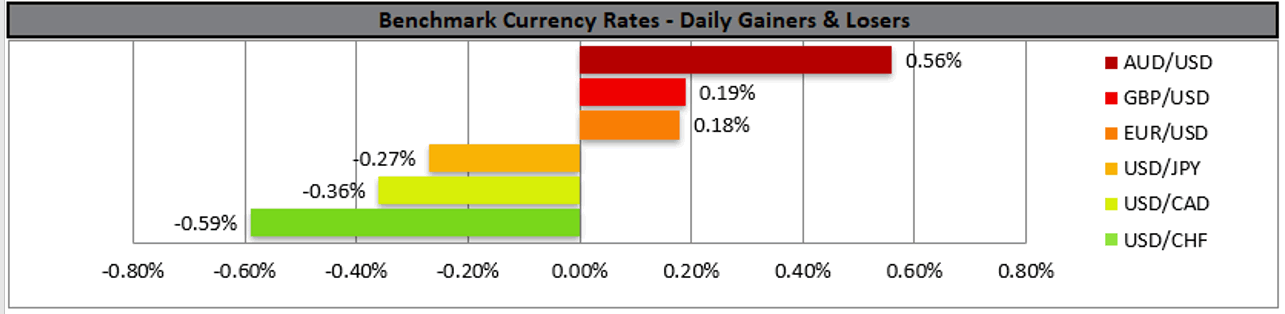
The euro and pound both slipped, but the biggest losers were the riskier commodity-linked currencies. The Australian and New Zealand dollars were each last down about 0.35% versus their US counterpart, while the Canadian dollar was off by 0.1%, finding some support from oil prices, whose losses were minor relative to their recent gains.
All three currencies had rallied to multi-month highs against the dollar this week as the market tone has improved and on rising expectations that the respective central banks would have to tighten monetary policy at a quicker-than-anticipated pace. Fed speakers and the weekly jobless claims coming up later today could determine whether the mood brightens up again.
AUDUSD’s Bullish Improvement Under Question
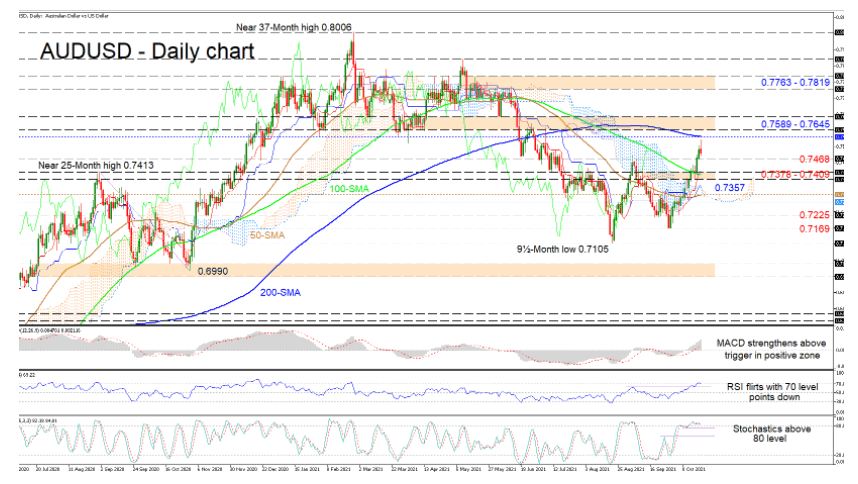
AUDUSD's three-week upside momentum seems to be fading ahead of the 200-day simple moving average (SMA). The negative bearing of the 50- and 100-day SMAs has softened, while the 200-day SMA is hovering. Overall, the SMAs are not demonstrating a definitive price trend, signalling a more neutral price trajectory.
The climbing Ichimoku lines have yet to confirm a dampening in bullish forces, while the short-term oscillators' conflicting signals are hinting some easing in positive momentum. The MACD is some distance above the zero mark and is improving over its red trigger line. However, the downward pointing RSI is struggling to push higher into overbought territory and the entangled stochastic lines are hovering just north of the 80 level, both conveying a pause in positive impetus.
If the 200-day SMA curbs the positive outlook, initial downside hindrance could commence around the 0.7468 barrier (previous resistance-now-support). If buyers' positive drive abates further, the price may retreat towards the support region of 0.7378-0.7409, where the red Tenkan-sen line also currently resides. If this border breaks down, the neighbouring blue Kijun-sen line beneath could delay the test of a support zone involving the 50-day SMA at 0.7314 and the slender shaped Ichimoku cloud until 0.7282. If selling interest persists, the price may then target the 0.7225 low and 0.7169 trough.
If buyers regroup and manage to steer the price higher, preliminary resistance could emanate from the 200-day SMA at 0.7560. Successfully extending above it, upside progress may be challenged by the nearby resistance barricade of 0.7589-0.7645, which began developing in April 2021. Should buyers pilot beyond this obstacle they could turn their focus to a region of highs, existing between the 0.7763 and 0.7819 barriers.
Summarizing, although AUDUSD is exhibiting a neutral-to-bullish tone in the short-term timeframe, it appears shaky. A jump above the 200-day SMA and past the 0.7645 obstacle could boost buyers' confidence, while a dive below 0.7169 would start to feed negative tendencies.
GBPAUD Steps On Key Trendline After Five Bearish Weeks
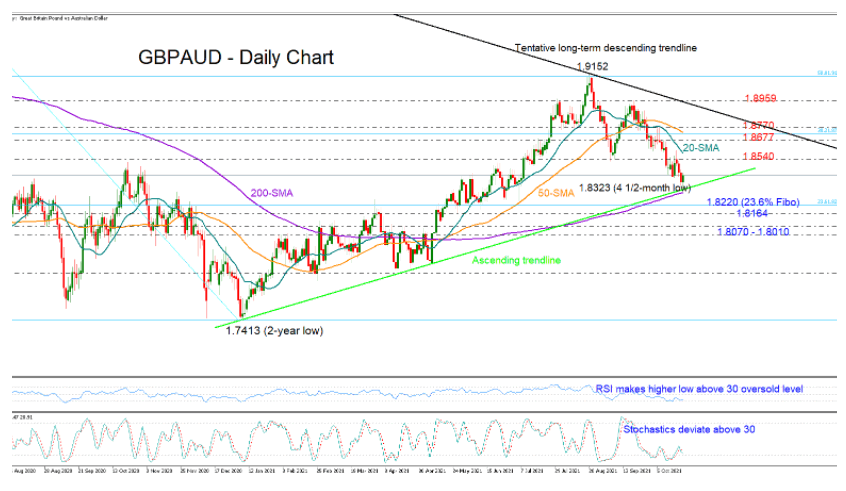
GBPAUD is in the fifth week of declines but hopes for a bullish transition are currently growing large as the price is challenging the key ascending trendline drawn from January’s lows and the 200-day simple moving average (SMA) at 1.8323.
Although the bearish intersection between the 20- and 50-day SMAs keeps promoting the negative trajectory in the short-term picture, the pair seems to have already met oversold conditions according to the momentum indicators; the RSI is charting a higher low above its 30 oversold level, while the Stochastics are also trending higher after bottoming out below 20.
Looking for resistance levels, the 1.8540 restrictive territory could apply some downside pressures to upside corrections with the help of the 20-day SMA at 1.8580. Crawling higher, the price may get congested somewhere between the 1.8677 barrier and the 50-day SMA at 1.8727, while not far above, a close on top of the swing high of 1.8770 could debunk another extension up to the tentative descending trendline stretched from the 2020 top of 2.084.
Should the supportive trendline crack, selling pressures could temper towards the 1.8220 – 1.8165 region. The pair has been frequently testing that territory over the past two years, and the 23.6% Fibonacci retracement of the 2020 – 2021 downtrend is also in the neighborhood. Therefore, any close lower from here could step up bearish actions likely towards the 1.8070 – 1.8010 zone.
In brief, GBPAUD has the potential for an upside reversal near a crucial supportive trendline. Failure to bounce on that line could add more legs to the ongoing sell-off.
Earnings Season Keeps On Earning
USD weakens while US stockmarkets send mixed signals
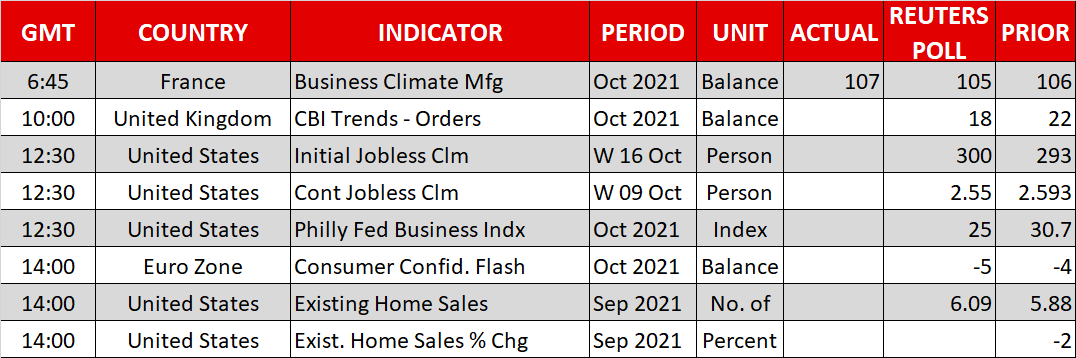
The USD continued to weaken yesterday against a number of its counterparts experiencing possibly some safe haven outflows as the market sentiment seems to remain positive and as US stockmarkets tended to gain with the exception of Nasdaq which retreated somewhat. It should be noted that US stockmarkets seem to be boosted by better-than-expected earnings reports that are released and today we note Intel’s (#INTC), AT&T’s (#T), PayPal’s (#PYPL) and Unilever’s earnings reports for Q3 among others. On the other hand, gold’s price tended to gain on the back of a soft USD, given also that US yields remained rather stable. Today we note the release of the weekly initial jobless claims figure which is expected to correct a bit higher after last week’s wide drop and we also note the release of the US existing home sales for September a bit later.
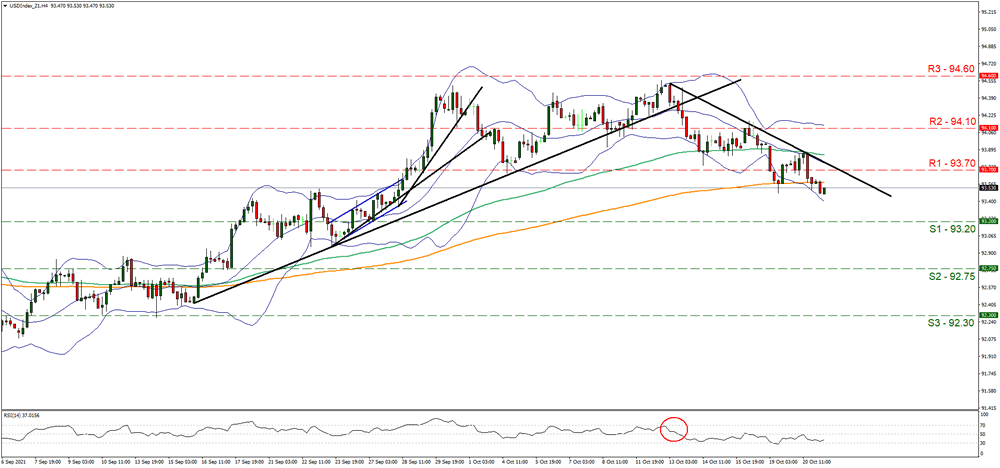
USD Index continued to drop yesterday clearly breaking the 93.70 (R1) support line, now turned to resistance. We maintain a bearish outlook for the index as long as it remains below the downward trendline incepted since the 13th of the month. The RSI indicator below our 4-hour chart is currently below the reading of 50 implying a slight advantage for the bears. Should the selling interest be continued we may see the index breaking the 93.20 (S1) support line and take aim for the 92.75 (S2) level. Should USD be in high demand the Index could reverse direction, break the prementioned downward trendline the 93.70 (R1) resistance line and aim for the 94.10 (R2) level.
Commodity currencies on the rise
Currencies such as the AUD and CAD continued to be on the rise, strengthening against the USD supported by high commodity prices and a positive market mood. It should be noted that the CAD gained as oil prices continued to rise, stoked by expectations for stronger demand and a surprise drawdown reported yesterday by EIA regarding last week’s US oil inventory levels. AUD on the other hand seems supported by high commodity prices while some analysts tend to note that the market may expect earlier rate hikes by RBA, hence we expect RBA governor Lowe’s speech today to gain on attention and could affect AUD’s direction. Should the positive market sentiment continue to characterize the markets we may see commodity currencies gaining further.
AUD/USD continued to rise yet corrected lower after reaching a three and a half month high by testing the 0.7540 (R1) resistance line. We tend to maintain a bullish outlook for the pair as long as it remains above the upward trendline steepened since the 18th of October. Please note that the RSI indicator below our 4-hour chart has surpassed the reading of 70, which may imply that the pair is overbought and could correct lower. Should the bulls maintain control over the pair we may see AUD/USD breaking the 0.7540 (R1) line thus paving the way for the 0.7600 (R2) level. Should a correction lower be performed by the pair we may see it breaking the prementioned upward trendline, the 0.7475 (S1) support line and aim for the 0.7420 (S2) level.
Today’s events and expectations
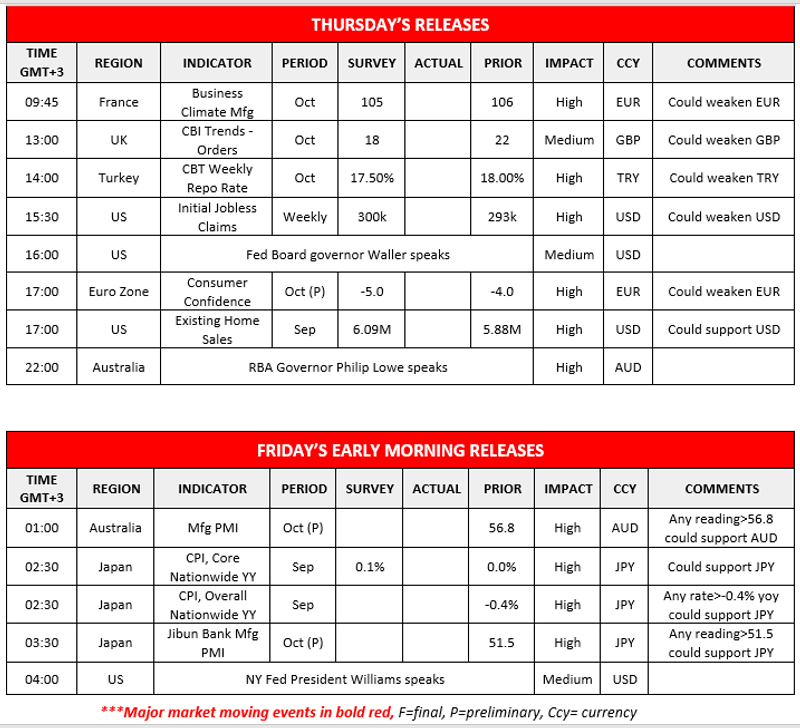
Today in the European session we get from France October’s business climate indicator as well as UK’s CBI Trends for industrial orders , for the month of October as well while later on we get from Turkey CBRT’s interest rate decision. In the American session we note the release of the weekly initial jobless claims figure, the US existing home sales for September as well as the preliminary consumer confidence for October. On the monetary front we note the speeches of Fed Board Governor Waller, and RBA Governor Philip Lowe, while during tomorrow’s Asian session NY Fed President Williams speaking. Also during tomorrow’s Asian session, we get Japan’s inflation data for September as well as the preliminary PMI figures for October from Japan and Australia.
USD Index H4 Chart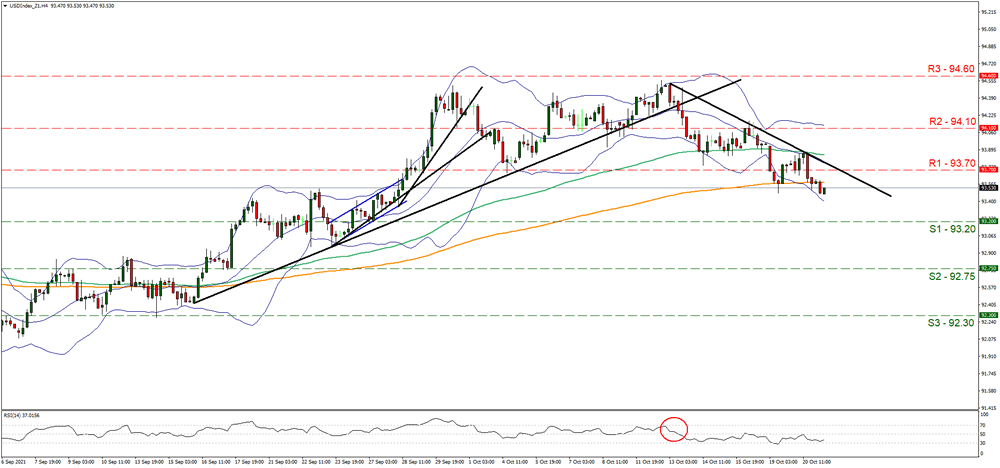
Support: 93.20 (S1), 92.75 (S2), 92.30 (S3)
Resistance: 93.70 (R1), 94.10 (R2), 94.60 (R3)
AUD/USD H4 Chart
 Support: 0.7475 (S1), 0.7420 (S2), 0.7345 (S3)
Resistance: 0.7540 (R1), 0.7600 (R2), 0.7675 (R3)
Earnings Season Keeps On Earning
The Fed taper trade has been well and truly kicked to the sidelines for now. Earnings are dominating the headlines and market sentiment, even as bond yields, energy prices, commodities and rate hike expectations around the world continue to creep higher. It is with good reason though, Q3 earnings for the most part in both the US and over in Europe have been very positive. Notably, from my perspective, FMCG giants such as P&G have been able to hike prices to offset rising input costs, something I thought that sector would find very challenging. Tesla delivered overnight as well, showing strong growth in net profit, revenue, and deliveries. Shares eased slightly though in a classic buy-the-rumour, sell-the-fact move. I still struggle with the concept of buying an EV in countries such as China, Singapore, and Indonesia for example, where most of their electricity is generated from fossil fuels. And readers should look up the costs of replacing a tree-hugger friendly battery pack on an older Tesla that is out of factory warranty, it is interesting reading. They do look cool though and have a high “wokeness” index.
Bitcoin climbs to record high
Bitcoin had another emperor’s new clothes rally overnight, tracing out new all-time highs around USD 67,000.00 of tax-payer backed fiat US dollars before some long-covering saw it retreat back to USD 64.600.00 in Asia. The crypto-vangellists, after being in hiding for a while, are out in full cry once again. Out trots “mainstream acceptance” thanks to a couple of Bitcoin futures-backed ETF launches this week. Initial impressions are that they are just another playground for speculative day traders without the aggravations of setting up a crypto-account and a wallet to buy the digital-physical. The “inflation hedge” is circulating as well, which begs the question, why are equities where they are then, surely interest rates must rise? Buying US dollar or a commodity currency is probably the easiest inflation hedge out there. I will fall off my chair if one of the “institutional” experts starts mentioning the future potential of blockchain and bitcoin in the same sentence; it’s original raison d’etre I thought.
It will be interesting to see how the digital Dutch tulip space copes with the unwinding of QE globally in 2022, as well as rate hikes, potential regulatory threats and a group of world central banks who aren’t going to sit by and let cryptos take away their monetary policy lunch. And don’t get me started on (un)stable coins and their supposed, but surprisingly opaque to public scrutiny, dollar for every coin backing.
Still, I won’t stand in front of the price action, which is as powerful as the argument of bitcoin as a store of wealth because it has a finite supply is not. Cryptos are a tradeable, if not investable asset class for now, and the technical picture remains very bullish. The price action and momentum as everyone tries to get rich quick, I mean invest in the future of money, should be respected. Only a fall through USD 59,000.00 changes the positive outlook and I continue to target further gains to USD 80,000.00 of US fiat currency.
Elsewhere, Evergrande and Evergrande Property Services shares have started trading once again in Hong Kong after an attempt to sell the latter by the former fell through. The market has voted with both tumbling by around 10.0% this morning. Evergrande’s 30-day grace period on a missed foreign currency coupon payment expires this Saturday, and could trigger a cross-default on other debt instruments. Following other Chinese developers’ recent defaults, the Evergrande story and the leverage in China’s property development sector could make an overdue return to the front pages this weekend and see markets up for a shaky start on Monday. Comments from Evergrande itself on its financial position, and a 97.0% slump in sales won’t inspire confidence.
An accelerating deterioration in that situation next week could give China’s policymakers a conundrum. Their silence on the issue, apart from some throwaway comments from the PBOC, has been deafening and has frazzled nerves among investors. The important China Communist Party Central Committee meeting occurs from the 8th to the 11th of November and if past form is something to go by, China’s leaders won’t want any economic boat-rocking ahead of it. I expect China’s “national team” to be on the bid in mainland equity markets at the first sign of trouble, and the PBOC will make sure liquidity is added if needed, and the yuan remains in Zen-like stability. The government may choose to let Evergrande run if course while supporting markets elsewhere, we shall see.
Asia’s data calendar is, once, again, bereft today. South Korea PPI unexpectedly slipped to 0.20% MoM in September from 0.50% in August. I suspect that it is only a temporary aberration, and more upside pain lies ahead. In that spirit, a few hours earlier, the US 20-year bond auction has a weaker bid-to-cover ratio and saw the 10 and 30-year yields moving higher once again. For once, the US dollar did not find support from that, drowned out as it is, in the noise of earnings season, interest rates expectations elsewhere and commodity currency outperformance.
Europe’s calendar is similarly dull with US Initial Jobless Claims, a series of Philly Fed indexes and Existing Home Sales the highlights. The US 5-year TIPS auction will make intriguing viewing, but all of this will be swamped with an avalanche of Q3 earnings reports this evening. It is quite a cross-sector group announcing today, and if they follow the pattern thus far, the music will continue playing. Great bottom lines and no concerns clouding the 2022 outlook equals buy everything
Daily Technical Analysis
EUR/USD
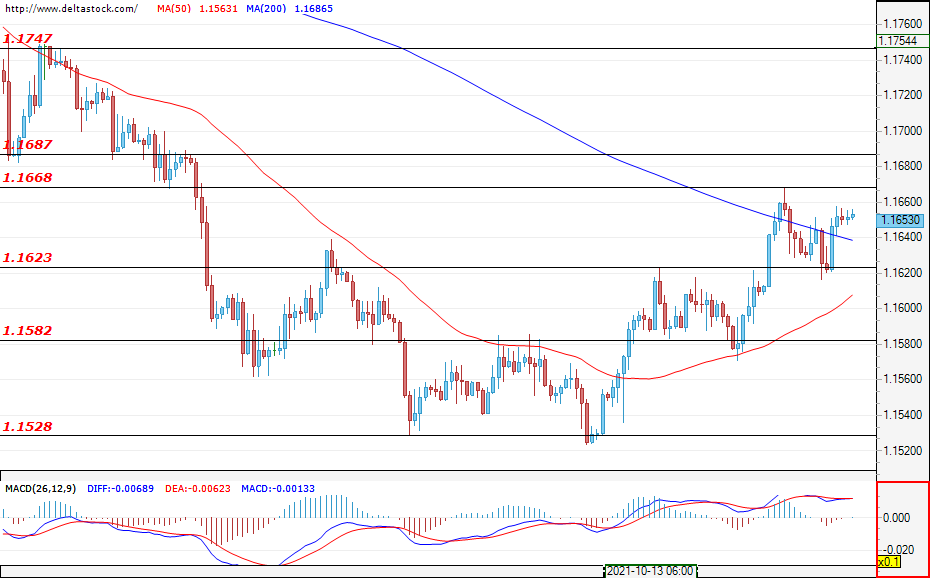
Current level - 1.1653
The attempt to breach the support of 1.1623 was not successful and, at the time of writing this analysis, the currency pair is preparing to test the resistance zone between 1.1668 and 1.1687. A violation of the mentioned zone will pave the way towards the next goal of 1.1750, a breach of which would strengthen the positive expectations for the future path of the EUR/USD. On the downside, bears could attack the support level of 1.1623 and, if successful, could easily deepen the drop towards the level of 1.1582. A spike in volatility is likely during the announcement of the economic data for the initial jobless claims for the U.S. (today; 12:30 EEST).
| Resistance | Support | ||
| intraday | intraweek | intraday | intraweek |
| 1.1668 | 1.1750 | 1.1623 | 1.1410 |
| 1.1687 | 1.1800 | 1.1582 | 1.1280 |
USD/JPY
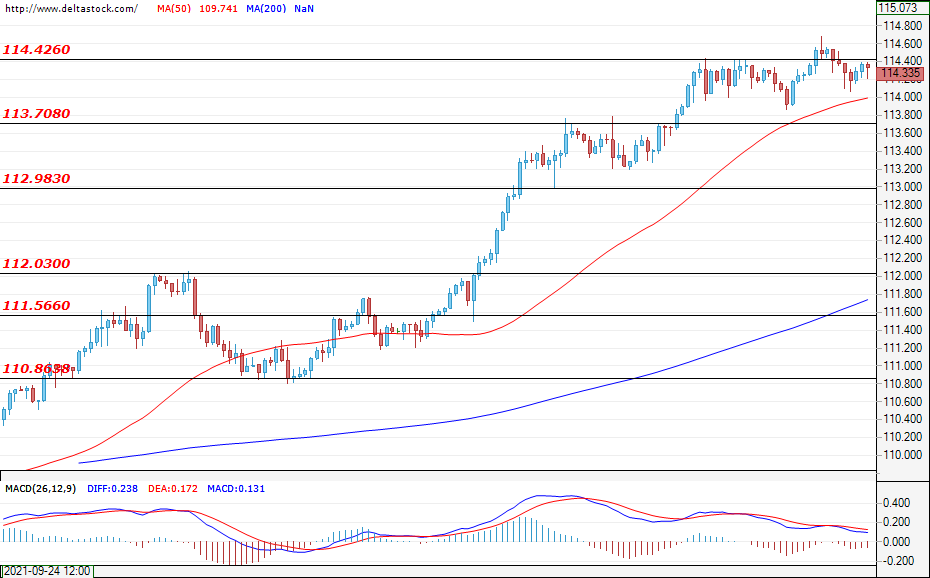
Current level - 114.33
The uptrend here is strong and any corrective movements are being reduced to consolidations in the price movement. The pair managed to breach the resistance of 114.42 and it seems that the bulls are preparing for their next assault, with their goal possibly being 115.50. As long as the momentum of the trend is maintained, prices may even reach 118.60. The first support for the buyers is 114.42, followed by the already confirmed one at 113.70.
| Resistance | Support | ||
| intraday | intraweek | intraday | intraweek |
| 114.42 | 117.90 | 113.70 | 112.00 |
| 115.50 | 118.60 | 113.00 | 111.56 |
GBP/USD
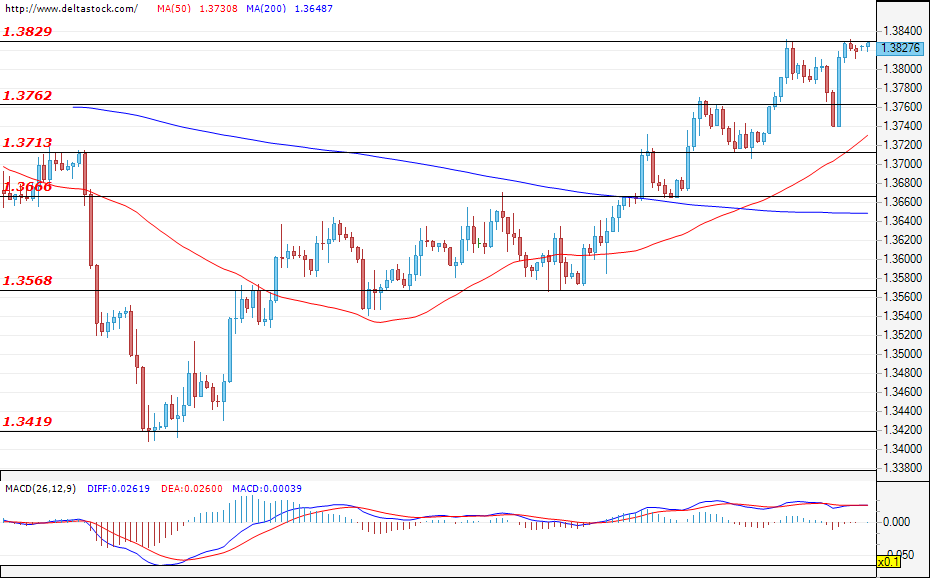
Current level - 1.3827
The support zone of 1.3762 withstood the bearish attack during yesterday’s trading session and the bulls quickly established themselves on the market. During the early hours of today`s trading, the currency pair is re-testing the resistance level of 1.3829 and a successful breach here could easily continue the rally and lead to new gains for the pound against the dollar. In the opposite direction, a violation of the mentioned level of 1.3762 could lead to a deeper correction towards the support of 1.3713.
| Resistance | Support | ||
| intraday | intraweek | intraday | intraweek |
| 1.3830 | 1.3900 | 1.3762 | 1.3666 |
| 1.3900 | 1.4000 | 1.3713 | 1.3570 |