Sample Category Title
What’s Next as Stagflation Risks Torment Markets?
The global economy is fighting a battle on multiple fronts. From paralyzed supply chains to an energy crisis that threatens Europe and Asia to a painful deleveraging in the Chinese real estate sector, there is a clear risk that growth slows down but inflation stays hot. This could spell some more trouble for stock markets as corporate profit margins get squeezed, while the winner might be the US dollar, which is shielded from the power crunch thanks to America’s energy independence.
Supply chains crumble
Stories about supply chains in chaos have been around since the pandemic started, but the market didn’t care much. The assumption was that lockdowns were to blame, so this problem would sort itself out as companies adapted to the new environment. It didn’t.
Transportation costs have gone absolutely crazy. The price of shipping containers has risen exponentially as many ports have been operating at reduced capacity. When fewer containers are loaded on ships, international trade slows down and the price of those containers soars as companies compete to get their products shipped on time.
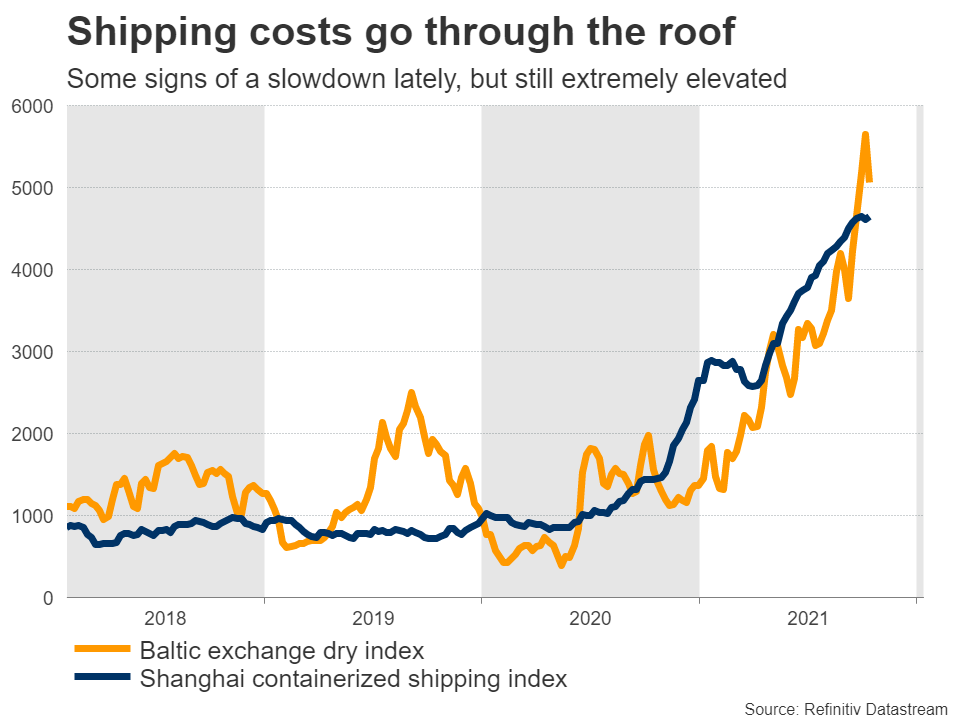
Beyond the ports, this issue has spilled over into the mainland thanks to a shortage of truck drivers. Even if ships can unload their cargo on time, those goods are often stuck as there isn’t enough manpower to transport them to warehouses quickly, many of which are packed full already. It’s a logistical mess at every step of the supply chain, overloaded with a massive backlog of shipments and labor shortages.
Energy pandemonium
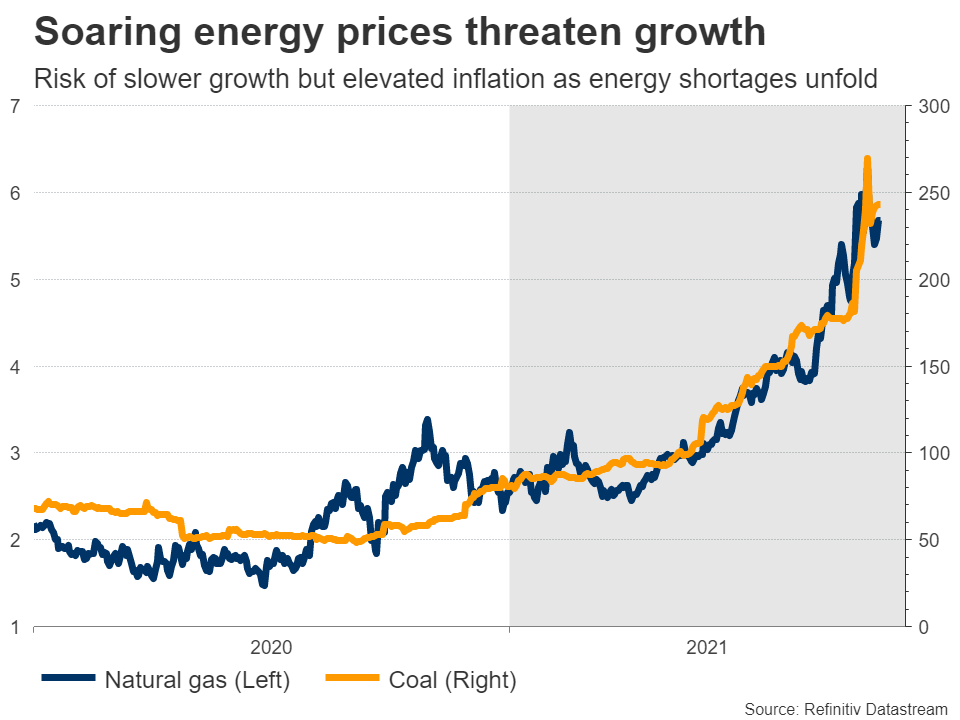
Enter the energy crisis. Natural gas and coal prices have gone through the stratosphere in Europe and China, threatening to hammer economic growth as consumers are faced with higher electricity and heating bills, while companies struggle with rising production costs.
How did we end up in this mess? There’s a long list of reasons, from chronic underinvestment in fossil fuels, to stricter emissions regulations, to transportation bottlenecks and depleted inventories, and even the wind not blowing enough this year to power wind farms. In Europe, many blame Russia for not releasing more natural gas to ease the shortage, whereas in China, a ban on coal imports from Australia last year certainly didn’t help.
Funnily enough, the winner from all this is Vladimir Putin, who now gets to decide whether Europe will freeze during the winter. Fortunately, he has already promised to release more natural gas to help the situation. The question is what will he demand back for this assistance.
The only major economy that could escape with minor injuries is America, thanks to its self-sufficiency on energy. It will still feel some pain from spillover effects, but the damage will likely be much greater in Europe and Asia.
China’s hangover
Everyone has heard of Evergrande, China’s overleveraged property developer that is headed for bankruptcy. Markets initially panicked about the risk of a domino effect of serial defaults that infected the nation’s banking system. But once it became clear the government would ringfence the company to avoid any spillovers, investors moved on.
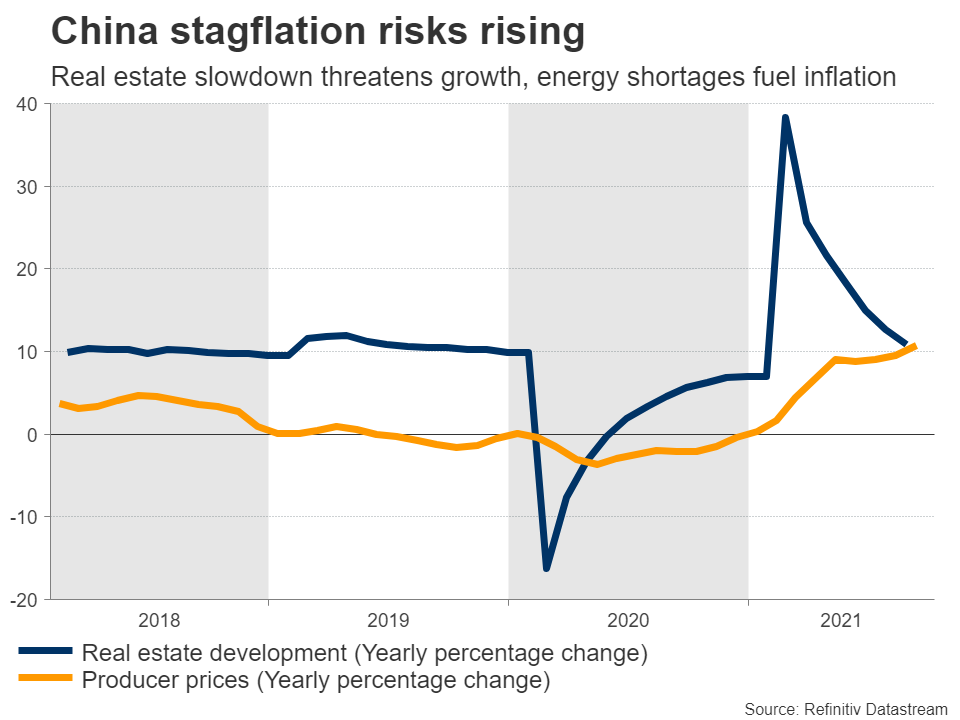
While there is still risk of a credit event as more property developers have missed debt payments lately, Chinese authorities will likely keep any fallout isolated. Instead, the real risk is what happens to the real estate market. This sector is huge at nearly 30% of GDP and it relied on debt-fueled growth for several years. Now that the government has tightened leverage rules for real estate developers, that recipe is dead.
In other words, China’s property sector will likely experience a massive hangover as growth slows and companies clean up their balance sheets. This could impact demand for metals and other building-related commodities, for which China is the biggest global consumer.
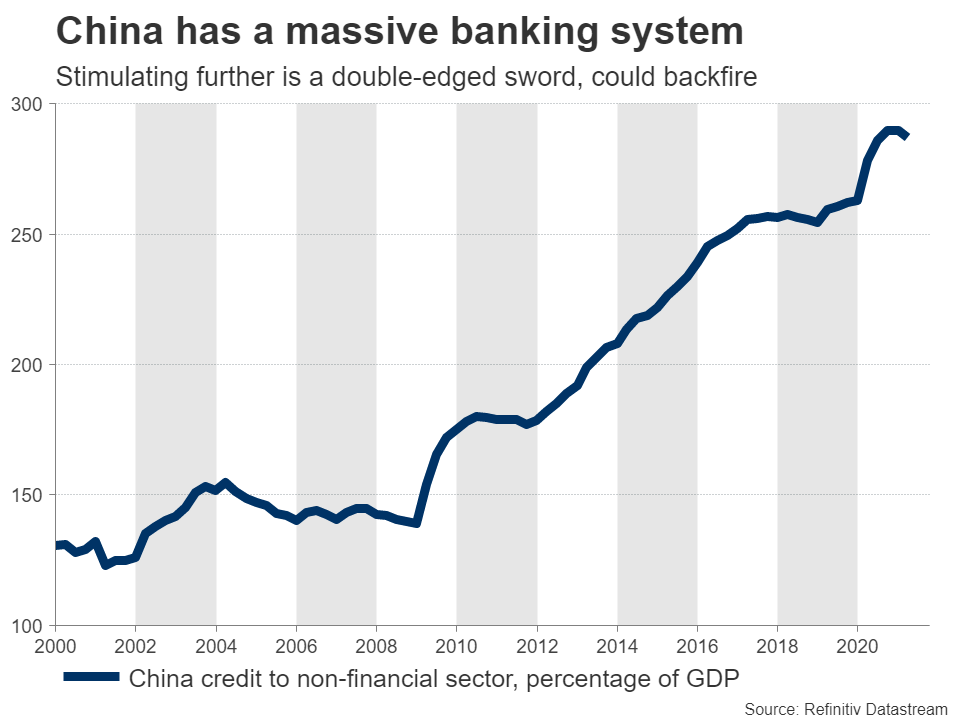
And with one of the main growth engines stalling, this could slow the overall economy. In the past, Chinese authorities resorted to powerful stimulus to revive growth, but they can't really play that card again as the banking sector is absolutely massive already. Encouraging even more lending could backfire by making the whole system more vulnerable to future shocks.
Stocks at risk
So what does all this mean for global markets? Let’s start with stocks. We seem to be entering a period of slower economic growth but elevated inflation. Persistent supply disruptions coupled with skyrocketing energy prices is a really toxic combination.
It implies that companies are unable to cover demand, which chokes growth, but their costs are rising at the same time. This ultimately squeezes profit margins. It also hurts consumers who absorb some of these higher costs and energy bills, taking a bite out of real incomes.
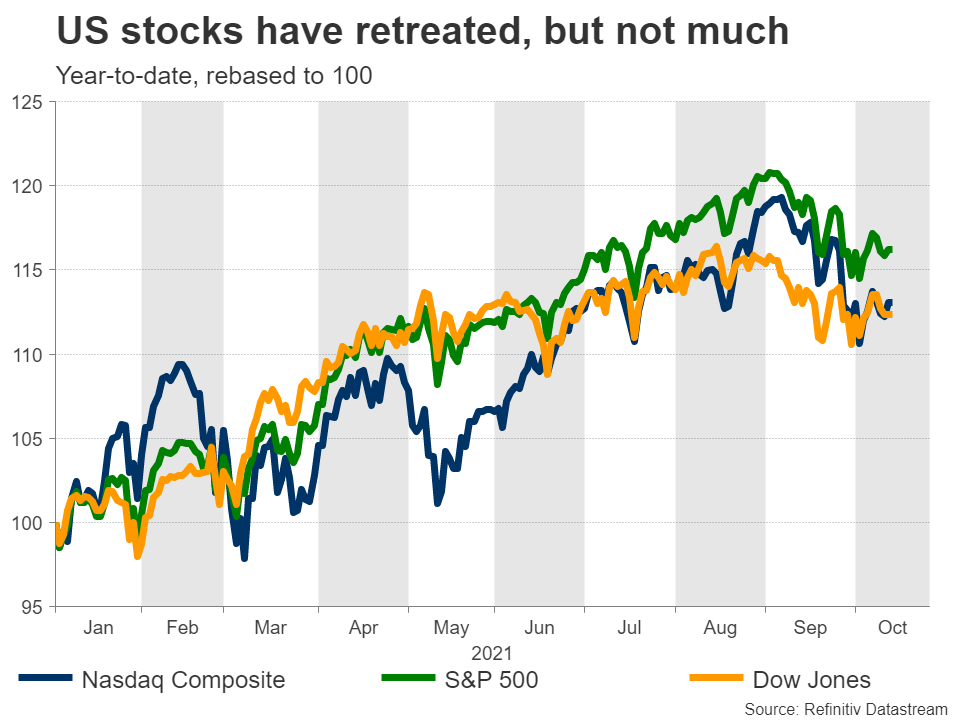
With China also slowing down and the prospect of higher corporate and capital gains taxes in America, it seems like a recipe for a correction. Stocks have been struggling for weeks now, but with the S&P 500 just 3.5% away from its record highs, there’s probably scope for a deeper retracement.
King dollar
In the forex arena, the winner might be the US dollar. The American economy is shielded from the energy crisis and more spending is coming from Congress to juice up growth. This ultimately allows the Fed to raise interest rates to fight inflation, a luxury neither the European Central Bank nor the Bank of Japan can afford given their fragile economies.
In an environment of slowing growth in Europe and Asia, the dollar offers both brighter economic prospects and protection against bad outcomes given its reserve currency status.
On the other hand, the euro, the yen, and the Australian dollar are most at risk. For the euro, it’s pretty obvious why. The euro area is caught in the eye of the energy hurricane, which threatens to undermine an already-weak recovery.
Meanwhile, the Australian dollar is heavily exposed to China. For decades, Australia’s economic model has been exporting raw materials to China, so if Chinese growth slows as the property sector rebalances, so will the demand for Australian exports.
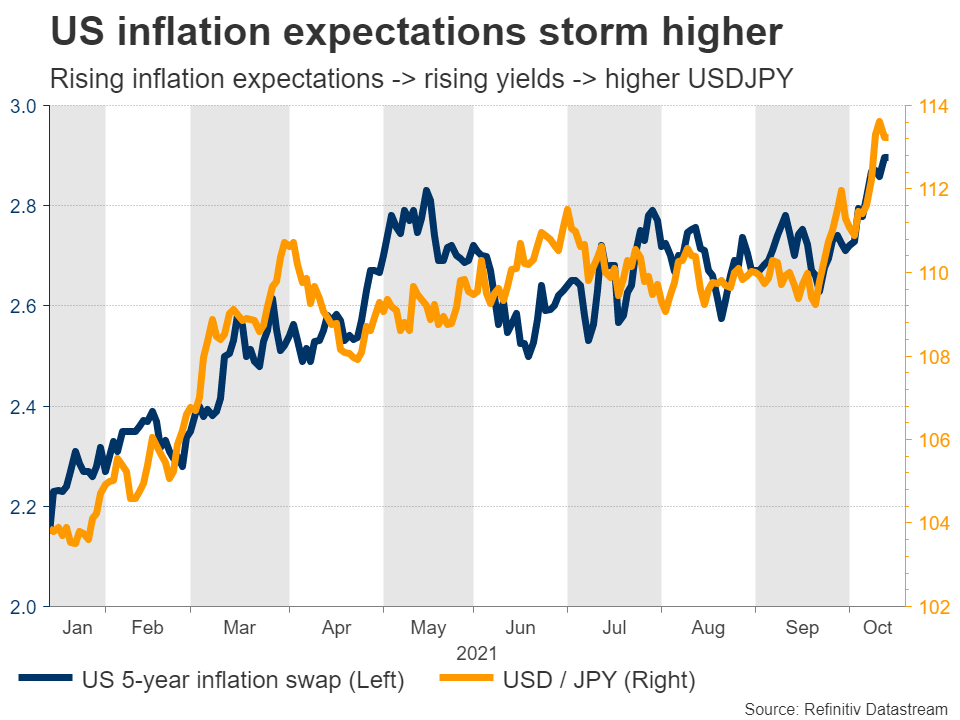
As for the yen, it boils down to interest rate differentials. If inflation remains elevated globally, that argues for foreign bond yields to climb even higher. However, the Bank of Japan essentially keeps a ceiling on Japanese yields, so they cannot really participate in any global rally, making the yen less attractive. Japan’s heavy reliance on energy imports is another risk.
Big picture
Having said everything, this isn’t a catastrophe either. Growth might slow but that’s unlikely to lead to another recession. Supply chains will ultimately correct, even if it takes a while longer. We are essentially facing a period of a few months or even a year where supply and energy problems keep markets guessing.
In fact, there are some upside risks too. For instance, a big stimulus push in China could allay some concerns about a global slowdown, even if it amplifies longer-term financial stability risks. Markets usually focus on the short term.
Even better, once there are signs that supply chains are finally improving or that enough energy production is coming back online to cool prices, a powerful relief rally could follow in every asset that got beaten up. The world isn’t ending, but there could be some more turbulence ahead.
EUR/USD Pair Is Now Attempting A Recovery From The 1.1524 Low
The Euro started a fresh decline from well above 1.1600 against the US Dollar. The EUR/USD pair traded below the 1.1560 and 1.1550 support levels.
A low was formed near 1.1524 and the pair is now attempting a recovery. It broke the 1.1550 level, but it is still well below the 50 hourly simple moving average. There was a break above a key bearish trend line with resistance near 1.1555 on the hourly chart.
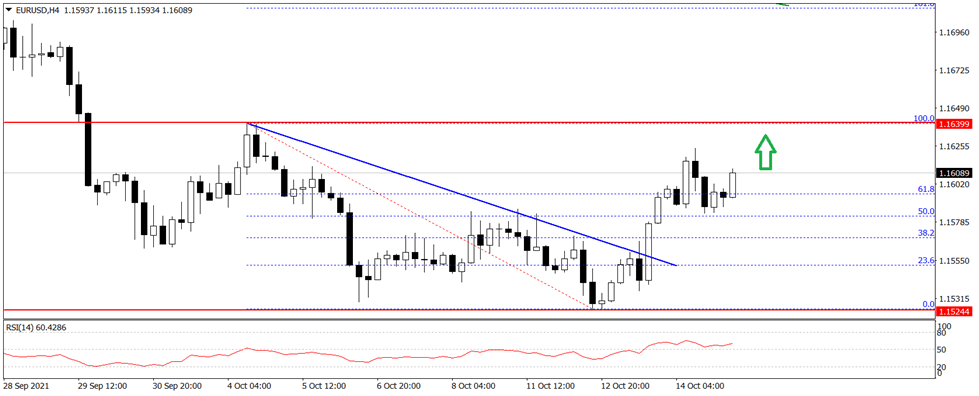
An immediate resistance is near the 1.1610 level. A break above the 1.1610 and 1.162 resistance levels could lead the pair towards the 1.1650 zone.
On the downside, an initial support is near the 1.1580 level. The key support is near 1.1550 on FXOpen, below which there is a risk of a larger decline. The next major support is near the 1.1500 level.
Unwinding Of Safe Haven Flows Dominates Sentiment
Notes/Observations
- Unwinding of safe-haven assets occurs in session (equities and bond yields higher while USD and Yen retreat) as stagflation fears eased coupled by better corporate earnings.
Asia
- China said to ease banks mortgage limits through end of 2021. Regulators told some banks to accelerate loan approvals and renewals of RMBS applications (Note: Move seen as way to offset contagion concerns over Evergrande).
- China PBoC conducted CNY500B in 1-year Medium Term Lending Facility (MLF) at 2.95% (rate unchanged from prior operation; China rolls over maturing medium-term loans).
- BOJ said to be considering cutting CPI and GDP forecasts for FY21/22, to consider raising GDP Forecast for FY22-23 (Note: To be updated after BOJ rate decision on Oct 28th).
Europe
- Leading EU member States said to be pressing Brussels to put together retaliatory measures should the UK suspend trading arrangements for Northern Ireland.
- UK govt spokesperson stated that there was still a substantial gap between EU and UK current Brexit positions; Brexit Min Frost to meet EU's Sefcovic in Brussels on Friday, Oct 15th (today).
- European leaders could approve emergency measures by member states to blunt impact of the energy crisis on the most affected consumers and companies at next week's meeting (week of Oct 18th).
- Spain PM Sanchez: The idea of centralized European purchases of gas was gaining ground in Brussels. The current inflation trend was dangerous.
Americas
- President Biden signed bill related to short-term US debt limit increase (as expected).
- Fed’s Harker (non-voter) reiterated that did not expect rate hikes until late 2022, early 2023; It was soon time to slowly taper asset purchases; Expected GDP growth around 5.5% in 2021.
- Bank of Canada (BOC) Gov Macklem stated that slack remained in the domestic labor market; supply chain disruptions likely to be more persistent than expected.
Speakers/Fixed income/FX/Commodities/Erratum
Equities
- Indices [Stoxx600 +0.32% at 467.42, FTSE +0.20% at 7,222.20, DAX +0.20% at 15,493.90, CAC-40 +0.37% at 6,709.85, IBEX-35 +0.43% at 8,963.50, FTSE MIB +0.55% at 26,422.00, SMI +0.31% at 11,929.60, S&P 500 Futures +0.26%].
- Market Focal Points/Key Themes: European indices openned higher across the board and generally stayed in the green as the session progresed; sectors leading to the upside include financials and consumer discretionary; while more sluggish sectors include real estate and healthcare; Telefonica divests its El Salvador unit; Pearson to sell it’s texbook publishing unit; earnings expected during the upcoming US session include PNC Financial Services and Goldman Sachs.
Equities
- Consumer discretionary: Hugo Boss [BOSS.DE] +2% (sales), Pearson [PSON.UK] -4% (trading update).
- Energy: Subsea 7 [SUBC.NO] +3% (confirms major contract).
- Technology: Devoteam [DBT.FR] +22% (receives increased offer).
- Materials: Rio Tinto [RIO.UK] -2% (production; outlook cut).
Speakers
- ECB's Wunsch (Belgium) reiterated Council view that inflation spike was temporary in nature; some uncertainty over 2nd round effects. ECB was not at its inflation target yet. Regional economy moving in the right direction.
- BOJ Dep Gov Amamiya reiterated overall assessment that domestic economy was recovering as a trend. Recovery should become clearer as pandemic effects faded with consumption picking up due to pent-up demand . Domestic price trend remained solid.
- China President Xi stated that govt to coordinate development of property sector with economy. To also speed up reforms in monopoly industries.
- China's PBOC listed 19 Chinese banks as systematically important banks.
Currencies/Fixed Income
- USD was ending the week on a softer note after 6 weeks of gains. The safe-haven aspect of the greenback ebbed as an improved market sentiment has helped to lift global stocks, commodity prices and bond yields.
- The JPY currency (yen) bucked the trend and weakened to fresh 3-year lows against the USD with unwinding of safe-haven flows cited as a factor.
Economic data
- (FI) Finland Aug GDP Indicator Y/Y: 4.6 v 5.3% prior.
- (EU) EU27 Sept New Car Registrations: -23.1 v -19.1% prior.
- (DK) Denmark Sept PPI M/M: 5.1% v 1.7% prior; Y/Y: 19.0% v 12.8% prior.
- (NO) Norway Sept Trade Balance (NOK): 53.7B v 42.0B prior.
- (FR) France Sept Final CPI M/M: -0.2% v -0.2% prelim; Y/Y: 2.2% v 2.1% prelim; CPI (ex-tobacco Index): 105.97 v 105.95e.
- (FR) France Sept Final CPI EU Harmonized M/M: -0.2% v -0.2% prelim; Y/Y: 2.7% v 2.7% prelim.
- (TR) Turkey Central Bank Oct TCMB Expected Inflation Survey: Next 12-Month Outlook: 13.9% v 12.9% prior.
- (CN) Weekly Shanghai copper inventories (SHFE): 41.7K v 50.1K tons prior.
- (IT) Italy Sept Final CPI M/M: -0.2% v -0.1% prelim; Y/Y: 2.5% v 2.6% prelim; CPI Index (ex-tobacco): 104.5 v 104.7 prior.
- (IT) Italy Sept Final CPI EU Harmonized M/M: 1.3% v 1.4% prelim; Y/Y: 2.9% v 3.0%e.
- (RU) Russia Narrow Money Supply w/e Oct 8th (RUB): 14.39T v 14.34T prior.
- (PL) Poland Sept Final CPI M/M: 0.7% v 0.6% prelim; Y/Y: 5.9% v 5.8% prelim.
- (TR) Turkey Sept Central Gov't Budget Balance (TRY): -23.6B v 40.8B prior.
- (IT) Italy Aug General Government Debt: €2.734T v €2.726T prior.
- (EU) Euro Zone Aug Trade Balance (seasonally adj): €11.1B v €14.2Be; Trade Balance NSA (unadj): €4.8B v €20.7B prior.
- (IT) Italy Aug Total Trade Balance: €1.3B v €8.8B prior; Trade Balance EU: -€0.3B v +€1.9B prior.
Fixed income Issuance
- None seen.
Looking Ahead
- (NG) Nigeria Sept CPI Y/Y: 16.5%e v 17.0% prior.
- 05:25 (EU) Daily ECB Liquidity Stats.
- 05:30 (ZA) South Africa to sell combined ZAR1.2B in I/L 2025, 2033 and 2046 Bonds.
- 06:00 (IE) Ireland Aug Trade Balance: No est v €5.1B prior.
- 06:00 (UK) DMO to sell £2.0B in 1-month, 3-month and 6-month bills (£0.5B, £0.5B and £1.0B respectively).
- 06:45 (US) Daily Libor Fixing.
- 07:00 (IL) Israel Sept CPI M/M: 0.2%e v 0.3% prior; Y/Y: 2.5%e v 2.2% prior.
- 07:00 (BR) Brazil Oct FGV Inflation IGP-10 M/M: -0.4%e v -0.4% prior.
- 07:30 (IN) India Weekly Forex Reserve w/e Oct 8th: No est v $637.5B prior.
- 08:00 (BR) Brazil Aug Economic Activity Index (Monthly GDP) M/M: -0.1%e v +0.6% prior;, Y/Y: 4.9%e v 5.5% prior.
- 08:00 (UK) Daily Baltic Dry Bulk Index.
- 08:00 (ES) Spain Debt Agency (Tesoro) announces upcoming upcoming bond issuance.
- 08:30 (US) Oct Empire Manufacturing: 25.0e v 34.3 prior.
- 08:30 (US) Sept Advance Retail Sales M/M: -0.2%e v +0.7% prior; Retail Sales (ex-auto) M/M: 0.5%e v 1.8% prior; Retail Sales (ex-auto/gas): 0.4%e v 2.0% prior; Retail Sales (Control Group): 0.5%e v 2.5% prior.
- 08:30 (US) Sept Import Price Index M/M: +0.6%e v -0.3% prior; Y/Y: 9.4%e v 9.0% prior; Import Price Index (ex-petroleum) M/M: +0.2%e v -0.1% prior.
- 08:30 (US) Sept Export Price Index M/M: 0.7%e v 0.4% prior; Y/Y: No est v 16.8% prior.
- 08:30 (CA) Canada Aug Wholesale Trade Sales M/M: +0.5%e v -2.1% prior.
- 08:30 (US) Weekly USDA Net Export Sales.
- 09:00 (CA) Canada Sept Existing Home Sales M/M: No est v -0.5% prior.
- 10:00 (US) Oct Preliminary University of Michigan Confidence: 73.1e v 72.8 prior.
- 10:00 (US) Aug Business Inventories: 0.6%e v 0.5% prior.
- 11:00 (CO) Colombia Aug Manufacturing Production Y/Y: 18.5%e v 20.1% prior.
- 11:00 (PE) Peru Sept Unemployment Rate: No est v 9.5% prior.
- 11:00 (CO) Colombia Aug Retail Sales Y/Y: 26.4%e v 26.9% prior.
- 11:00 (CO) Colombia Aug Industrial Production Y/Y: No est v 13.5% prior.
- 11:00 (EU) Potential sovereign ratings after European close.
- 12:20 (US) Fed’s Williams participates on monetary policy panel.
- 13:00 (US) Weekly Baker Hughes Rig Count.
USD/JPY Outlook: Close Above Former High Of Nov 2018 To Signal Further Advance
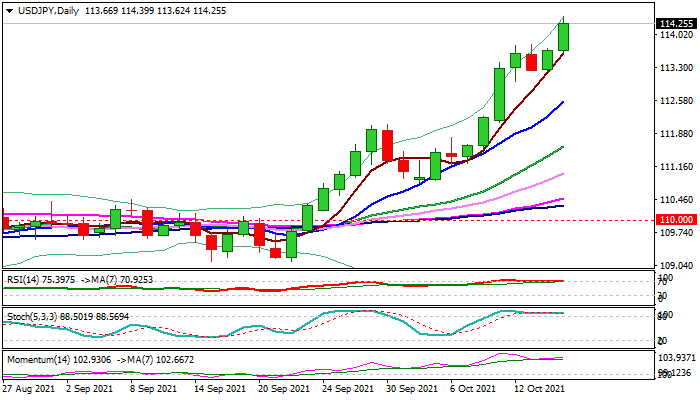
The USDJPY rose further on Friday, signaling bullish continuation after larger bulls took a breather in past three-day consolidation.
Fresh bullish acceleration broke above former high at 114.20 (Nov 2018) and hit new highest in nearly four years, pressuring pivotal Fibo barrier at 114.53 (76.4% retracement of 118.66/101.18, 2016/2020 fall).
The yen was sold on renewed risk appetite, while strong demand for USDJPY from Japanese importers additionally boosted the sentiment.
The pair is on course for the biggest weekly rally since the third week of March 2020, when the start of coronavirus pandemic strongly lifted dollar.
Bullish technical studies support the action, with firm break of 114.53 pivot to signal further advance and unmask targets at 118.60/66 (Jan 2017 / Dec 2016 highs).
Overbought conditions on daily and weekly chart warn of price adjustment in the near-term, with dips to offer better buying opportunities.
Res: 114.53, 114.73, 115.50, 116.00.
Sup: 114.00, 113.62, 113.23, 112.57.
AUD/NZD Evening Star Pattern Is Playing Out As Price Action Dominates
AUD/NZD technical analysis
- AUD/NZD has formed the valley.
- Historical sellers are aligning with now moment sellers.
- Breakout below the M H3 suggests the continuation.
- Target is at the M L3 level.
Daily chart AUD/NZD
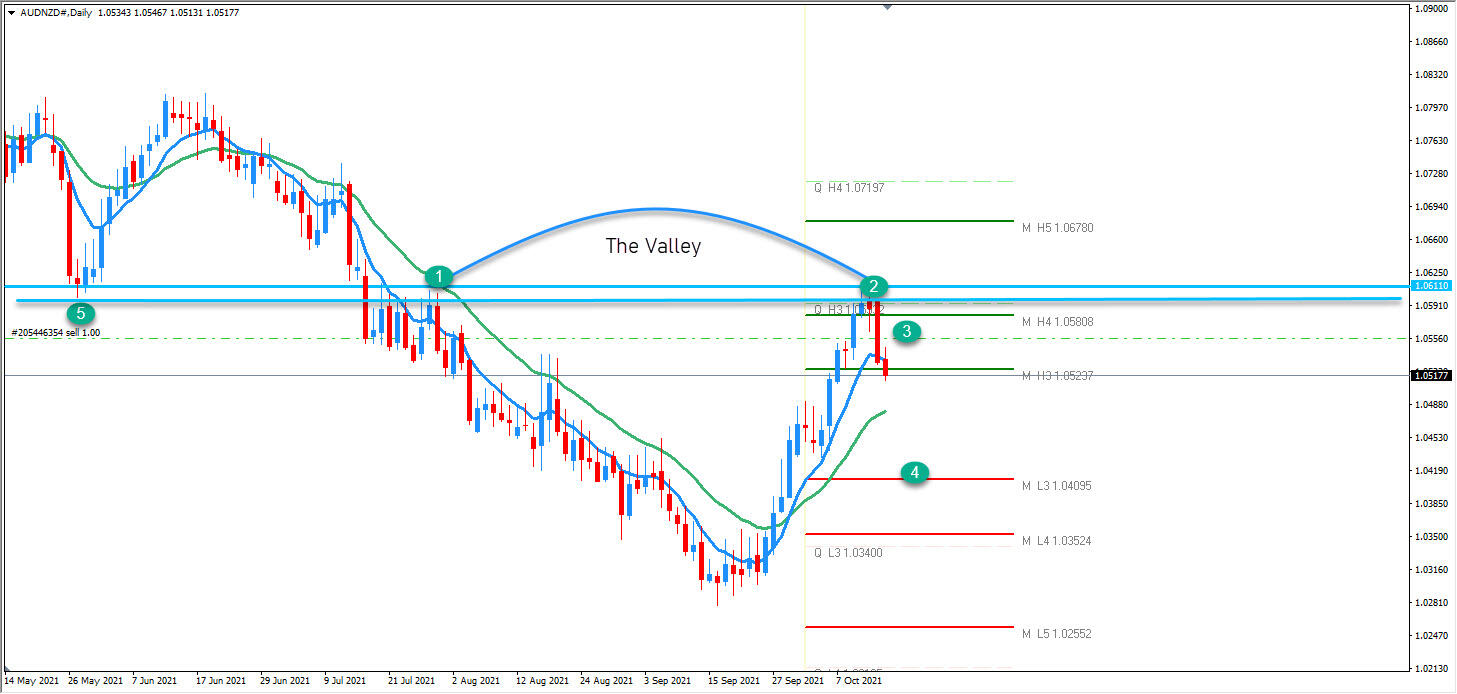
- Historical sellers.
- Now moment sellers.
- Evening Star pattern entry.
- The break below the neckline.
The valley between point 1 and 2 represents the historical selling and the first retest of the level during major downtrend. At this point we can assume that the market will make a continuation move. The entry which is clearly visible is at the confirmation of the evening star pattern. We should see 1.0480, 1.0450 and 1.0409 if the daily or weekly close is below 1.0523. The market is still bearish and this move up was a correction. Selling should continue.
Strong Corporate Reports Support Growth Of US And European Indices
The US stock market closed yesterday in the green zone. Almost all sectors of the economy showed growth yesterday, but the biggest gains were in the health care, technology and industrial sectors. At the close of the NYSE, the Dow Jones index increased by 1.56%, hitting a one-month high; S&P 500 increased by 1.71% and NASDAQ added 1.73%.
Fed spokesman Bullard said yesterday that the Fed should strive to reduce the QE program as soon as possible, as high inflation is a cause for concern.
According to Michael Schumacher of Wells Fargo Securities, inflation caused by the supply chain crisis will push bond yields higher over the next few weeks. Schumacher also sees the expectation that the Federal Reserve will respond to yields increase. He notes that several central banks, including Norway and New Zealand, have already adjusted their rates. The Fed is likely to cut purchases and announce it next month.
Amazon is buying refurbished cargo versions of 10 Airbus A330-300 planes, as well as an unspecified number of 777-300ERs. The purchase of the long-range cargo planes will allow Amazon to ship goods directly from China to the US and help avoid shipping delays.
Boeing is dealing with a new defect of its 787 Dreamliner that has caused delayed aircraft deliveries and drawn increased attention from the US government.
Chip maker TSMC announces the opening of a chip manufacturing plant in Japan. TSMC is already building its most advanced chip plant in Arizona and is considering the possibility of opening a plant in Germany.
European stock indices were also on the rise yesterday. German DAX increased by 1.4%, French CAC 40 added 1.3%, Italian FTSE MIB increased by 1.2%. The British FTSE 100 and the Spanish IBEX 35 added 0.7% and 0.8%, respectively.
British railroad operator Freightliner claimed that they are returning to diesel-powered trains as the electricity costs had become too high. Germany's economic recovery after the lifting of coronavirus restrictions has been hampered by disruptions in the supply of certain industrial goods. The country's leading economic institutions have adjusted their forecasts downward.
The G7 finance ministers have agreed to cooperate in solving global supply chain problems. Europe is starting to use up its gas reserves from underground storage facilities. The state of gas reserves in Europe's storage facilities and the inability to fill them to a safe level by the onset of the cold weather due to the global shortages is the main fear that pushes the gas prices up.
The US oil inventories increased by 6.1 million barrels within the week. The IEA raised its oil demand forecasts for 2021 and 2022 by 170,000 bpd and 210,000 bpd, respectively. Goldman Sachs, head of energy research, claims that oil prices could remain at a higher level in coming years as demand recovers while supply remains limited.
Natural gas inventories in the US increased by 81 billion cubic meters against an expected 94 billion cubic meters. The price of gas in Europe has risen again above $1200 per thousand cubic meters. The UAE Energy Minister Mazroui said yesterday that the The UAE will produce more natural gas with the possibility of its export.
The deadly typhoon Compassu was hitting Hong Kong and southern China. But Asian stock indices have risen on Friday, fueled by a rally on Wall Street driven by strong corporate earnings and the fact that China eased restrictions on mortgages at some of its biggest banks. Japan's Nikkei added 1.67%, China's CSI 300 increased by 0.35%, South Korea's Kospi added 0.92% and Australia's ASX 200 added 0.69%.
China's economy is now experiencing a downfall in many sectors: real estate, the energy crisis, weak consumer sentiment and rising commodity prices.
Main market quotes:
- S&P 500 (F) 4,438.26 +74.46 (+1.71%)
- Dow Jones 34,912.56 +534.75 (+1.56%)
- DAX 15,462.72 +213.34 (+1.40%)
- FTSE 100 7,207.71 +65.89 (+0.92%)
- USD Index 93.97 −0.06 (−0.06%)
Important events for today:
- US Retail Sales (m/m) at 15:30 (GMT+3);
- US Empire State Manufacturing Index (m/m) at 15:30 (GMT+3);
- US Michigan Consumer Sentiment (m/m) at 17:00 (GMT+3);
- US FOMC Member Williams Speech at 19:20 (GMT+3).
The Analytical Overview Of The Main Currency Pairs
The EUR/USD currency pair
Technical indicators of the currency pair:
Prev Open: 1.1587
Prev Close: 1.1597
% chg. over the last day: +0.08%
German economic institutions believe the German economy will reach normal industrial capacity by 2022. The German economy is expected to grow for 2.4% in 2021 and for 4.8% in 2022. ECB spokesman Ren claims that the Eurozone's economic recovery is getting stronger and more resilient, but the ECB will maintain stimulus for some time.
Trading recommendations
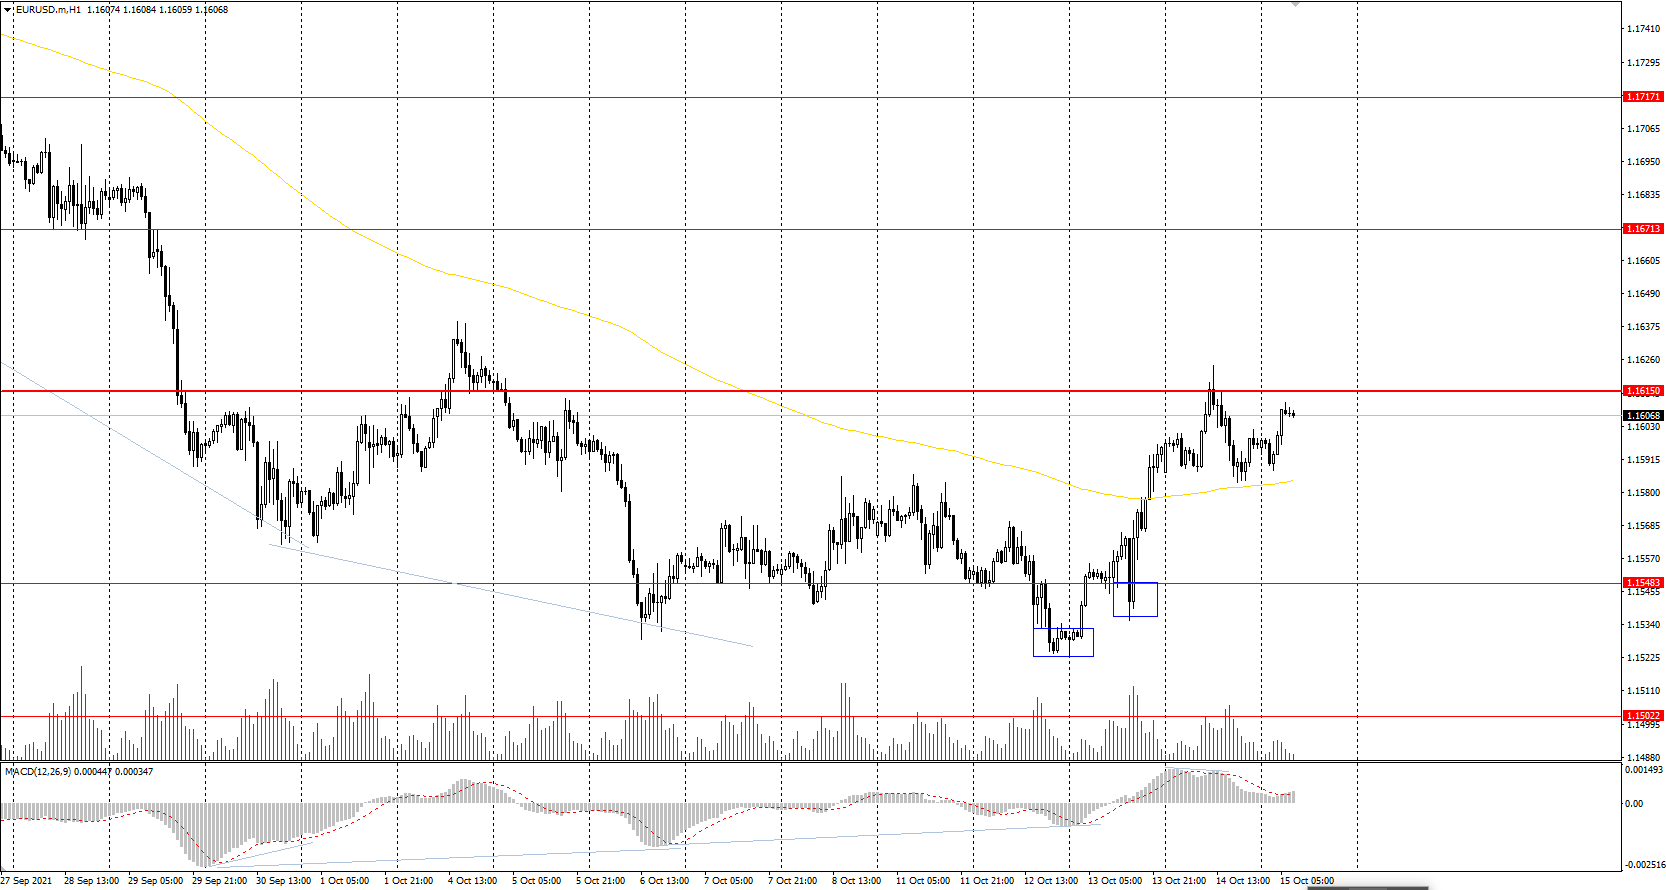
Support levels: 1.1548, 1.1502, 1.1453
Resistance levels: 1.1615, 1.1671, 1.1717, 1.1772, 1.1802, 1.1835
From the technical point of view, the EUR/USD trend is bearish. The MACD indicator has become positive. Under such market conditions, it is better to look for Sell deals from the priority change level, however it should be noted that the pressure of buyers is increasing. Buy trades should be considered only from the support levels or from the buyers' initiative areas.
Alternative scenario: if the price breaks out through the 1.1615 resistance level and fixes above, the mid-term uptrend will more likely resume.
News feed for 2021.10.15:
- US Retail Sales (m/m) at 15:30 (GMT+3);
- US Empire State Manufacturing Index (m/m) at 15:30 (GMT+3);
- US Michigan Consumer Sentiment (m/m) at 17:00 (GMT+3);
- US FOMC Member Williams Speech at 19:20 (GMT+3).
The GBP/USD currency pair
Technical indicators of the currency pair:
Prev Open: 1.3656
Prev Close: 1.3674
% chg. over the last day: +0.13%
Bank of England spokeswoman Mann said yesterday that the supply chain may last longer, but the Bank of England expects the demand to shift toward the services. The UK financial markets expect the QE program to be reduced at the end of December.
Trading recommendations
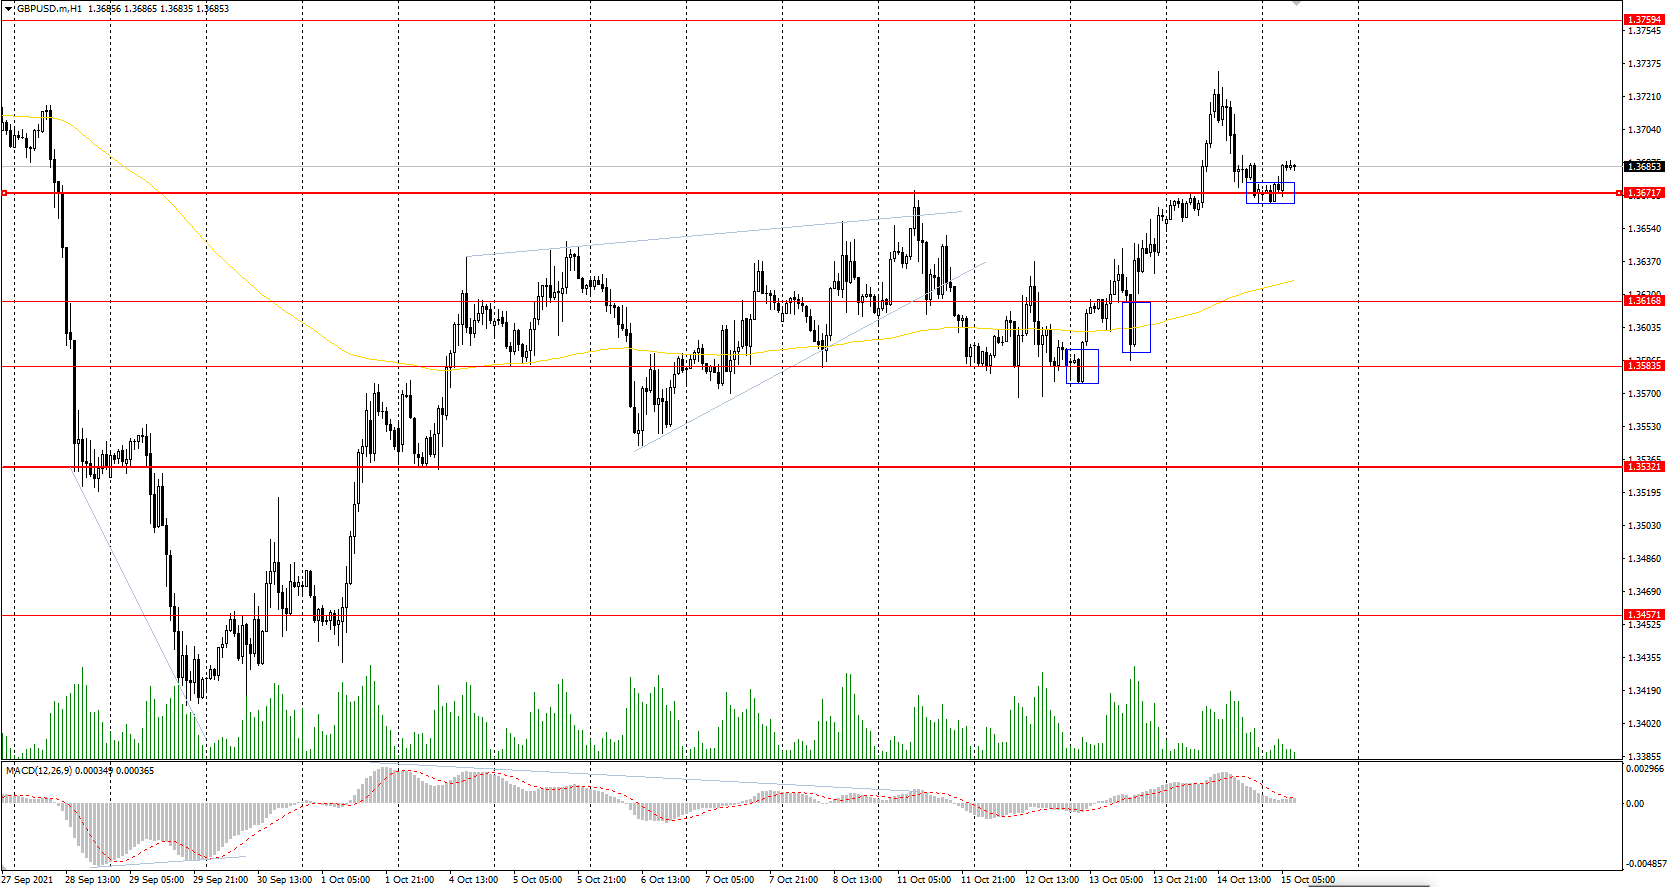
Support levels: 1.3671, 1.3617, 1.3584, 1.3532, 1.3457, 1.3360, 1.3282
Resistance levels: 1.3759, 1.3812, 1.3886
On the hourly time frame, the GBP/USD trend has changed to bullish. The British currency is strengthening due to the direct correlation with oil prices. The MACD indicator has become inactive. Buy trades should be considered only within the day and only from the initiative zone of the buyers. It is better to look for sell deals from the resistance levels, but after an additional confirmation in the form of a sellers' initiative, as the buyers' pressure is higher right now.
Alternative scenario: if the price breaks down through the 1.3532 support level and consolidates below, the bullish scenario is more likely to be broken.
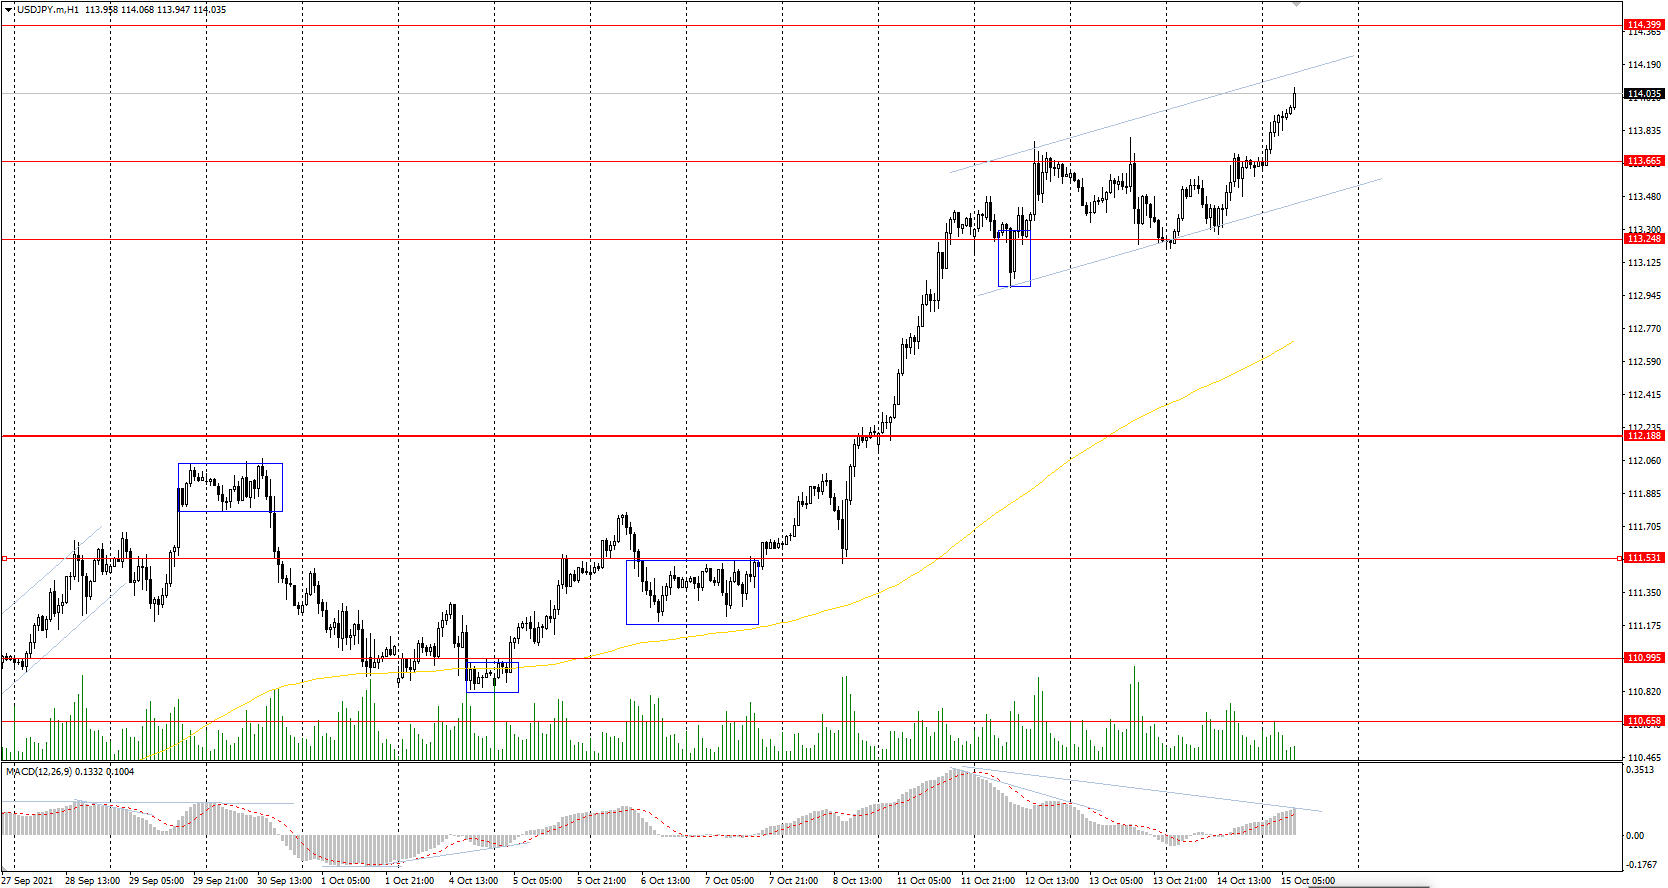
The USD/JPY currency pair
Technical indicators of the currency pair:
Prev Open: 113.24
Prev Close: 113.67
% chg. over the last day: +0.38%
Bank of Japan spokesman Noguchi claimed that monetary policy easing is not an option for Japan at least until the end of the year. The Japanese Yen will correlate with the US Dollar at most now.
Trading recommendations
Support levels: 113.66, 113.25, 112.19, 111.53, 110.99, 110.65, 109.95, 109.63
Resistance levels: 114.40
The main trend of the USD/JPY currency pair is bullish. The Japanese yen is rapidly declining against the US dollar. The MACD indicator is in the positive zone, but on higher time frames there is a divergence, which means that growth is limited and the correction should be expected to take place in the nearest future. Under such market conditions, it’s better to look for buy positions from the support levels near the moving average, since the price has deviated greatly from the average line. Sell positions should be considered only throughout the day from the resistance levels, given that there is sellers' initiative.
Alternative scenario: if the price falls below 112.19, the uptrend is more likely to be broken.
The USD/CAD currency pair
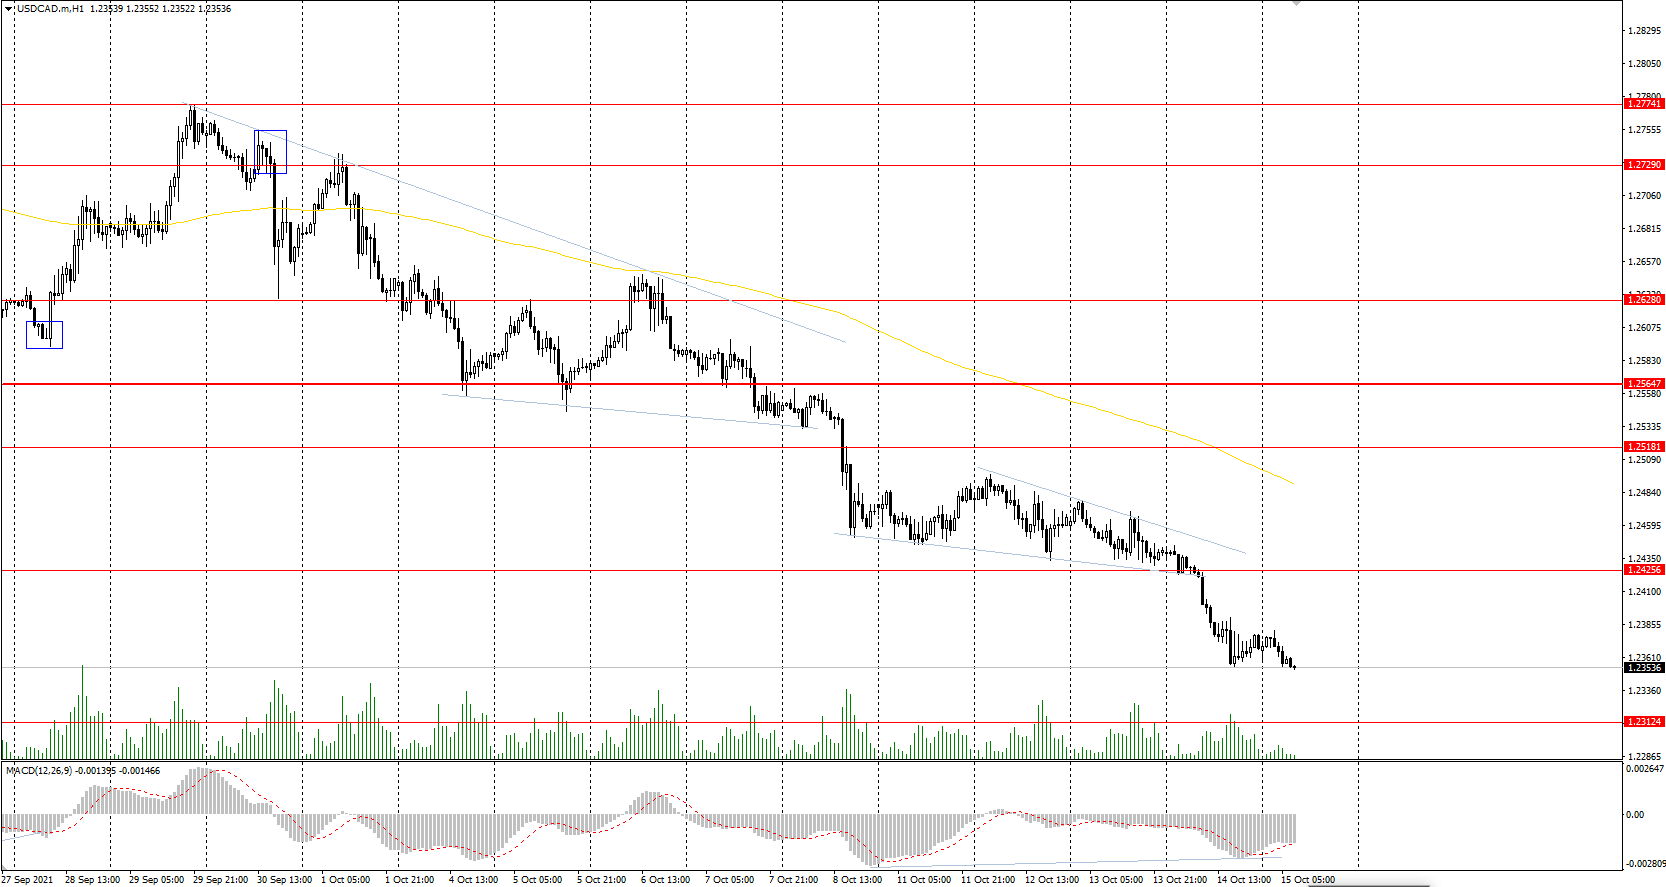
Technical indicators of the currency pair:
Prev Open: 1.2440
Prev Close: 1.2368
% chg. over the last day: -0.58%
The Canadian dollar is a commodity currency, so the USD/CAD currency pair is highly dependent on the dynamics of the dollar index and oil prices. The dollar index continues to decline, while oil prices slowly grow. As a result, the USD/CAD currency pair is declining due to US currency weakening.
Trading recommendations
Support levels: 1.2312
Resistance levels: 1.2425 1.2518, 1.2565, 1.2628, 1.2729, 1.2774
From the technical point of view, the trend of the USD/CAD currency pair is bearish. The narrowing triangle pattern turned out to be bearish. The MACD indicator has become negative, but there are still signs of divergence on higher time frames. Under such market conditions, it is better to look for sell deals from the resistance levels near the triangle pattern. Buy trades should be considered only on lower time frames from the support levels if there is the buyer’s initiative.
Alternative scenario: if the price breaks out through the 1.2565 resistance level and fixes above, the uptrend will more likely to resume.
Wall Street Roars Back, Yen Blasted As Optimism Returns
- Riskier plays come back swinging as supply worries take a back seat
- Stocks and commodity currencies power higher, yen gets hammered
- Dollar heads for weekly losses ahead of US retail sales
 Riskier assets storm back
Investors forgot about the mayhem in supply chains and energy markets on Thursday and instead increased their exposure to riskier plays, as a combination of encouraging US economic data and corporate earnings from the big banks cheered up the mood.
Initial jobless claims in America fell to a post-pandemic low, painting a brighter picture for the labor market recovery, while a weaker-than-expected acceleration in factory gate prices calmed some inflation fears. Meanwhile, bank executives suggest consumers are spending without concern again, confirming that demand is ample in the economy.
Of course, the real issue is that businesses have hit a supply wall and can't cover all this demand, which threatens to kneecap growth next year while inflation remains hot thanks to rising production costs with energy prices going through the roof.
But that's a worry for another day. For now, investors are happy to take a glass-half-full approach and deploy more capital towards riskier assets, enjoying the small victories like the promising earnings season. The S&P 500 and Nasdaq Composite both advanced by 1.7%, coming one step closer to reclaiming their record highs.
Commodity currencies fly, yen dives
In the FX spectrum, the commodity-linked currencies came back to life as the risk tone improved, also capitalizing on some signs that China is trying to stabilize its real estate market. The nation's central bank loosened mortgage rules to encourage more lending and cushion the Evergrande fallout.
It's not all good news, however, as China's coal prices continue their relentless rise, threatening to exacerbate the power rationing that has forced some factories to halt production. Economic growth data for Q3 will hit the markets early on Monday and will be closely watched as investors try to gauge how much damage the world's growth engine has sustained from the energy calamity and a slowing property sector.
Meanwhile, the Japanese yen remains the ‘sick man' of the FX arena. The spike in global yields ignited the yen's downfall and the latest improvement in risk appetite only added fuel to the slide. Between worsening rate differentials, a diminished role as a safe haven, and Japan's reliance on imported energy, this is a dreadful environment for the yen.
Oil can't stop, US retail sales in focus
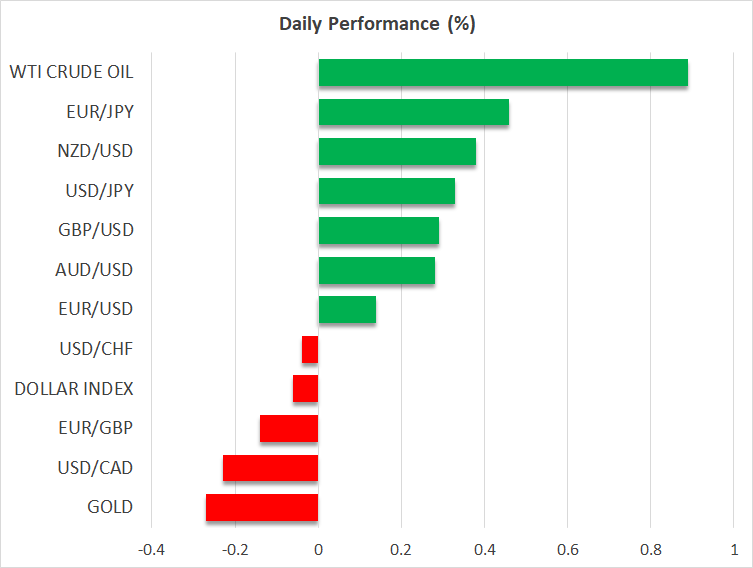
Oil prices keep ripping higher, playing catch-up with the unreal rally in other energy commodities and the wider shift in market sentiment. WTI crude touched another seven-year high today as demand continues to outstrip supply after OPEC decided not to throw the market a life jacket.
This has naturally been a blessing for the oil-sensitive Canadian dollar, with investors also betting that the Bank of Canada will begin its rate hike cycle even earlier thanks to intensifying inflationary forces. The first rate increase is now fully priced in for June according to money markets.
Finally, the US dollar has drawn the short straw this week, giving back some of its recent gains as Treasury yields calmed down and traders rotated back into riskier currencies. The market is now leaning towards the scenario of an earlier but shallower rate hike cycle by the Fed, and today's retail sales could be crucial for this narrative.
Overall, the dollar remains unique in that it enjoys both favorable growth prospects and offers protection against global risks, with the American economy's energy independence compounding the reserve currency status.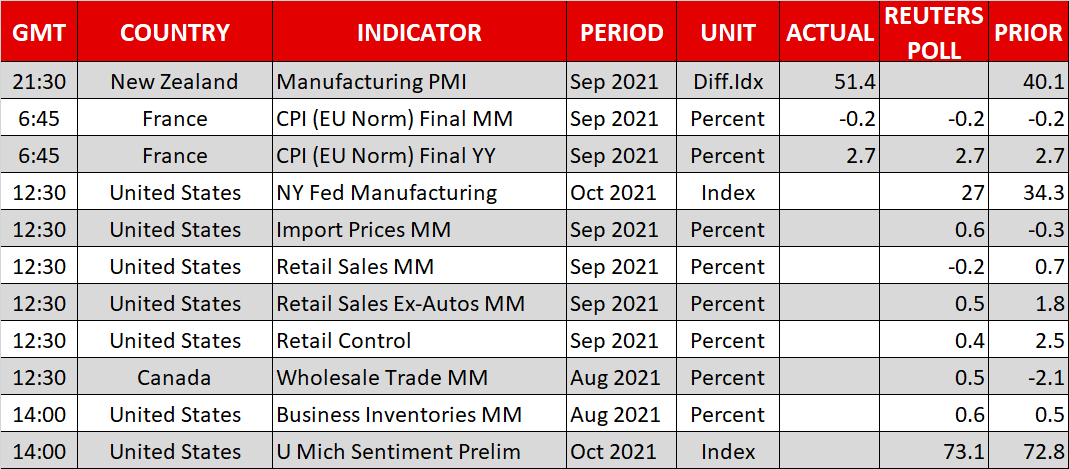
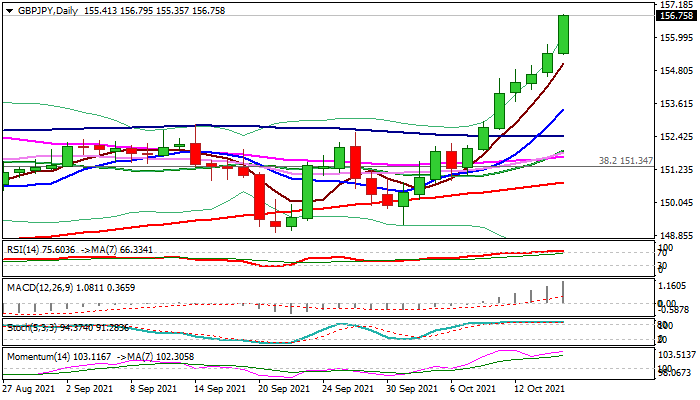
GBP/JPY Outlook: GBP/JPY Rises To The Highest In Over Five Years
The GBPJPY was among the top performers in early Friday’s trading, as cross accelerated higher and hit the highest level since June 2016.
Fresh risk appetite pushed the dollar further down and lifted sterling against its major counterparts while yen was sold across the board.
The pair was up 0.66% since opening in Asia, extending steep ascend into seventh straight day and also on track for the biggest weekly gain since the last week of May 2020.
Bulls broke above former highs at 156.07/60 (May 2021/February 2018) with weekly close above these levels to generate strong bullish signal and expose next key barriers at 159.84/160.00 (50% retracement of 195.85/123.83/monthly cloud top/psychological) and 162.08 (200MMA).
Steep rally so far does not show signs of fatigue, but overbought daily studies suggest that some corrective action should be anticipated in coming sessions.
Res: 157.86, 158.97, 159.84, 162.08.
Sup: 156.07, 155.35, 154.59, 153.40.
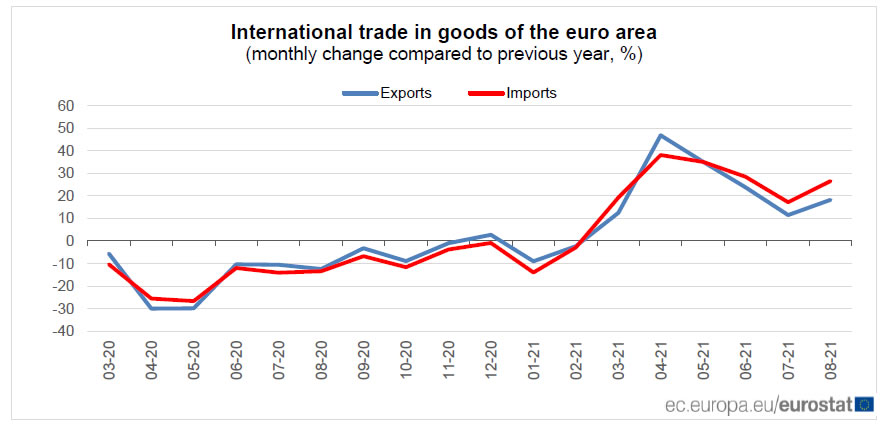
Eurozone exports rose 18.2% yoy in Aug, imports rose 26.6% yoy
Eurozone exports of goods to the rest of the world rose 18.2% yoy to EUR 184.3B in August. Imports rose 26.6% to EUR 179.5B. Trade surplus came in at EUR 4.8B. Intra-Eurozone trade also rose 21.2% yoy to EUR 155.5B.
In seasonally adjusted term, Eurozone exports rose 0.3% mom to EUR 200.6B. Imports rose 1.6% mom to EUR 189.4B. Trade surplus narrowed to EUR 11.1B. Intra-Eurozone trade rose from 179.4B to 181.2B.