Sample Category Title
BoJ Amamiya urges vigilance to supply chain disruptions in Asia
BoJ Deputy Governor Masayoshi Amamiya reiterated that the economy is "picking up as a trend", which will become clearer as pandemic impact subsides. He added that the price trends remains "solid" and the financial systems is "stable" as a whole.
But he also acknowledged that consumptions continues to "stagnate". Exports and outputs are being affected by "supply constraints". Ad emphasized that the central bank must be vigilant to the impact that of supply chain disruptions in Asia.
ECB Wunsch: We could afford some second-round effects, but not too much
ECB Governing Council member Pierre Wunsch told Bloomberg TV that the economy is " on the right path. But medium term inflation goal is not met yet. "It seems that we are at some kind of inflection point," Wunsch said. "We are below our objective, so we could afford some second-round effects, but not too much."
Wunsch also said the central bank will maintain a "very supportive monetary policy," even after the end of its emergency bond-buying program in March.
USD Remains Soft, Yet US Stockmarkets Rise
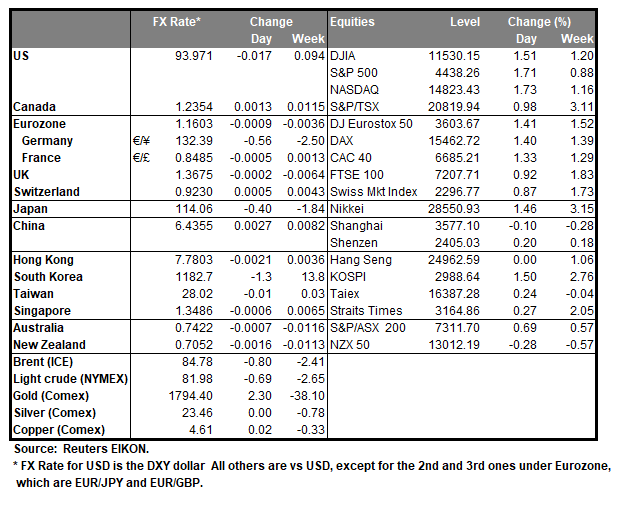
The USD remained rather stable but soft against its counterparts yesterday while US stockmarkets tended to gain substantially. On the other hand, gold’s price had some limited gains as well. It’s characteristic that all three main US indices gained as market participants saw past the inflationary worries for the US economy and tended to concentrate on the earnings season. The banking sector delivered strong results including Morgan Stanley, Bank of America, and Citigroup, which beat market estimates. It should be noted that the weekly initial jobless claims figure dropped below the psychological barrier of 300k, reaching a new post pandemic low. Attention today turns to the NY Fed Manufacturing index for October, the US retail sales for September and the preliminary University of Michigan consumer sentiment for October.
Dow Jones continued to rise yesterday aiming for the 35075 (R1) resistance line. We maintain our bullish outlook for the index as long as it remains above the upward trendline incepted since the 13th of October. Please note that the RSI indicator below our 1-hour chart has surpassed the reading of 70, confirming the bullish sentiment, yet at the same time may imply that the index is overbought and ripe for a correction lower. Should the bulls actually maintain control over the index, we may see it breaking the 35075 (R1) resistance line thus paving the way for the 35500 (R2) level. Should a correction lower be performed and the bears find a chance to take over we may see the index reversing course, breaking the prementioned upward trendline and take aim or even breach the 34700 (S1) support line.
Turkish Lira reaches new record lows
The Lira has been weakening for the past few days, reaching new record lows against the USD. The situation is highlighted by the Central Bank of Turkey (CBRT) interest rate decision, which is expected to be released on Wednesday. The bank refuses to start tightening its monetary policy and even proceeded with a rate cut of 100 basis points for its one-week repo rate, from 19% to 18%, in its last meeting. It should be noted that inflation has reached almost 20% on a year-on-year level in September. The bank’s dovish policy seems to be a result of President Erdogan’s pressure on the bank. It’s characteristic that the Turkish President dismissed three of the banks’ policymakers, two of which were mentioned as to have opposed the last rate cut performed by the bank. The bank was expected to reverse its previous decision in the coming meeting, yet after the overhaul of the Bank’s board, such a scenario is being highly doubted.
USD/TRY continued to be on the rise yesterday breaking the 9.1500 (S1) resistance line, now turned to support. We maintain our bullish outlook for the pair as long as it remains above the upward trendline incepted since the 8th of October. It should be noted that the pair is at new record high levels and the RSI indicator below our 4-hour chart has surpassed the reading of 70, confirming the buying interest for the pair, yet at the same time may imply that the pair is overbought. Should buyers continue to guide the pairs’ price action, we may see it aiming if not breaching the 9.3500 (R1) level. Should on the other hand the market say enough is enough and a selling interest be displayed for the pair, we may see USD/TRY reversing course and breaking the 9.1500 (S1) line, the prementioned downward trendline and taking aim of the 8.9500 (S2) level.
Today’s events and expectations
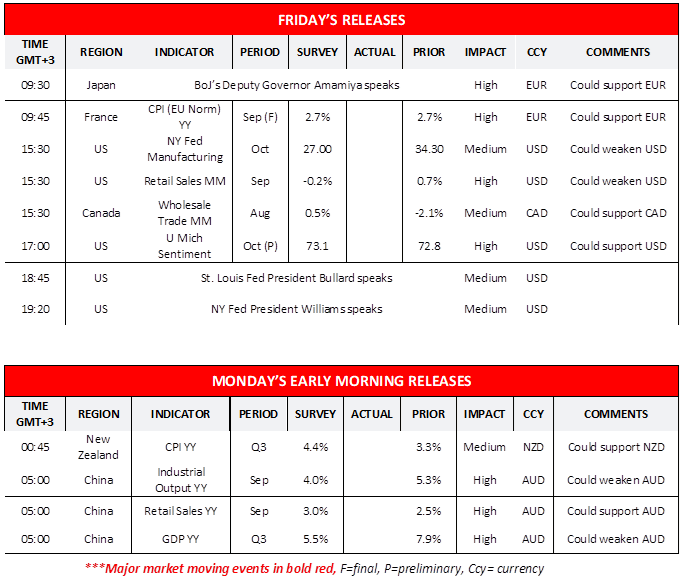
Today during the European session we get France’s final HICP rate for September. In the American session, we get NY Fed manufacturing index for October, the US retail sales for September and the preliminary University of Michigan consumer sentiment for October. On the monetary front we note the speeches of BoJ’s Deputy Governor Amamiya, St. Louis Fed President Bullard and NY Fed President Williams. During Mondays’ Asian session we highlight China’s GDP rate and New Zealand’s CPI rates for Q3.
US30 Cash H1 Chart
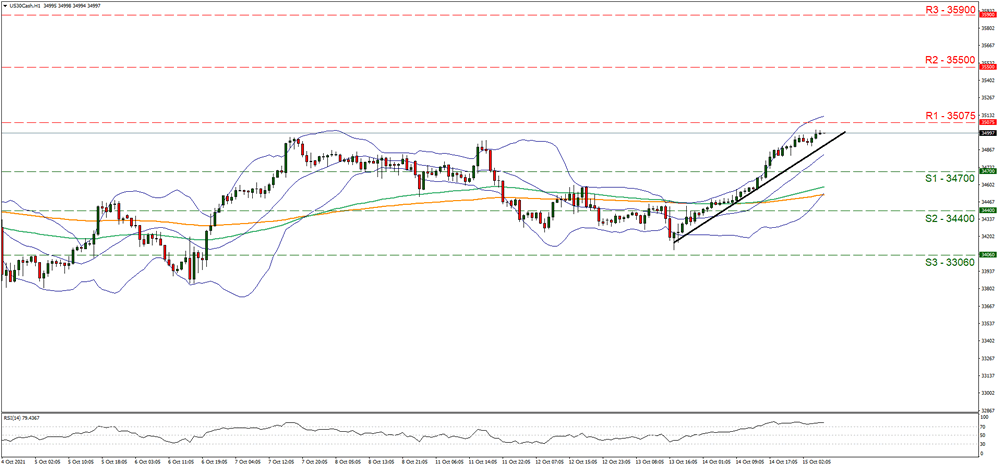 Support: 34700 (S1), 34400 (S2), 33060 (S3)
Resistance: 35075 (R1), 35500 (R2), 35900 (R3)
USD/TRY H4 Chart
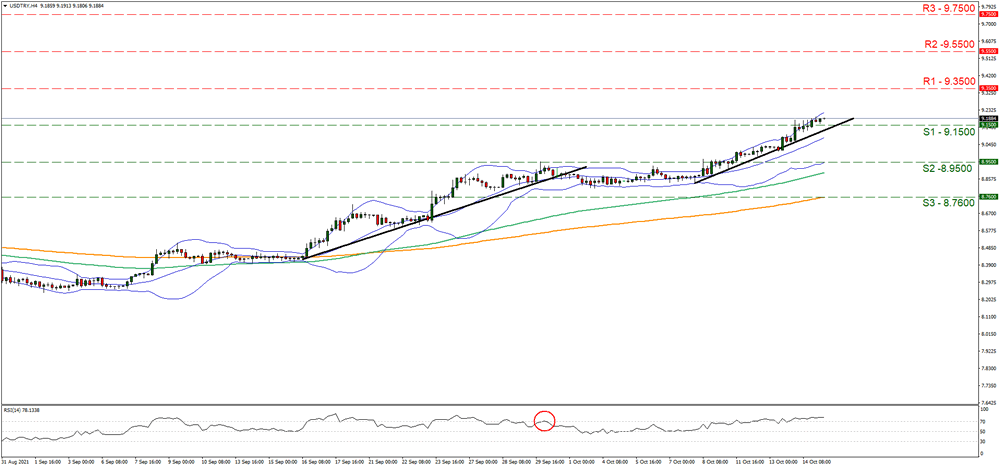 Support: 9.1500 (S1), 8.9500 (S2), 8.7600 (S3)
Resistance: 9.3500 (R1), 9.5500 (R2), 9.7500 (R3)
Yen’s Race To The Bottom And Almost Euphoria In The US Stocks
The S&P500 index closed Thursday with the biggest gain in seven months, adding 1.7%. In a sharp move, the index managed to get back above the 50-day average and maintained its position above that line as of Friday morning.
Traders should pay attention to the trading around this level, which acted as support since November 2020 and turned into resistance in September 2021. The regular session and the weekend promise to set the tone for the next few days and even weeks.
The Japanese market in the form of the Nikkei 225 supports America's optimism by adding 1.7% since the beginning of the trading session on Friday and surpassing the 29000 level and its 50- and 200-day moving averages. The weakening Japanese yen against its major rivals are keeping interest in shares of the Land of the Rising Sun alive. They also benefit from some pullback in energy prices, which are mainly imported.
The weakening of the yen overnight fits well with the persistent inverse relationship between its exchange rate and the demand for risk: low-yielding Japanese bonds are used as funding for purchasing risky assets such as stocks or high-yielding currencies. This factor has added to yen weakness as the trade balance shifts towards higher imports due to a jump in energy and metals prices.
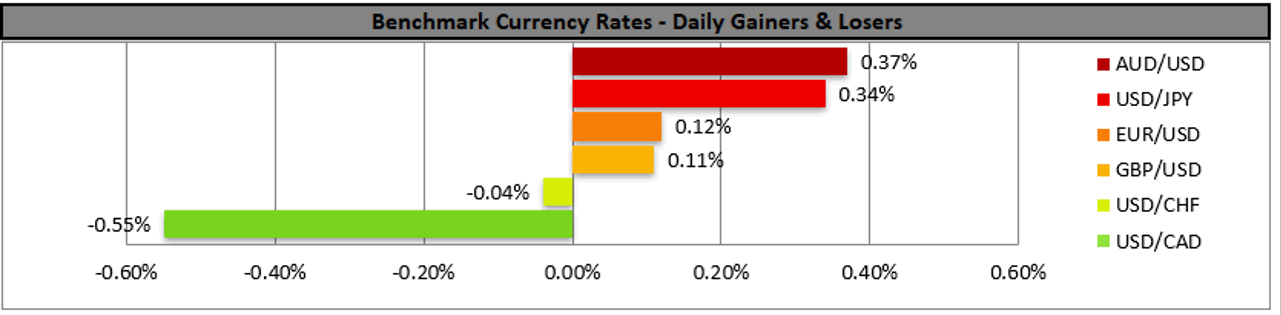
Having surpassed 114 this morning, the USDJPY was near the upper end of its trading range since early 2017. On the charts up to the weekly timeframes, there is a clear overbought situation in the pair. The same is largely true for GBPJPY, which, having risen to 156.5, is testing its highest levels since mid-2016.
Since early October, the yen's dip has appeared too fast and abrupt, and the move could potentially be even stronger. In the coming days, we may see the sellers surrender on the rise above the turning points of recent years. Or, on the contrary, an increase in bear's grip. Either way, there will be no dullness in the yen.
A further weakening of the Japanese currency would inflate the stock market's sails and support a further strengthening of commodities and high-yielding currencies. Having started at the beginning of October, this momentum is relatively new and therefore, its potential is far from exhausted. On the other hand, there are also questions about its sustainability because massive bond placements from the US Treasury should be on the horizon, drawing liquidity from the market and supporting the demand for the dollar.
USDCAD On A Slippery Slope, 1.23 Next In Focus
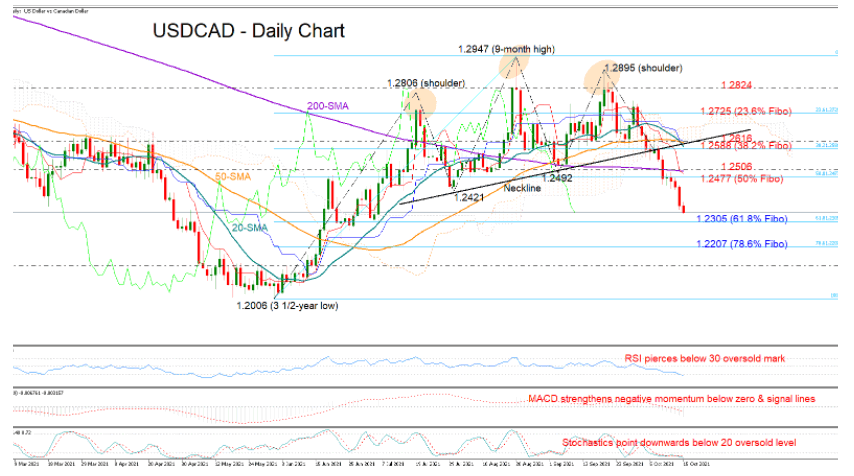
USDCAD bears show no sign of abating as the sell-off continues for the fourth week, with the price crossing aggressively through the 1.2400 area to hit an almost three-month low of 1.2349 on Friday.
The sharp downfall follows the confirmation of a bearish head and shoulder pattern (H&S) below the neckline at 1.2588 - a sign that the previous upward pattern has completed its cycle. The recent crossover of the 20-day simple moving average (SMA) by the 50-day SMA also came to signify a negative trend reversal in the market, though the prolonged decline is now creating questions about when the pair will apply the brakes on this slippery slope lower.
The RSI and the Stochastics haven't found a pivot point in the oversold area yet, while the MACD remains negatively charged below its zero and signal lines, suggesting selling tendencies could persist a bit longer in the market.
The 61.8% Fibonacci retracement of the 1.2006 – 1.2947 upleg is currently under the spotlight at 1.2305. Should it give way, the door would open for the 78.6% Fibonacci of 1.2207, while in the event of a more aggressive downfall, traders may also keep an eye on the 1.2135 restrictive region.
In the positive scenario, the price may push for a close above the 1.2477 resistance and the 200-day SMA at 1.2500. If efforts prove successful, the bulls will next attempt to dissolve the negative H&S pattern above the broken neckline and the shorter-term SMAs seen between 1.2588 and 1.2618.
All in all, sellers may keep leading USDCAD in the short term, though to gain more fuel they will probably need to clear the 1.2305 support.
GBPJPY Rallies Towards New 44-Month High, Next Stop At 160.00
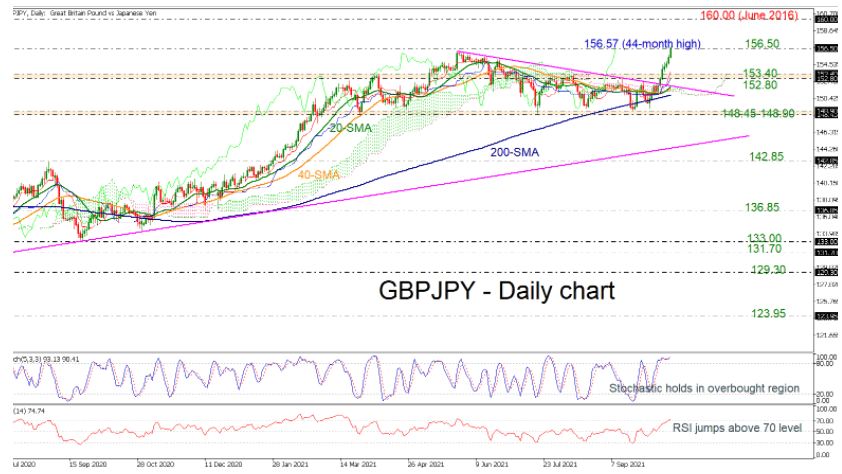
GBPJPY posted six straight green days and today is continuing the bullish rally towards a fresh 44-month high around 156.57.
The pair jumped well above the medium-term descending trend line and any closing candle beyond the previous high of 156.50 could endorse the positive bias.
Technically, despite the fact that the stochastic oscillator is standing in the overbought region, the index is creating a bullish crossover within the %K and %D lines, pointing upwards. Also, the RSI is surpassing the 70 level with strong momentum. In trend indicators, the red Tenkan-sen line is moving above the blue Kijun-sen line and the price is standing above the Ichimoku cloud.
Looking for resistance levels, some stabilization is expected to occur around the 160.00 psychological level, registered in June 2016. Above this crucial line, the high from April 2016 at 162.80 may halt the bullish moves.
In the event of a downside reversal, the spotlight will fall back to the 152.80-153.40 support area, which has been quite active from August onwards. If this fails to hold this time, the bears may push for a close below the Ichimoku cloud, moving towards the 23.6% Fibonacci retracement level of the upward wave from 129.30 to 156.06 at 149.75.
Summarizing, GBPJPY could extend its trendline breakout towards the 160.00 handle though some caution is required as the pair is trading near the overbought territory.
Daily Technical Analysis
EUR/USD
Current level - 1.1591
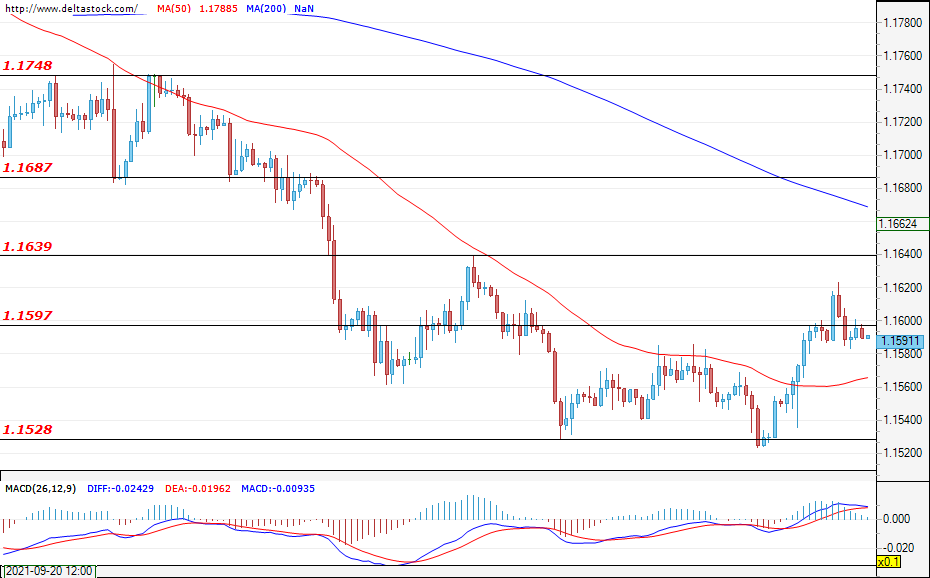
The bulls did not manage to gain enough momentum to successfully breach the resistance zone of 1.1597 and, during the early hours of today`s trading session, the pair is trading just under the mentioned level. A new test of the level in question is a highly probable scenario and, if successful, the pair will most likely continue to recover and target the resistance level of 1.1639. However, if the bears regain control of the market and breach the support zone of 1.1528, the common European currency will most likely continue to lose ground against the greenback and move towards the levels of around 1.1400. During today’s session, volatility could spike when the data for the retail sales in the U.S. is announced (today; 12:30 GMT).
| Resistance | Support | ||
| intraday | intraweek | intraday | intraweek |
| 1.1597 | 1.1687 | 1.1530 | 1.1410 |
| 1.1640 | 1.1750 | 1.1470 | 1.1280 |
USD/JPY
Current level - 113.85
The bulls did not manage to gain enough momentum to successfully breach the resistance zone of 1.1597 and, during the early hours of today`s trading session, the pair is trading just under the mentioned level. A new test of the level in question is a highly probable scenario and, if successful, the pair will most likely continue to recover and target the resistance level of 1.1639. However, if the bears regain control of the market and breach the support zone of 1.1528, the common European currency will most likely continue to lose ground against the greenback and move towards the levels of around 1.1400. During today’s session, volatility could spike when the data for the retail sales in the U.S. is announced (today; 12:30 GMT).
| Resistance | Support | ||
| intraday | intraweek | intraday | intraweek |
| 114.50 | 116.00 | 113.64 | 112.00 |
| 116.00 | 118.50 | 113.00 | 111.56 |

GBP/USD
Current level - 1.3678
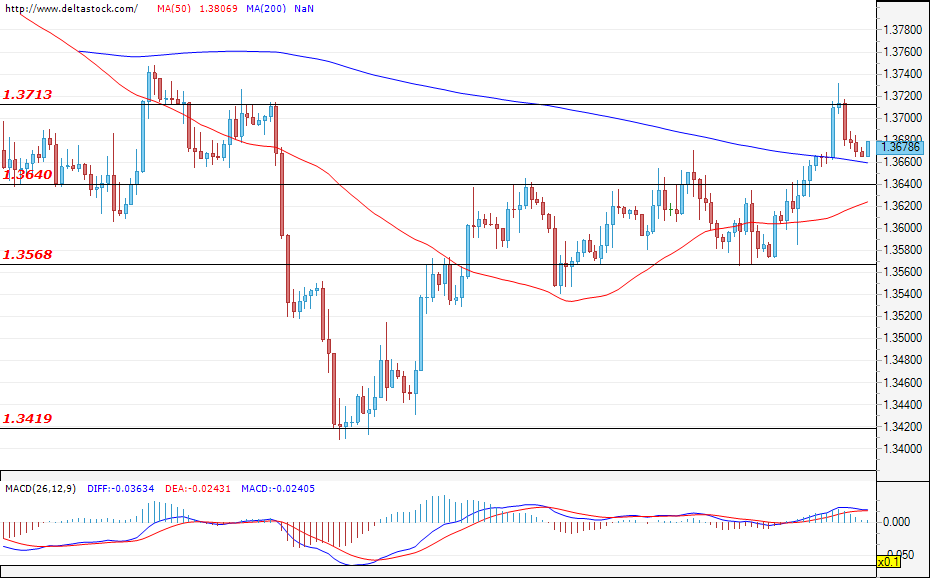
Although the rise of the Cable was limited to the resistance zone of 1.3713, the positive sentiment remains intact. At the time of writing, the most probable scenario is for another test of the aforementioned level and a continuation of the appreciation of the pound against the U.S. dollar towards the resistance of 1.3750. If this does not happen, the first target for the bears is the level of 1.3640, a successful breach of which could easily bring trading back in the range between 1.3568 and 1.3640.
| Resistance | Support | ||
| intraday | intraweek | intraday | intraweek |
| 1.3710 | 1.3800 | 1.3640 | 1.3420 |
| 1.3760 | 1.3840 | 1.3570 | 1.3420 |
US 100 Attempts A Bullish Reversal
The Nasdaq 100 rose as investors anticipate strong profit growth in the third quarter.
The break above 14930 has prompted sellers to cover their positions, alleviating the bearish pressure in the process. The tech index has then secured support around 14600.
A bullish close above the psychological level of 15000 would bring some much-needed confidence to the long side. Then the daily resistance at 15415 would be in the crosshair. Meanwhile, the RSI’s overbought situation may cause a limited pullback to 14900.

XAG/USD Rises Towards Key Resistance
Silver advanced higher as the US dollar index licks wounds after a heavy decline.
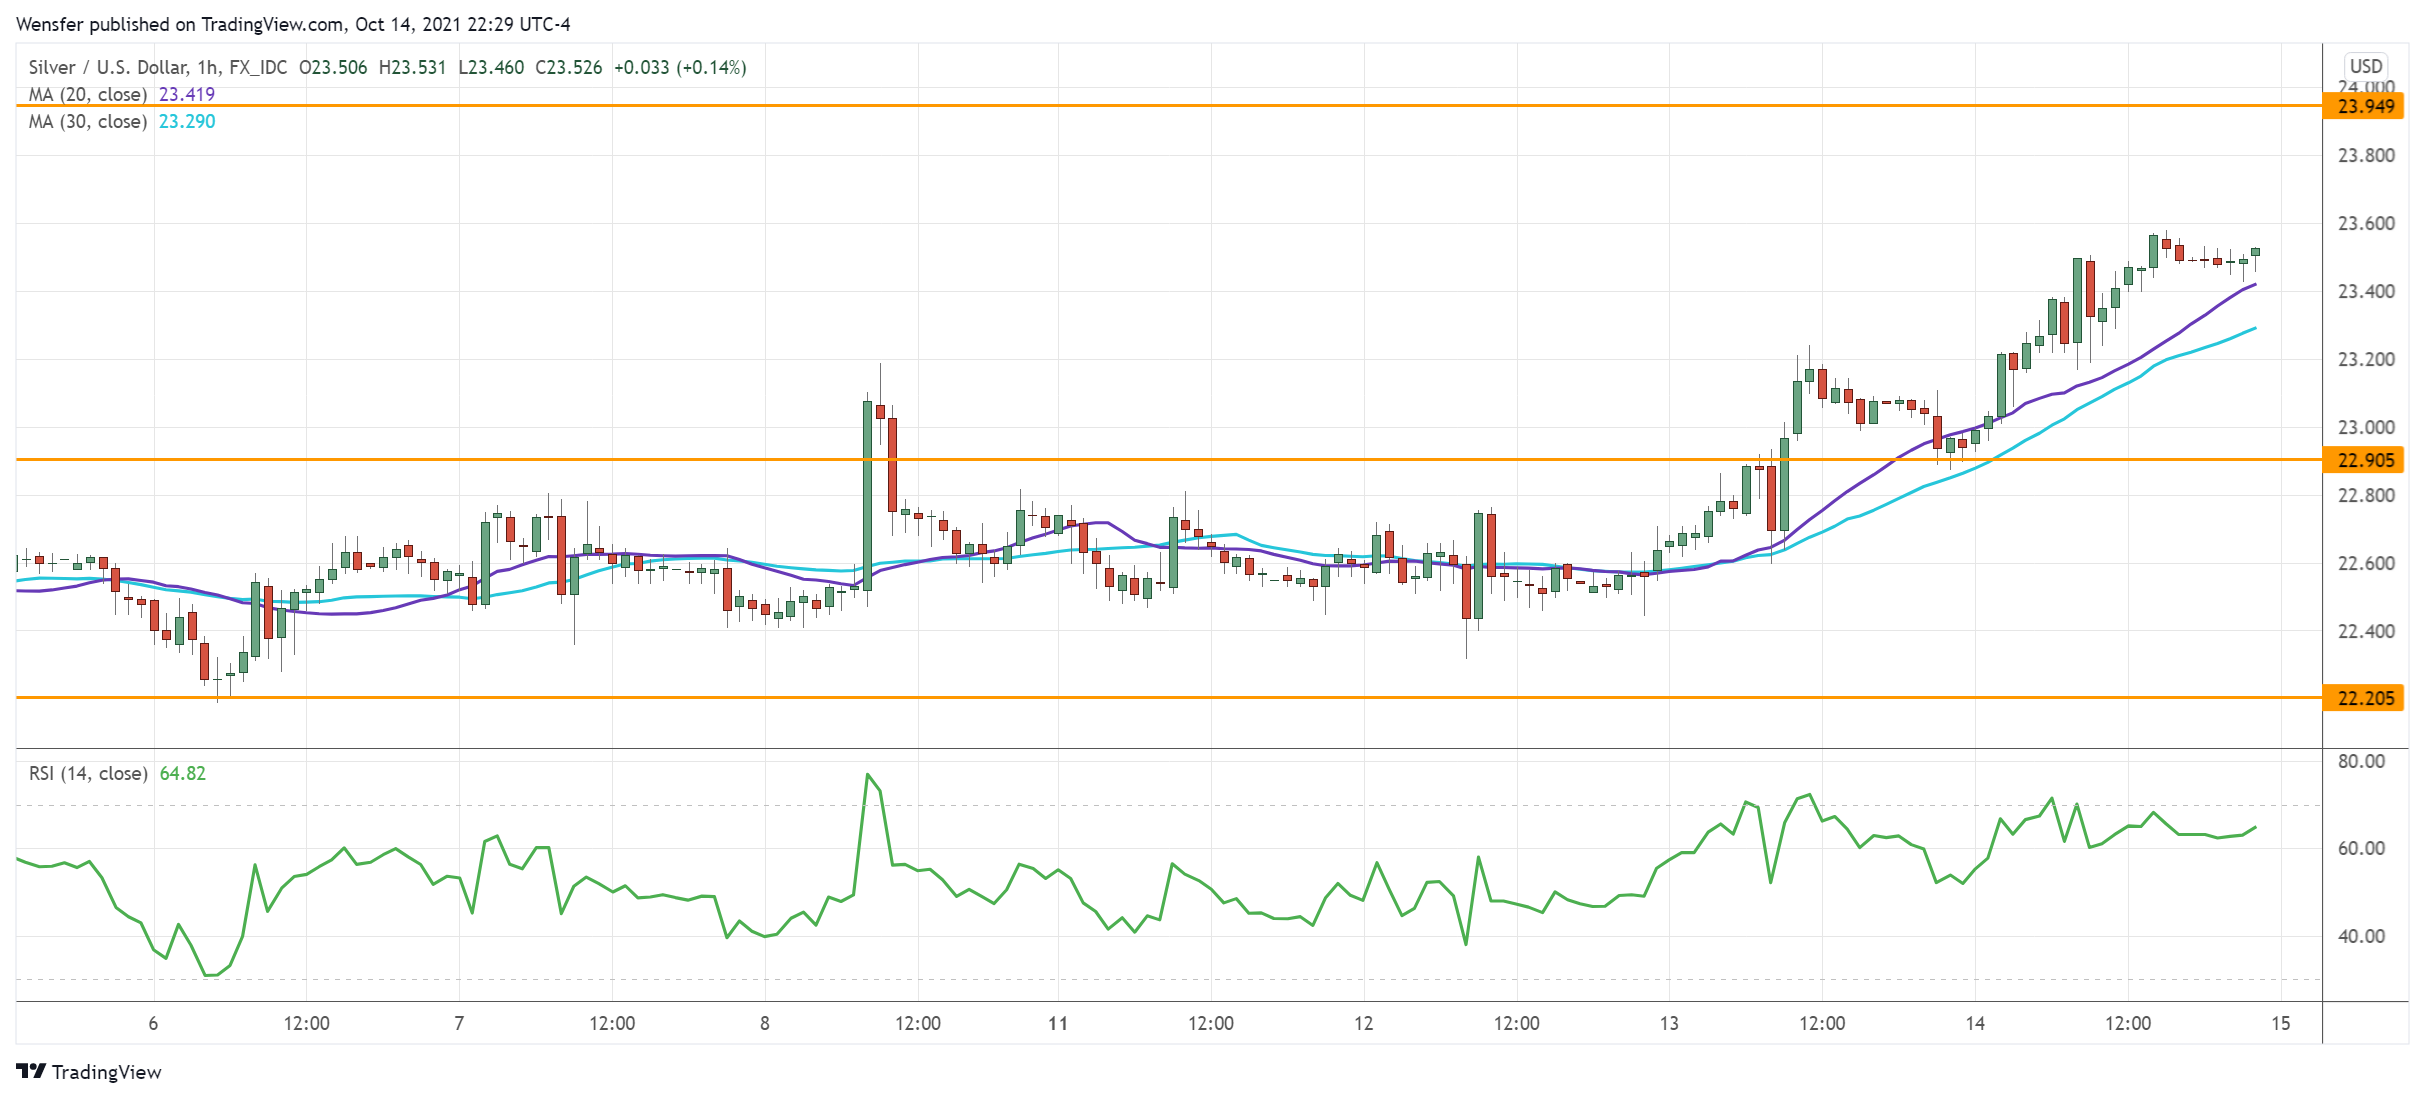
The precious metal broke above the supply zone around the 30-day moving average (23.10). This is a sign of a bullish U-turn with 23.95 from the daily timeframe as the next target.
As the RSI flirts with the overbought territory, we can expect strong selling pressure at that level of interest. 22.90 is the immediate support in case of retracement. Further down, 22.20 is the bulls’ second line of defense.
US Oil Consolidates Gains
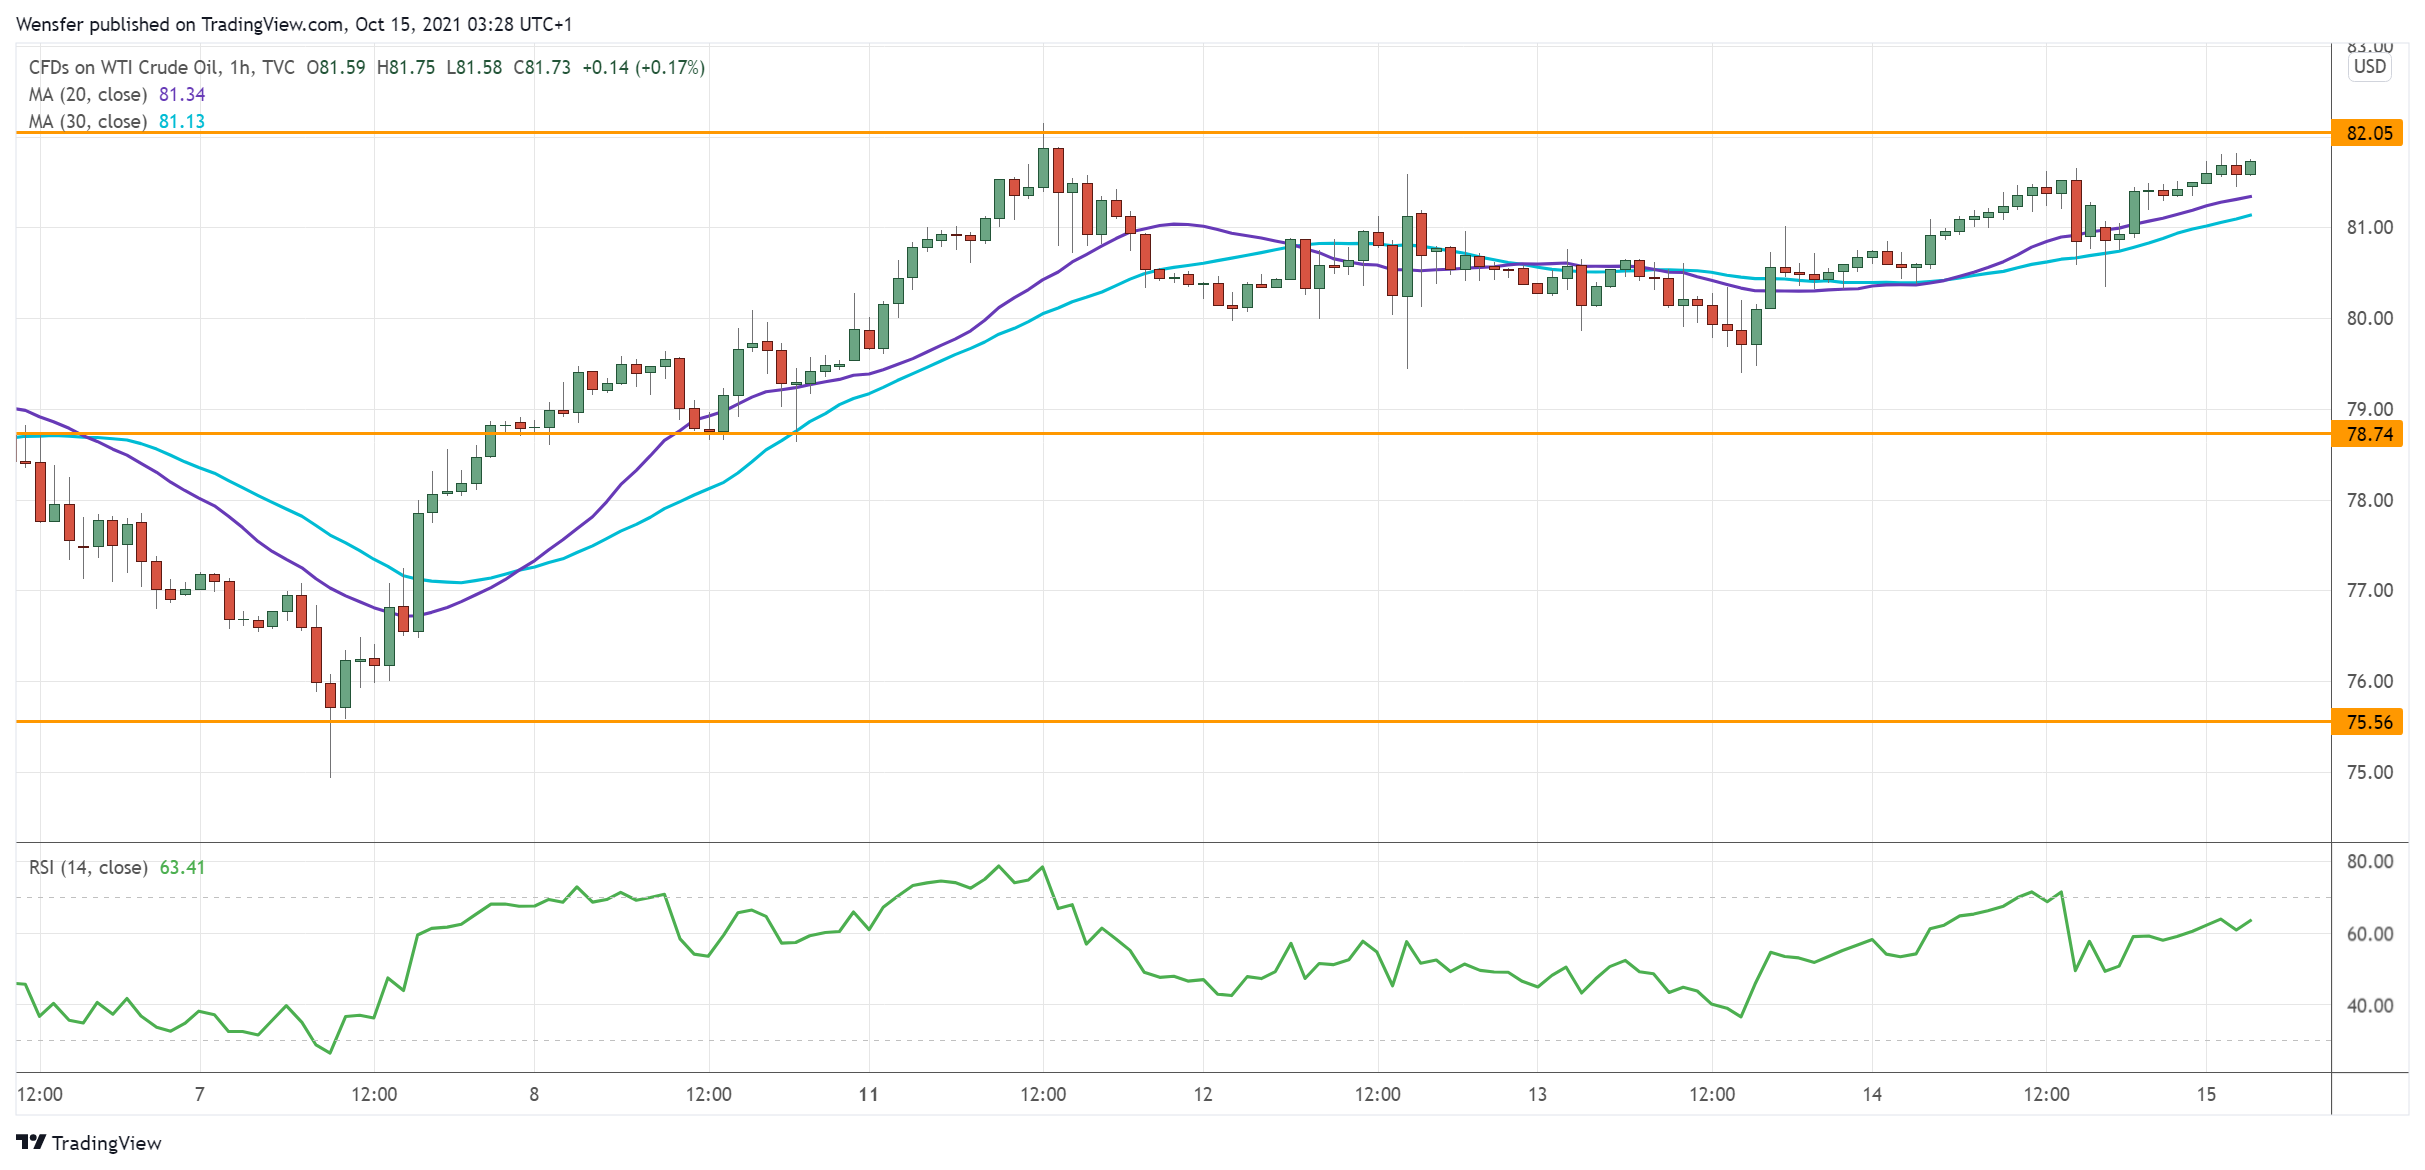
Oil prices jumped after the IEA raised its global oil demand growth forecast. WTI crude continues to grind its way up after it reached a seven-year high.
The RSI has returned to the neutrality area and a short-lived retracement met strong buying interest above 78.70. The bulls may raise volatility once again if they succeed in pushing back above the psychological tag of 82.00.
A newly overbought RSI may temporarily restrain the momentum. On the downside, a breakout could trigger a correction to 75.50.