

Sample Category Title
EUR/JPY Day Outlook
Daily Pivots: (S1) 127.94; (P) 128.49; (R1) 128.82; More....
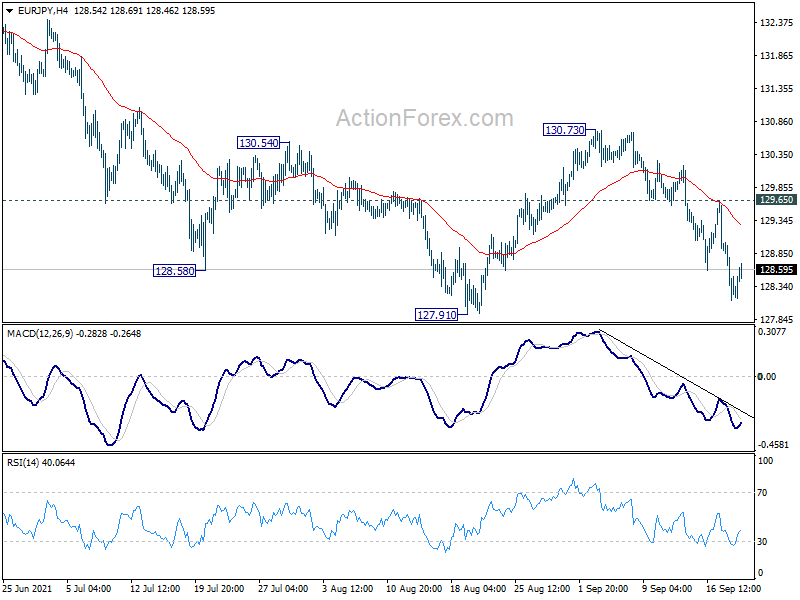
Intraday bias in EUR/JPY stays on the downside for 127.91 support. Firm break there will resume whole fall from 134.11 and target 127.07 resistance turned support. Sustained break there will carry larger bearish implication and pave the way to 121.91 fibonacci level. On the upside, however, break of 129.65 will turn bias back to the upside for 130.73 resistance instead.
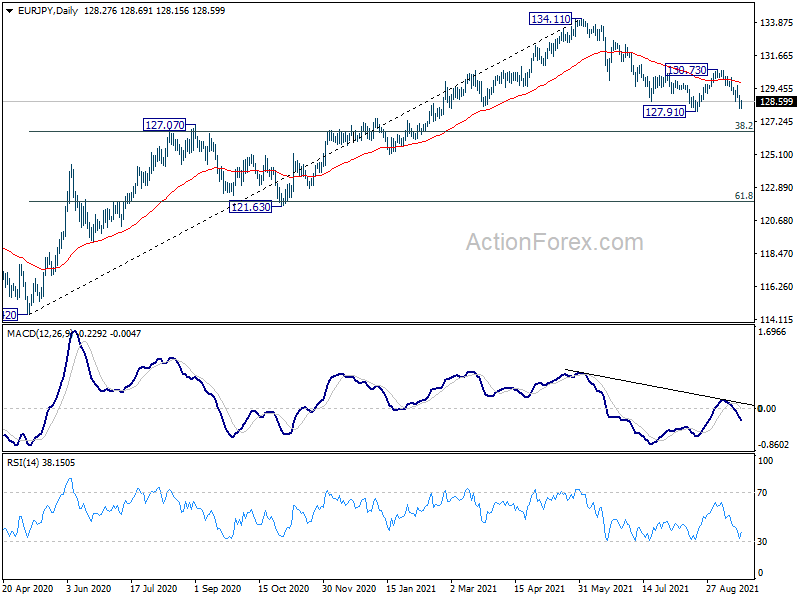
In the bigger picture, rise from 114.42 is seen as a medium term rising leg inside a long term sideway pattern. As long as 127.07 resistance turned support holds, further rise is still expected to retest 137.49 (2018 high). However, firm break of 127.07 will argue that the medium term trend has reversed, deeper fall would be seen to 61.8% retracement of 114.42 to 134.11 at 121.94.
EUR/GBP Daily Outlook
Daily Pivots: (S1) 0.8546; (P) 0.8571; (R1) 0.8612; More...
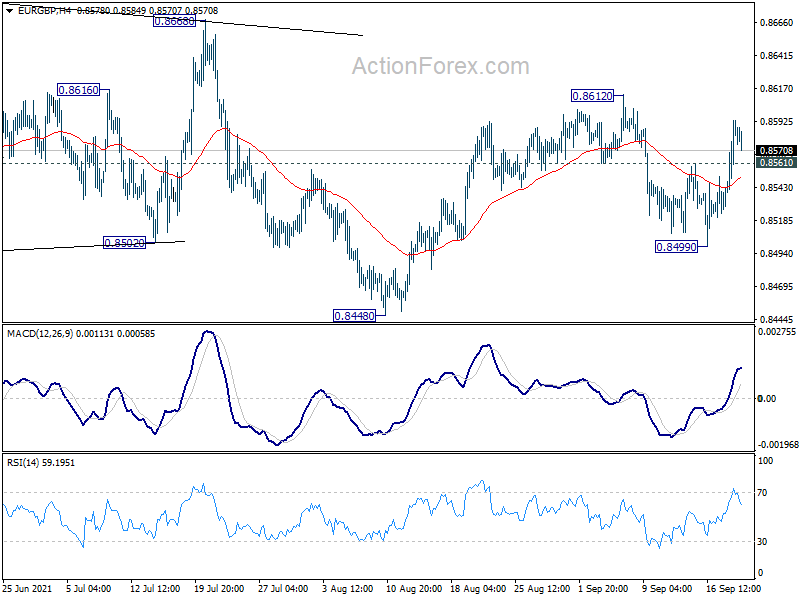
EUR/GBP's break of 0.8561 minor resistance suggests that pull back from 0.8612 has completed. Intraday bias is back on the upside for 0.8612 first. Break there will resume whole rebound from 0.8448 to 0.8668 key structural resistance next. However, below 0.8499 will bring another fall towards 0.8448 low.
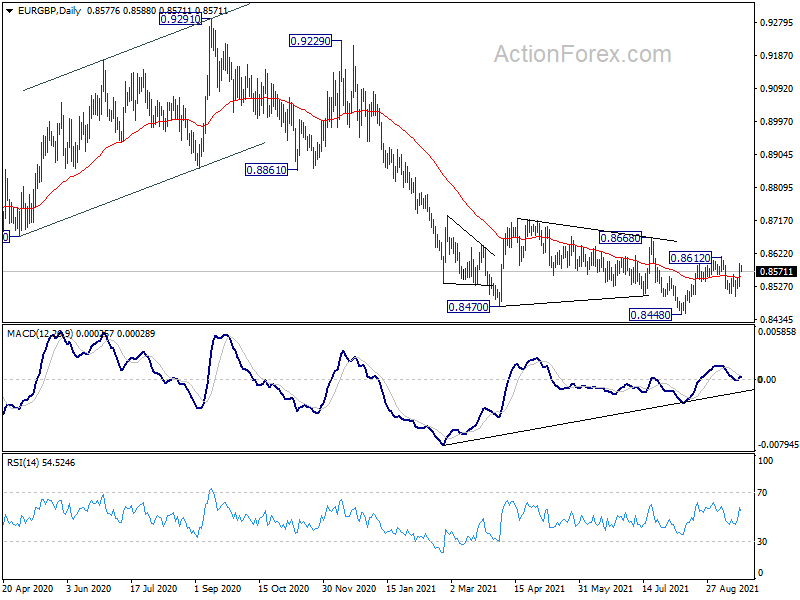
In the bigger picture, price actions from 0.9499 (2020 high) are still seen as developing into a corrective pattern. Deeper fall could be seen as long as 0.8668 resistance holds, towards long term support at 0.8276. However, firm break of 0.8668 resistance would argue that a medium term bottom was already formed. Stronger rise would be seen to 0.8861 support turned resistance to confirm completion of the corrective pattern.
Gold’s Sudden Glow In A Falling Market
The Dow Jones index experienced its worst drop in 10 months on Monday, falling 600 points or 1.8%. The S&P500 index lost about the same amount, 1.7%. The dollar index climbed to monthly highs, trading above 93.0.
Intraday, the S&P500 had fallen more than 5% from early September peaks at one point, interrupting a 10-month streak of gains when the index did not experience such pullbacks.
Nonetheless, it can hardly be said that markets have plunged into fear. Currency, debt, and precious metals markets showed sudden resilience or even indifference during yesterday's sell-off in equity markets.
The debt and currency markets are considered the 'smartest' and deepest, so their detachment from yesterday's sell-off should be considered an important signal. It would not be surprising if, later in the day, we see increased buying in stocks of strong companies after the recent downturn.
Buying in gold and gold mining stocks was even more remarkable. The long slump in the sector was interrupted yesterday with a jump of around 3% in the biggest gold stocks. Gold prices added 0.5%, gaining support shortly after falling below $1750.
As the previous months have shown, the ironclad support in gold prices is near the $1700 level. But it appears that active buyers have moved into the $1750 area.
Gold's ability to resist the general downtrend speaks to investor confidence that global central bank policies will remain soft enough to avoid triggering a global downward asset sell-off spiral.
Of course, one should bear in mind the risks of volatility ahead of Wednesday's Fed meeting. The outcome of the meeting and comments have, in theory, the potential to break or reinforce any trend (both long term bullish and short term bearish). In practice, however, the FOMC comes with very streamlined wording that does not cause a strong adverse reaction.
Still, the cautious gold bulls should keep in focus the area of $1800, which, if broken, would signal the breaking of the bearish correction. In case the sell-off in the stock markets intensifies further, the focus should be around $1700-1750. A break below that would signal submission of recent buyers and promises to trigger a deeper correction with near-term targets at $1500.
EUR/AUD Daily Outlook
Daily Pivots: (S1) 1.6130; (P) 1.6172; (R1) 1.6214; More...
Upside momentum in EUR/AUD is not too convincing as seen in 4 hour MACD. But further rise is still in favor with 1.6059 minor support intact, for retest 1.6434 high. With 1.5898 support intact, larger rise from 1.5250 is still in progress, and break of 1.6434 will confirm resumption, for 1.6988 fibonacci level. On the downside, break of 1.6059 minor support will turn bias back to the downside for 1.5898 structural support instead.
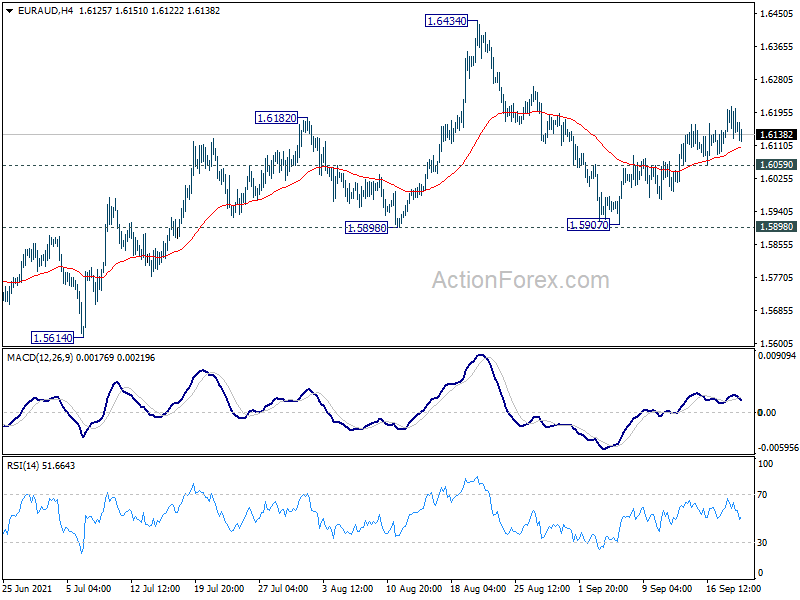
In the bigger picture, rise from 1.5250 medium term bottom is currently seen as a correction to the down trend from 1.9799 first. Stronger rise could be seen to 38.2% retracement of 1.9799 to 1.5250 at 1.6988 next. We'd tentatively expect strong resistance from there to limit upside, at least on first attempt. Meanwhile, break of 1.5898 support will indicate that the rebound has completed. Larger down trend from 1.9799 might be ready to resume through 1.5250 low.
NAS 100 Tests Key Demand Area
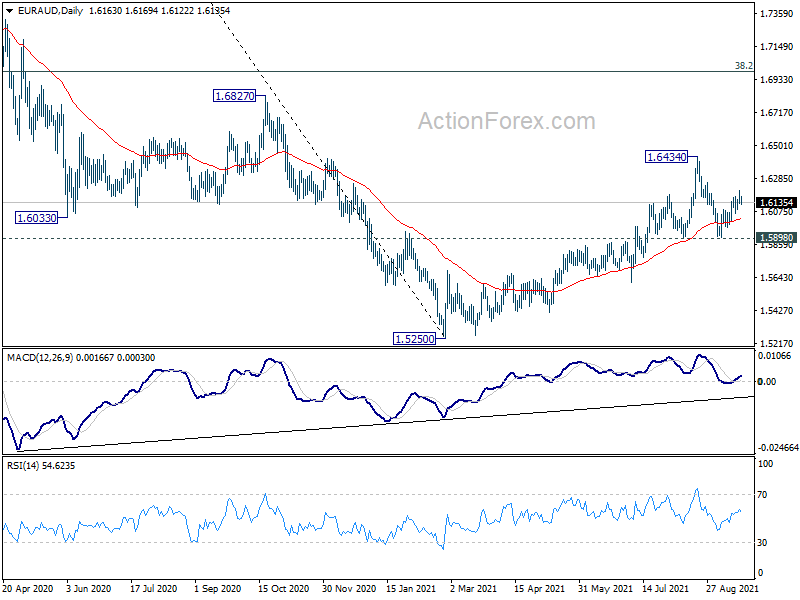
The Nasdaq 100 sees heavy profit-taking ahead of the Fed meeting this week.
The fall below the short-term floor at 15300 has triggered a fire sale on leveraged positions. Momentum traders have pushed the index towards the daily support around 14750.
A bearish breakout could jeopardize the bull run in the medium term. Buyers would then wait cautiously for price action to stabilize before stepping in.
An oversold RSI has caused a temporary rebound with 15280 as the closest resistance.
USD/NOK Breaks Resistance
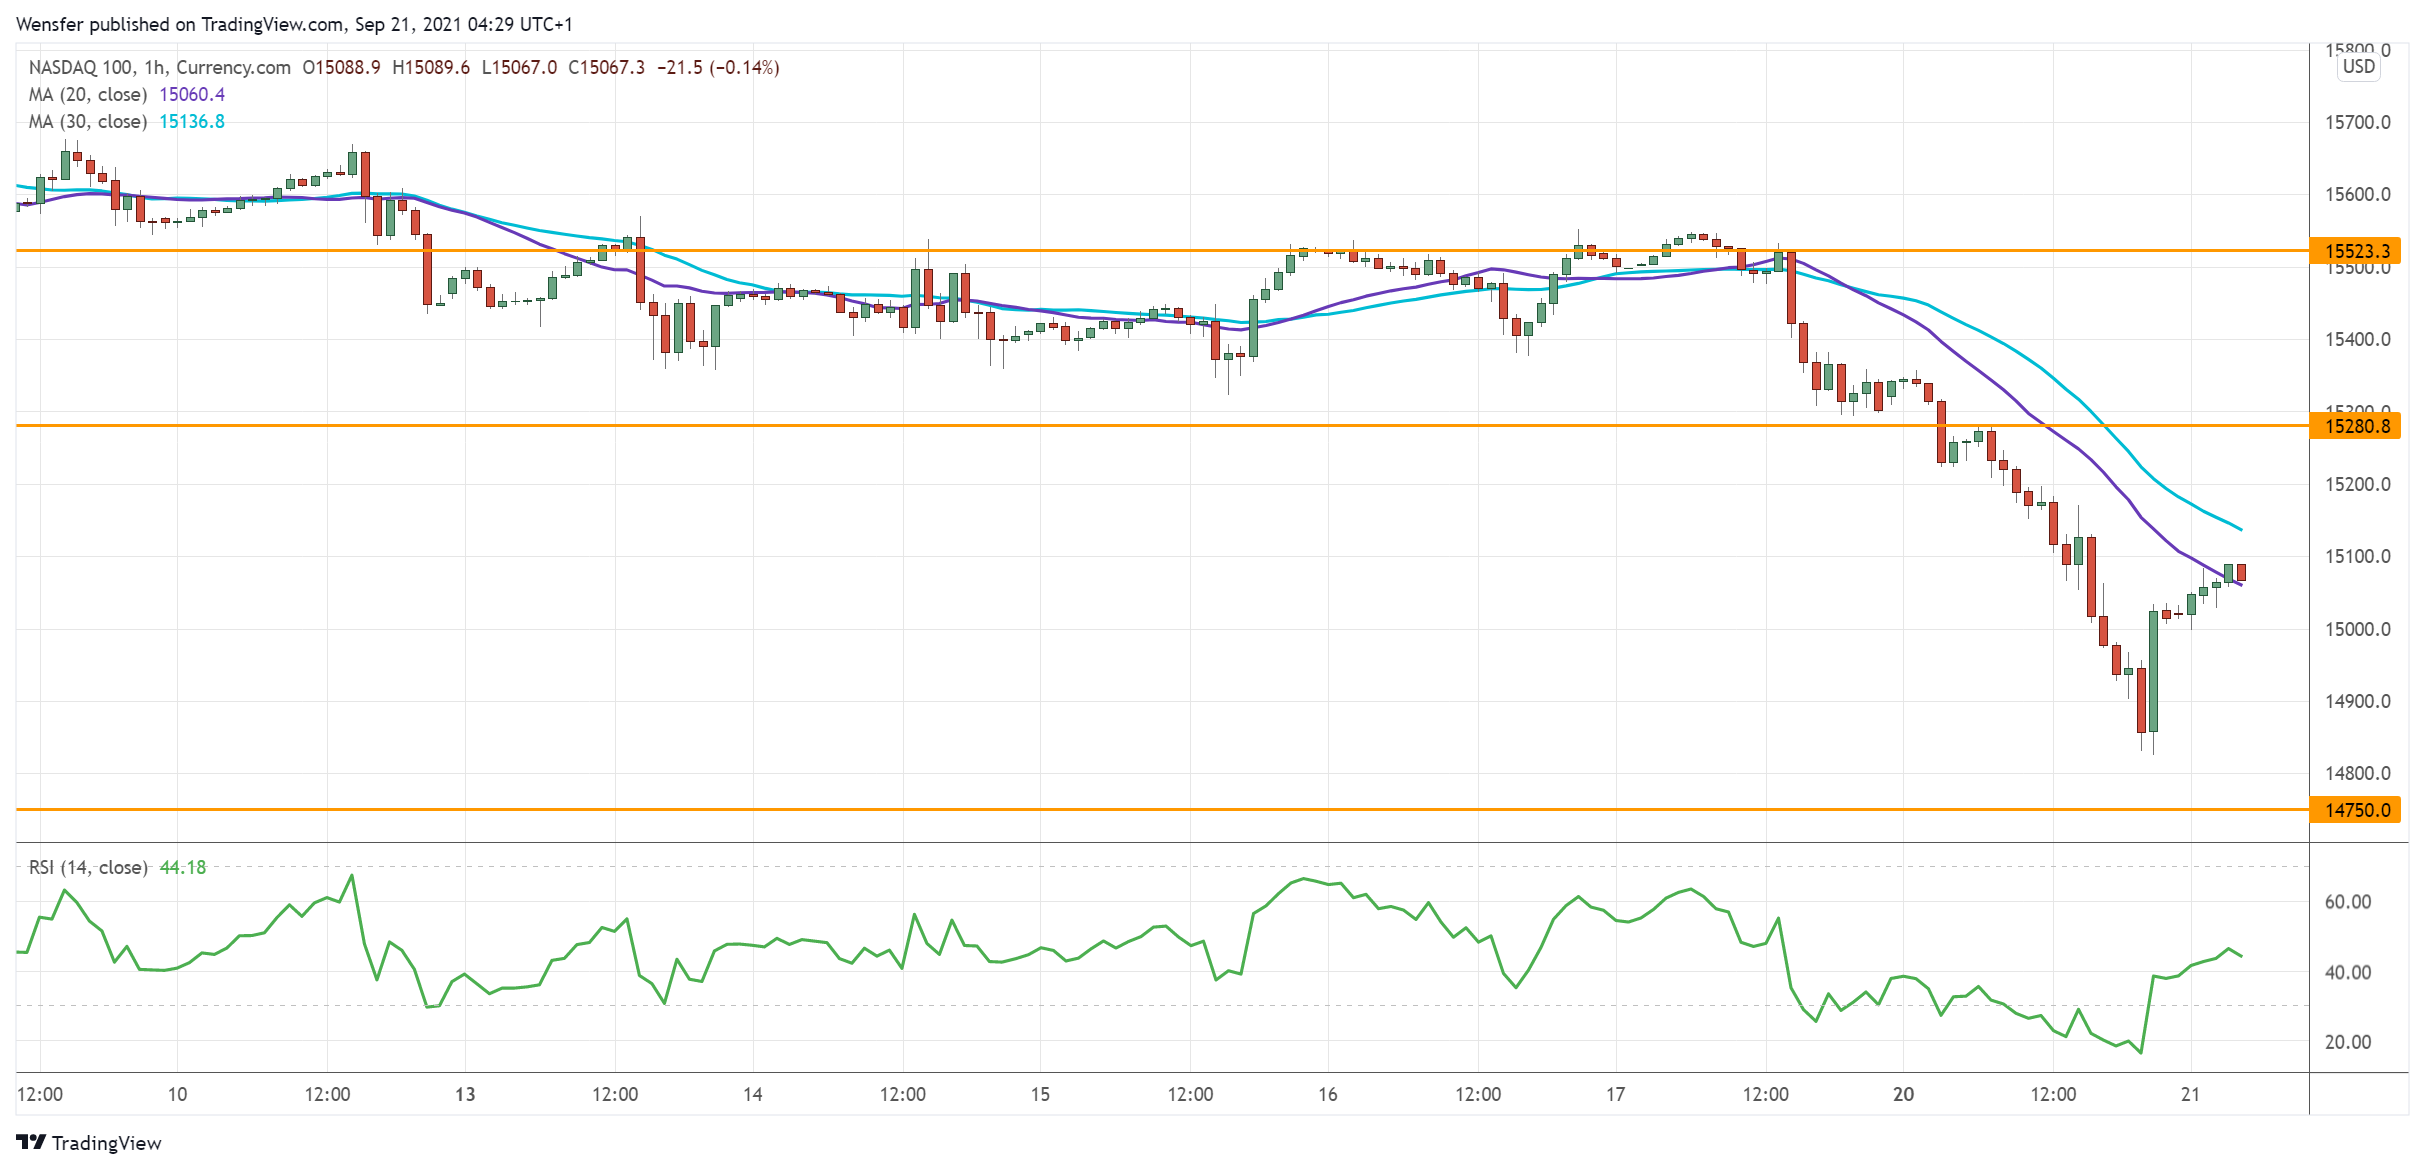
The Norwegian krone weakens as oil prices make a retreat.
The pair saw strong buying interest in the daily demand area near 8.5600. A breakout above 8.6500 has prompted sellers to cover their positions. A bullish MA cross indicates an acceleration in the rally.
8.8700 is a key resistance ahead and its breach may confirm a reversal above the psychological level of 9.0000. An overbought RSI may cause a limited pullback. 8.6500 is the immediate support. Further down, 8.5860 is critical in keeping the rebound valid.
AUD/USD Seeks Support
The Australian dollar struggles after cautious RBA meeting minutes.
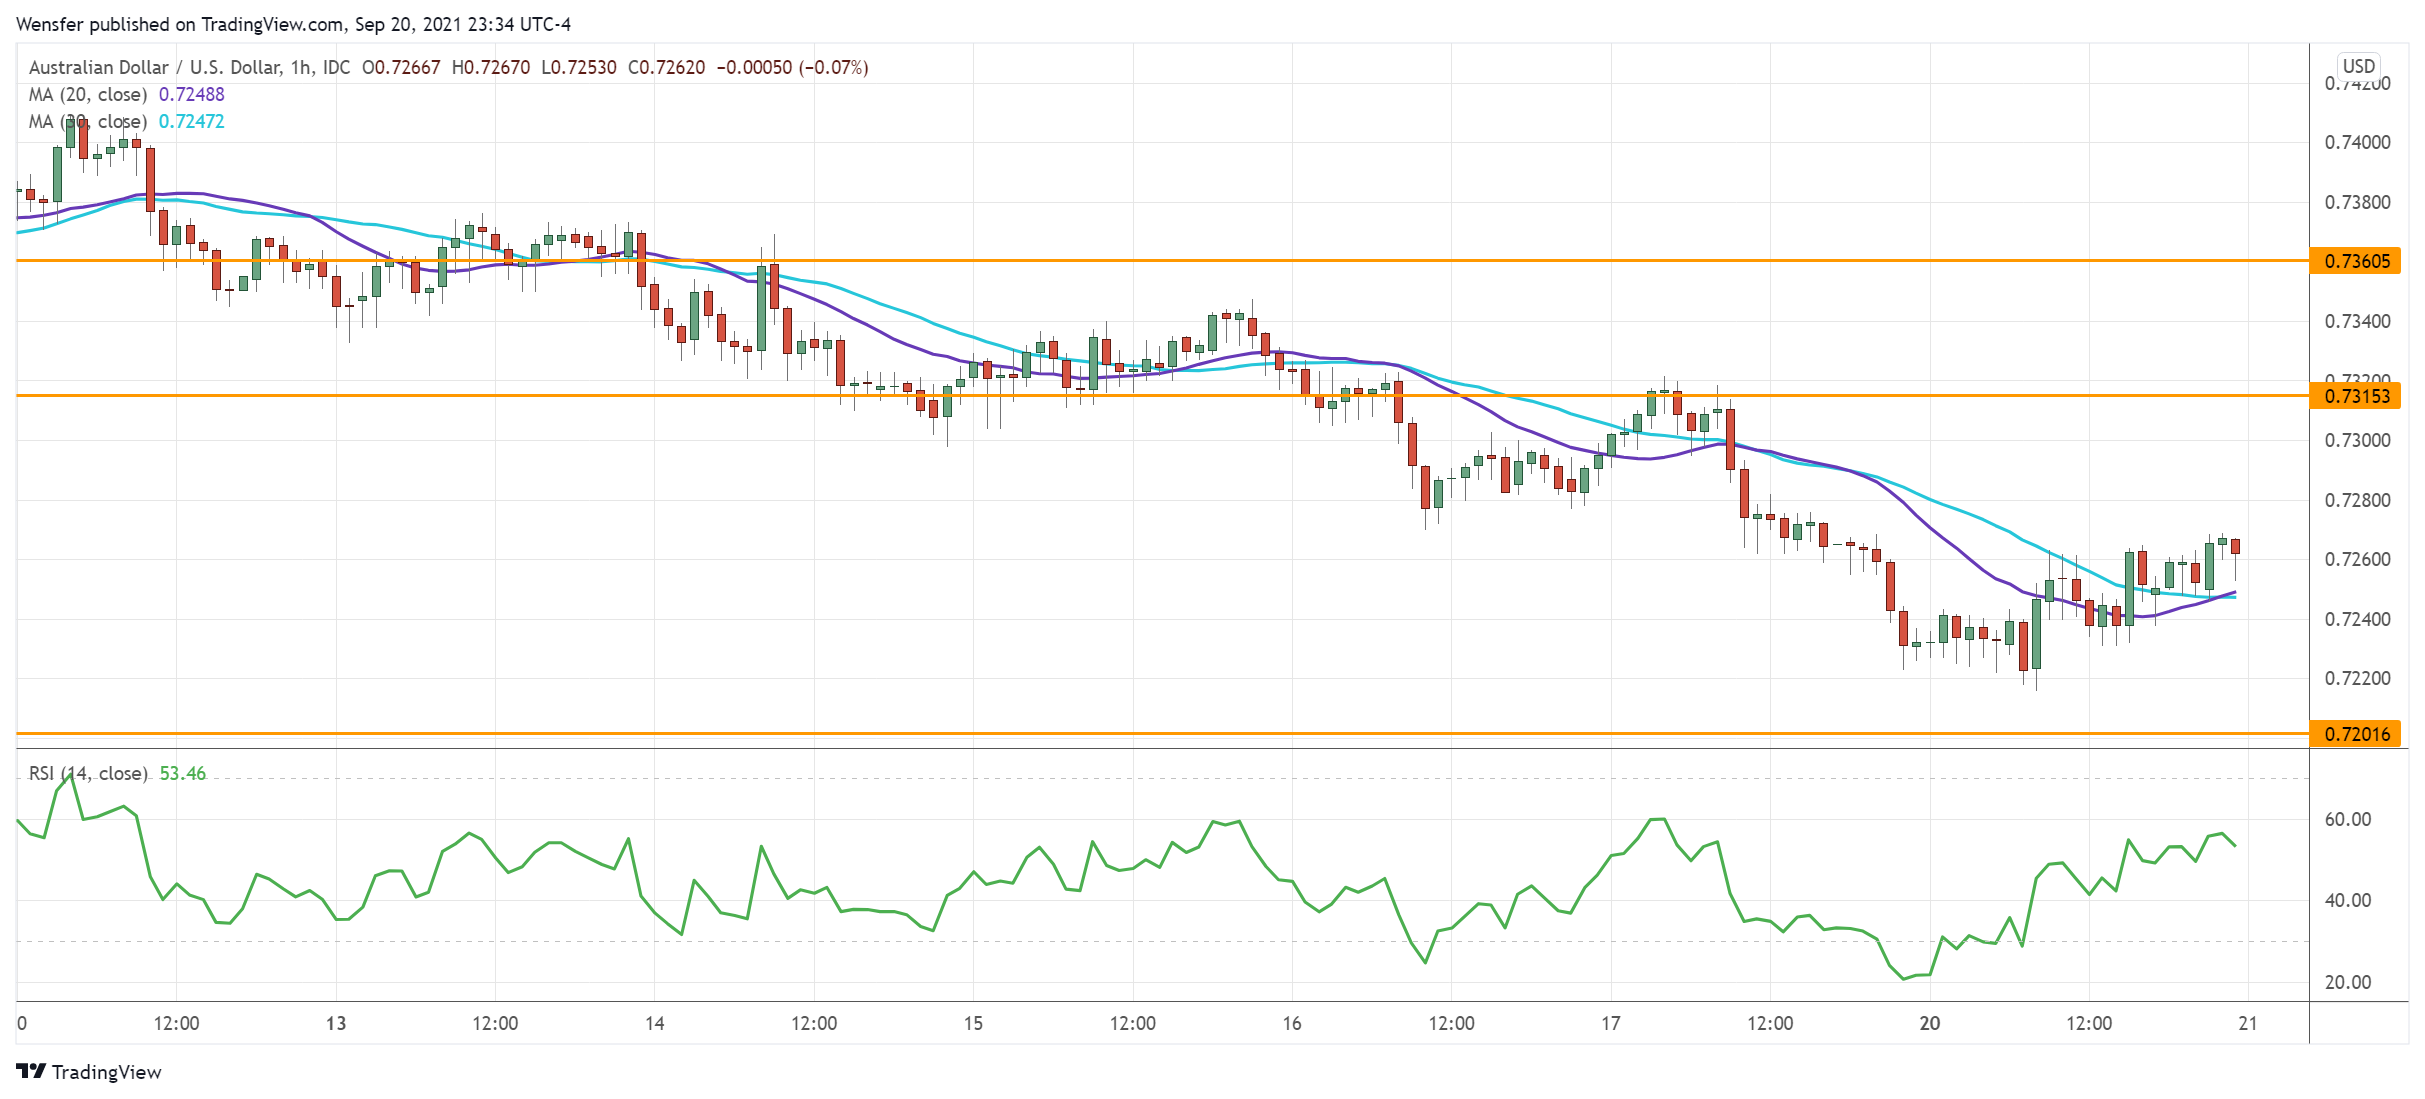
The pair had failed to bounce back from the demand zone around 0.7250 which lies on the 61.8% Fibonacci retracement level of the August rally. Those who bought the dip may reverse their positions, exacerbating the bearish mood in the process.
0.7200 would be the next target. Its breach could send the Aussie to the daily support at 0.7105. On the upside, buyers will need to take out the resistance at 0.7315 before they could attract more followers.
EUR/CHF Daily Outlook
Daily Pivots: (S1) 1.0858; (P) 1.0897; (R1) 1.0920; More....
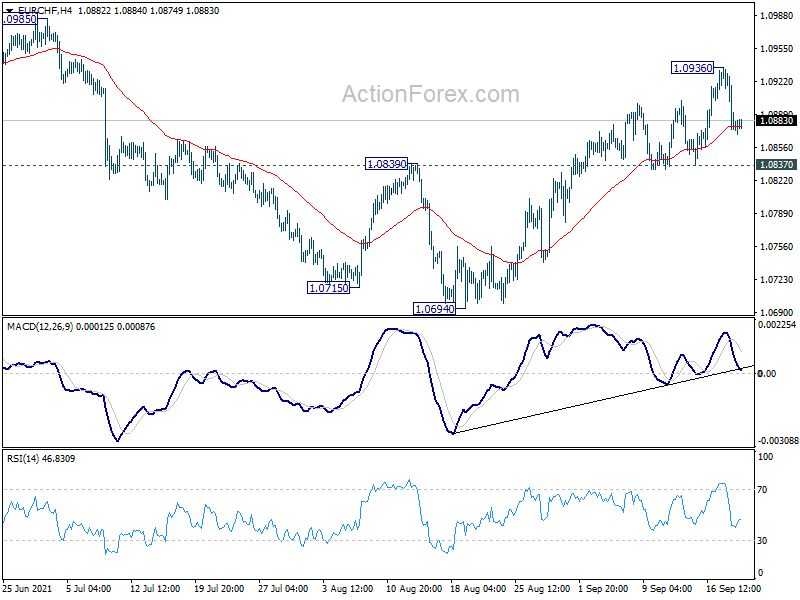
Intraday bias in EUR/CHF is turned neutral with current retreat from 1.0936 temporary top. Further rally remains in favor as long as 1.0837 support holds. On the upside, break of 1.0936 will resume the rise form 1.0694 to 1.0985 resistance first. Sustained break there will pave the way to retest 1.1149 high. On the downside, however, break of 1.0837 support will argue that the rebound has completed, and turn bias back to the downside for 1.0694 low.
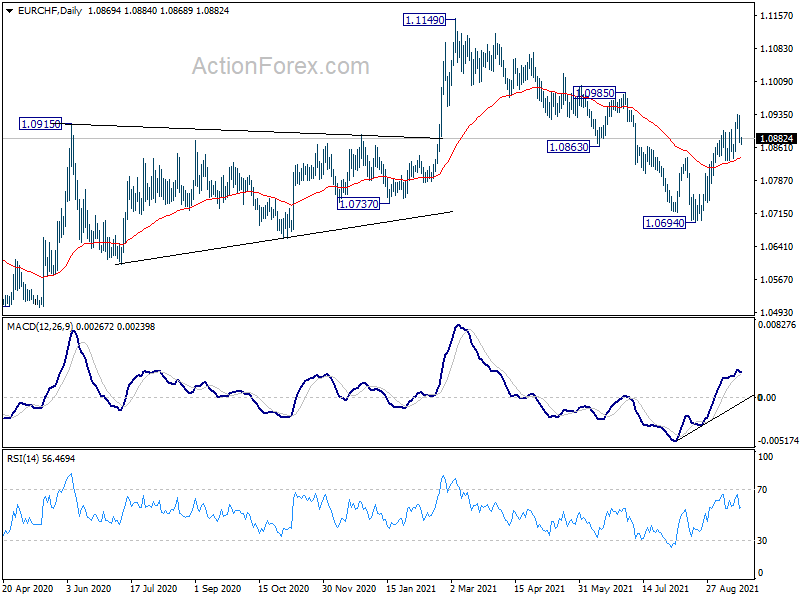
In the bigger picture, the stronger than expected rebound from 1.0694 and break of 55 week EMA (now at 1.0861) mixes up the medium term outlook. On the upside, break of 1.1149 will resume the whole rise from 1.0505 (2020 low). On the downside, break of 1.0694 will revive some medium term bearishness for 1.0505 and below.
Daily Technical Analysis
EUR/USD
Current level - 1.1734
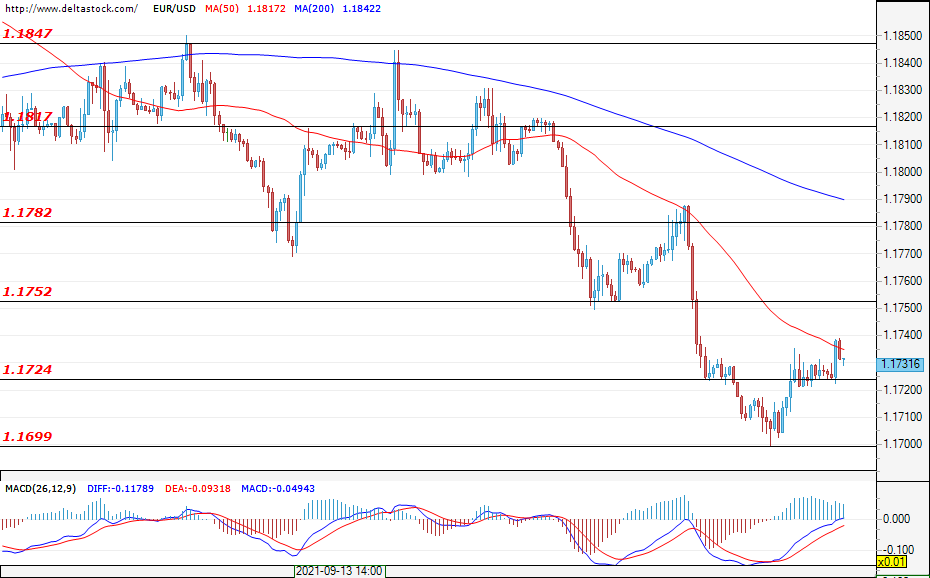
The support at around 1.1700 attracted buyers again, and the downward trend in the EUR/USD is currently in a pullback phase. If the level holds and the market goes into a range, it is possible for the trend to change direction. It is possible that the prices will rise to 1.1753, where if the bears enter, they would confirm the breach and the new resistance. The next major obstacle for the buyers is the level of 1.1782. If the sell-off continues and the 1.1700 zone is breached, the next target could be 1.1614, followed by 1.1400. On the higher time frames, the situation is rather neutral and the pair is trading in a range between 1.1900 and 1.1700, and a breach in either of these two zones would define the future direction of the market. Today, the main news in the economic calendar is the building permits data for the United States at 12:30 GMT.
| Resistance | Support | ||
| intraday | intraweek | intraday | intraweek |
| 1.1752 | 1.1847 | 11724 | 1.1662 |
| 1.1817 | 1.1880 | 1.1700 | 1.1600 |
USD/JPY
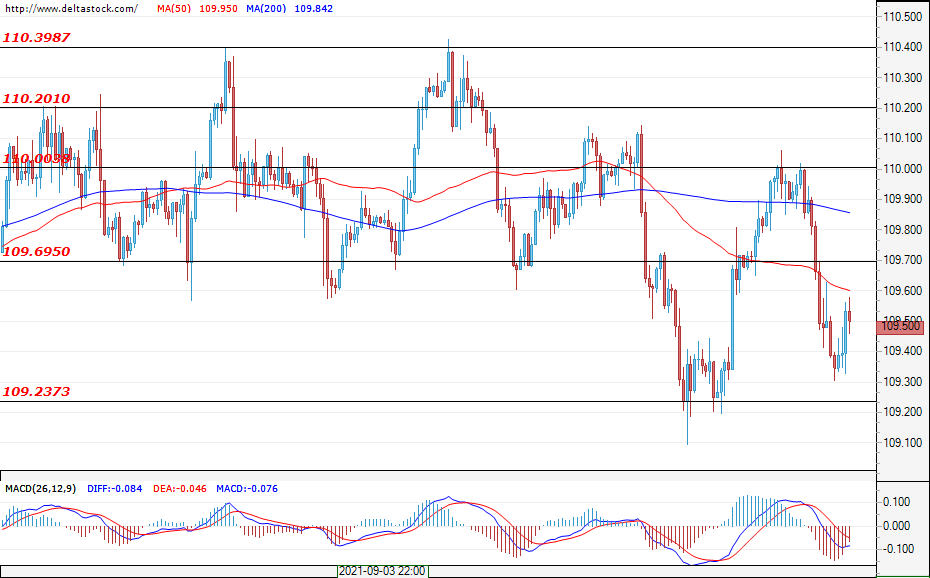
Current level - 109.50
The currency pair managed to secure a second breach of the support at 109.60, and the first support is the area at around 109.20. But while the bears are managing to make new lower highs, the buyers are still limiting the plunge at around 109.20. It is desirable that prices bounce away from the resistance of 109.60 in order to confirm the breach of the level and the movement to continue towards 109.20 and, subsequently, 108.80. If this scenario does not materialise, it is possible for trading to continue in the range between 109.20 and 110.20. The market could then be expecting a catalyst for a directional movement, and tomorrow's decision of the Central Bank of Japan (03:00 GMT) on interest rates may be just that.
| Resistance | Support | ||
| intraday | intraweek | intraday | intraweek |
| 109.69 | 110.20 | 109.23 | 108.80 |
| 110.00 | 111.40 | 108.80 | 108.00 |
GBP/USD
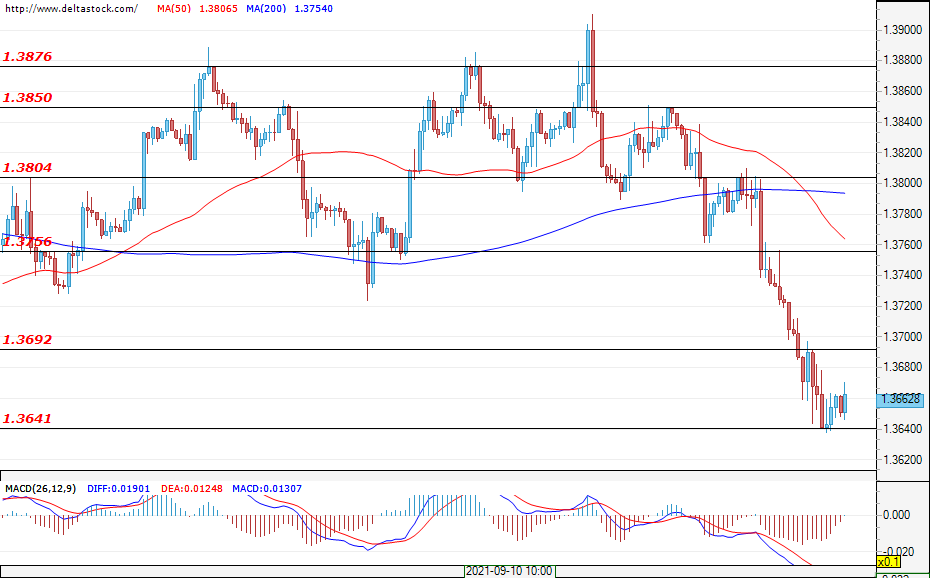
Current level - 1.3662
The Cable sell-offs remained limited above the support of 1.3640. The market is likely to enter a retracement phase, with the first expected resistance being found at around 1.3692. A more significant obstacle for the bulls is expected at around the 1.3750 zone. In case the bearish pressure continues, a new test of the support at 1.3600, which is coming from the higher time frames, is possible today. A breach of this zone would significantly deepen the declines towards 1.3450 and even 1.3340.
| Resistance | Support | ||
| intraday | intraweek | intraday | intraweek |
| 1.3692 | 1.3804 | 1.3640 | 1.3600 |
| 1.3756 | 1.3850 | 1.3600 | 1.3450 |
Oil And Gold Rally, Bitcoin Sinks, In Asia
Oil rallies in Asia after overnight sell-off.
Oil, along with commodities in general, was crushed in the overnight session as China-driven risk aversion fears swept markets. Brent crude fell by 1.45% to $74.20, and WTI fell by 2.05% to $70.40 a barrel. Sentiment has improved in Asia today though, with the commodity space rallying generally, as dip-buyers appear after yesterday’s sell-off. Brent crude and WTI have added 0.50% to $74.55 and $70.80 a barrel respectively.
Although prices have recovered in Asia, I suspect that short-term sentiment remains fragile as it is elsewhere and is vulnerable to headline driven moves. A series of lower daily highs on both contracts suggests that we could still see more downside pressure ahead of China returning tomorrow, and with it, hopefully more clarity surrounding its intentions for Evergrande.
Brent crude has resistance between $75.50 and $76.00 a barrel with support at $73.50 a barrel. With sentiment fragile generally, a deeper correction to $72.00 a barrel, home to its 50 and 100-day moving averages (DMAs), cannot be ruled out. WTI has resistance between $72.00 and $73.00 a barrel, a congestion zone of daily highs. It has support initially at its overnight low at $69.90 a barrel. Like Brent crude, losses could extend to its 50 and 100-DMAs at $69.45 a barrel.
Gold loves a crisis.
Gold stabilised overnight as the risk aversion wave sweeping financial markets, finally gaining some haven tailwinds which lifted it to a positive close in New York. Gold finishing the session 0.55% higher at $1764.00 an ounce. In Asia, the tentative rally in commodities and equities has seen gold fade slightly to $1762.00 an ounce.
Depending on how the Evergrande situation plays out with markets, gold could continue finding safe-haven buyers, or buying interest could evaporate once again as quickly as it appeared, particularly if the China government soothes nerves when China returns to work tomorrow. Either way, if the FOMC gives concrete guidance on a tapering timeline at Wednesday’s meeting, gold will resume its downward direction, as the former would inevitably lead to a stronger US Dollar.
Gold continues to have resistance just above at $1770.00, followed by the far more formidable $1780.00 an ounce region. Even if risk sentiment remains negative, it is hard to see gold recapturing the latter. Gold has support at $1742.00, followed by $1720.00 an ounce, followed by longer-term support in the $1675.00 region. Given gold’s recent price action, its path of least resistance remains lower despite the temporary respite.
Bitcoin isn’t happy.
Bitcoin has fallen nearly 11.0% over the past 24 hours, as risk aversion elsewhere saw the blockchain herd stampede towards a very small exit door. This kind of behaviour is typical in the crypto space where liquidity evaporates causing strong directional moves, up or down before the haters start.
Crypto’s has a few headwinds to contend with overnight. President Erdogan of Turkey said he was at war with them. Meanwhile, Coinbase acceded to SEC pressure and pulled its allegedly US Dollar backed un-stable coin lending offering.
Bitcoin has seen off a bearish pennant formation last week and looked ready to resume its rally through $50,000. However, yesterdays massive tumble saw it plummet through two-month support at $44,450.00, crashing as low as $40,200.00 before recovering to $42.400.00 in Asia.
Like gold, Bitcoin’s rally looks like a dead cat bounce, and it remains vulnerable to more disorderly sell-offs in the current environment. The breakout point at $44,450.00 is initial resistance and it needs to recapture this quickly to restore confidence. The 100-DMA at $40,800.00 held on a daily basis overnight and forms a zone of support with $40.000,00. A failure of $40,000.00 on a closing basis signals a potential capitulation to $30,000.00.