Sample Category Title
Gold Analysis: Tests Support Zone
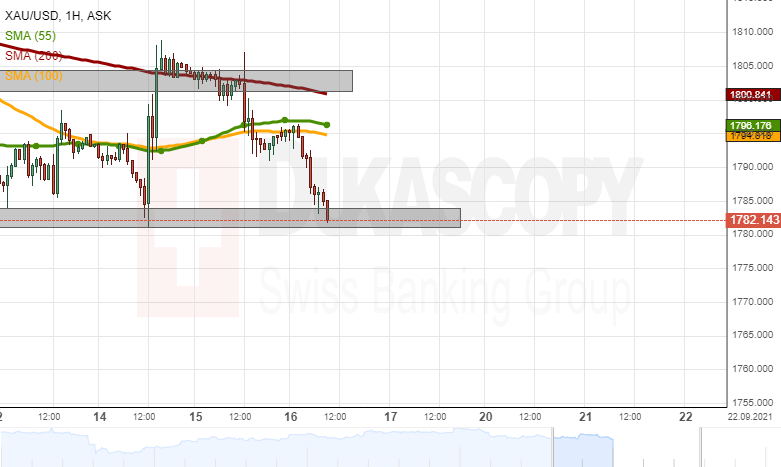
The yellow metal''s price managed to pierce the 1,805.00 level and the resistance zone below it twice. However, the resistance held and a decline started at mid-day on Wednesday. By the middle of Thursday's European trading hours, the price had reached the support of the 1,781.00/1,784.00 zone, which has kept the price up since September 8.
In the case that the metal passes the 1,781.00/1,784.00 support zone, the bullion might look for support in round price levels before reaching the support of the 1,750.00 mark. Namely, the zone above the 1,775.00 level provided support in late August.
On the other hand, a recovery of the metal could once again reach the resistance zone that is located from 1,800.00 to 1,805.00. Meanwhile, some resistance might be found in the 55 and 100-hour simple moving averages. However, the SMAs have been failing to notably impact the price throughout September.
Are Investors Sleeping On Systematic Risk In China?
- Chinese real estate titan heads for default - will it hit the economy?
- Wall Street stages solid comeback, oil keeps going
- US retail sales to inject some volatility into quiet FX market
Markets downplay China contagion
It’s time to talk about China. The situation is getting dicier as the nation’s second-largest property developer - Evergrande - is on the verge of default. Trading in the company’s onshore bonds was suspended today, which is usually a prelude to bankruptcy. Its total liabilities boil down to around $300bn, or 2% of China’s GDP.
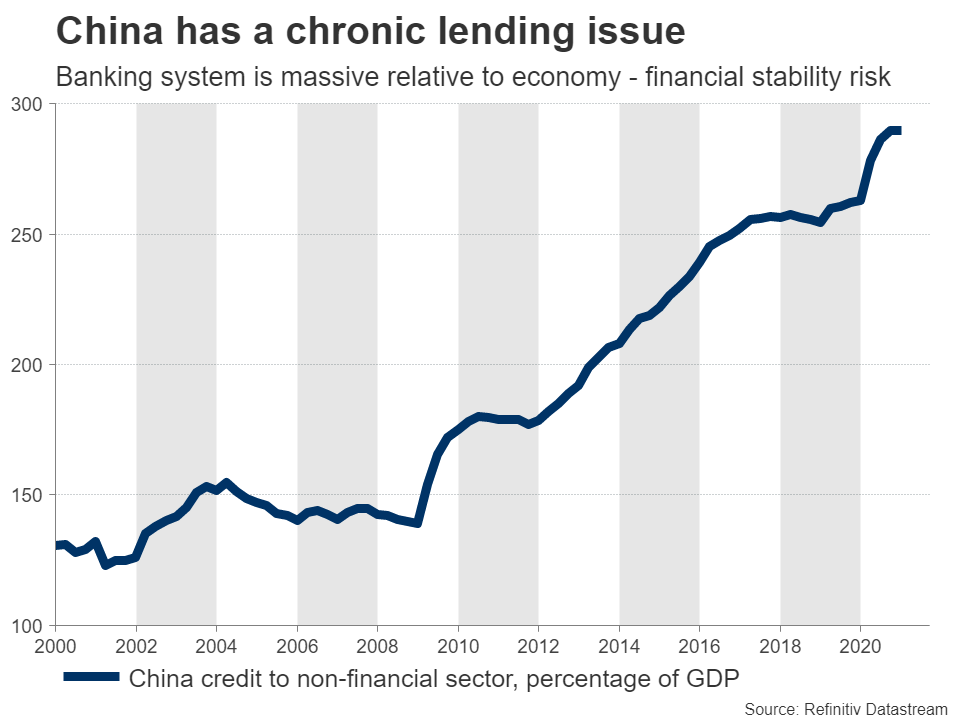
Now that doesn’t sound dramatic, but it is when leverage comes into play. China’s real estate sector accounts for nearly one-third of the entire economy while the banking sector is currently almost three times as large as GDP, which means banks are levered up to the brim with private debt.
So you have a vulnerable system with tremendous private debt and banking leverage, and now a company that was flagged by the Chinese central bank back in 2018 as posing systematic risks to the entire economy is about to default. It’s easy to imagine a domino effect that ripples through markets as financial institutions that have exposure to Evergrande suffer serious damage.
Of course, Beijing won’t let that happen. The private sector might be drowning in debt but the government has plenty of dry powder and cards to play - it could stop any domino effect at its root by bailing out the most fragile players.
But when you combine the fragility in the Chinese system with signs that economic momentum is already crumbling and the regulatory crusade that Beijing has embarked on, it’s one risk too many. Policymakers might be able to stop a default cascade, but they can’t revive growth without making the nation’s leverage problem even worse.
This might be the most dangerous ‘grey swan’ risk for the global economy right now. The fallout has been contained to stock markets in China and Hong Kong so far, but if the situation deteriorates any further, the next levee to break might be China-sensitive currencies like the Australian and New Zealand dollars.
Wall Street bounces back, aussie strugglers
Over in America, Wall Street ended with broad gains on Wednesday, with the S&P 500 gaining nearly 0.9%. The 50-day moving average worked its magic once again, with the index recoiling higher after it tested that crucial indicator. There wasn’t much in terms of news to pin the move on.
President Biden met with Manchin and Sinema yesterday - the two most conservative Democrats in the Senate - in an attempt to secure their support for his transformative $3.5 trillion spending bill. He is clearly allocating most of his political capital to this spending package. This bill is a double-edged sword for the market as with great social spending also comes a greater tax burden, most notably on corporations and capital gains.
Elsewhere, oil prices remain in an upward trajectory, capitalizing on another drawdown in US inventories and the aftermath of the recent hurricanes, alongside hopes that surging electricity prices across the world will ultimately generate a shift towards crude.
US retail sales to cool, aussie struggles
As for today, all eyes will be on the latest edition of US retail sales. Forecasts point to a second straight month of declines, which sounds worrisome, especially considering the sharp decline in consumer confidence metrics lately.
That said, the retail sales uptrend this year has been absolutely breathtaking, so a minor retreat is more than natural. It wouldn’t be a sign that the US consumer is rolling over, but rather that things are normalizing.
Finally, the Australian dollar is under pressure today after some disappointing jobs data. The unemployment rate only fell because the labor force participation rate collapsed, which suggests that people aren’t actively looking for work during the lockdowns.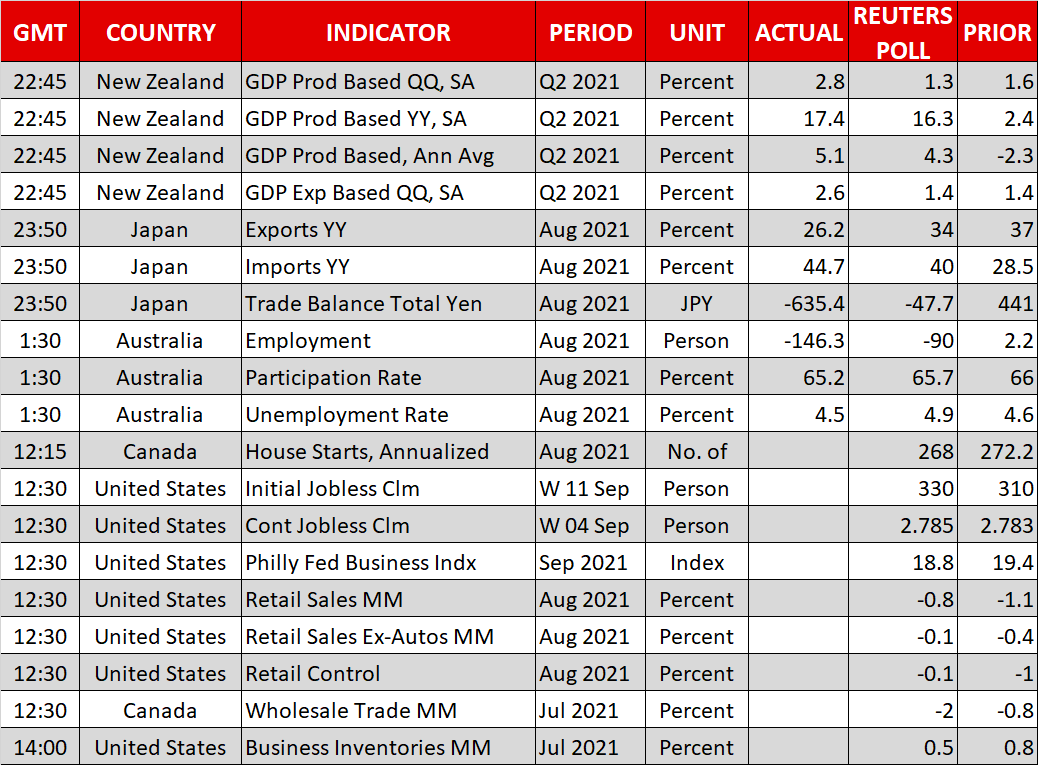
USD Remains Rather Stable In A Rather Slow Market
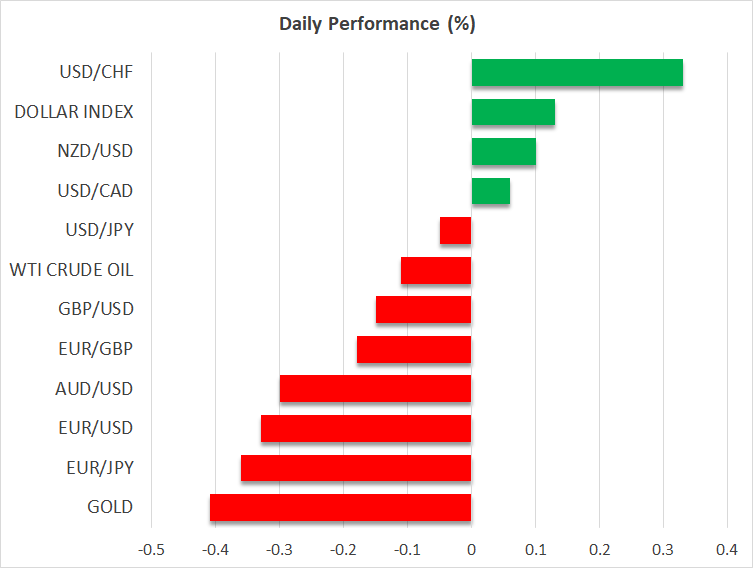
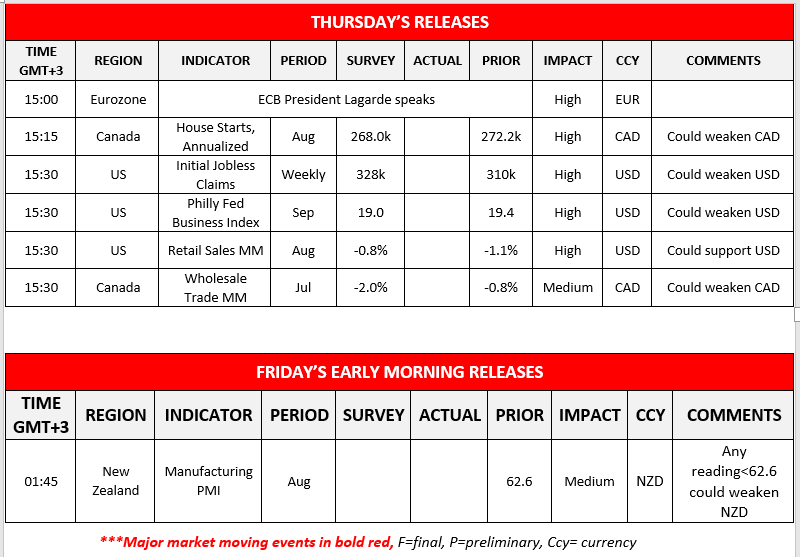
The greenback remained relatively stable yesterday against a number of its counterparts, as the market’s attention shifts to the FOMC’s interest rate decision next week which could provide further clues regarding the bank’s intentions on tapering its stimulus. US stockmarkets on the other hand, gained a bit as investors seem to overcome somewhat their worries about the prospects of the US economy’s recovery, yet the movement was still unconvincing. Gold edged a bit lower, yet overall, the precious metal seems to maintain a sideways movement also driven by USD’s inactivity and given that US yields remained little changed over the day. Today we may see traders keeping an eye out for the US financial releases as at the same time we get the weekly initial jobless claims figure, the Philly Fed Business index for September and the US retail sales for August, covering the fields of employment, consumption, and manufacturing. The readings are forecasted to be lukewarm which may weaken the USD somewhat should the forecasts be met.
The USD index maintained a sideways movement between the 92.75 (R1) resistance line and the 92.30 (S1) support level. We tend to maintain our bias for a sideways movement, given that the RSI indicator below our 4-hour chart runs along the reading of 50, implying a rather indecisive market. Should the market display a selling interest for the index, we may see it breaking the 92.30 (S1) support line which served the pair well as a support line on the 10th and 14th of September and aim for the 91.75 (S2) support level. On the other hand, should the USD be in high demand, we may see the index breaking the 92.75 (R1) resistance line which held its ground on the 8th of September and aim for the 93.20 (R2) resistance level.
CAD gains on accelerating CPI
The Loonie gained against the USD yesterday given that Canadian Core CPI rates accelerated for the month of August and the core CPI rate reached levels not seen in thirty years on a year-on-year level. The acceleration of the CPI rates may boost BoC’s hawkishness and thus the bank may proceed with further tapering of its QE program. On CAD’s fundamentals the uncertainty regarding the Canadian election result on the 20th of September seems to be ongoing and may undermine the Loonie if continued and intensified. On the flip side oil prices rose yesterday providing additional support for the CAD, as a wider than expected drawdown was reported in the US crude oil inventories, while storm Nicholas seems to have receded. Today we expect CAD traders to keep a close eye over the Canadian financial releases yet oil prices along with fundamentals could also play a key role in CAD’s direction.
USD/CAD dropped yesterday as the Loonie tended to gain and broke the 1.2650 (R1) support line, now turned to resistance. We tend to keep a bias for a sideways motion, given that the pair seems to have a playful mood around the 1.2650 (R1) level and the RSI indicator below our 4-hour chart is just below the reading of 50. Should the bulls take the lead, we may see the pair breaking the 1.2650 (R1) resistance line and aim if not reach the 1.2785 (R2) resistance level, which capped the pair’s upward movement on the 20th of July. Should the bears be in charge, we may see the pair breaking the 1.2495 (S1) support line on the 5th and 11th of August, as well as the 3rd of September, aiming for lower grounds.
Other economic highlights today and the following Asian session:
During today’s late European session, we note the planned speech of ECB President Lagarde and a bit later we get from Canada the number of House starts for August and the wholesale trade for July, while from the US we get the weekly initial jobless claims, the Philly Fed Business index for September and the Retail sales growth rate for August. During Friday’s Asian session we get New Zealand’s Manufacturing PMI for August.
USD Index H4 Chart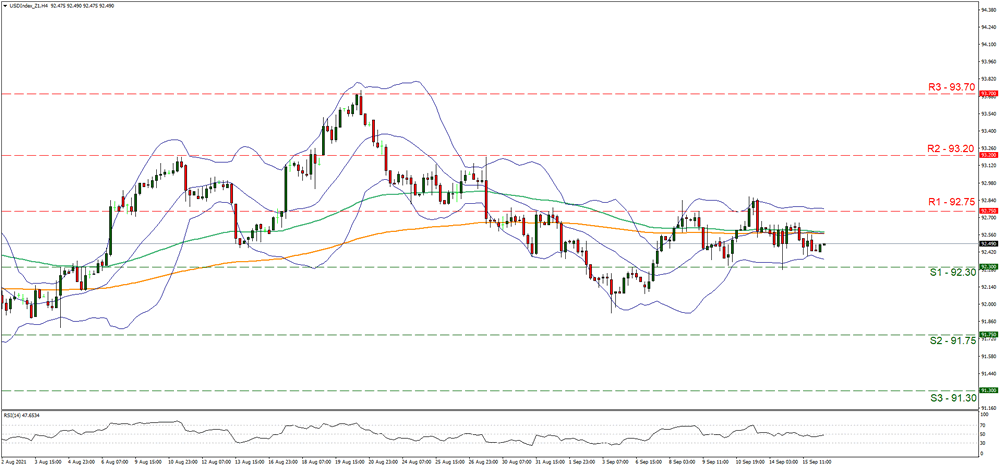
Support: 92.30 (S1), 91.75 (S2), 91.30 (S3)
Resistance: 92.75 (R1), 93.20 (R2), 93.70 (R3)
USD/CAD H4 Chart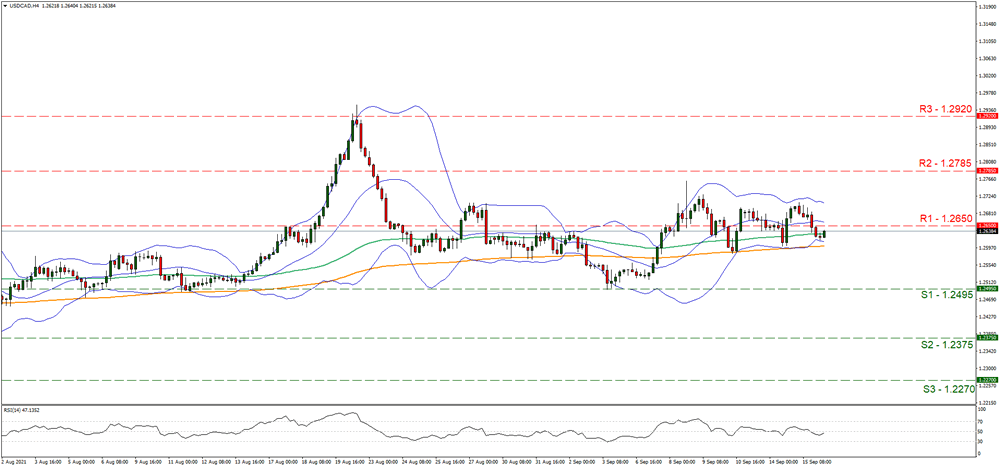
Support: 1.2495 (S1), 1.2375 (S2), 1.2270 (S3)
Resistance: 1.2650 (R1), 1.2785 (R2), 1.2920 (R3)
Investors Expect A Reduction Of The Quantitative Easing Program In The US, Europe, And UK
The US industrial production increased to pre-pandemic levels, indicating a further economic recovery. All figures indicate that the US economy is in a good position, and it doesn’t make sense for the Federal Reserve to maintain the stimulus program in such volumes. Therefore, there is a high probability that the Fed will announce a gradual cutting of the QE program starting from November at the meeting on September 22 (this year). At the same time, JPMorgan & Chase Co. reduced the estimate of the US economic growth in the third quarter from 7% to 5%.
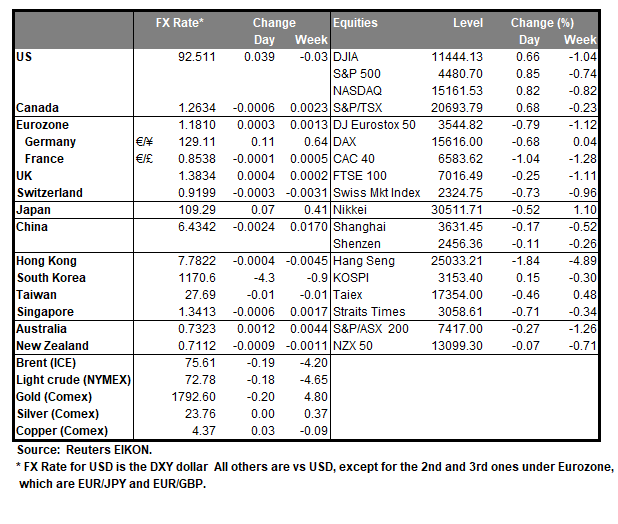
The US stock market closed Wednesday’s trading in the green zone. Shares of energy and financial companies, as well as technology companies, were the leaders of the growth. Dow Jones Industrial Average increased by 0.68%; S&P 500 added 0.85%; NASDAQ jumped by 0.82%. Quite possibly, this is the last wave of growth before the beginning of the correction.
The US hotels will lose $59 billion in revenue this year due to a lack of business travel. The reports for the 3rd quarter are expected to be weak.
European stock indices closed in the red zone yesterday. The British FTSE 100 index decreased by 0.25%; the German DAX lost 0.7%; the French CAC 40 decreased by 1%; the Spanish IBEX 35 lost 1.65%; the Italian FTSE MIB decreased by 1%. Weak statistical data from Great Britain and China were the triggers for the fall. The European Commission announced the plans to create a new "ecosystem" for chip production to keep the EU competitive and self-sufficient after the global semiconductor shortage demonstrated the danger of relying on suppliers from Asia and the United States.
The semiconductor shortage is decreasing platinum-group metal prices as investors are preparing for a long-term auto manufacturing crisis.
The US crude oil inventories have been decreasing for the sixth week in a row, and gasoline inventories fell to their lowest level since November 2019. Amid such shortages, oil showed an increase in prices yesterday. The threat of a new hurricane in Texas also contributed to the rise in prices.
In China, construction investment decreased by 3.2%, and the retail sales index decreased to 2.5%. The China Evergrande Group debt crisis is also putting pressure on the quotes. As a result, major stock indexes are declining in Japan, China, and Hong Kong. Macau casino stocks are falling as Chinese officials tightened control over the gaming center.
China urged the US, Britain, and Australia to "shed their Cold War mentality and ideological prejudices" after, on Thursday, they announced a new security pact that involves an 18-month plan to provide Australia with nuclear submarines. Although none of the leaders mentioned China, there are many of those who understand the pact to be a response to Beijing's expansionism and aggression in the South China Sea and toward Taiwan.
New Zealand's GDP increased to 2.8%. The data was better than economists’ expectations and increased the probability of an interest rate hike in the near future. But home prices are growing rapidly, despite the government reform. Australia's unemployment rate fell to 4.5% (previous – 4.6%).
Main market quotes:
- S&P 500 (F) 4,480.70 +37.65 (+0.85%)
- Dow Jones 34,814.39 +236.82 (+0.68%)
- DAX 15,616.00 −106.99 (−0.68%)
- FTSE 100 7,016.49 −17.57 (−0.25%)
- USD Index 92.49 −0.13 (−0.15%)
Important events for today:
- New Zealand GDP (q/q) at 01:45 (GMT+3);
- Australia Employment Change (m/m) at 04:30 (GMT+3);
- Australia Unemployment Rate (m/m) at 04:30 (GMT+3);
- ECB President Christine Lagarde’s Speech at 15:00 (GMT+3);
- US Retail Sales (m/m) at 15:30 (GMT+3);
- US Philadelphia Fed Manufacturing Index (m/m) at 15:30 (GMT+3);
- US Initial Jobless Claims (w/w) at 15:30 (GMT+3);
WTI Futures’ Positive Impetus Under Pressure
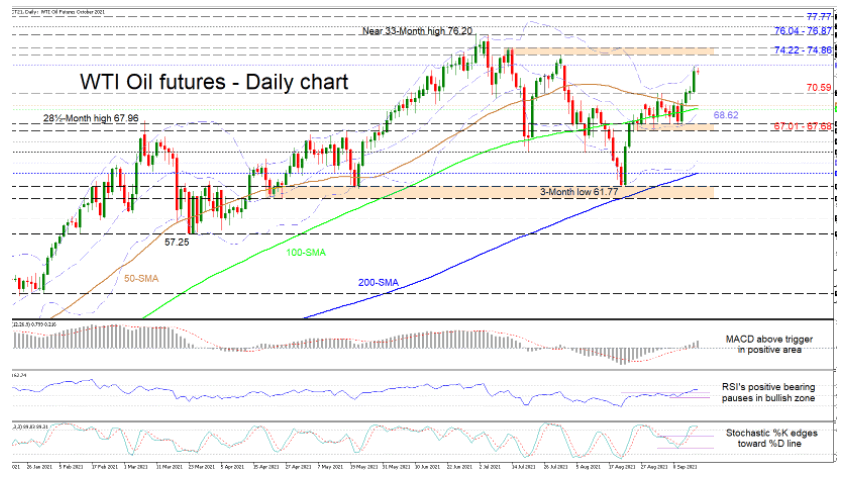
WTI oil futures fresh upside drive off the 67.68 level seems to have run out of fuel near the upper Bollinger band at 73.22. The simple moving averages (SMAs) are feeding the positive structure even though sellers are now making a stand.
The short-term oscillators are reflecting slight weakness in bullish forces. The MACD is strengthening above its red trigger line in the positive zone, while the RSI is marginally faltering in bullish territory. The stochastic lines in the overbought section are also signalling some limitations for positive price action. However, they have yet to confirm an increase in downward intensities.
If the commodity continues to lose steam, initial support could arise at the 70.59 inside swing high. Should the price pullback evolve further, the region between the 50- and 100-day SMAs at 69.45 and 69.06 respectively may provide some footing for the black liquid. Diving beneath these averages, sellers could meet the mid-Bollinger band at 68.62 before challenging the support base of 67.01-67.68.
Otherwise, if buyers resurface, primary upside friction could develop from the upper Bollinger band at 73.22. Extending past the upper Bollinger, nearby resistance may then emanate from the resistance band of 74.22-74.86 formed by highs over the second part of July. The next resistance obstruction could arise between the 76.04 barrier and the October 2018 rally peak of 76.87, an area that also includes the fresh near 33-month peak of 76.20. From here, more gains may target the 77.77 high, achieved in November 2014.
Summarizing, WTI oil futures are sustaining a positive demeanour above the 70.59 level and the 50- and 100-day SMAs. A break above 74.86 could boost upside momentum, while a break below the 67.00 hurdle may strengthen negative tendencies.
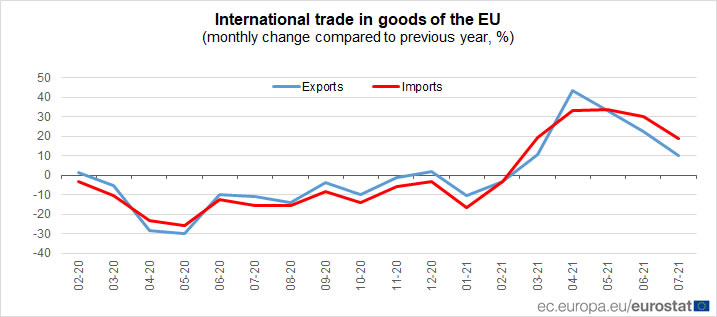
Eurozone exports rose 11.4% yoy in Jul, imports rose 17.1% yoy
Eurozone exports of goods to the rest of the world rose 11.4% yoy in July to EUR 206.0B. Imports rose 17.1% yoy to EUR 185.3B. As a result, Eurozone recorded a EUR 20.7B surplus in trade, Intra-Eurozone trade rose 16.8% yoy to EUR 179.7B.
In seasonally adjusted term, Eurozone exports rose 1.0% mom while imports rose 0.3%. Trade surplus widened from EUR 119.0B to EUR 13.4B, below expectation of EUR 16.8B. Intra-Eurozone trade rose from EUR 175.5B to EUR 178.0B.
The Analytical Overview Of The Main Currency Pairs
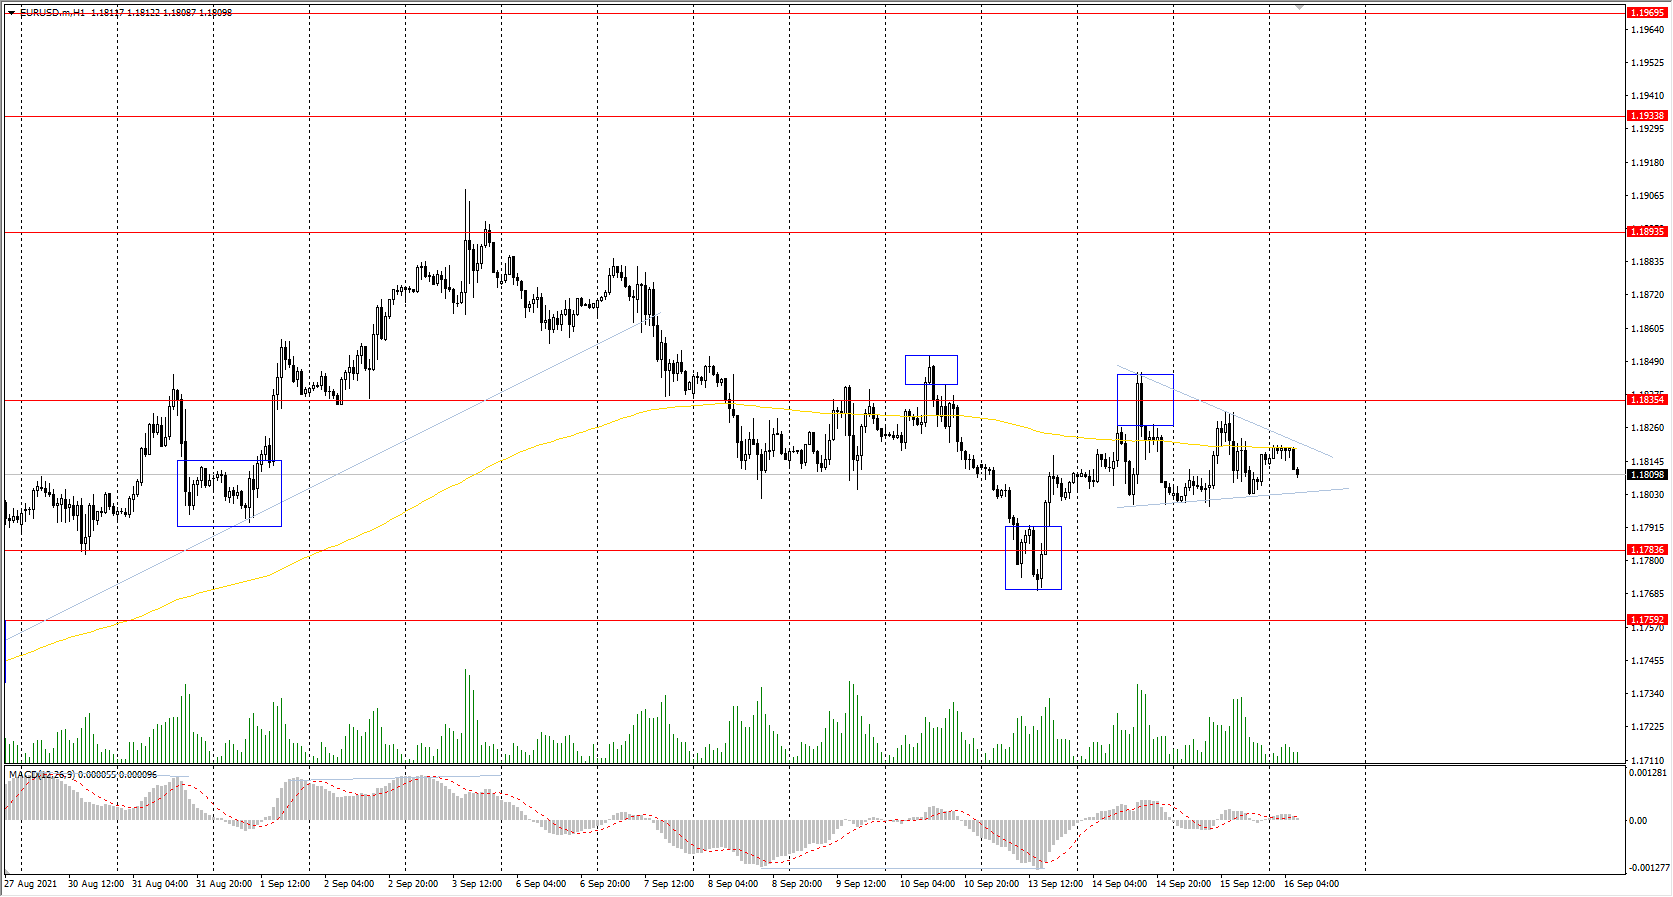
The EUR/USD currency pair
Technical indicators of the currency pair:
Prev Open: 1.1803
Prev Close: 1.1815
% chg. over the last day: +0.10%
Industrial production in Europe increased by 1.5% compared to the previous month. The European economy is also on the way to recovery, so the ECB has already started preparations for reducing the bond-buying program. Investors are waiting for the ECB head Christine Lagarde's speech today and for the inflation data in Europe to be published tomorrow.
Trading recommendations
Support levels: 1.1783, 1.1759, 1.1704, 1.1620
Resistance levels: 1.1835, 1.1894, 1.1934, 1.1969
From the technical point of view, the general trend on the EUR/USD currency pair is bullish. The MACD indicator has become inactive. It is clearly visible how the price is narrowing in a triangle pattern. This narrowing of liquidity usually occurs before sharp impulsive movements. Under such market conditions, buy trades can be considered from the support levels after the price breaks through the triangle upwards. It is better to look for sell trades throughout the day and if the price breaks through the triangle downwards.
Alternative scenario: if the price breaks through the 1.1704 support level and fixes below, the mid-term uptrend will likely be broken.
News feed for 2021.09.16:
- ECB President Christine Lagarde’s Speech at 15:00 (GMT+3);
- US Retail Sales (m/m) at 15:30 (GMT+3);
- US Philadelphia Fed Manufacturing Index (m/m) at 15:30 (GMT+3);
- US Initial Jobless Claims (w/w) at 15:30 (GMT+3).
The GBP/USD currency pair
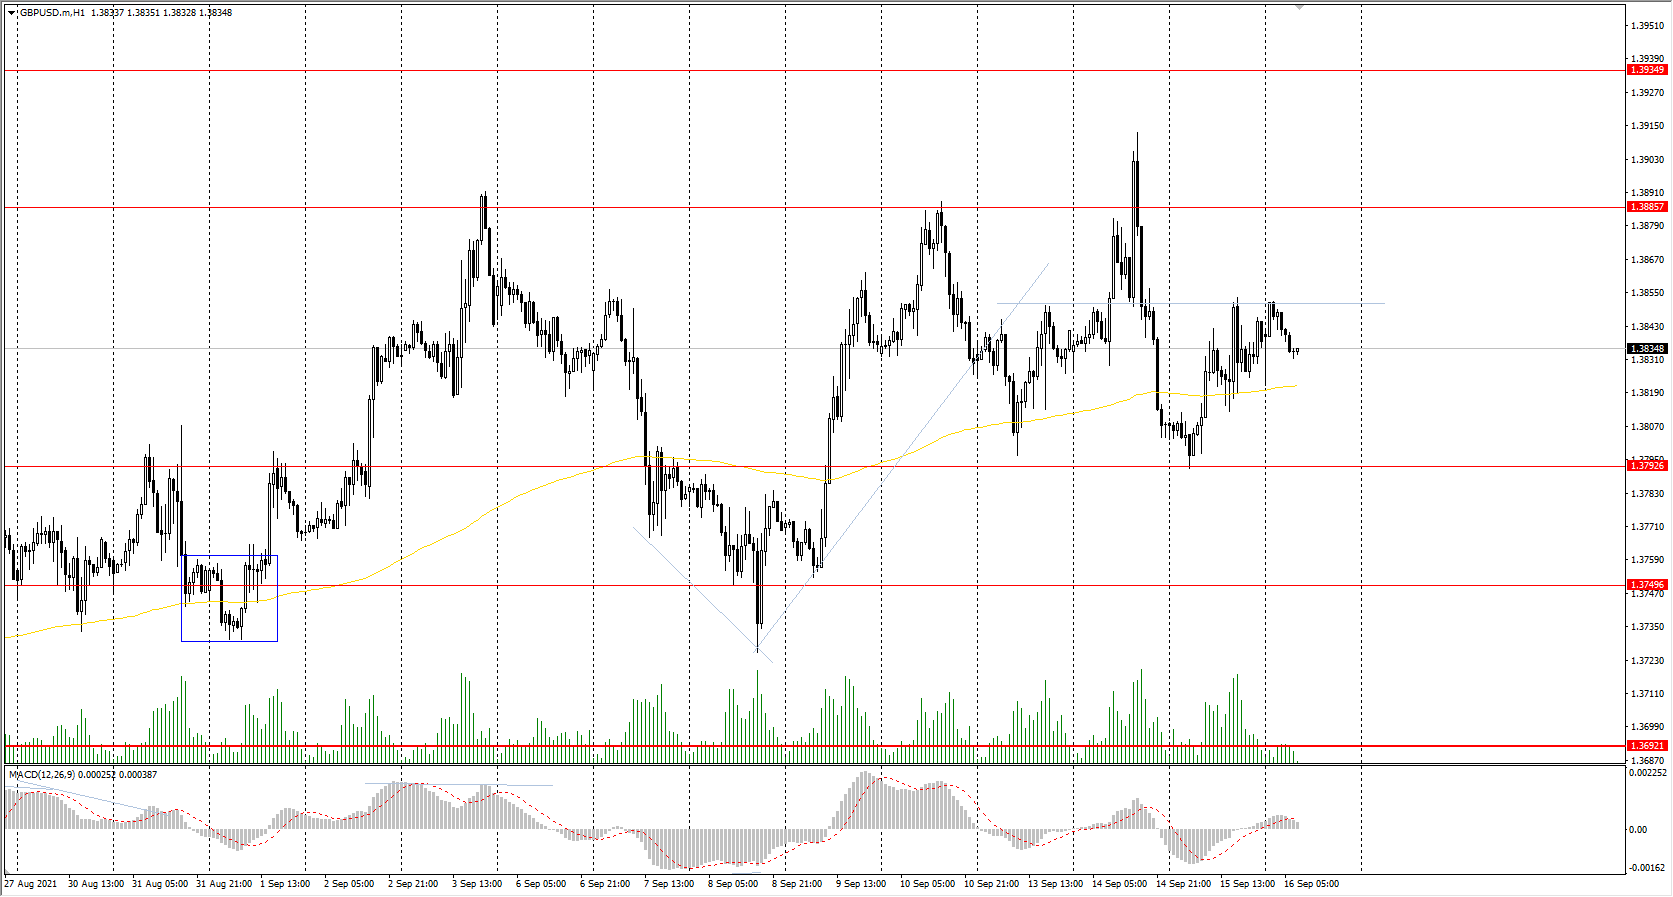
Technical indicators of the currency pair:
Prev Open: 1.3808
Prev Close: 1.3837
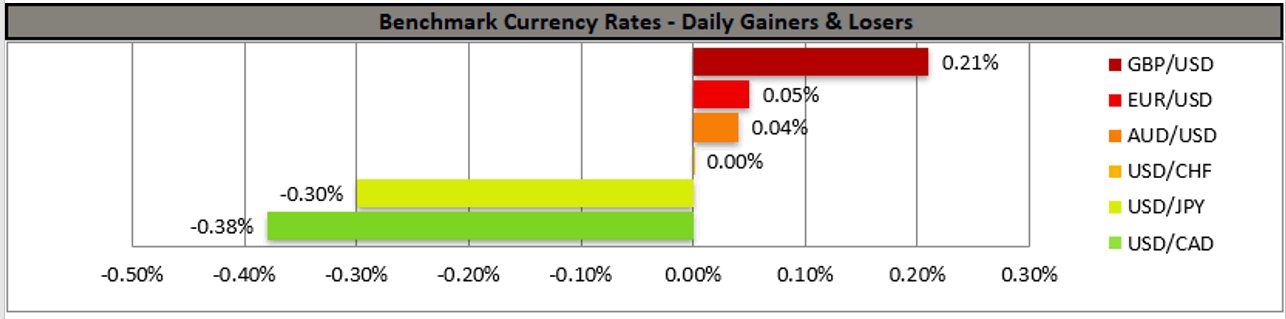
% chg. over the last day: +0.21%
Amid rising food and beverage prices, annual inflation jumped from 2% to 3.2% in the UK. This is the largest surge of inflation ever. Labour and the trade unions have warned that households will face a "double whammy" this winter as living costs are rising and the government is going to increase taxes and introduce major cuts in social security benefits. It will be interesting to keep an eye on whether the Bank of England will take any action to suppress inflation.
Trading recommendations
Support levels: 1.3793, 1.3750, 1.3692, 1.3632, 1.3614, 1.3525
Resistance levels: 1.3886, 1.3935, 1.4002
On the hourly time frame, the GBP/USD trend is bullish. But amid the weakness of the dollar index and the weakness of the British pound, the price has been trading without dynamics. The MACD indicator has become inactive. Under such market conditions, it is better to look for buy trades from the support levels near the moving average line. Sell positions can be considered from the resistance levels with short targets throughout the day.
Alternative scenario: if the price breaks through the 1.3692 support level and consolidates below, the bearish scenario will likely resume.
The USD/JPY currency pair
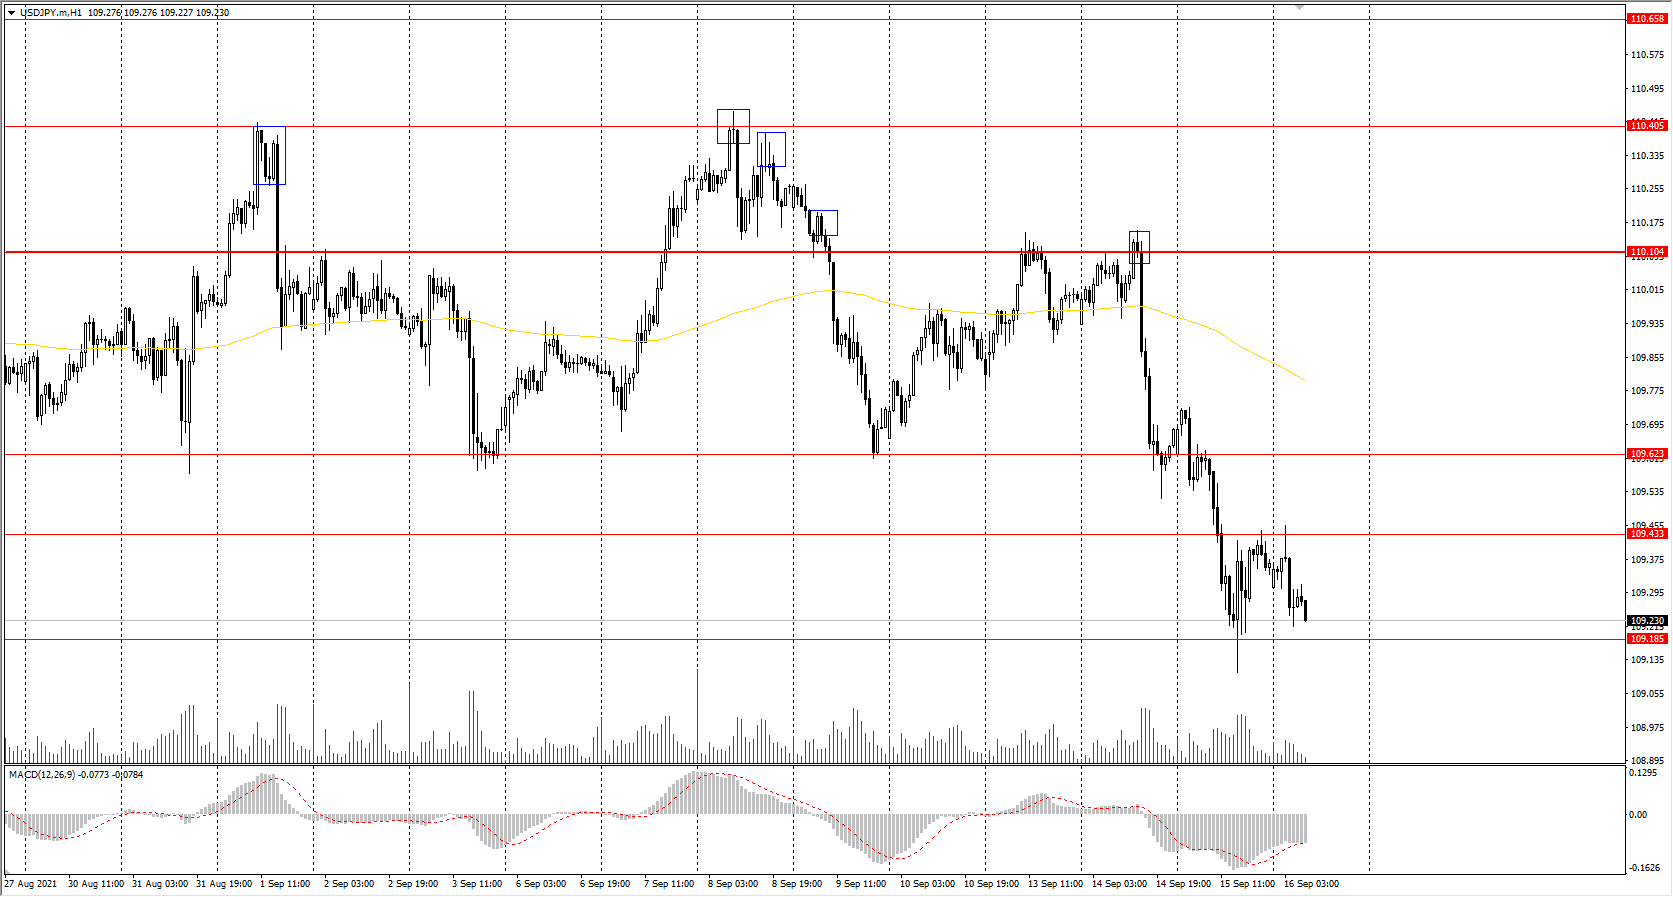
Technical indicators of the currency pair:
Prev Open: 109.62
Prev Close: 109.36
% chg. over the last day: -0.23%
Japan is preparing to elect a new prime minister. On Thursday, Japan's Vaccination Minister Taro Kono, the candidate to replace Prime Minister Yoshihide Suga, said that any new economic stimulus measures should prioritize spending on renewable energy and expanding 5G networks nationwide. Taro Kono leads public polls on who the Japanese want to see as a prime minister.
Trading recommendations
Support levels: 109.19, 108.65
Resistance levels: 109.43, 109.69, 110.10, 110.40, 110.66, 110.95, 111.48
The main trend on the USD/JPY currency pair changed to bearish. Yesterday, the price broke through the priority change level and consolidated below. The MACD indicator has become negative, but there are signs of sellers’ weakness. Under such market conditions, traders should look for sell positions from the zones where sellers show initiative near the moving average. Buy positions should be considered only from the support levels where the buyers show initiative throughout the day.
Alternative scenario: if the price rises above 110.10, the uptrend is likely to resume.
The USD/CAD currency pair
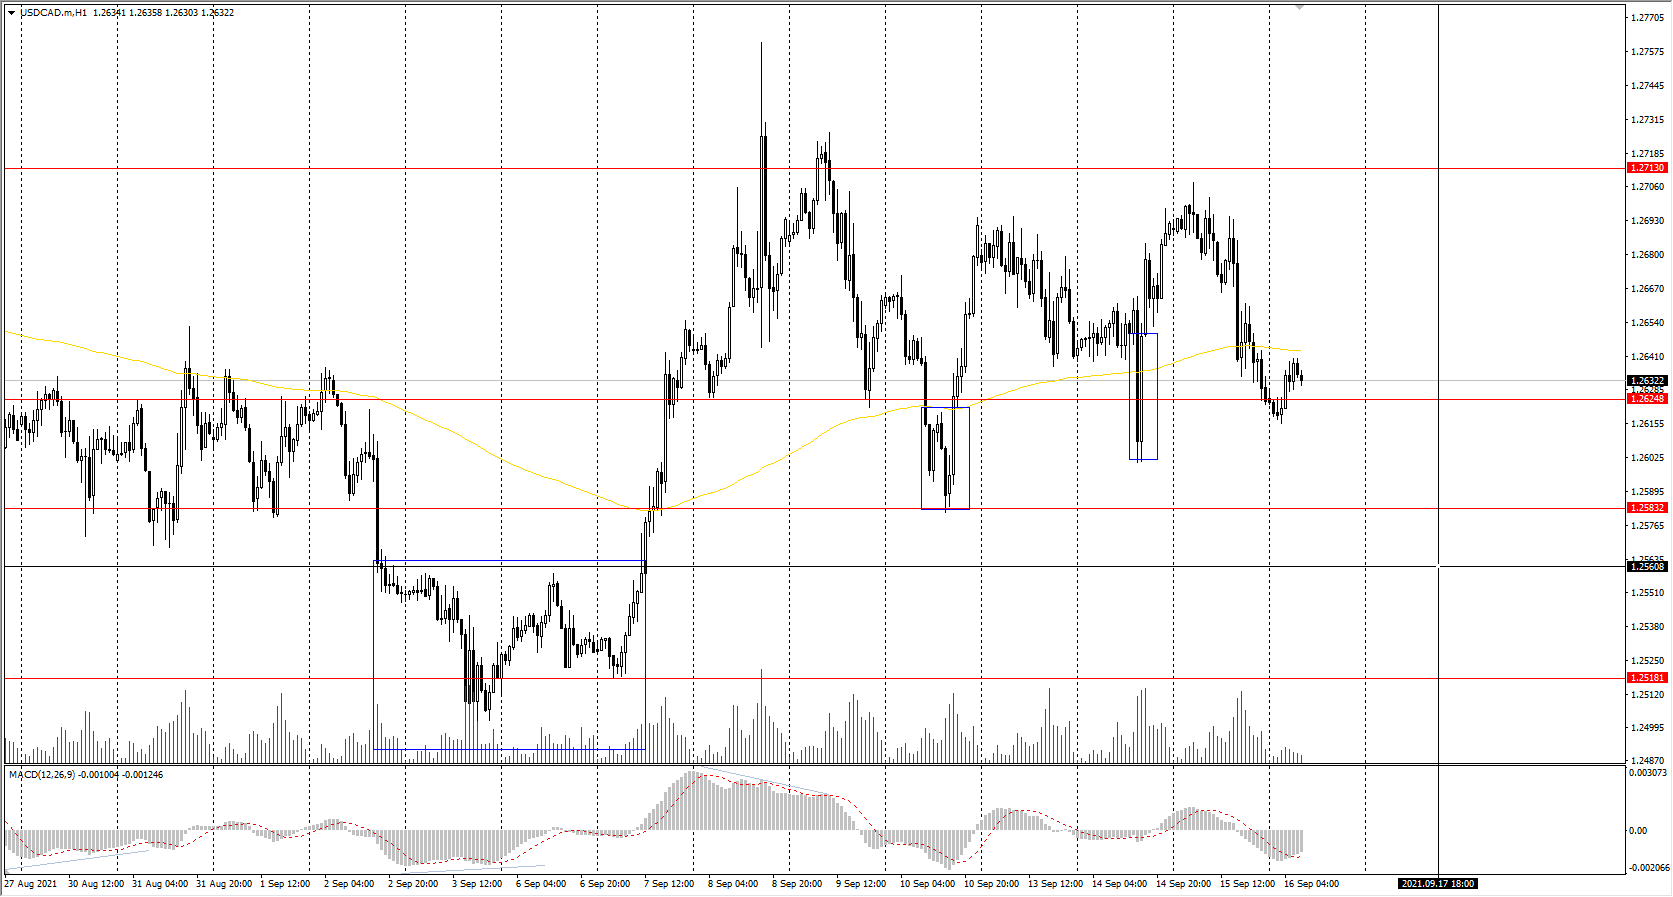
Technical indicators of the currency pair:
Prev Open: 1.2690
Prev Close: 1.2642
% chg. over the last day: -0.37%
The Canadian dollar is a commodity currency, so the USD/CAD currency pair is highly dependent on the dynamics of the dollar index and oil prices. Yesterday, the dollar index declined, while oil prices significantly increased. As a result, the price of USD/CAD decreased by 0.37%. On Wednesday, Statistics Canada reported that the inflation rate increased to 4.1% in August – the highest level since 2003. Almost all goods and services were much more expensive in August than a year earlier, including housing accommodations (4.8%), transportation (8.7%), and food (2.7%).
Trading recommendations
Support levels: 1.2625, 1.2583, 1.2518, 1.2425
Resistance levels: 1.2713, 1.2812, 1.2891, 1.2951
In terms of technical analysis, the trend on the USD/CAD currency pair is bearish. But due to the growth of the dollar index and strengthening of the Canadian dollar, the price is trading inside the wide corridor, with some pressure from the sellers. The MACD indicator is negative again. Buy positions can be considered from the support levels where buyers show initiative, and only with short targets. It is better to look for sell positions from the resistance levels of a higher time frame.
Alternative scenario: if the price breaks through the 1.2812 resistance level and fixes above, the uptrend will likely resume.
USD/JPY Outlook: Bears Are Gaining Traction, Clear Break Of 109 Zone To Risk Deeper Fall
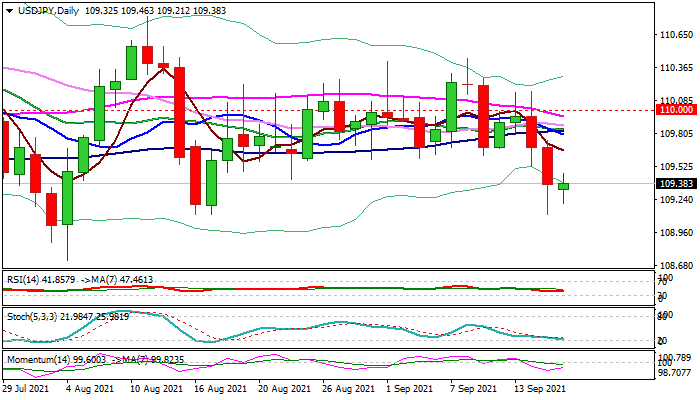
The USDJPY is consolidating in early Thursday under new one-month low (109.11), hit after strong drop in past two days.
Near-term structure weakened after the latest bearish acceleration and remains weighed by multiple failures above pivotal barriers at 110.00/19 (psychological/daily cloud top) that points to bull-trap formation.
Daily MA’s turned to full bearish setup and formed a number of bear-crosses, while negative momentum remains strong and both contributing to negative near-term outlook.
Violation of pivotal supports at 109 zone (109.11/108.72) would further weaken the structure (as break here would signal and end of month-long congestion, presented by four consecutive weekly Dojis) and risk extension towards key supports at 108.19/107.47 (Fibo 38.2% of 102.59/111.65/Apr 24 trough).
Only rebound through 109.80 / 110.00 (converged 10/20DMA’s/psychological) would sideline bears.
Res: 109.60, 109.80, 110.00, 110.26.
Sup: 109.11, 108.72, 108.50, 108.19.
Japan: Economy’s pace weakened in severe pandemic situation
Japanese Government's Cabinet office maintained that the economy "remains in picking up", but added that "pace has weakened in a severe situation due to the Novel Coronavirus". In particular, "some weakness s seen recently" in industrial production, even though it's still "picking up".
Other assessments are largely unchanged, with private consumption showing weakness further. Business is picking up while exports continue to increase moderately. Corporate profits are also picking up with some weakness in non-manufacturers. Employment situation shows steady movements in some components.
EUR/USD Outlook: Technical Studies Continue To Point Lower
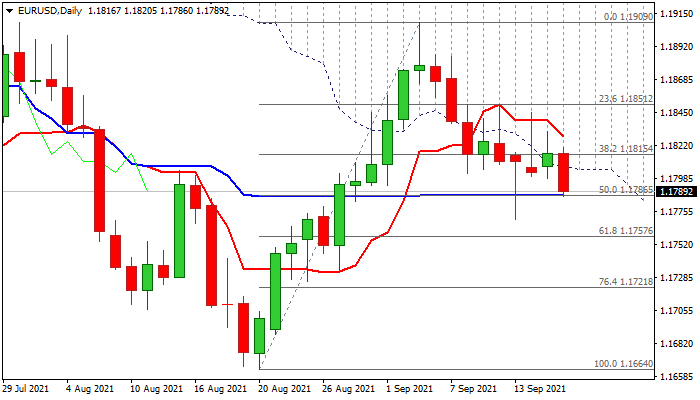
The Euro accelerates lower in early European trading on Thursday, signaling possible break of recent congestion, as long tails and upper shadows on daily candles in past few sessions pointed to indecision.
Near-term action remains bearishly aligned since recent bull-trap above 1.1894 Fibo barrier and weighed by falling thick daily cloud.
Fresh weakness looks for clear break of cracked daily Kijun-sen at 1.1786 (also 50% retracement of 1.1664/1.1909 upleg) to signal a continuation of pullback from 1.1909 (Sep 9 recovery peak).
South-heading 14-d momentum on daily chart is about to break into negative territory and add to bearish stance.
Acceleration through Kijun-sen pivot to expose targets at 1.1757/21 (Fibo 61.8% and 76.4% of 1.1664/1.1909 respectively) and risk full retracement on break of the latter.
Daily cloud base marks solid resistance at 1.1805, followed by broken Fibo 38.2% at 1.1815, with falling daily Tenkan-sen (1.1828) expected to cap upticks and keep bears in play. US retail sales and jobless claims data are key events today and eyed for fresh signals.
Res: 1.1805, 1.1815, 1.1828, 1.1845.
Sup: 1.1786, 1.1769, 1.1757, 1.1721.