Sample Category Title
GBP/JPY Daily Outlook
Daily Pivots: (S1) 150.96; (P) 151.26; (R1) 151.69; More...
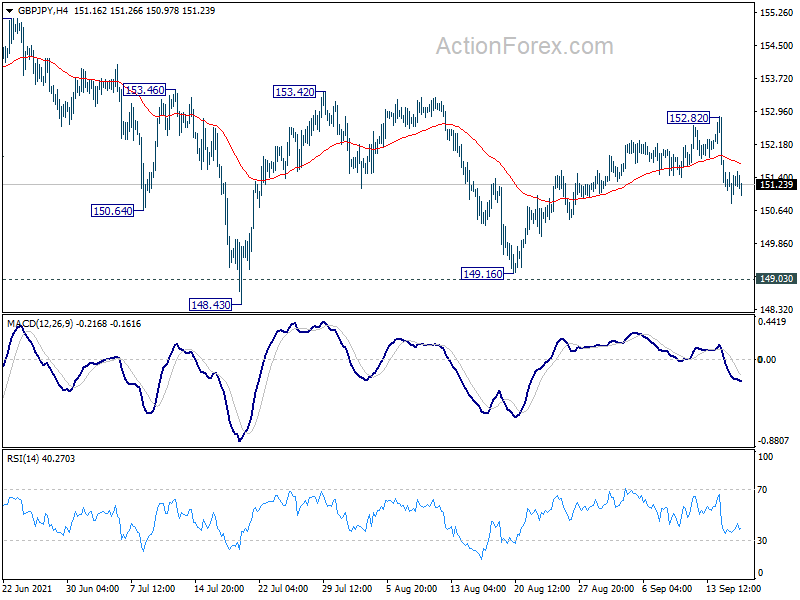
Intraday bias in GBP/JPY remains mildly on the downside for the moment. Deeper fall would be seen back to 148.43/149.16 support zone. Decisive break there will resume whole decline from 156.05 high, and carry larger bearish implications. On the upside, though, break of 152.82 will resume the rebound to 153.42 near term structural resistance.
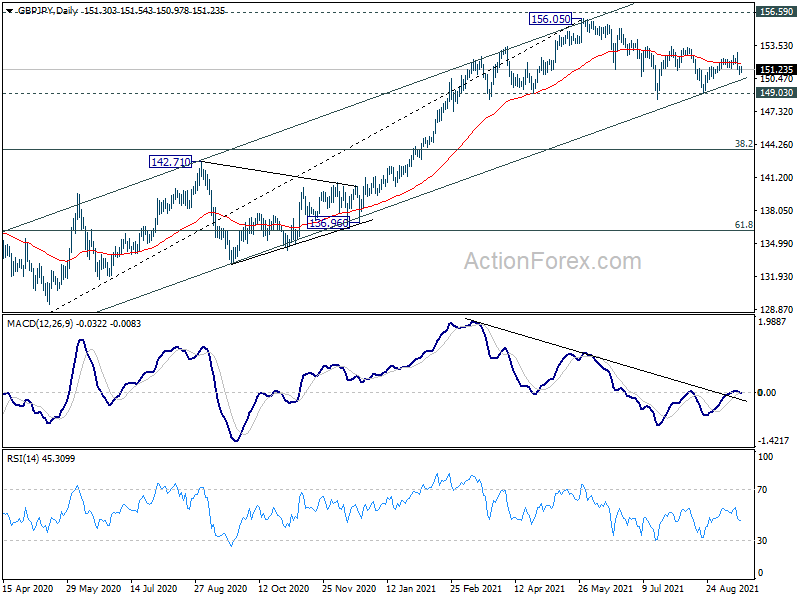
In the bigger picture, rise from 123.94 is seen as the third leg of the pattern from 122.75 (2016 low). As long as 149.03 support holds, such rise would still resume at a later stage. However, sustained break of 149.03 support will indicate rejection by 156.59. Fall from 156.05 would be at least correcting the whole rise from 123.94. Deeper fall would be seen back 38.2% retracement of 123.94 to 156.05 at 143.78 first.
EUR/JPY Daily Outlook
Daily Pivots: (S1) 129.01; (P) 129.28; (R1) 129.50; More....
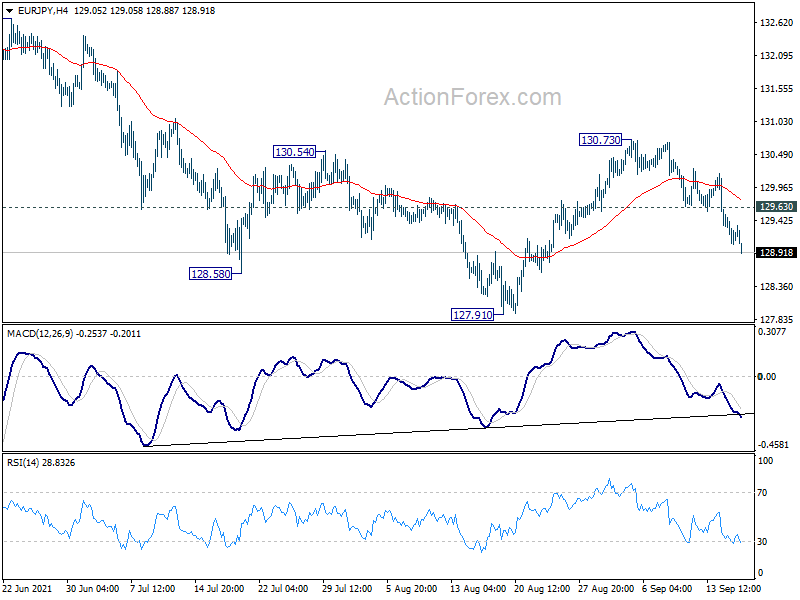
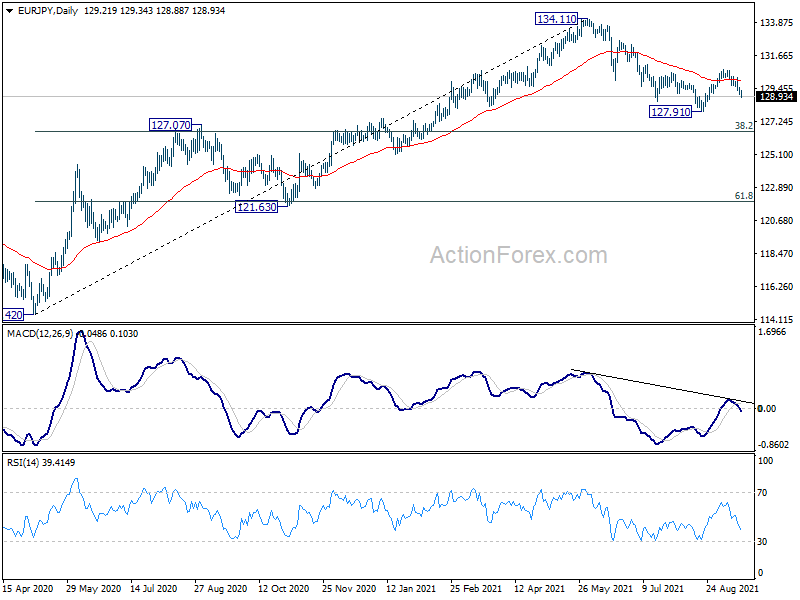
Intraday bias in EUR/JPY remains on the downside, as fall from 130.73 is in progress for retesting 127.91 low. Firm break there will resume whole fall from 134.11 to 127.07 key resistance turned support. On the upside, above 129.63 minor resistance will turn bias back to the upside for 130.73 instead.
In the bigger picture, rise from 114.42 is seen as a medium term rising leg inside a long term sideway pattern. As long as 127.07 resistance turned support holds, further rise is still expected to retest 137.49 (2018 high). However, firm break of 127.07 will argue that the medium term trend has reversed, deeper fall would be seen to 61.8% retracement of 114.42 to 134.11 at 121.94.
Daily Technical Analysis
EUR/USD
Current level - 1.1812
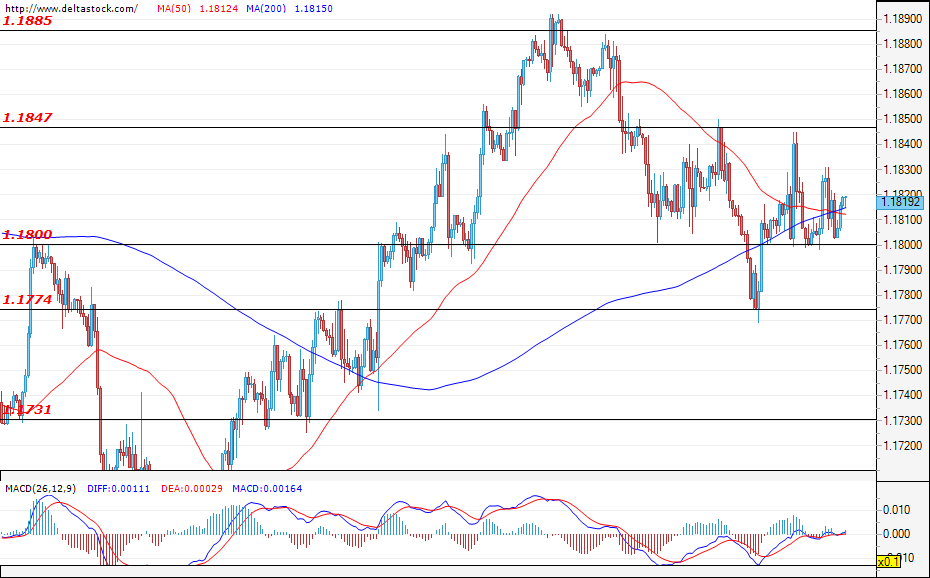
The forecasts for today's trading session are for the currency pair to test the resistance at 1.1847 due to the fact that, during the early hours of today's trading session, the EUR/USD bounced back from the support level at 1.1800. In case the mentioned level of resistance is breached, the pair will most likely head towards the next support zone at 1.1885. The consolidation phase that began at the start of the week is keeping the pair in the range between 1.1800 - 1.1847 and, if the bears enter the market and manage to violate the support at 1.1800, then their next target will be located at the support zone at 1.1774.
| Resistance | Support | ||
| intraday | intraweek | intraday | intraweek |
| 1.1847 | 1.1900 | 1.1800 | 1.1730 |
| 1.1875 | 1.1950 | 1.1774 | 1.1700 |
USD/JPY
Current level - 109.62
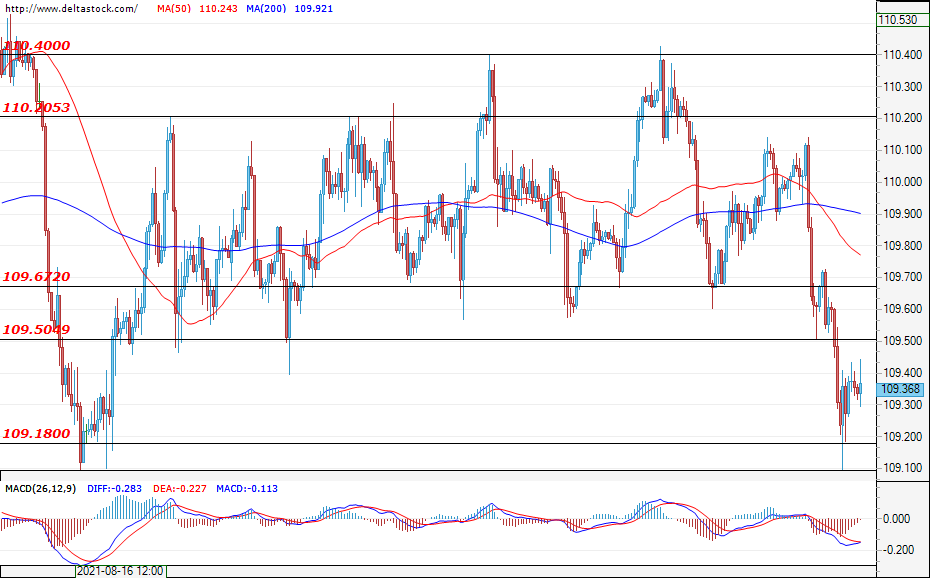
The pair successfully breached the support at 109.67, but the sell-offs were limited to the critical level of 109.50. Another attack and a breach of the mentioned support would pave the way for the currency pair towards the support at 109.23. However, if the bulls re-enter the market and manage to keep the Ninja above 109.67, then a test of the resistance at 110.20 is highly probable.
| Resistance | Support | ||
| intraday | intraweek | intraday | intraweek |
| 110.67 | 110.40 | 109.20 | 108.50 |
| 110.20 | 111.00 | 108.80 | 108.00 |
GBP/USD
Current level - 1.3845
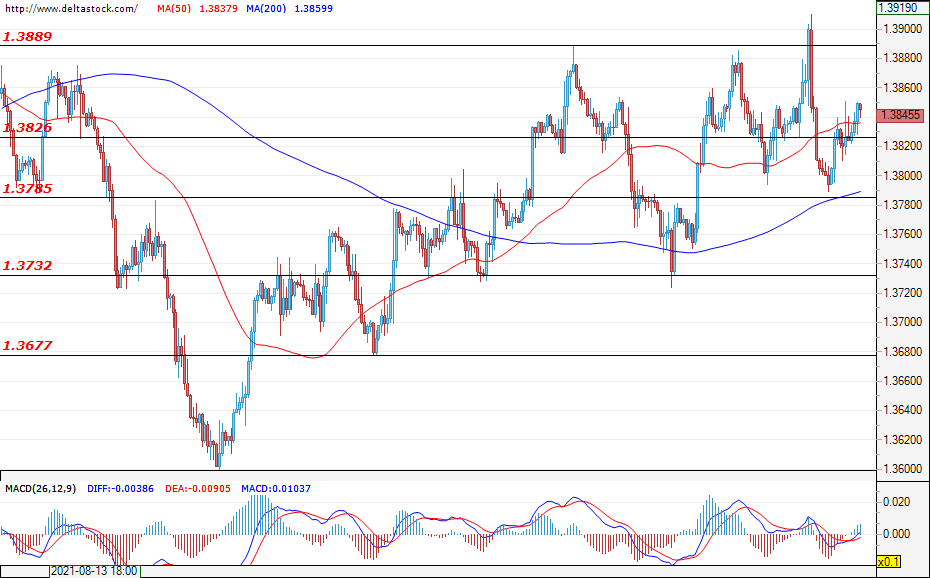
The sterling continues to gain positions against the U.S. dollar after the pair initially bounced back from the support at 1.3785. The sentiment remains positive – for an appreciation of the pound against the greenback and a test of the resistance at 1.3889. If the breach is successful, this would allow the buyers to solidify the uptrend towards the psychological level at 1.4000.
| Resistance | Support | ||
| intraday | intraweek | intraday | intraweek |
| 1.3890 | 1.4000 | 1.3826 | 1.3732 |
| 1.3900 | 1.4000 | 1.3785 | 1.1.3677 |
EUR/GBP Daily Outlook
Daily Pivots: (S1) 0.8522; (P) 0.8543; (R1) 0.8556; More...
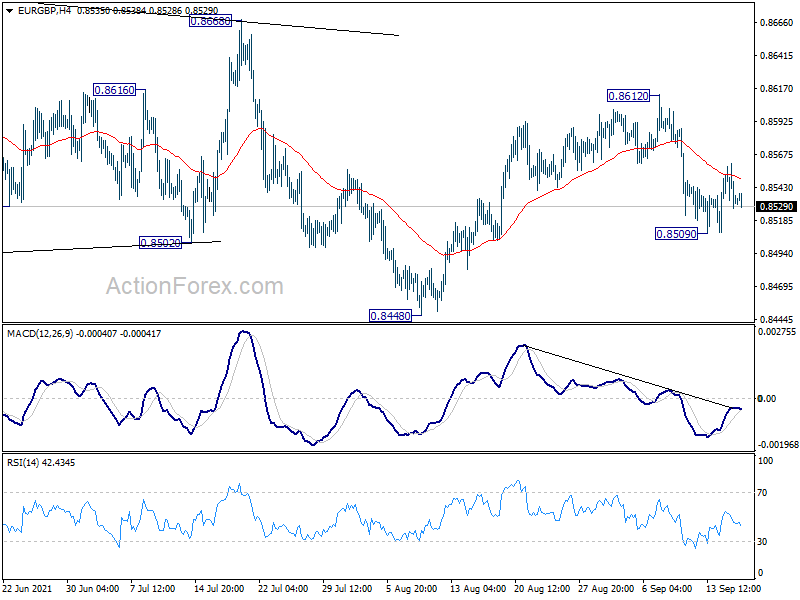
Intraday bias in EUR/GBP remains neutral for the moment. As noted before, with 0.8668 resistance intact, larger fall from 0.9499 is probably still in progress. On the downside, break of 0.8509 will resume the fall from 0.8612 to retest 0.8448 low. On the upside, though, break of 0.8612 will resume the rise from 0.8448 to 0.8668 resistance.
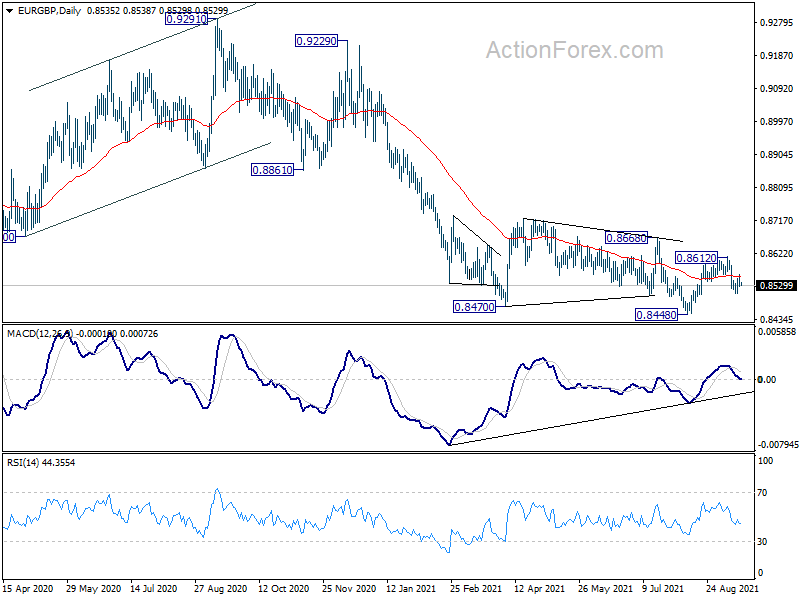
In the bigger picture, price actions from 0.9499 (2020 high) are still seen as developing into a corrective pattern. Deeper fall could be seen as long as 0.8668 resistance holds, towards long term support at 0.8276. However, firm break of 0.8668 resistance would argue that a medium term bottom was already formed. Stronger rise would be seen to 0.8861 support turned resistance to confirm completion of the corrective pattern.
EUR/AUD Daily Outlook
Daily Pivots: (S1) 1.6088; (P) 1.6128; (R1) 1.6151; More...
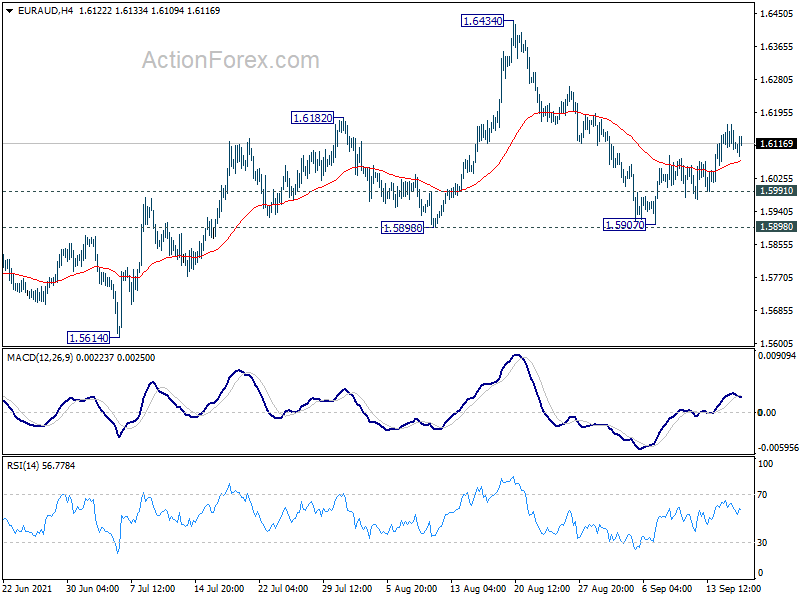
EUR/AUD is losing some upside momentum as seen in 4 hour MACD. But with 1.5991 minor support intact, further is still in favor to retest 1.6434 high. Break there will resume larger rise from 1.5250. However, on the downside, below 1.5991 minor support will turn bias back to 1.5898 key structural support instead.
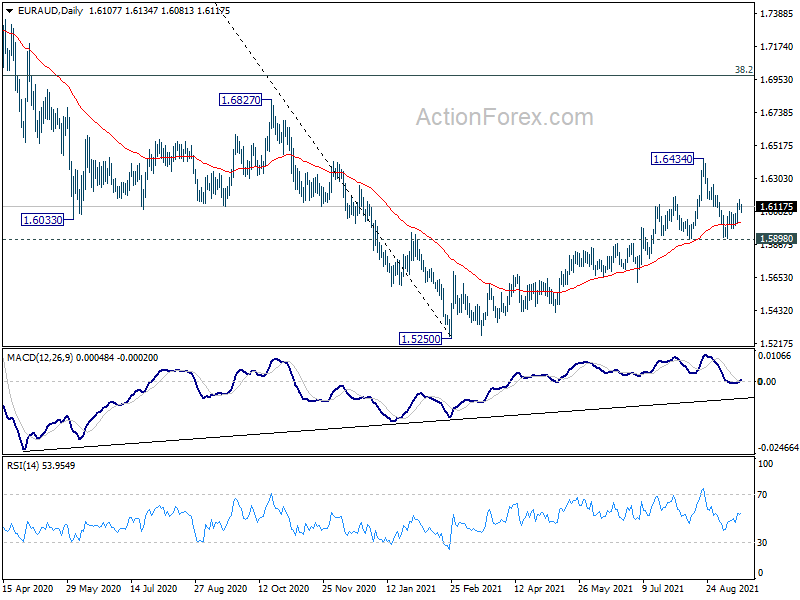
In the bigger picture, rise from 1.5250 medium term bottom is currently seen as a correction to the down trend from 1.9799 first. Stronger rise could be seen to 38.2% retracement of 1.9799 to 1.5250 at 1.6988 next. We'd tentatively expect strong resistance from there to limit upside, at least on first attempt. Meanwhile, break of 1.5898 support will indicate that the rebound has completed. Larger down trend from 1.9799 might be ready to resume through 1.5250 low.
EUR/CHF Daily Outlook
Daily Pivots: (S1) 1.0848; (P) 1.0860; (R1) 1.0879; More....
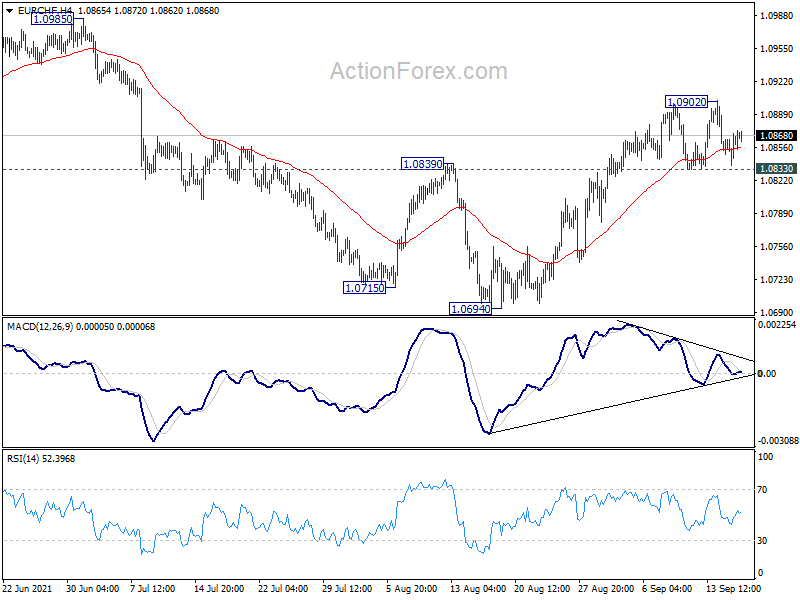
Intraday bias in EUR/CHF remains neutral and further rise is in favor with 1.0833 support intact. On the upside, break of 1.0902 will resume the rise from 1.0694 to 1.0985 resistance next. However, on the downside, break of 1.0833 support will turn bias back to the downside for retesting 1.0694 low instead.
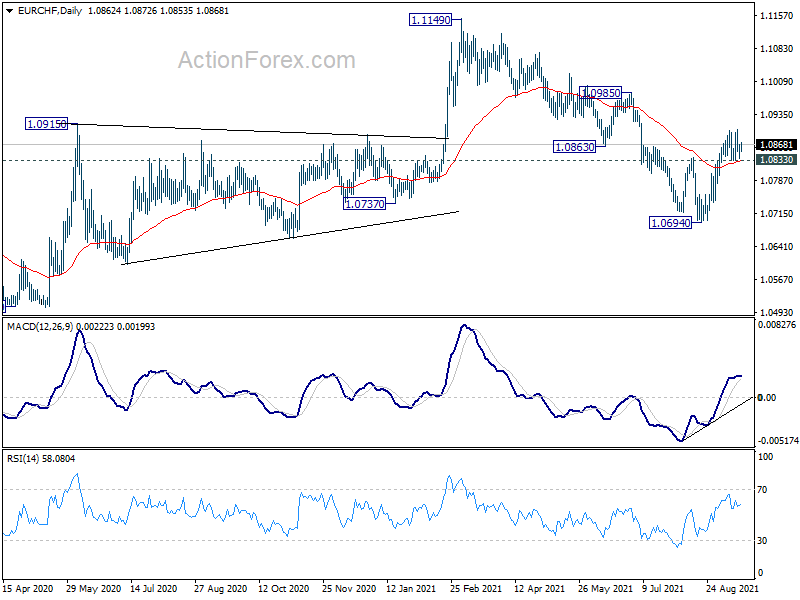
In the bigger picture, rebound from 1.0505 (2020 low) should have completed at 1.1149 already. The three-wave corrective structure argues that the downtrend from 1.2004 (2018 high) is not over yet. Medium term outlook will now stay bearish as long as 55 week EMA (now at 1.0858) holds. Break of 1.0505 low would be seen at a later stage. However, sustained trading above 55 week EMA will bring retest of 1.1149 high instead.
USD/CAD Daily Outlook
Daily Pivots: (S1) 1.2598; (P) 1.2654; (R1) 1.2682; More...
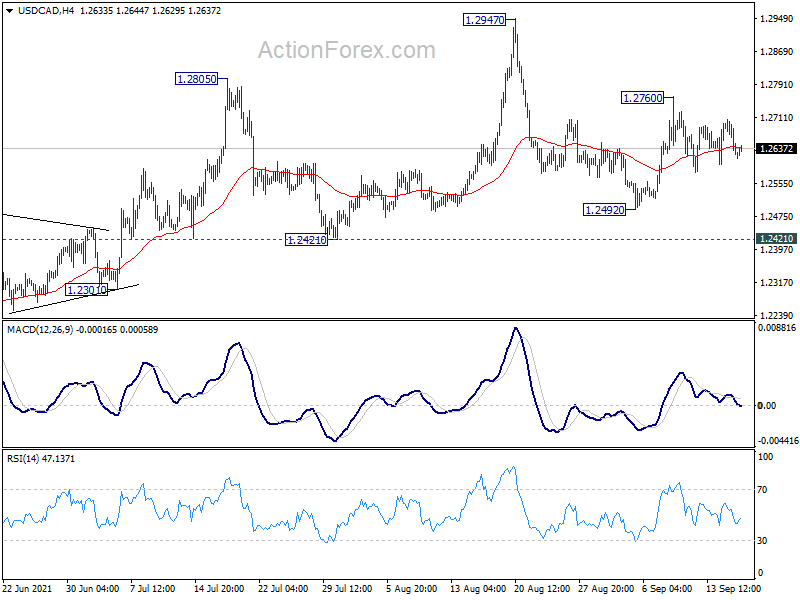
Outlook in USD/CAD remains unchanged and intraday bias stays neutral first. Rise from 1.2005 is in progress with 1.2421 support intact. On the upside, break of 1.2760 will target a test on 1.2947 high. However, break of 1.2492 will resume the fall from 1.2947 to 1.2421 key structural support.
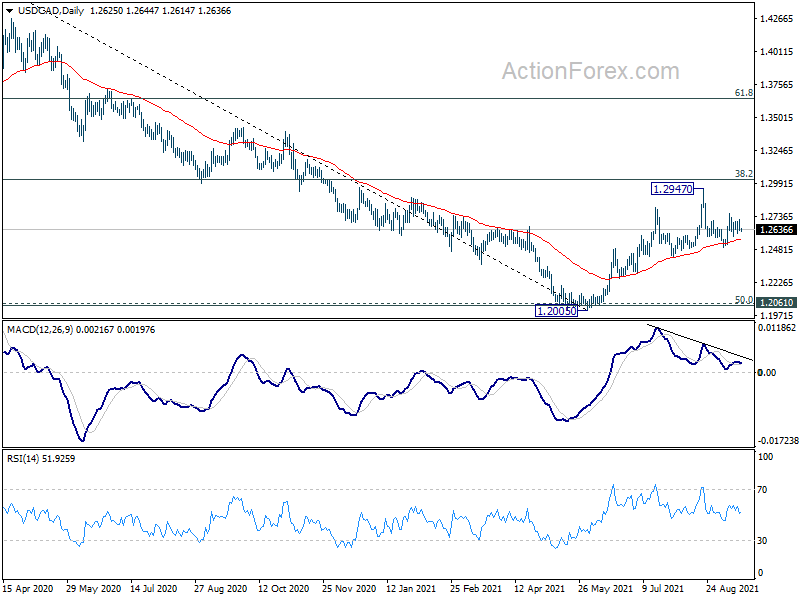
In the bigger picture, fall from 1.4667 is seen as the third leg of the corrective pattern from 1.4689 (2016 high). It should have completed after hitting 1.2061 (2017 low) and 50% retracement of 0.9406 to 1.4689 at 1.2048. Sustained break of 38.2% retracement of 1.4667 to 1.2005 at 1.3022 will pave the way to 61.8% retracement at 1.3650 and above. Overall, medium term outlook remains neutral at worst with 1.2048/61 support zone intact.
AUD/USD Daily Report
Daily Pivots: (S1) 0.7311; (P) 0.7325; (R1) 0.7348; More...
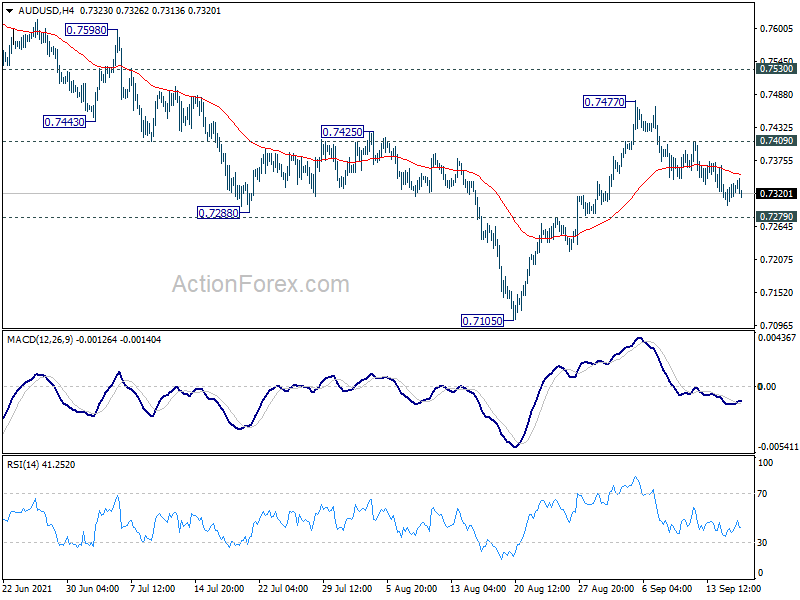
AUD/USD could still gyrate lower as decline from 0.7477 is extending. But still, another rise is in favor as long as 0.7279 minor support holds. Whole corrective pattern from 0.8006 might have completed at 0.7105 already. On the upside, above 0.7409 minor resistance will turn bias to the upside for 0.7477 and then 0.7530 support turned resistance. However, break of 0.7279 will dampen our bullish view and turn bias back to the downside for retesting 0.7105 low instead.
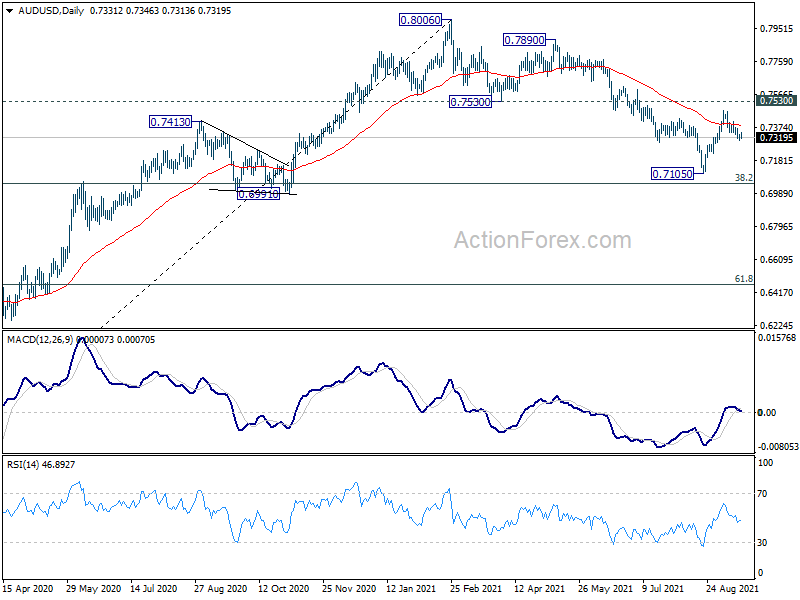
In the bigger picture, with 0.6991 cluster support (38.2% retracement of 0.5506 to 0.8006 at 0.7051) intact, we're seeing price action form 0.8006 as a correction only. That is, up trend from 0.5506 low would resume after the correction completes. In that case, main focus will be 0.8135 key resistance (2018 high). Sustained break there will carry larger bullish implications. However, sustained break of 0.6991 will argue that the whole medium term trend has indeed reversed.
EUR/USD Daily Outlook
Daily Pivots: (S1) 1.1799; (P) 1.1816; (R1) 1.1832; More...
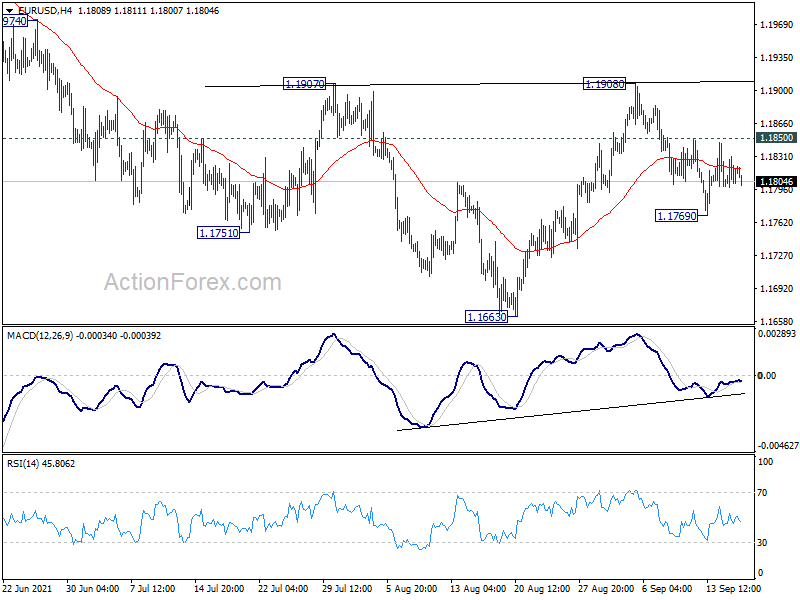
Intraday bias in EUR/USD remains neutral first. On the upside, break of 1.1850 will turn bias back to the upside for 1.1907/1908 key structural resistance zone. Sustained break there will complete a head and shoulder bottom pattern (ls: 1.1751; h: 1.1663; rs: 1.1769). That would also revive the case that consolidation pattern from 1.2348 has completed. Such development will turn near term outlook bullish for retesting 1.2348 high. On the downside, below 1.1769 will resume the fall from 1.1908 to retest 1.1663 low.
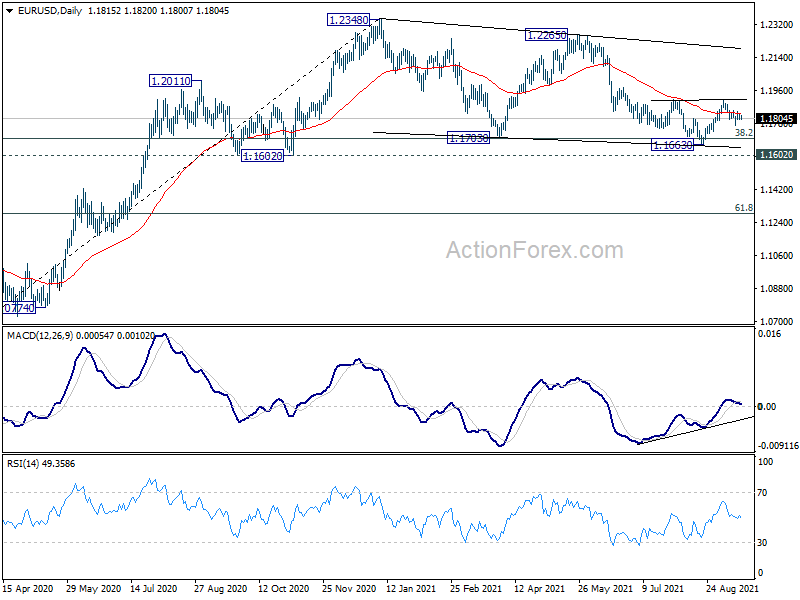
In the bigger picture, rise from 1.0635 is seen as the third leg of the pattern from 1.0339 (2017 low). Further rally remains in favors long as 1.1602 support holds, to cluster resistance at 1.2555 next, (38.2% retracement of 1.6039 to 1.0339 at 1.2516). However sustained break of 1.1602 will argue that the rise from 1.0635 is over, and turn medium term outlook bearish again. Deeper fall would be seen to 61.8% retracement of 1.0635 to 1.2348 at 1.1289 and below.
XAUUSD Is Possibly Bearish
Technical analysis
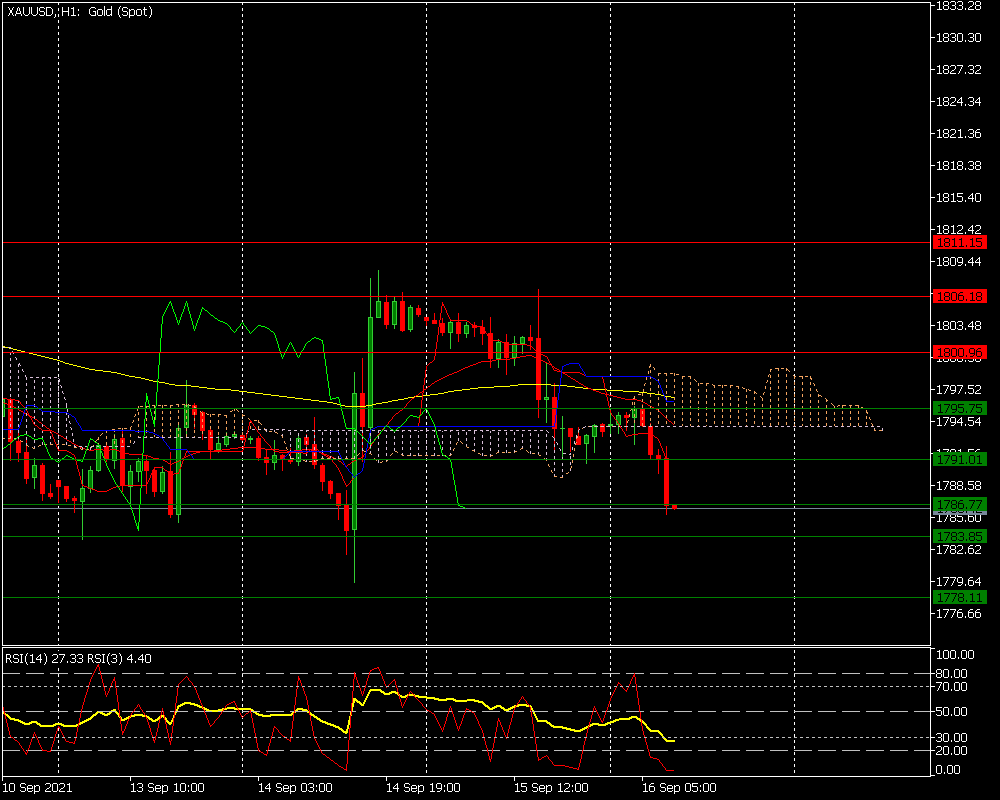
The price is under EMA(24) and EMA(120), suggesting a prevailing downtrend
The RSI(14) and the RSI(3) point to a possible upwards correction
The Ichimoku indicator displays a prevailing downtrend.
Most likely scenario - SELL
Target prices: 1,783 1,778
Alternative scenario - BUY
Target prices: 1,791 1,795
Key levels
Support 1,783 1,778
Resistance 1,791 1,795