Sample Category Title
Alibaba (BABA Stock) And Apple (AAPL Stock): Too Big To Be?
Demand for risk assets in financial markets continues to shrink with two significant drivers. Firstly, sentiment is undermined by the sustained sell-off in equities that has dominated the week during the US trading session. Secondly, China is not backing down on its ideas to limit the strength of the big technology corporations, while the US court decision bit off some profit from Apple.
The US S&P500 came under pressure during the New York session on Friday, with pressure intensifying towards the close of trading, reflecting the wariness of professional managers. The index is again a couple of steps away from its 50-day moving average. The index has fallen to this line around the middle of each month since May, and each time it finds support on dips there.
However, it is dangerous to rely on correlations in the markets as they break too frequently. It is worth paying attention to the performance of the American stocks near the 50-day average and not deciding for a short-term move before it tests these levels. Consolidation under 4430 could launch a deeper correction towards the 200 SMA at 4100. A pullback from 4430 would focus on returning to the historical highs above 4550 within just a week or two.
That said, the markets have a lot to worry about. Two of the world's largest economies are in sync with pressure on their fintech giants. Access to user data and the growth of ecosystems have effectively created new monopolists that have lately been profiting lavishly from this information themselves and preventing others from doing so. In 2007, the phrase "too big to fail" became widespread as the government bailed out big banks and manufacturing companies. Now we are witnessing a U-turn, with governments intent on raising taxes on corporations and limiting their monopoly in certain sectors or crushing companies that have become frighteningly large for even the US and Chinese governments, the world's two largest economies by a wide margin.
China presses Alibaba to spin off its financial arm, Ant Group, into a separate company with state ownership. Restrictions on the use of user data and the need to share it with the government deprive fintech of an essential competitive advantage, causing a reassessment of the sector.
At the same time, fintech is also under pressure in the US. On Friday, Apple lost a lawsuit with Epic Games and must now allow companies to use payment services to bypass those approved on the Appstore. This will result in a loss of billions of dollars a year in revenue. Investors fear that this could be the start of a big wave of pressure on fintech, which has concentrated control first over user data, then over financial flows, and has already started profiting from this information.
Like Alibaba for China and Apple and Google for the US, those companies may just be too big to be.
GBP/JPY Daily Outlook
Daily Pivots: (S1) 151.66; (P) 152.15; (R1) 152.51; More...
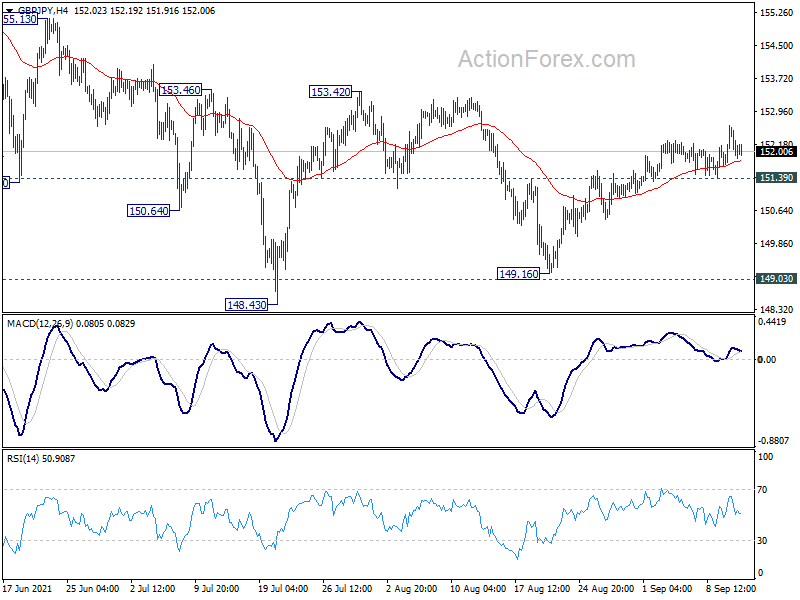
Intraday bias in GBP/JPY stays mildly on the upside with 151.39 minor support. Rise from 149.16 would target 153.42 resistance. Firm break there would indicate that the whole corrective pattern from 156.05 has completed. Further rally would then be see to retest this high. However, break of 151.39 support will argue that rebound from 149.16 has completed, and turn bias back to the downside for retesting this support.
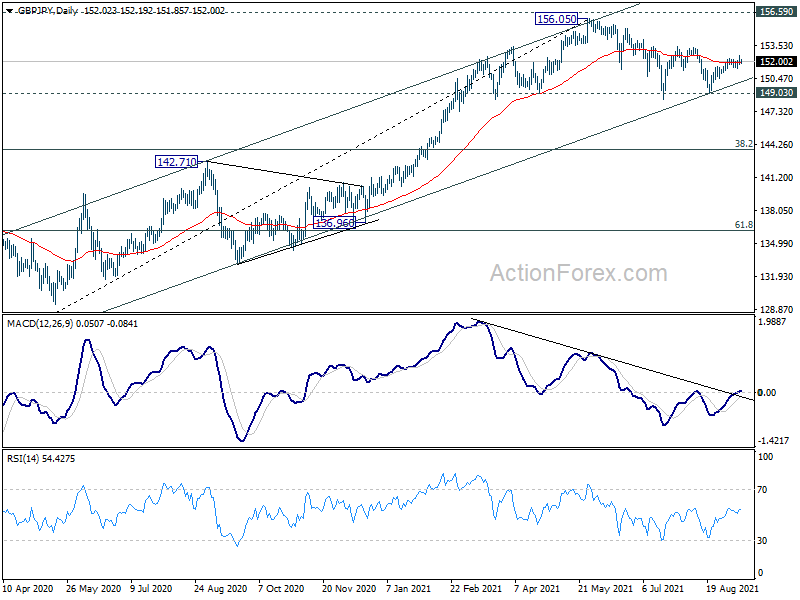
In the bigger picture, rise from 123.94 is seen as the third leg of the pattern from 122.75 (2016 low). As long as 149.03 support holds, such rise would still resume at a later stage. However, sustained break of 149.03 support will indicate rejection by 156.59. Fall from 156.05 would be at least correcting the whole rise from 123.94. Deeper fall would be seen back 38.2% retracement of 123.94 to 156.05 at 143.78 first.
EUR/JPY Daily Outlook
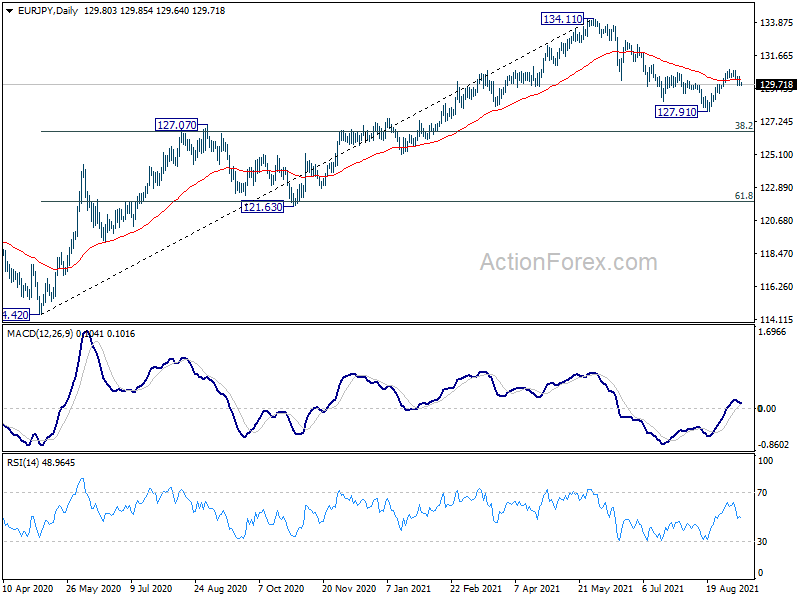
Daily Pivots: (S1) 129.58; (P) 129.93; (R1) 130.17; More....
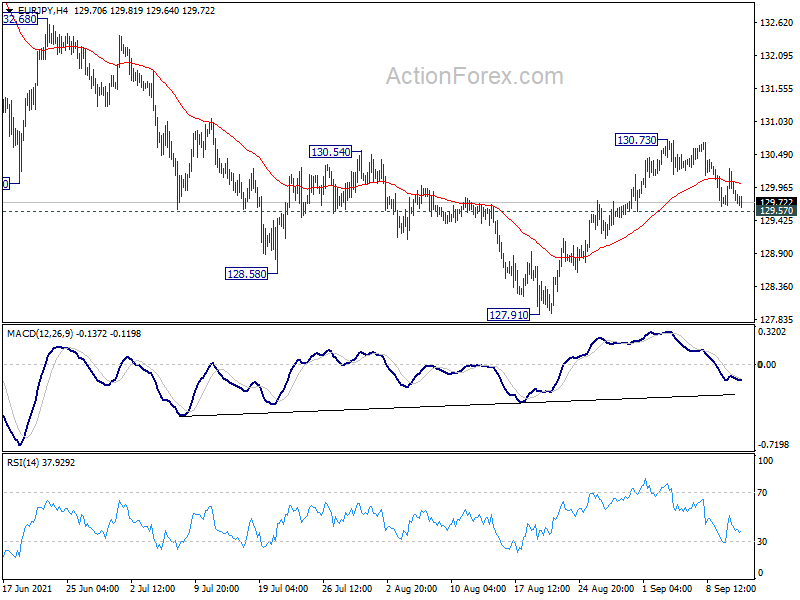
Intraday bias in EUR/JPY remains neutral at this point. On the upside, break of 130.73 will resume the rebound from 127.91 low. That would also reaffirm the case that correction from 134.11 has completed at 127.91. Intraday bias will be turned to the upside for 132.68 resistance next. However, firm break of 129.57 will argue that the rebound has completed, and turn bias back to the downside for retesting 127.91 low.
In the bigger picture, rise from 114.42 is seen as a medium term rising leg inside a long term sideway pattern. As long as 127.07 resistance turned support holds, further rise is still expected to retest 137.49 (2018 high). However, firm break of 127.07 will argue that the medium term trend has reversed, deeper fall would be seen to 61.8% retracement of 114.42 to 134.11 at 121.94.
EUR/GBP Daily Outlook
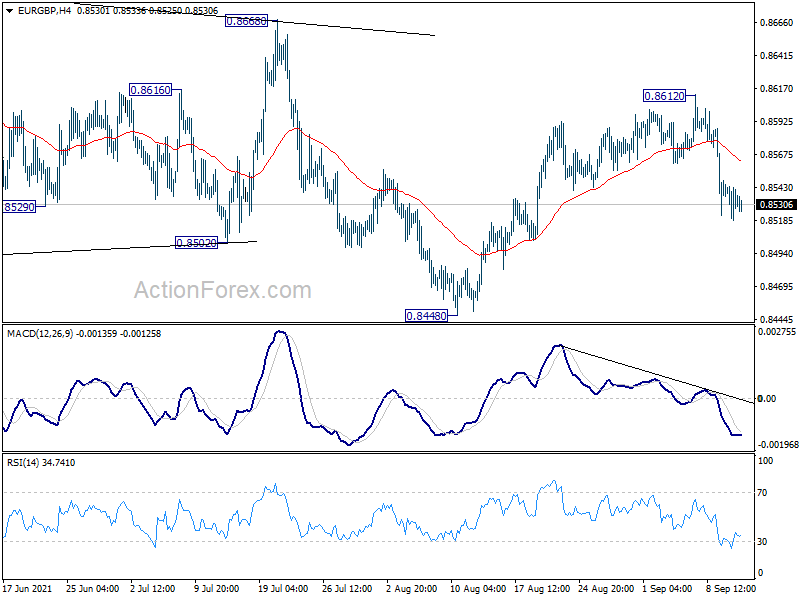
Daily Pivots: (S1) 0.8523; (P) 0.8536; (R1) 0.8551; More...
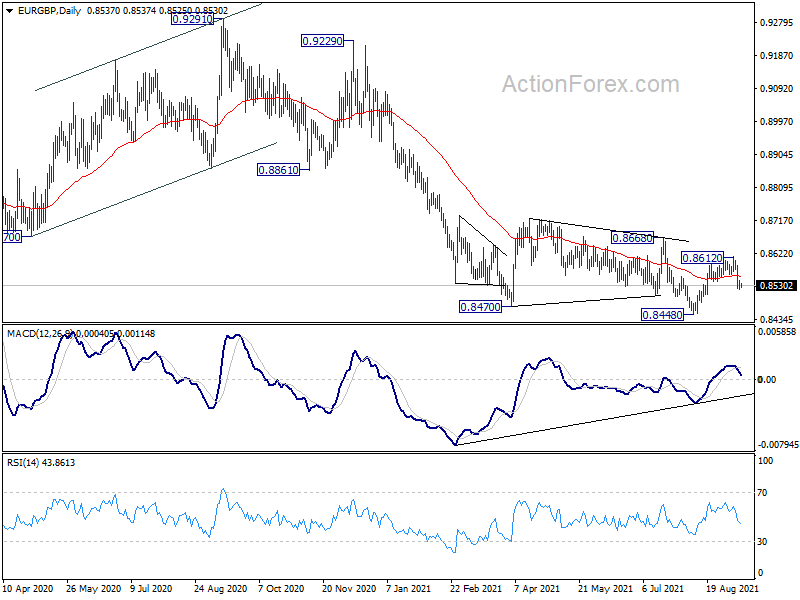
Intraday bias in EUR/GBP remains mildly on the downside for the moment. Rebound from 0.8448 could have completed at 0.8612 already. With 0.8668 resistance intact, larger fall from 0.9499 is probably still in progress. Deeper fall would be seen to retest 0.8448 low first. On the upside, though, break of 0.8612 will resume the rise from 0.8448 to 0.8668 resistance.
In the bigger picture, price actions from 0.9499 (2020 high) are still seen as developing into a corrective pattern. Deeper fall could be seen as long as 0.8668 resistance holds, towards long term support at 0.8276. However, firm break of 0.8668 resistance would argue that a medium term bottom was already formed. Stronger rise would be seen to 0.8861 support turned resistance to confirm completion of the corrective pattern.
EUR/AUD Daily Outlook
Daily Pivots: (S1) 1.5987; (P) 1.6034; (R1) 1.6089; More...
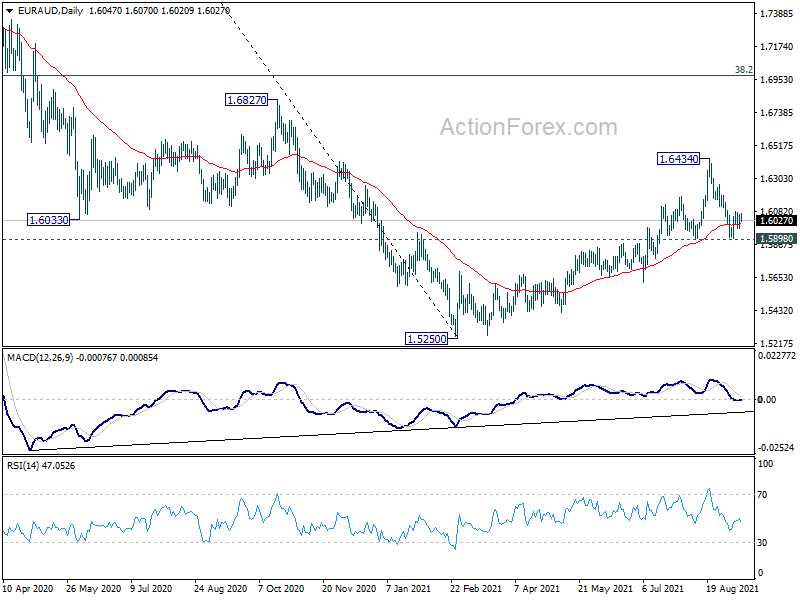
Intraday bias in EUR/AUD remains neutral for the moment. On the upside, break of 1.6116 will argue that pull back from 1.6434 has completed after defending 1.5898 structural support. Larger rise from 15250 is still in progress. Intraday bias will be turned back to the upside for retesting 1.6434 first. On the downside, however, firm break of 1.5898 will argue that corrective rise from 1.5250 has already completed. Near term outlook will be turned bearish for 1.5614 support next.
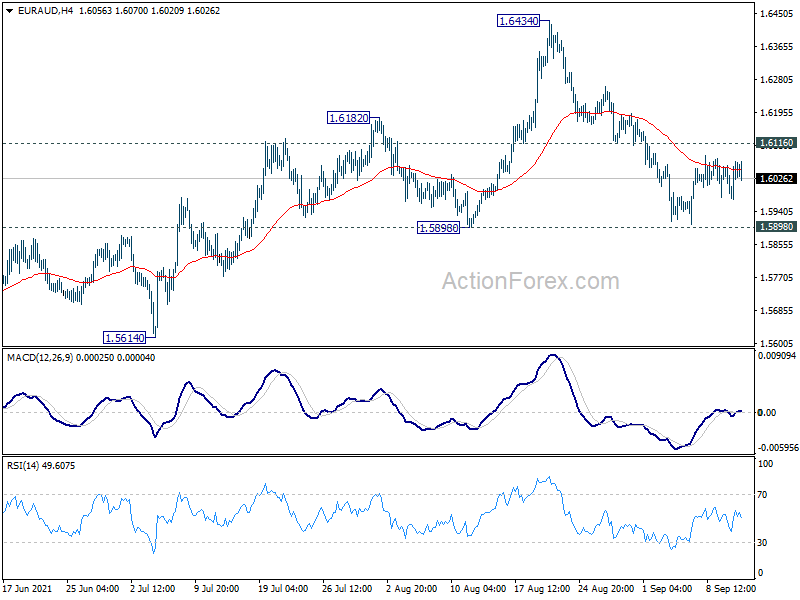
In the bigger picture, rise from 1.5250 medium term bottom is currently seen as a correction to the down trend from 1.9799 first. Stronger rise could be seen to 38.2% retracement of 1.9799 to 1.5250 at 1.6988 next. We'd tentatively expect strong resistance from there to limit upside, at least on first attempt. Meanwhile, break of 1.5898 support will indicate that the rebound has completed. Larger down trend from 1.9799 might be ready to resume through 1.5250 low.
EUR/CHF Daily Outlook
Daily Pivots: (S1) 1.0833; (P) 1.0847; (R1) 1.0859; More....
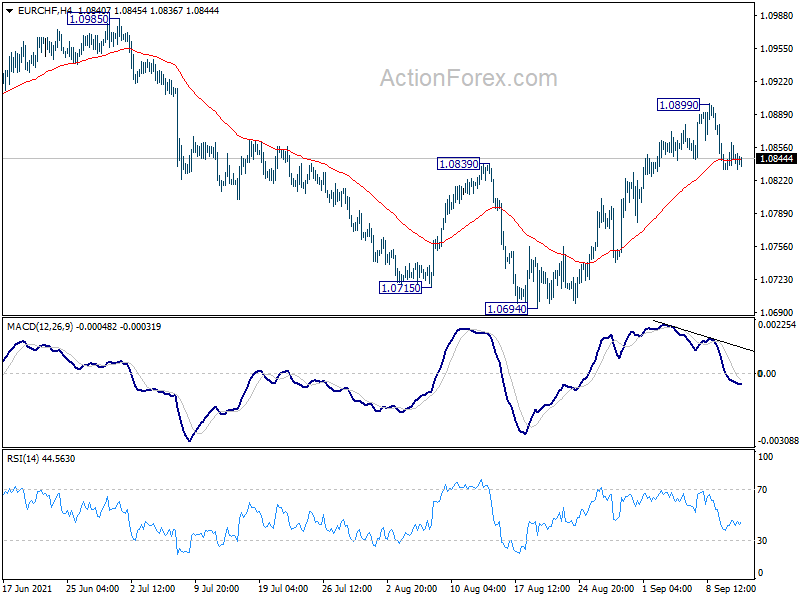
Intraday bias in EUR/CHF remains neutral at this point. Another rise is mildly in favor for now and break of 1.0899 will resume the rebound from 1.0694 to 1.0985 resistance next. However, on the downside, sustained trading below 55 day EMA (now at 1.0826) will turn focus back to 1.0694 low.
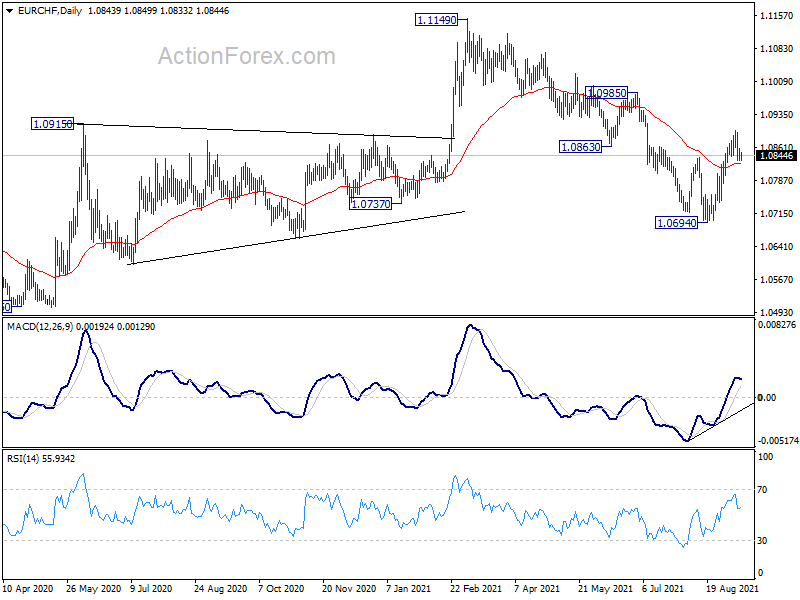
In the bigger picture, rebound from 1.0505 (2020 low) should have completed at 1.1149 already. The three-wave corrective structure argues that the downtrend from 1.2004 (2018 high) is not over yet. Medium term outlook will now stay bearish as long as 55 week EMA (now at 1.0858) holds. Break of 1.0505 low would be seen at a later stage. However, sustained trading above 55 week EMA will bring retest of 1.1149 high instead.
NASDAQ 100 And S&P 500 Remain Pressured As Fear Rises
US futures retreated in early trading as investors braced for more equities weakness in the coming months. The Dow Jones futures added to the 270 points losses it made on Friday. The Nasdaq 100 and S&P 500 futures were also in the red. Analysts at several leading Wall Street banks expect that equities will retreat in the coming months. Some of the most bearish analysts are from Morgan Stanley, Citigroup, Deutsche Bank, and Bank of America. They cited potential slowdown of earnings, a relatively hawkish Federal Reserve, and higher costs as the supply logjam continue.
The US dollar held steady in early trading as investors refocus on the upcoming American inflation data that will come out on Tuesday. Analysts expect these numbers to show that the headline consumer price index (CPI) declined slightly to 5.3% in August. They also see the core CPI coming in at around 4.2%, which is above the Fed’s target of 2.0%. These numbers will come a few days after the US published the latest Producer Price Index (PPI) data. While the PPI dropped on an MoM basis, it rose to the highest level in years on an annualized basis.
The Japanese yen remained muted in early trading after the latest Producer Price Index (PPI) data. The numbers showed that Japanese producers were still facing significant cost increase. Still, this action is not translating to higher consumer inflation, which remains below 1%. At the same time, with the country reportedly seeing substantial covid cases, there is a likelihood that Japan’s recovery will flatten soon. Later today, Turkey will publish its retail sales data while the US will publish its August Federal budget deficit figures.
EURUSD
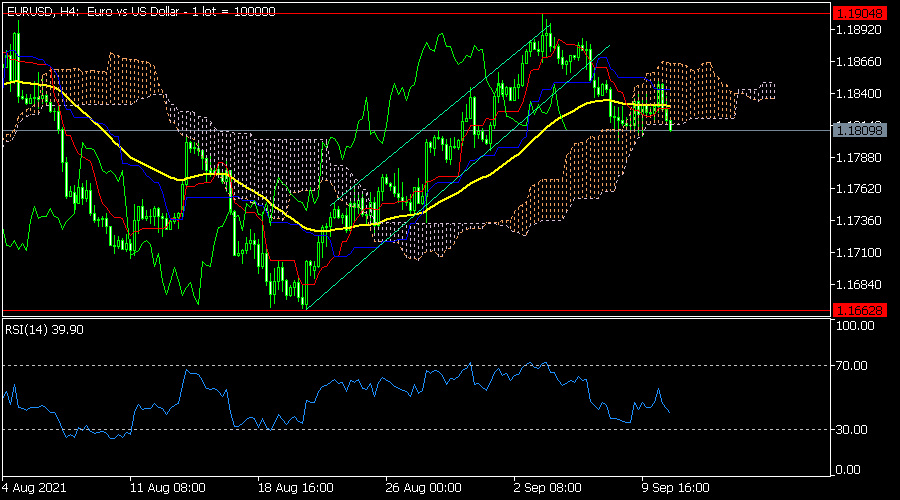
The EURUSD pair declined to 1.1810 as the US dollar held steady. As it did this, the pair managed to move below the Ichimoku cloud. It also moved below the 25-day moving average while the Relative Strength Index (RSI) has turned lower. Therefore, the pair will likely maintain the bearish trend later today as bears target the key support at 1.1750.
NDX100
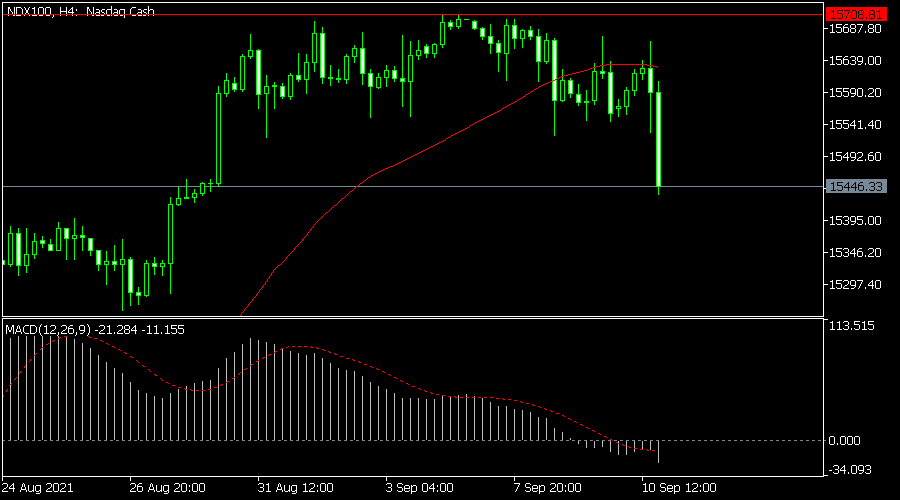
The Nasdaq 100 index futures remained under pressure as the fear and greed index turned negative. The index declined to $15,445, which was the lowest level since August 30. On the four-hour chart, the index has found significant resistance at $15,708. It has also moved below the 25-day moving average while the MACD has moved below the neutral line. Therefore, the index will likely remain under pressure as bears target the key support at $15,000.
SPX500
The S&P 500 index declined to $4,462, which was the lowest level since August 24. Like the Nasdaq 100 index, it has found a strong resistance level at $4,550. It has already moved below the 25-day and 15-day moving averages. It has also moved below the key support level at $4,465 while the Relative Strength Index (RSI) has dropped. Therefore, the index will likely maintain a bearish trend as bears target the key support at $4,400.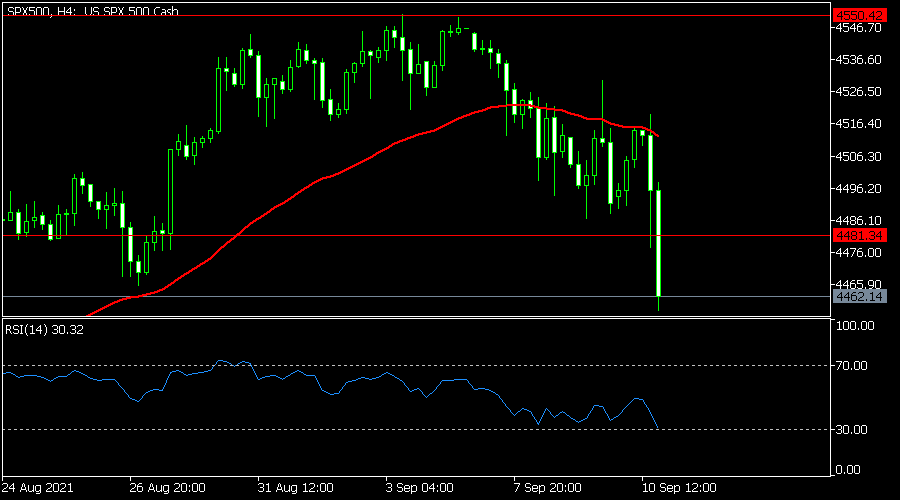
EUR/USD Slips Sub 1.18 Again
Markets
European/German bond yields reversed much of Thursday’s ECB-driven slump on Friday in a relatively quiet session without economic data or headline events scheduled. By doing so, the 10y variant (+3.1 bps) prevented a close outside the upward sloping trend channel (-0.33%, above -0.35% support), keeping the technical picture clean. The advance came on the back of inflation expectations. Other tenors finished 2.3 bps (5y) to 3 bps (30y) higher. US yields also grinded higher on Friday after tanking in the wake of an exceptionally strong 30y auction on ECB-day. The major difference however, was that real yields were responsible for the bear steepening. US rates jumped up to 4.5 bps in the 10y, holding the upward sloping supporting trendline intact. The difference in yield dynamics together with a shaky risk sentiment (WS <1% in the red) favoured the USD over most majors. EUR/USD gave up support at 1.1826 to finish at 1.1814. USD/JPY finished just south of 110. Sterling built on Thursday’s technical break, eking out another gain vs the euro. EUR/GBP could limit losses to 0.854 however, thanks to the overall climate of risk aversion.
Asian markets are bathing in a sea of red this morning. Chinese tech in particular again tumbles after a report that China seeks to break up Alipay, a key digital player. Stocks shed more than 2% (HK, China). Core bonds inch higher in a typical risk-off trade. The US greenback together with the Japanese yen have the advantage on FX markets. EUR/USD slips sub 1.18 again.
And we expect the dollar to keep the upper hand in the short term. Today’s economic calendar is empty but tomorrow we’re getting US CPI numbers for August. They will serve as valuable input for the Fed when it has its FOMC meeting on September 22. Another high reading will reassert/jolt taper expectations, supporting core bond/US yields. For today we’re looking at EUR/USD 1.1782 as a first minor support area, followed by 1.1752. Sterling wasn’t much affected by last week’s industrial update but that may be different this week with the labour market report and CPI inflation due tomorrow and Wednesday respectively. EUR/GBP for now has given up testing the 0.86 zone.
News headlines
According to people familiar with the matter, a draft US tax plan circulated on Sunday. Democrats in the House of Representatives proposed concrete steps to raise $ 2.9 trillion in taxes to fund president Biden’s plans on additional social spending. The US corporate tax rate would be raised from current 21% to 26.5%. The latter is lower than the 28% level initially proposed by president Biden. Democrats are also expected to propose a surtax of 3.0% on individual income above $5 million. The draft was also said to include a rise on the capital gains tax from 20% to 25%. This is also less than initial proposals. The top individual tax raised is considered to be raised to 39.6%.
In a statement on its website, the National Bank of the Czech Republic took notice of the higher than expected August inflation data published on Friday. Headline inflation rose to 4.1% Y/Y, well above the CNB’s 2.0% target with a 1.0% tolerance band. Inflation adjusted for the first-round effects of changes to indirect taxes rose by 3.9%Y/Y. The August inflation figure also exceeded the CNB current forecast by 1.0%, with the deviation mainly due to a faster rise in core inflation and in inflation of food prices. The CNB still expects inflation to to ease gradually at the end of this year. However, domestic price pressures will continue to rise slightly for some time yet, mainly on the back of increased consumer demand and a gradual pick-up in wage growth. The CNB concludes that the published figures represent a significant inflationary risk to the CNB’s current forecast, which is tilted to a more pronounced increase in interest rates compared to the outlook so far. Yield on the Czech two year government bond rose from 1.57% to 1.63% on Friday. EUR/CZK tested the 25.30 barrier, but no sustained break occurred yet.
USD/CAD Bounces Off Support
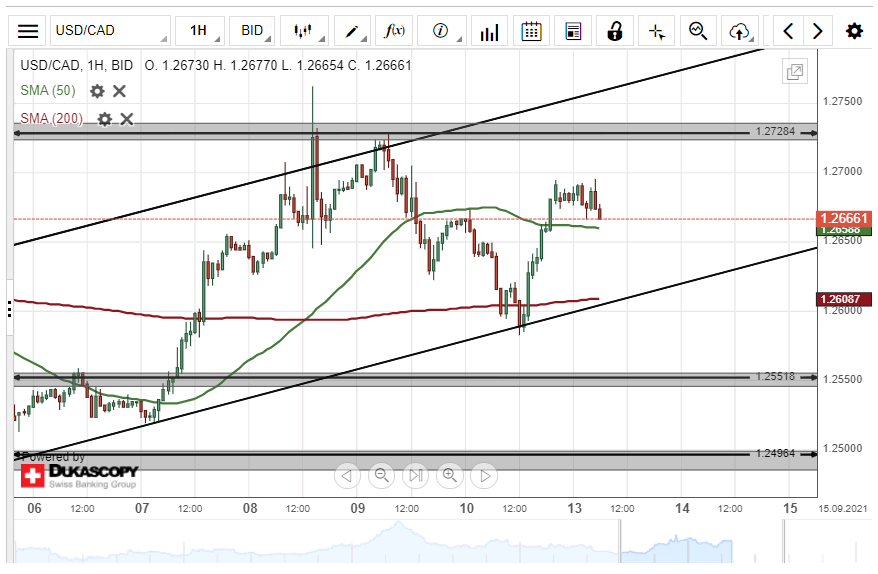
On Friday, the USD/CAD currency pair bounced off the lower line of an ascending channel pattern at 1.2588. As a result, the US Dollar surged by 103 pips or 0.82% against the Canadian Dollar.
Given that the currency pair has bounced off the bottom border of the channel pattern, buyers could continue to drive the exchange rate higher during the following trading session.
However, bullish traders might encounter resistance at 1.2700 within Monday's trading session.
GBP/JPY Tests 50– Hour SMA
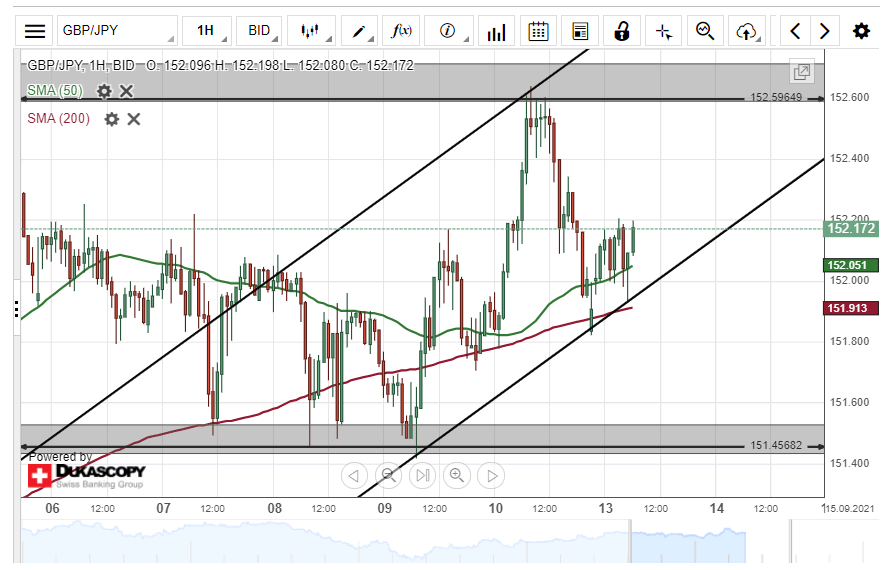
On Friday, the British pound fell by 75 pips or 0.49% against the Japanese Yen. The decline was stopped by the 50– hour simple moving average during Friday's trading session.
The exchange rate is currently trading near the lower line of an ascending channel pattern at 152.05 and could be set for a breakout.
If the breakout occurs, a decline towards the 151.60 level could be expected within this session.
However, if the ascending channel pattern holds, bullish traders would pressure the currency exchange rate higher within the following trading session.