Sample Category Title
CFTC Commitments of Traders – Bets on DXY Index Futures and EUR Futures Declined in Both Sides
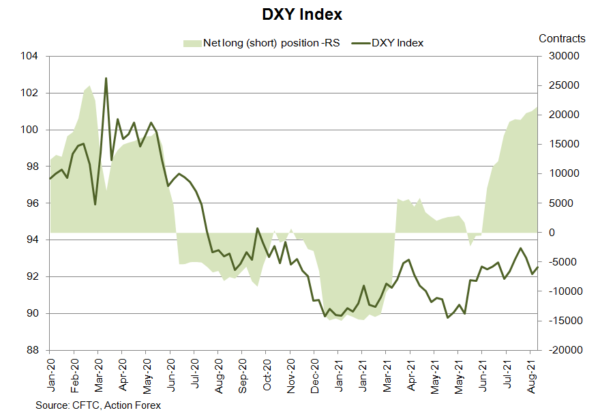
As suggested in the CFTC Commitments of Traders report in the week ended September 7, NET SHORT of USD index futures added +775 contracts to 21 465. Trades continued to drop on both sides with speculative long positions down -2 803 contracts while speculative shorts down -3 578. Concerning European currencies, NET LENGTH in EUR futures jumped +15 832 contracts to 26 308. GBP futures' NET SHORT rose +9 624 contracts to 24 524.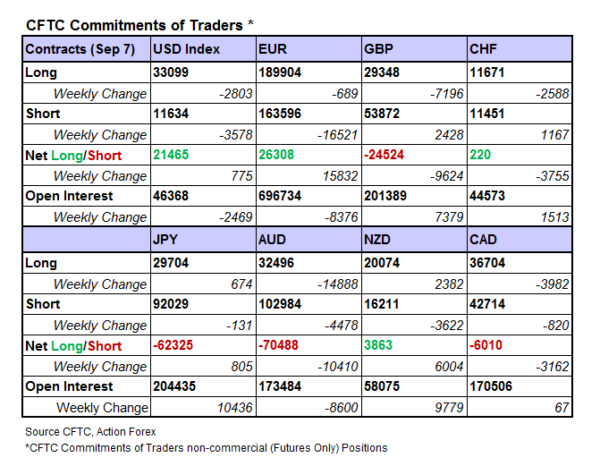
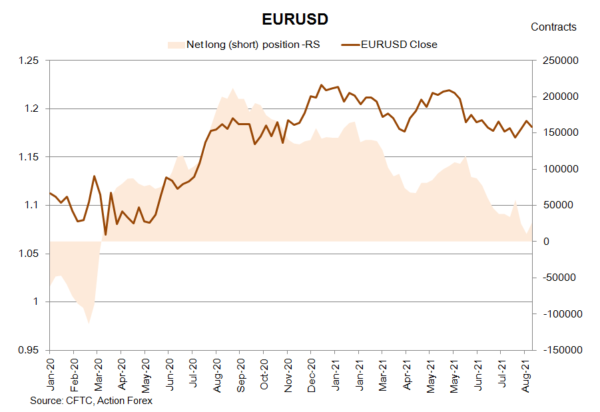
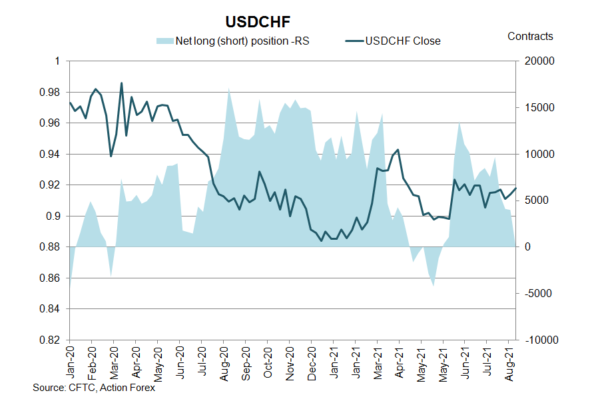
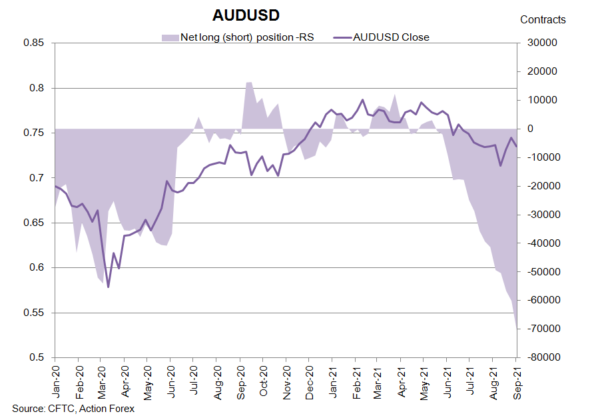
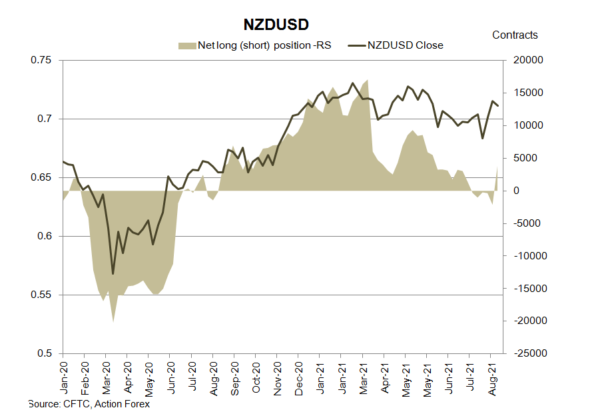
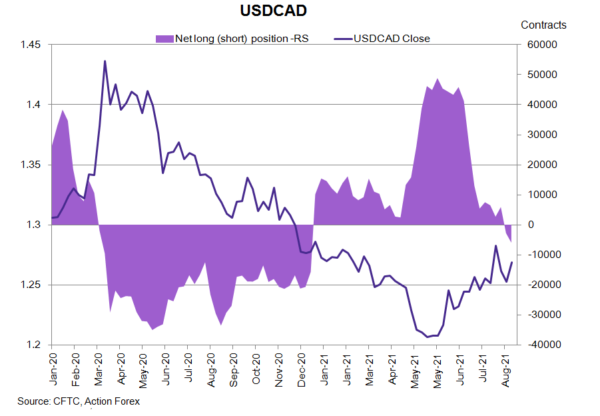
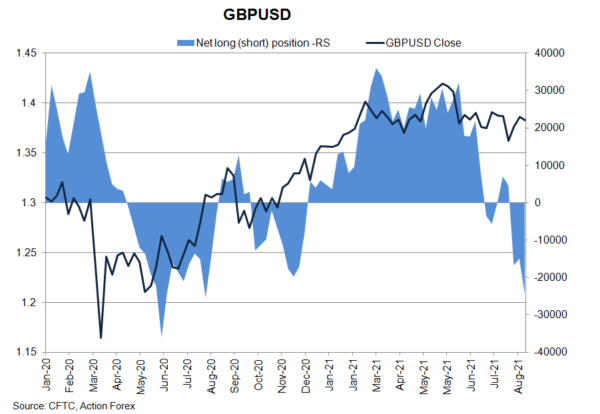 On safe-haven currencies, NET LENGTH of CHF future fell -3 755 contracts to 220 while NET SHORT of JPY futures slipped -805 contracts to 62 325. Concerning commodity currencies, NET SHORT of AUD futures soared +10 410 contracts to 70 488. NET LENGTH for NZD futures jumped +6 004 contracts to 3 863 during the week. CAD futures' NET SHORT rose +3 162 contracts to 6 010.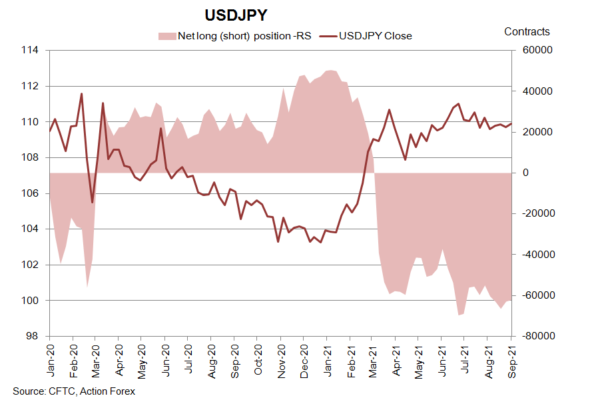
CFTC Commitments of Traders – Gold Price Pressured on Hopes of Rising Yields
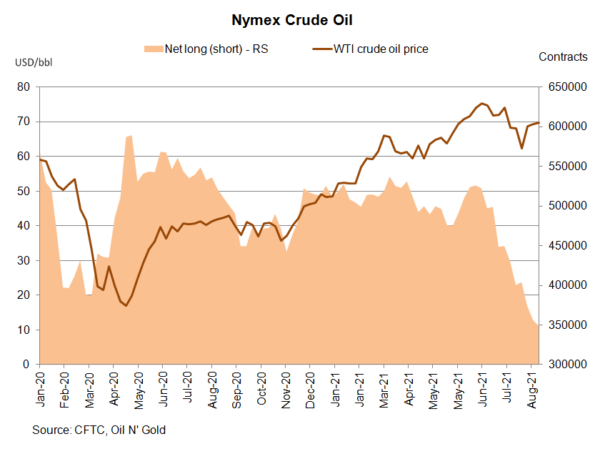
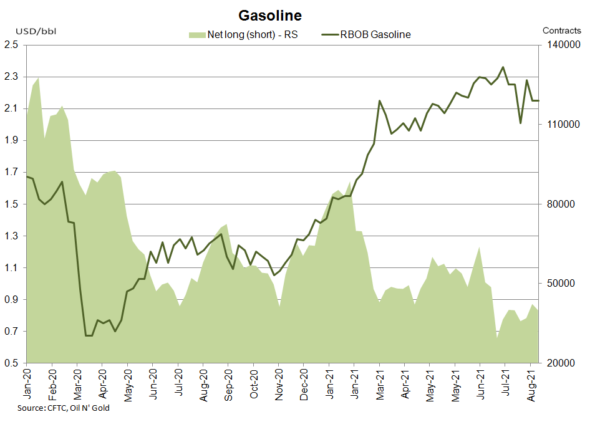
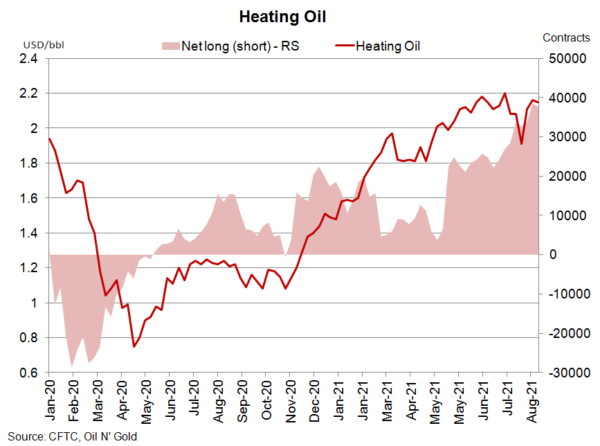
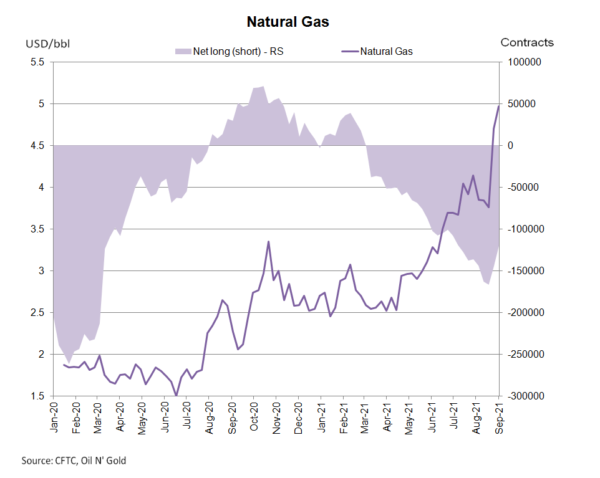
According to the CFTC Commitments of Traders report for the week ended September 7, Trades on crude oil futures fell on both sides. Speculative long position declined -9 065 contracts, while shorts dropped -1 695 contracts, sending NET LENGTH lower (down -7 370 contracts) to 349 158 contracts for the week. For refined oil products, NET LENGTH for heating oil slipped -924 contracts to 37 659, while that for gasoline decreased -2 363 contracts to 39 858. NET SHORT of natural gas futures sank -24 717 contracts to 119 978 during the week.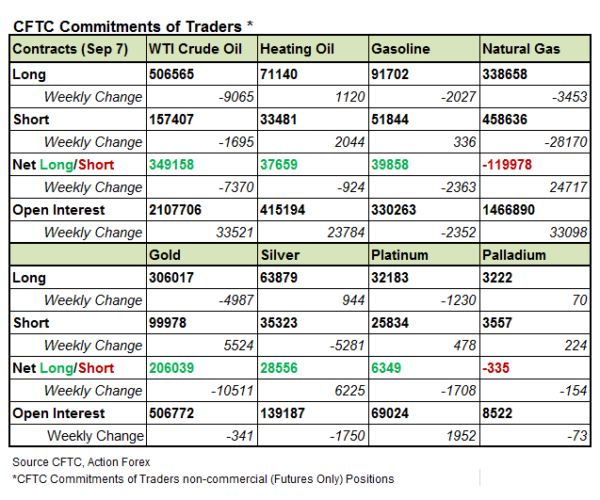
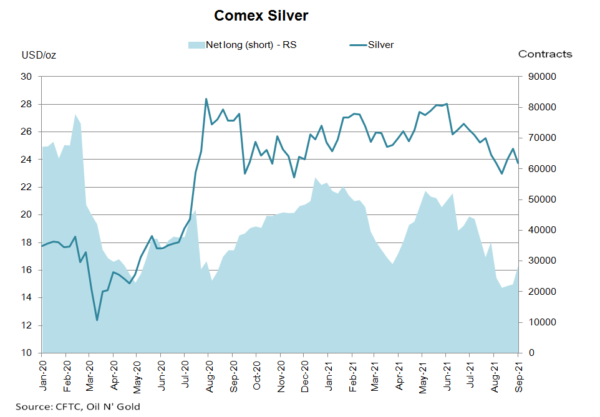
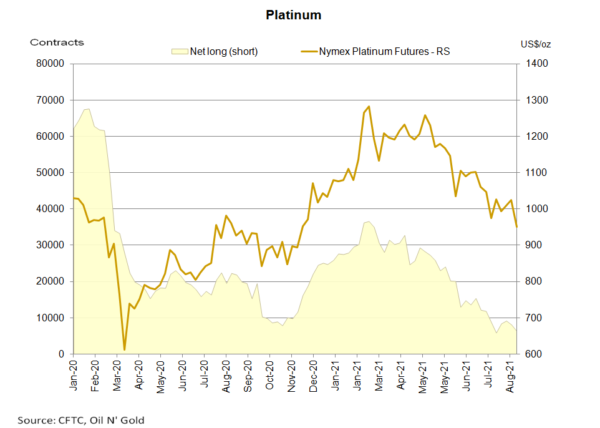
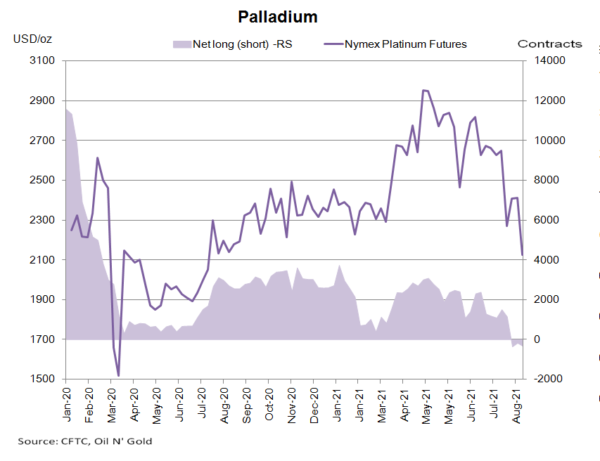
 Gold futures’ NET LENGTH plunged -10 511 contracts to 206 039. Gold price tumbled after the ECB announced moderate asset purchases and upgraded growth and inflation forecasts. While ECB's plan is different from Fed's tapering, the trend of lowering asset purchases has sent yield higher. Silver futures’ NET LENGTH rose +6 225 contracts to 28 556. For PGMs, NET LENGTH of Nymex platinum futures dropped -1 708 contracts to 6 349, while NET SHORT for palladium futures added +154 contracts of 355.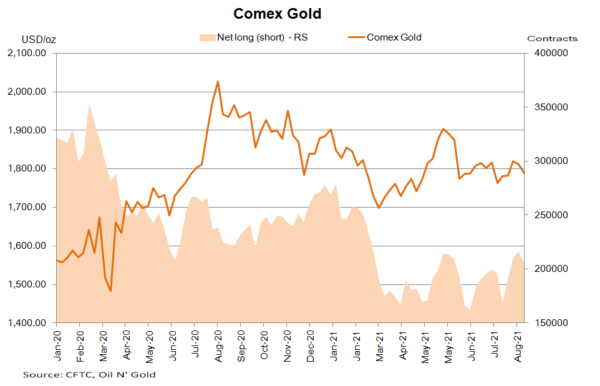
Forex and Cryptocurrency Forecast
EUR/USD: Eurozone QE Recalibration
The ECB meeting on Thursday 09 September went off as expected with no surprises. The interest rate remained unchanged at 0%. The European regulator has proposed a "dovish" reduction in the monetary stimulus program (QE). More precisely, according to Christine Lagarde, the bank's governor, it is not even about "tapering" but "recalibrating" the program. And the decline in asset purchases in Q4 is just a reversal of the decision made in March to increase them. In doing so, the ECB remains flexible, and may change the pace of purchases early next year if necessary.
It is likely that the regulator does not want to take any sharp moves until its meeting in December, when it will have to present a clearer plan to wind down QE. In the meantime, it will monitor the development of the situation. The results of the parliamentary election in Germany, which will be held on September 26, will be of great importance. Especially since this will be the first election since 2005 in which the Christian Democratic Union will not be led by Angela Merkel.
In addition to the "recalibration" decision, the ECB raised its 2021 forecast for Eurozone GDP from 4.6% to 5.0% and for inflation from 1.9% to 2.2%. At the same time, the bank expects consumer price growth to fall to 1.7% in 2022 and 1.5% in 2023. This suggests that its ultra soft monetary policy will last for a very long time. And there is no need to talk about raising interest rates earlier than the end of 2023 - early 2024.
Economic growth sides with the bulls on the EUR/USD pair, while the monetary policy sides with the bears. There have been no clear signals from the ECB, and they are unlikely to arrive until December. Therefore, the market will still be waiting for them from the US Fed to decide which currency to prefer.
The long life of the European QE program has been mentioned above. The Federal Reserve may begin to cut its QE already this year and complete it by the end of 2022. This view is held by the hawkish lobby in the leadership of the US Central Bank. FOMC member Michelle Bowman has even specifically stressed that disappointing employment statistics for August would not get the Fed out of the way.
This balance of strength plays on the dollar side and should send the EUR/USD pair south. At the moment, 50% of experts agree with this, supported by graphical analysis. The pair finished last week at 1.1810, and now it is expected to be supported at levels 1.1800, 1.1750, 1.1705 and 1.1665. 15% of analysts expect the pair to consolidate in the 1.1800 zone, while the remaining 35% are looking north. Resistance levels are 1.1845, 1.1908, 1.1975, 1.2025 and 1.2100.
The indicators on D1 are as follows. Among the oscillators, 50% point north, 10% south, and the remaining 40% are neutral. Among trend indicators, 35% are colored green, 65% are colored red.
The US economic calendar next week looks quite busy, and all the important statistics will be focused on the country's consumer market. The Consumer Price Index will be released on Tuesday, September 14, retail sales on Thursday, September 16, and the University of Michigan Consumer Confidence Index will be released the following day.
GBP/USD: Movement with Almost Zero Result
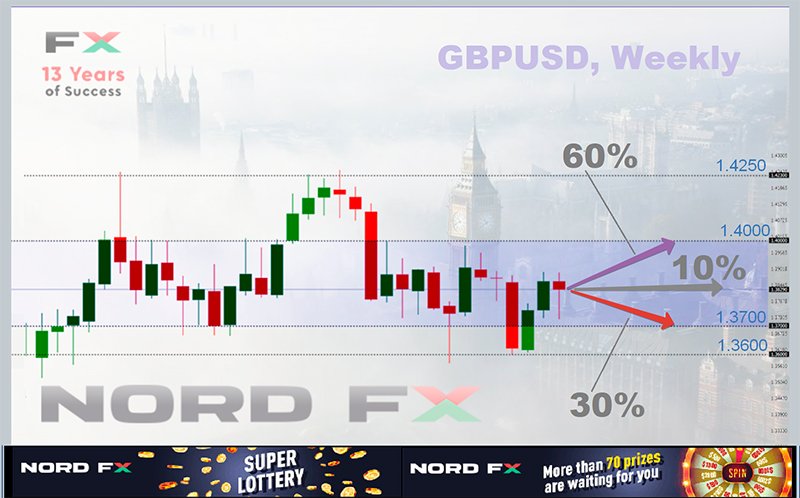
Having drawn a parabola with a low of 1.3725, the GBP/USD pair returned on Friday September 10 to almost the same place it started on Monday (1.3865) and ended the five-day run at 1.3830. It never managed to break beyond the central part of channel 1.3700-1.4000, where it has been intermittently since February 2021.
If it continues to move north (this scenario is now supported by 60% of analysts), then the nearest strong resistance will be met at 1.3909, then 1.3960, 1.4000 and 1.4100. The bulls aim to refresh the June 01 high at 1.4250. In case of the opposite development (30% of experts' votes), it will be supported in zones 1.3730, 1.3665 and 1.3600. The remaining 10% of analysts vote for a sideways trend.
As for the oscillators on D1, 70% are colored green, 15% have taken a neutral position, and another 20% indicate that the pair is overbought. In trend indicators, like a week ago, the greens win 9-1.
Events in the coming week include the release of unemployment data in the UK on Tuesday, September 14, and statistics on the country's consumer market on Wednesday, September 15.
USD/JPY: Another Zero Result Pair
Being a safe haven, the USD/JPY pair has been moving along the 110.00 horizon since last March, making rare attempts to get out of the 108.30-111.00 trading channel. So this time again, having started the five-day week at 109.70, it ended the week almost at the same place where it began, at the level of 109.85. Moreover, the trading range has become even narrower, keeping within 85 points: from 109.60 to 110.45. Those who are actively trading are hardly happy with such volatility. Although, on the other hand, it allows you to quite accurately place Stop Loss and Take Profit orders and taking into account the minimum spreads and leverage up to 1: 1000, you can make significant profits with the NordFX broker even in such a narrow corridor.
The experts' forecast for the near future looks like this: 50% of them side with the bears, 15% - with the bulls, and 35% have taken a neutral position. As for the indicators on D1, the red ones have 60% advantage among oscillators, the green ones have 10%, and those that have taken a neutral, grey position - 30%. Trend indicators have a 50-50 draw.
Support levels are 109.60, 109.10, 108.70 and 108.30. The bears' dream is to retest the April low of 107.45. The nearest resistance levels are 110.00, 110.25, 110.55, 110.80, 111.00 and 111.65. The ultimate goal of the bulls is still the same: to reach the cherished height of 112.00.
CRYPTOCURRENCIES: September 07: Rainy Day
The past week on the crypto market can be reduced to one day, Tuesday September 07. A law came into force in El Salvador on that day recognizing bitcoin as a legal means of settlement on par with the dollar. The country's young president, Nayib Bukele, twitted about this three minutes before midnight local time. "In three minutes we will go down in history," he wrote. Earlier, the head of state confirmed that the government of El Salvador acquired the first 200 BTC. Bitcoin has been rallying since July 20 and has jumped above $52,000 since this announcement.
Roughly 20% of the country's GDP comes from remittances that Salvadorans working abroad send to their relatives. The huge commissions in USD that have to be paid are extremely unprofitable and enrich the US financial structures. This is what has been one of the main reasons for bitcoin adoption. However, for most Salvadorans, a third of whom do not even use the internet, digital assets still remain a mystery behind seven seals. According to surveys, about 70% of the population fear the innovations, and pensioners believe that the government wants to take away their USD pensions in this way. The result of these concerns and misunderstandings were protests and demonstrations that swept across the country.
The World Bank refused to support the initiative of Nayib Bukele, which jeopardizes the receipt of tranches from the IMF. According to analysts, El Salvador does not have specific laws to address the many nuances of bitcoin use, increasing the risks associated with money laundering and terrorist financing . And leading rating agencies such as Fitch believe El Salvador's insurance industry will be particularly hit. Bonds rated B- are already circulating in it, and now the situation will be aggravated by the presence of an unstable cryptocurrency.
September 7 clearly showed how unstable it is. In a matter of hours, bitcoin prices fell 18%, from $52,870 to $43,205, dragging down the entire crypto market.
Then the leading cryptocurrency managed to win back some of the losses, and it is trading in the range of $45,000-46,000 per coin at the time of writing the review, on Friday September 10.
The Crypto Fear & Greed Index has shifted into the fear zone, dropping from 74 to 46 points. The total crypto market capitalization fell below the important psychological level of $2 trillion to $1.975 trillion by September 08, but then rose to $2.100 trillion by the end of the working week.
Despite what has happened, many experts are still positive about the prospects for both bitcoin and ethereum. For example, senior strategist Mike McGlone called the $100,000 mark for bitcoin and the $5,000 mark for ethereum as "the path of least resistance" in the September Bloomberg Crypto Outlook report. "Crypto assets enter a renewed second-half year bull market after a serious drop from previous highs," the Bloomberg expert noted, adding that he sees "bitcoin's future as a digital reserve asset to complement the dollar."
The management of the billionaire Bill Miller's Miller Opportunity Trust also speaks about the significant growth potential of the BTC/USD pair, calling bitcoin a digital analogue of gold. "Gold capitalization is $11 trillion, bitcoin is only $900 billion, which is a significant lag. We are in the early days of bitcoin adoption and the asset will be very volatile, but we believe the risk to reward ratio is attractive," the Miller Opportunity Trust said in a statement filed with the US Securities and Exchange Commission (SEC).
Ark Invest CEO Cathy Wood also believes that the cryptocurrency market is far from the end of the rally. There are no signs of a price bubble in the markets, she said. "We think bitcoin is much more than a store of value or digital gold. This is a new global monetary system that is completely decentralized and not subject to politicians' whims". That being said, Cathy Wood thinks the next five to fifteen years will be very provocative, causing the quotes to draw S-shaped curves. And therefore, for the sector to mature, regulation is needed that will affect bitcoin in the most positive way.
Analysts at the international banking group Standard Chartered have also given a positive assessment of the outlook for bitcoin and ethereum. They compared the first with currency, and the second with the financial market, where lending, insurance and exchange transactions take place. Therefore, given the wider range of ETH use cases, its capitalization may eventually reach that of the first cryptocurrency.
Standard Chartered predicts bitcoin prices in the $50,000-$175,000 range and ethereum in the $26,000-$35,000 range. Thus, these cryptocurrencies should grow threefold and tenfold, respectively. "While the return on ETH may outperform BTC in the future, the risks associated with it are also higher," the bank representatives said.
On average, 20% of analysts agree that the BTC/USD pair will cross over $50,000 in the coming week, their number increases to 40% onthe monthly forecast, and 80% agree that it will happen before the New Year.
The Weekly Bottom Line: Holding the Helm in Stormy Waters
U.S. Highlights
- The economy is fighting stormy undercurrents caused by the Delta variant, but we are confident that it will stay the course.
- The job market will take longer to recover, but demand for workers should remain strong.
- Businesses remain under pressure to raise prices for consumers, which will keep the Fed under pressure to scale back its asset purchase program by the end of the year.
Canadian Highlights
- This week’s Bank of Canada interest rate meeting was a ho-hum affair, with no adjustments to either the overnight rate or the Banks’ QE program. However, October’s meeting could see bond-buying tapered to $1 billion/week.
- Should this unfold, it would bring the Bank one-step closer to the reinvestment phase (where QE stimulus is being maintained rather than increased), which Governor Macklem spoke on this week. Crucially, he noted that rate hikes (versus QE) would likely be the first lever pulled when stimulus is eventually removed.
- August’s 90k job gain was solid, although a soft print for hours worked creates some risk for third quarter GDP growth.
U.S. - Holding the Helm in Stormy Waters
From Labor Day onward it was supposed to be relatively smooth sailing for the American economy, underpinned by solid job gains and healthy consumption growth. Instead, the economy is fighting stormy undercurrents caused by the Delta variant, which triggered a slowdown in hiring momentum and a plunge in consumer sentiment heading into the fall. We are confident that the economy will stay the course, but it will take more time and more patience.
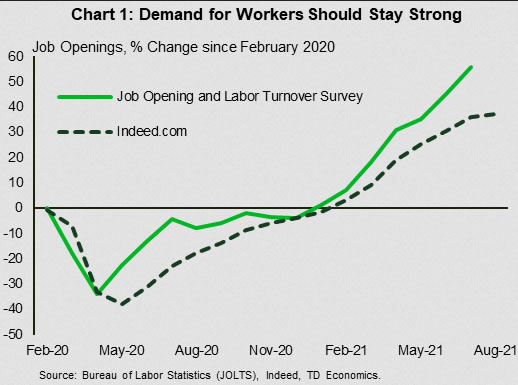
This week offered a look back at recent history when Delta was not yet a concern. July’s Job Opening and Labor Turnover Survey (JOLTS) delivered yet another month of record level job openings. Even if Delta-related concerns resulted in a pull-back in August, demand for workers most likely remained strong as evidenced by a higher frequency data from the job site Indeed.com (Chart 1). This indicates that August was another month where the number of jobs available outstripped the number of unemployed, suggesting that businesses may need to find more creative ways to increase employment.
With lingering effects of the pandemic, the job market will likely take longer to recover fully. Economists cite several reasons why workers are not taking advantage of the seemingly insatiable demand for their labor. One of them – pandemic-related emergency unemployment aid has ended this week. Whether it will result in an influx of eager workers is yet to be seen. There is scant evidence that states that ended the additional benefits before the nation-wide expiry date saw any significant boost to employment.
At the same time, limited childcare options remain a concern. In the most recent Census’ household pulse survey released this week, respondents from the states that lead in COVID-19 cases reported an alarming month-on-month jump in the share of households where children were unable to attend childcare because of safety concerns. This was reflected in the August household survey, which showed a reduction in employment of women with kids under 18.
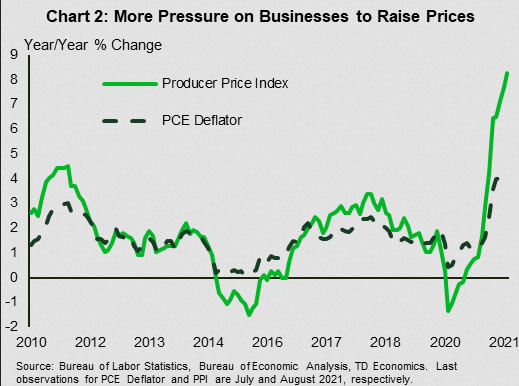
Safety concerns were also widely cited in this week’s Beige Book report that pointed to a slower demand in activities dependent on social interactions, such as dining out, travel, and tourism. The slow-down could result in a roll-back in the recent rebalancing from goods to services consumption. The report also noted “pervasive resource shortages [and] input price pressures” – a sentiment echoed in today’s print of the Producer Price Index, which grew by 8.3% year-on-year. This suggests that businesses remain under pressure to raise prices (Chart 2).
All in all, as a result of Delta, seas are choppier on both supply and demand fronts. But, like past waves, this too is likely to pass, and as it does, the recovery will gain speed. The job of the Fed will be to ensure that the path for inflation also steadies, likely to require a slowing in the pace of accommodation and an easing in asset purchases by the end of the year.
Canada - Gone Till October
This week's Bank of Canada interest rate decision was a come-and-go affair. Policymakers did as anticipated, leaving the overnight rate at the effective lower bound (ELB) of 0.25% and maintaining a $2 billion/week pace to their asset purchasing program. Their forward guidance was also unaltered, with the overnight rate expected to remain at the ELB until slack is absorbed (which in their July projection is in the second half of 2022).
More noteworthy was the positive skew underlying their characterization of the economic backdrop. Although they acknowledged the steep miss in second quarter GDP (which contracted by 1.1% q/q annualized versus expectations of a 2.5% gain), domestic demand outside of residential investment was highlighted as continuing to make progress. Perhaps most interestingly, the Bank referred to the employment accelerations in June and July, but ignored Statistics Canada's flash estimate of a sizeable decline in July's GDP.
Heading into the meeting, there were compelling reasons to expect the Bank to stand-pat on policy. Most notably, updated growth and inflation projections will accompany their October 27th interest rate decision, providing ample opportunity to offer rationale for any change in course. Our own view sees policymakers having enough confidence in the recovery to reduce their pace of asset purchases to $1 billion/week at their October meeting.
This will move the Bank one step closer to the "reinvestment" phase of their QE program. This is when policymakers will shift from providing additional stimulus to maintaining current levels through adjustments to their bond purchasing program. Governor Macklem spoke on this topic this week, noting that that the switch to reinvestment will still require the Bank to buy an average of about $1 billion worth of bonds each week, and that the transition to this phase will be done in a gradual and measured manner with clear communication from the Bank. The Governor also took pains to emphasize that decisions on interest rates and bond purchases were separate. And, when the time comes to reduce monetary stimulus, the first move would come through an increase in the interest rate. This implies that the reinvestment phase of QE could last until at least the second half of next year.
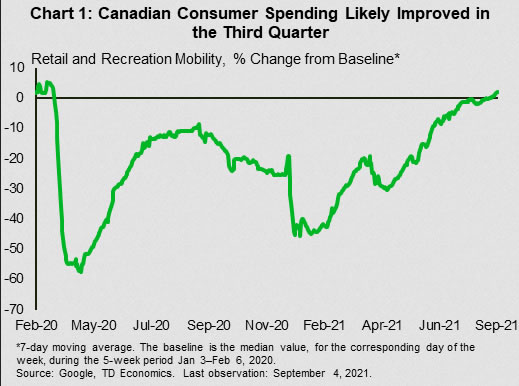
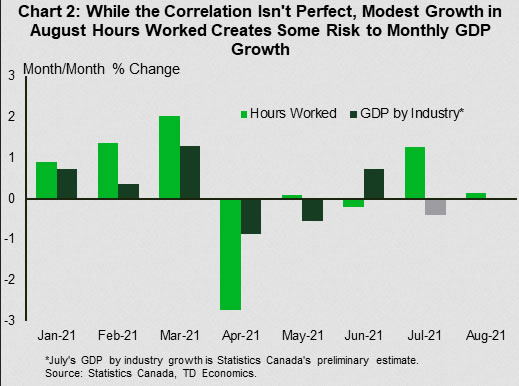
Ultimately, the conduct of monetary policy will depend on how the recovery unfolds and inflation evolves. On the former front, we expect a decent showing for third quarter GDP growth, underpinned by consumer spending (Chart 1). This view depends significantly on how the economy fared in August, especially given indications that July was a soft month for activity. Today's jobs report provided some reassurance, as 90,000 jobs were added in August, marking a solid reading. Details were strong in several areas of the report, as job gains were driven by private-sector and full-time positions. The unemployment rate also dropped to its lowest level since the start of the pandemic (7.1%). The one fly in the ointment was hours worked, which increased by only 0.1% m/m (Chart 2). This modest print creates some risk to our expectation for third quarter growth.
Forward Guidance: Inflation Data to Take Centre Stage
Inflation reports will steal the spotlight next week, with annual Canadian price growth expected to climb to 4% in August compared to a year ago—the fastest pace since 2003. But much of that rise is from very low levels last year, when tighter COVID restrictions were in place. These so-called “base effects” also explain why Canada’s CPI was up 3.7% year-over-year the prior month. Strip them away and CPI appears more normal, growing at an annualized 2.1% in July compared to pre-pandemic February 2020 levels. The dynamic is also likely why the BoC has characterized much of recent CPI increases as ‘transitory.’ Still, recent reports have shown a broadening in price pressures. Prices for autos have been driven up by supply chain disruptions. Shelter prices have risen rapidly too, though will likely slow as resale markets come off the boil and lumber prices drop.
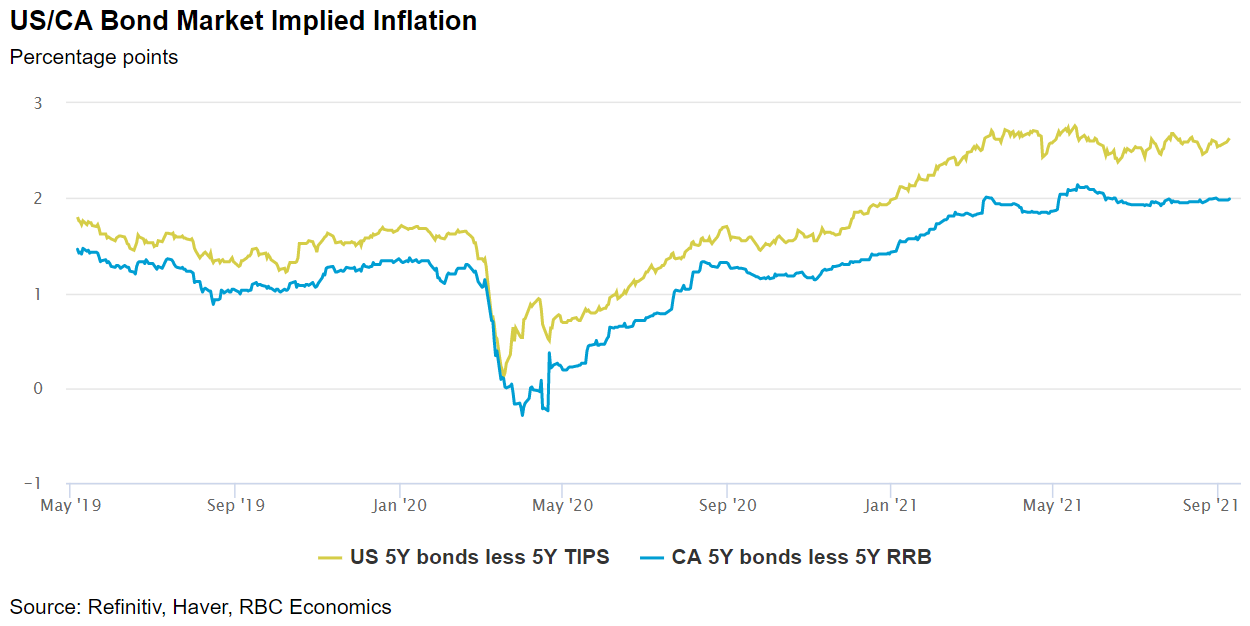
Meanwhile, we expect U.S. inflation to hold at 5.4%, even as monthly price growth eases. And across both countries, there’s little to suggest long run inflation expectations are coming undone. Bond market pricing shows expectations were relatively stable in recent months, though pent up demand for services may push prices higher. To be sure, signs of (broadly-based) price growth above pre-pandemic trends would be harder to dismiss as ‘transitory’. And the demand growth that would generate that kind of inflation pressure depends on the virus. Over 85% of eligible Canadians are now at least partially vaccinated. But the threat of COVID is not gone, and the economy is far from fully recovered. Monetary policymakers will be in no hurry to pull back on stimulus even if inflation continues to overshoot the 1% to 3% target range for a few more months.
Week ahead data watch:
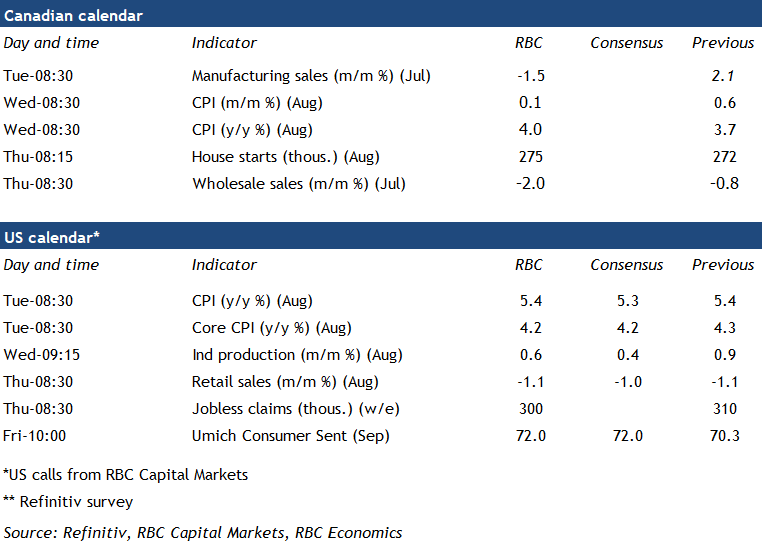
- Statscan’s preliminary estimates for Manufacturing and Wholesale sales both pointed declines in July (-1.2% and -2.0%, respectiely). Both likely reflected in part sharply lower lumber prices, which fell more than 20% in July.
- US CPI inflation is expected to remain sharply elevated on a year-over-year basis at 5.4%. However focus will be on month-over-month growth for signs of further moderation after slowing to 0.4% from an average of 0.7% the prior three months.
- Solid permit issuance is expected to continue to support elevated levels of Canadian housing starts (275k) in August.
- We look to see US retail sales to record another decline of 1% in August on account of lower auto sales.
Summary 9/13 – 9/17
Monday, Sep 13, 2021
[php_everywhere instance="1"]
Tuesday, Sep 14, 2021
[php_everywhere instance="2"]
Wednesday, Sep 15, 2021
[php_everywhere instance="3"]
Thursday, Sep 16, 2021
[php_everywhere instance="4"]
Friday, Sep 17, 2021
[php_everywhere instance="5"]
EUR/USD Weekly Outlook
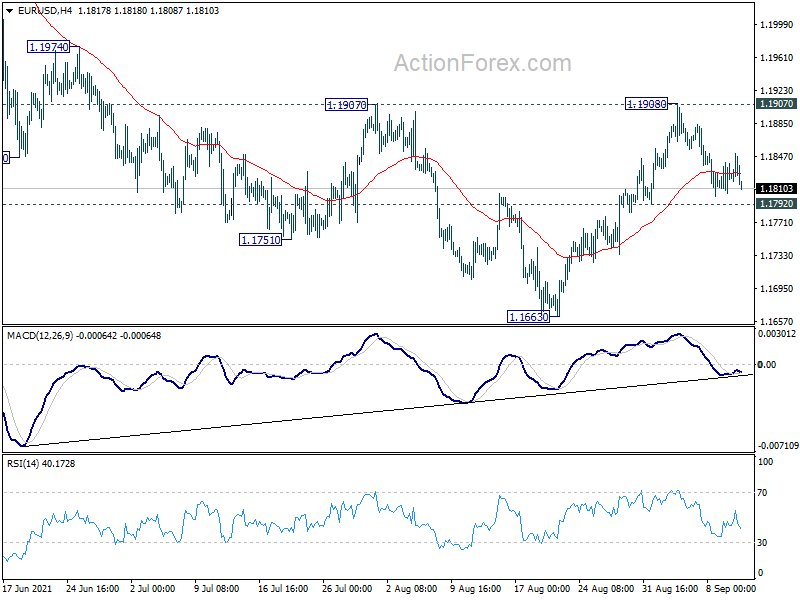
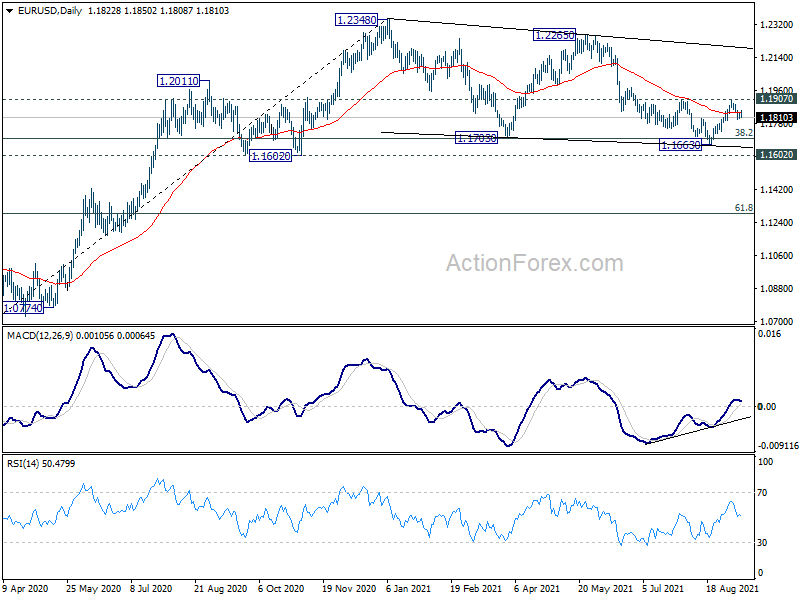
EUR/USD retreated from 1.1908 last week but downside is contained above 1.1792 minor support so far. Initial bias remains neutral this week first. On the upside, sustained break of 1.1907 resistance will indicate that fall from 1.2265, as well as the consolidation pattern from 1.2348, have completed. Near term outlook will be turned bullish for 1.2265/2348 resistance zone. However, on the downside, break of 1.1792 will retain near term bearishness, and turn bias back to the downside for 1.1663 support instead.
In the bigger picture, rise from 1.0635 is seen as the third leg of the pattern from 1.0339 (2017 low). Further rally remains in favors long as 1.1602 support holds, to cluster resistance at 1.2555 next, (38.2% retracement of 1.6039 to 1.0339 at 1.2516). However sustained break of 1.1602 will argue that the rise from 1.0635 is over, and turn medium term outlook bearish again. Deeper fall would be seen to 61.8% retracement of 1.0635 to 1.2348 at 1.1289 and below.
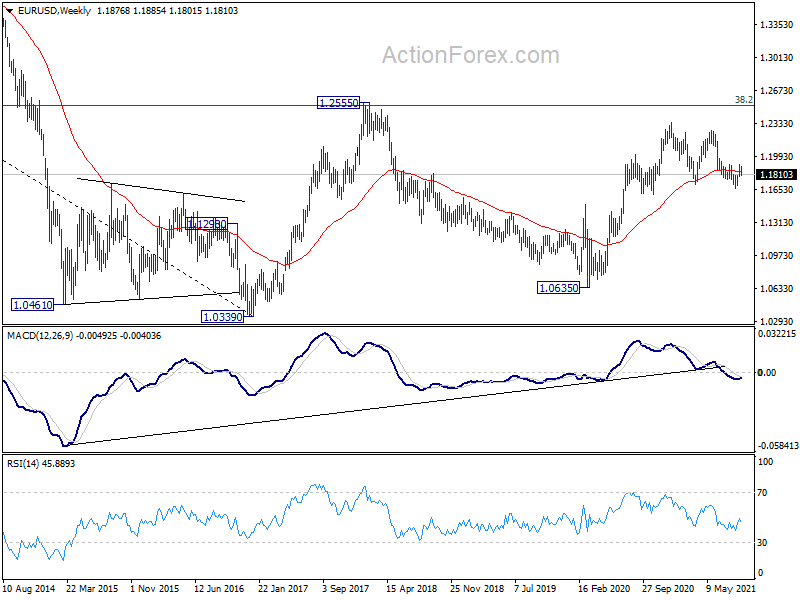
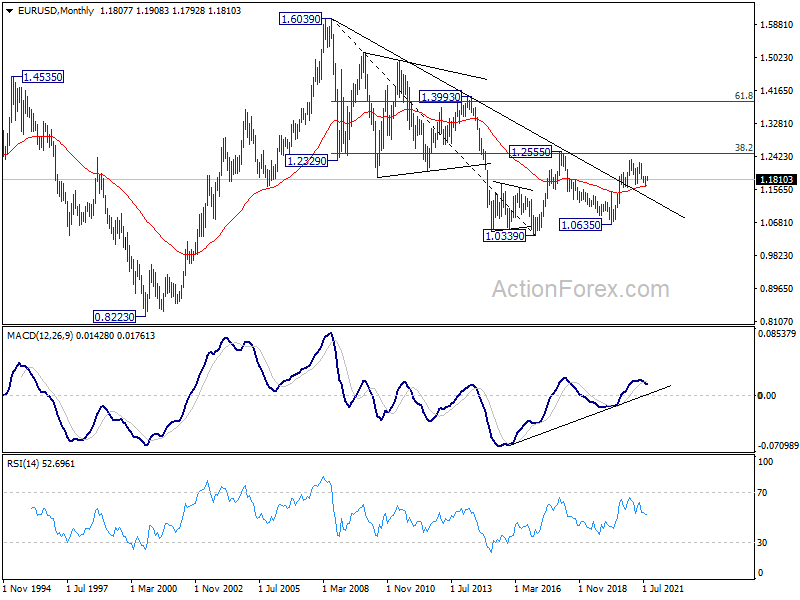
In the long term picture, focus remains on 1.2555 cluster resistance (38.2% retracement of 1.6039 to 1.0339 at 1.2516). Sustained break there should confirm long term bullish reversal and target 61.8% retracement at 1.3862 and above. However, rejection by 1.2555 will keep long term outlook neutral first, and raise the prospect of down trend resumption at a later stage.
USD/JPY Weekly Outlook
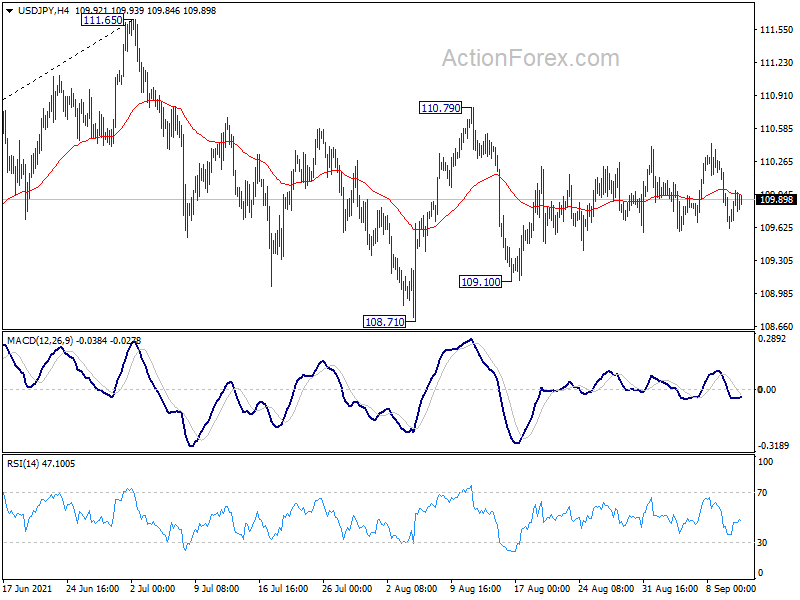
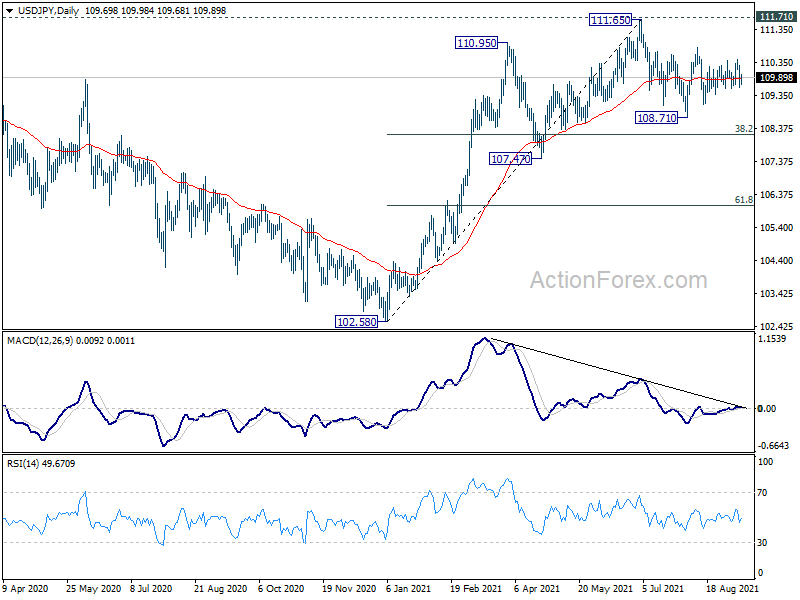
USD/JPY stayed in range of 109.10/110.79 last week and outlook is unchanged. On the upside, break of 110.79 will resume the rebound from 108.71 to retest 111.65 high. On the downside, break of 109.10 will target 108.71 support first. Firm break there will resume the decline from 111.65 and target 38.2% retracement of 102.58 to 111.65 at 108.18 next.
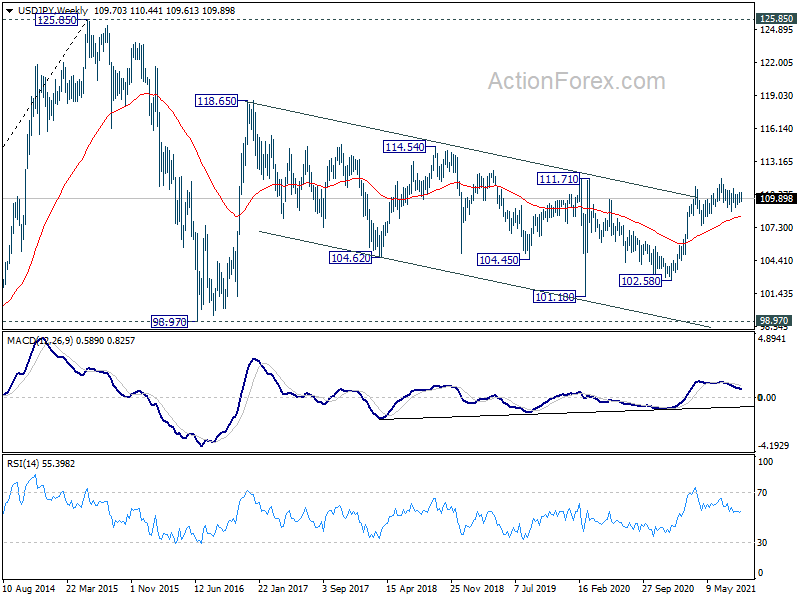
In the bigger picture, medium term outlook is staying neutral with 111.71 resistance intact. The pattern from 101.18 could still extend with another falling leg. Sustained trading below 55 day EMA will bring deeper fall to 107.47 support and below. Nevertheless, strong break of 111.71 resistance will confirm completion of the corrective decline from 118.65 (2016 high). Further rise should then be seen to 114.54 and then 118.65 resistance.
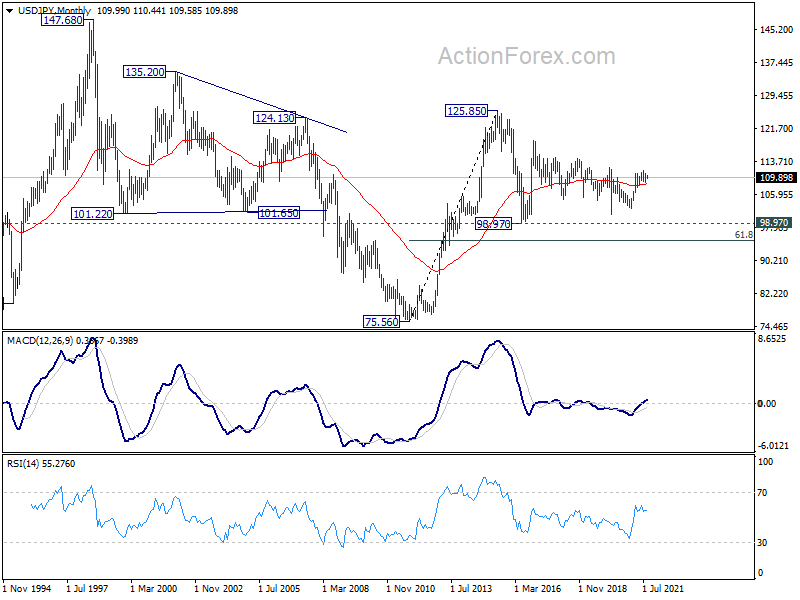
In the long term picture, the rise from 75.56 (2011 low) long term bottom to 125.85 (2015 high) is viewed as an impulsive move, no change in this view. Price actions from 125.85 are seen as a corrective pattern which could still extend. In case of deeper fall, downside should be contained by 61.8% retracement of 75.56 to 125.85 at 94.77. Up trend from 75.56 is expected to resume at a later stage for above 135.20/147.68 resistance zone.
GBP/USD Weekly Outlook
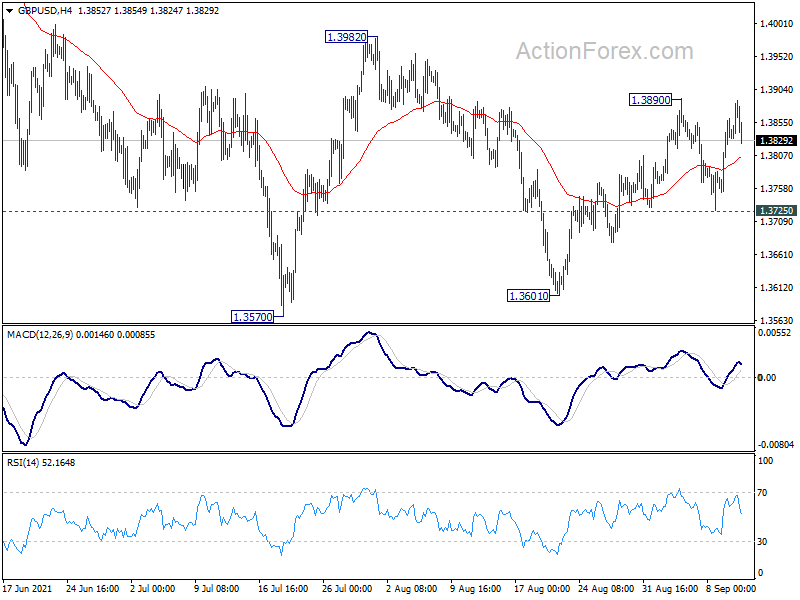
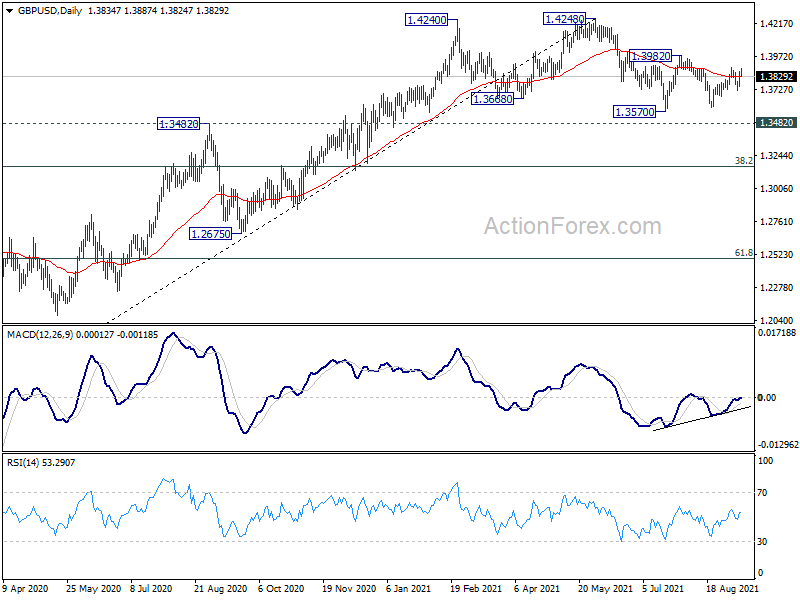
GBP/USD quickly rebounded after initial pullback last week. But it stayed below 1.3890 resistance so far. Initial bias remains neutral this week first. On the upside, above 1.3890 will resume the rise from 1.3601 for 1.3982 resistance. Decisive break there will l indicate that fall from 1.4248 has completed. On the downside, however, break of 1.3725 support will turn bias back to the downside for retesting 1.3570/3601 support zone instead.
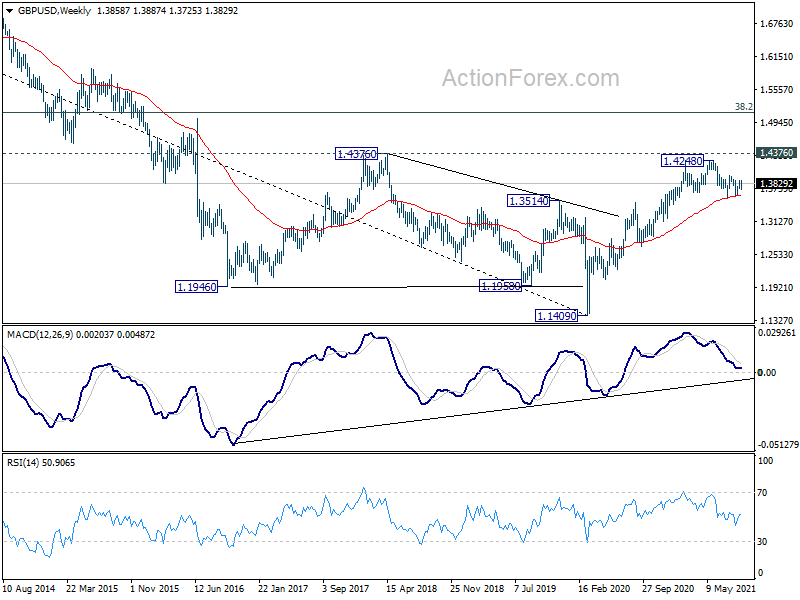
In the bigger picture, as long as 1.3482 resistance turned support holds, we'd still treat price actions from 1.4248 as a corrective move. That is, up trend from 1.1409 (2020 low) is in favor to resume. Decisive break of 1.4376 key resistance (2018 high) would indeed carry long term bullish implications. However, sustained break of 1.3482 will at least bring deeper fall to 38.2% retracement of 1.1409 to 1.4248 at 1.3164, or even further to 61.8% retracement at 1.2493.
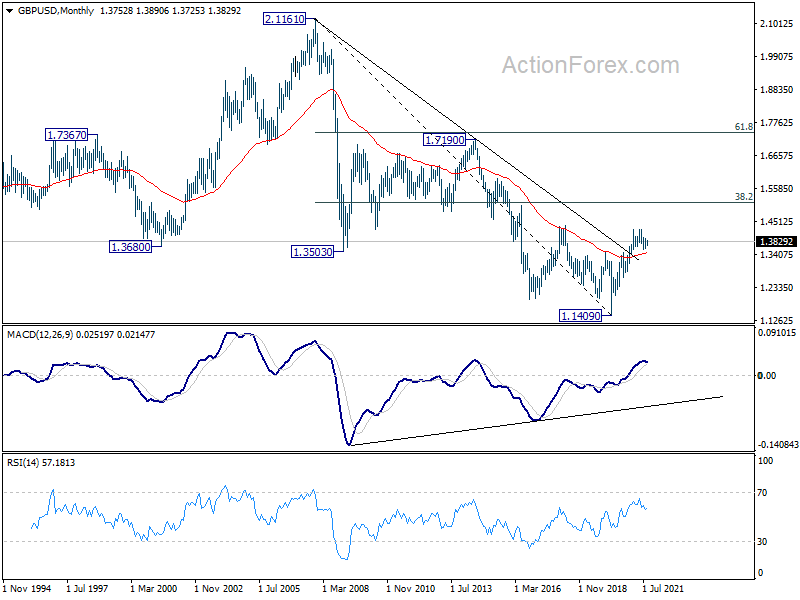
In the longer term picture, a long term bottom should be in place at 1.1409, on bullish convergence condition in monthly MACD. Rise from there would target 38.2% retracement of 2.1161 to 1.1409 at 1.5134. Reaction from there would reveal whether rise from 1.1409 is just a correction, or developing into a long term up trend.
USD/CHF Weekly Outlook
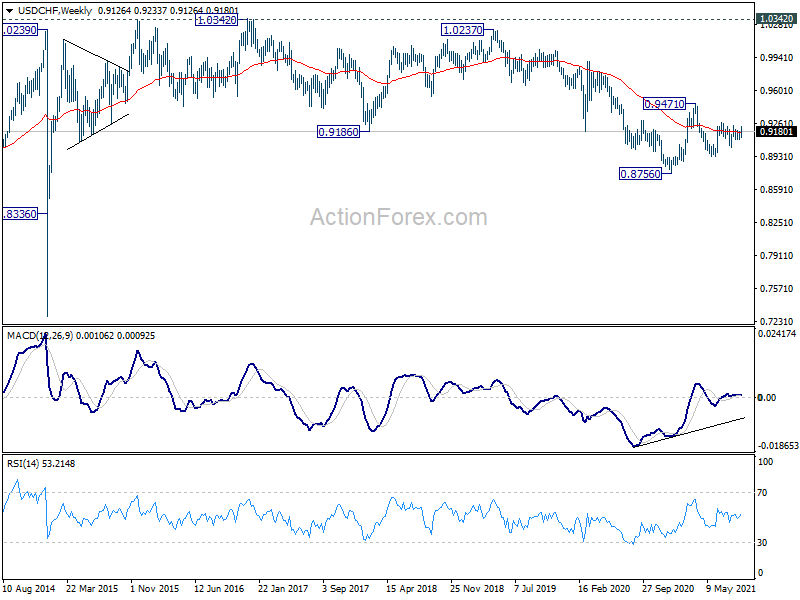
No change in USD/CHF's outlook as it continued to trading sideway in range last week. Initial bias remains neutral this week first. On the downside, break of 0.9098 will target 0.9017 support first. Further break there will likely resume the decline from 0.9471 through 0.8925 low. On the upside, break of 0.9241 resistance should resume the rise from 0.8925 through 0.927.
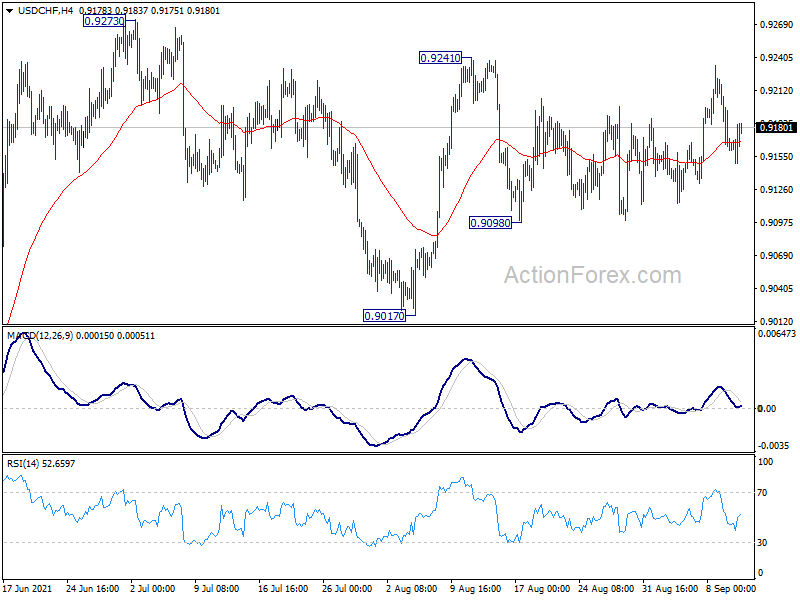
In the bigger picture, USD/CHF is still struggling around 55 week EMA (now at 0.9176) and outlook is mixed for now. Confirmed rejection by the 55 week EMA will retain medium term bearishness. That is, larger fall from 1.0342 would resume through 0.8756 low at a later stage. However, sustained trading above 55 week EMA will tilt favor to the case of bullish reversal. Focus would then be turned to 0.9471 resistance for confirmation.
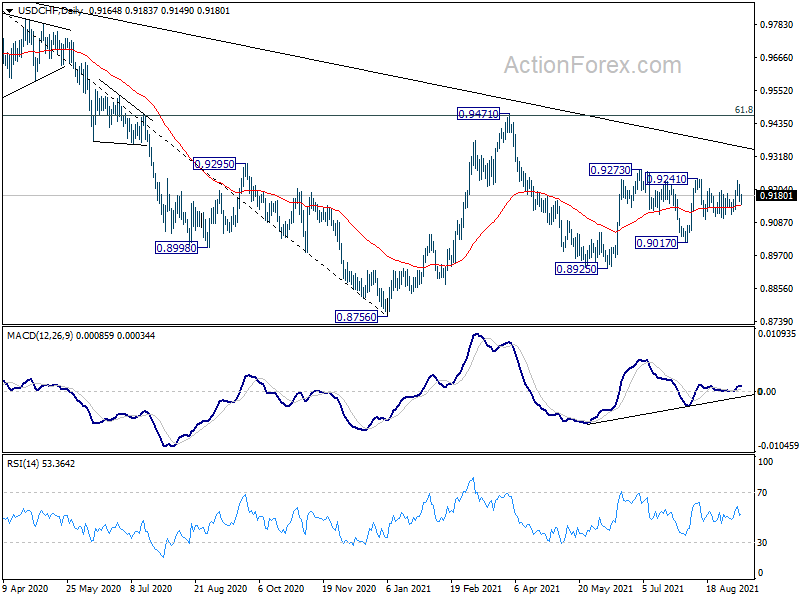
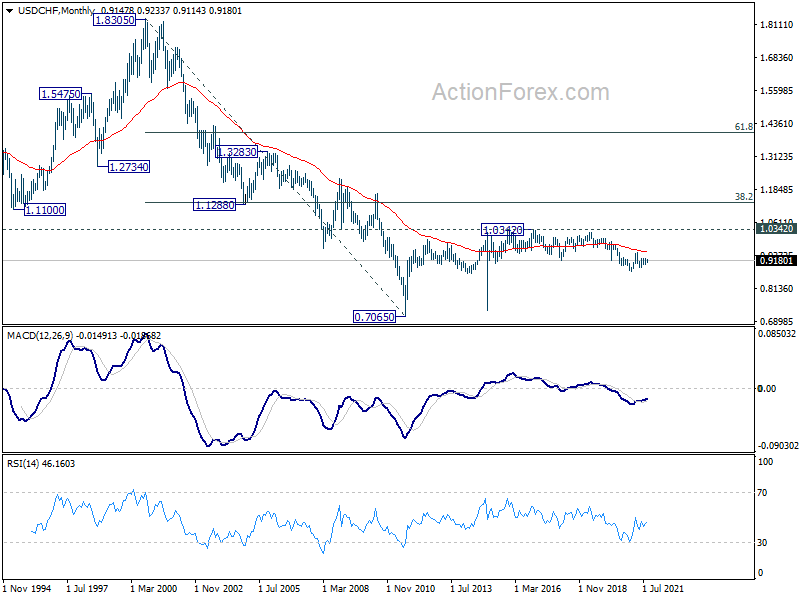
In the long term picture, price actions from 0.7065 (2011 low) are currently seen as developing into a long term corrective pattern, at least until a firm break of 1.0342 resistance.