Sample Category Title
China PMIs Sink Asia Equities
China PMIs sink Asia equities
Overnight, US markets enjoyed a positive day notable for strong flows into technology stocks. The S&P 500 and Nasdaq closed at record highs as the S&P 500 rose 0.43% and the Nasdaq climbed by 0.90%. The Dow Jones appeared to be suffering some Hurricane Ida effects as it finished 0.16% lower. US after-market futures on all three are slightly higher in Asia, rising around 0.10%.
The story in Asia is very different, though. Regional markets were always likely to struggle after China announced limits on children’s online game time, with China tech stocks sure to have been in the firing line. But a barely expansionary China Manufacturing PMI and the surprise tumble by the Services PMI sealed the region’s fate, and equity markets have mostly headed south.
After reasonable data releases, Japan and South Korea have recovered their post-China data losses, the Nikkei and Kospi rising 0.45% today. However, in China, the Shanghai Composite has fallen 0.75%, with the CSI 300 and Hang Seng tumbling by 1.45%. Singapore is 1.40% lower, with Taipei falling 0.65%, Jakarta by 0.25%, and Bangkok is flat. Malaysia is on holiday. Australia has taken its cues from New York, and post a solid current account release, the ASX 200 and All Ordinaries are 0.40% higher.
European equities are likely to look at China as a localised problem today and will likely push higher at today’s open. Similarly, I see nothing to stop the music playing in New York; that will have to wait for Friday’s payroll data.
Despite the endless optimism of the dip buyers, the dead cat bounce may be with us for some time to come in China. With a seemingly new intervention by the China government in a new sector each day, it is clear that regulatory risk is not going away anytime soon. If China’s economy is indeed slowing as well, the picture becomes darker once again, as it does for its more correlated regional neighbours. One bright spot is that a slowing economy in China will prompt stimulus measures from the central government, potentially limiting the fallout on equities.
Oil and Gold Show Slight Gains
Oil prices edge higher on Ida
With the amount of actual damage to the US Gulf of Mexico production and refining infrastructure still unclear, oil prices edged higher overnight on supply concerns. Brent crude rose 1.10% to USD 73.35, with WTI climbing 0.70% to USD 69.10 a barrel.
Prices have eased in Asia after soft China PMI data and news that the critical US Colonial oil pipeline will partially reopen post-Ida. Brent crude has slipped 0.40% to USD 73.05, and WTI has retreated by 0.35% to USD 68.65 a barrel.
Attention will now turn to the OPEC+ meeting tomorrow, which will almost certainly keep its output policy unchanged and add another 400,000 barrels per day to production. Brent crude between USD 70.00 and USD 75.00 a barrel seems to be the grouping’s sweet spot, and with the futures curve in backwardation, demand remains robust despite the short-term noise. Last week’s V-shaped recovery in prices will also give OPEC+ confidence that markets can absorb the extra supply.
While we await more visibility from OPEC+ and IDA, I expect Brent crude to remain in a USD 72.00 to 74.00 a barrel range. Similarly, USD 68.00 to 70.00 a barrel should contain WTI.
Gold consolidates on technical support
With currency and bond markets having a quiet overnight session, gold saw some profit-taking on long positions. Gold edged 0.40% lower to USD 1810.50 an ounce in a nondescript session. Today, a weaker US dollar in Asia has seen the yellow metal add 0.25% as it climbs to USD 1815.00 an ounce.
Gold’s rally seems to have run out of momentum for now, but that said, it is not showing any meaningful signs of fatigue here either. Gold has nearby support in the shape of the 100 and 200-day moving averages (DMAs) at USD 1809.70 and USD 1813.20 an ounce. As long as gold holds above this zone on a closing basis, it will continue consolidating gains.
Only a fall through USD 1780.00 an ounce will call the rally’s longevity into question while it faces formidable resistance between USD 1830.00 to USD 1835.00 an ounce. Like currency markets, gold looks to be waiting for Friday’s US employment data to determine its next directional move.
Currency Markets Move Sideways
US dollar in calm waters
Currency markets contented themselves with consolidating recent moves, with no data of note released overnight to shift expectations materially. The dollar index was unchanged overnight at 92.69 but has edged 0.15% lower to 92.55 in Asia. Today, the primary movers have been the Australian and New Zealand dollars, which have dragged the euro and sterling higher, depressing the dollar index.
NZD/USD has risen 0.53% to 0.7035 today after Covid-19 cases fell for the third day in a row, raising hopes that the kiwis have nipped the delta variant in the bud quickly, prompting reopening hops. NZD/USD looks to have triggered stops as it rose through 0.7010. That has lifted the AUD/USD 0.20% higher to 0.7310. NZD/USD has now unwound nearly all of its delta sell-off, which bottomed at 0.6800 last week. Should New Zealand have dodged another virus bullet, a rise by NZD/USD through 0.7100 could prompt further rallies to 0.7300, possibly quite quickly, as it will put the postponed RBNZ hikes back on the table.
USD/CNY has shown no reaction to the soft PMI data, being unchanged at 6.4660 today. Looking ahead, with another RRR cut on the horizon now and likely more stimulus domestically and to boost exports, a slightly weaker yuan would be another piece of the puzzle. The Fed may do that job by starting to taper in Q4, and don’t think a taper-tantrum is off the menu. USD/CNY is unlikely to spend much time below 6.4000 for the foreseeable, with the risks now skewed to the upside.
Today, Asia FX is firmer against the US dollar, with the Indonesian rupiah up 0.40%, the Thai baht up 0.50%, and the Korean won 0.30% higher. I can see no particular reason for the rally other than the momentum of last week continuing in the absence of any new information to continue the narrative. Tomorrow’s regional PMI data could test that resolve.
Overall, I expect US dollar weakness to continue this week, albeit at a slower pace, until the US employment data on Friday.
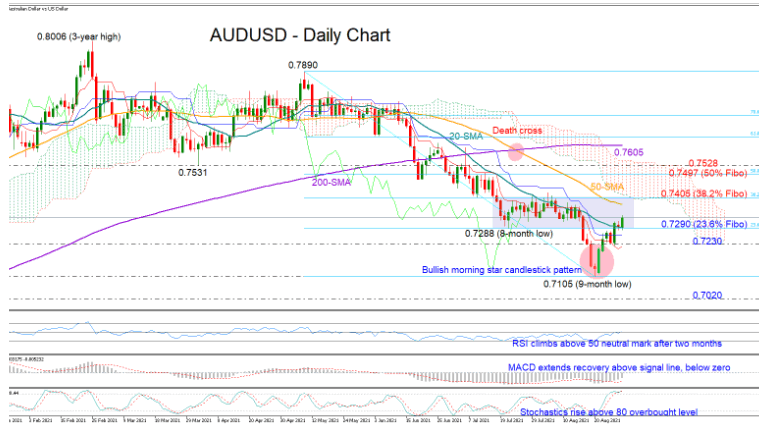
AUDUSD Aims To Hold Above 20-SMA, Short-Term Bias Bullish
AUDUSD looks determined to stay above its 20-day simple moving average (SMA) and the 23.6% Fibonacci level of the 0.7890 – 0.7105 downleg at 0.7290 after barely closing above that line in the past two sessions, with the price gearing up to a two-week high of 0.7340 early on Tuesday.
While the Stochastics are already hovering within the overbought territory, they have yet to show any weakness, keeping the bias skewed to the upside. Also, the RSI managed to extend its uptrend slightly above its 50 neutral mark for the first time since June, while the continuous strength in the MACD is another encouraging sign that positive momentum could last in the short term.
Should the bullish scenario play through, the pair will attempt to overcome the 50-day SMA and the 38.2% Fibonacci of 0.7405 with scope to boost the rally towards the 50% Fibonacci of 0.7497, and more importantly, above the surface of the Ichimoku cloud seen around 0.7528. Such a move would somewhat invalidate the downward pattern, and if the bulls pierce above the cloud too, the focus will turn to the flattening 200-day SMA at 0.7605. Yet, given the negative slope in the 20- and 50-day SMAs, the odds for a trend reversal are still muted.
On the flip side, if the price pulls below the 0.7290 support region, the decline could initially pause around the red Tenkan-sen line and the 0.7230 handle. Beneath that, selling pressures could ramp up towards the 9-month low of 0.7109, where any step lower would worsen the bearish outlook in the broad picture.
Summarizing, AUDUSD is expected to trade bullish in the near term, likely heading for the 0.7405 resistance territory.
GBP/CAD Two Scenarios Likely
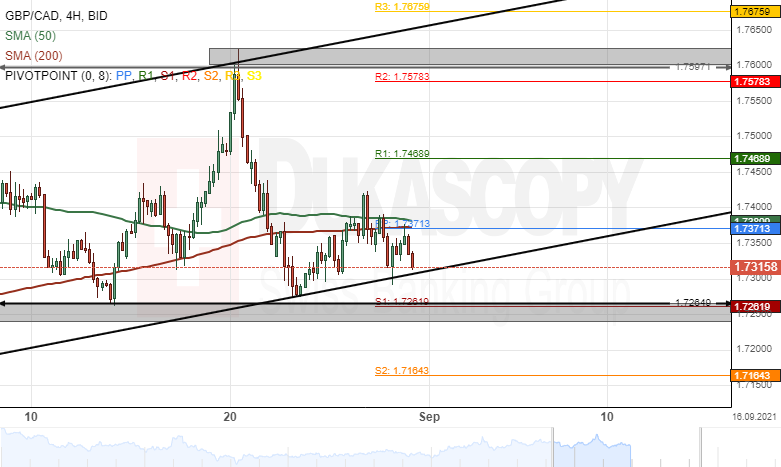
The Pound Sterling has edged lower by 1.78% against the Canadian Dollar since August 20. The currency pair breached the 50– and 200– period simple moving averages last week.
Currently, the exchange rate is trading near the lower boundary of an ascending channel pattern.
If the channel pattern holds, the currency exchange rate could make a pullback towards the 1.7500 level during the following trading sessions.
However, if the GBP/CAD pair breaks the ascending channel pattern, bearish traders could target the weekly S2 at 1.1764 this week.
GBP/AUD Tests 200- Period SMA
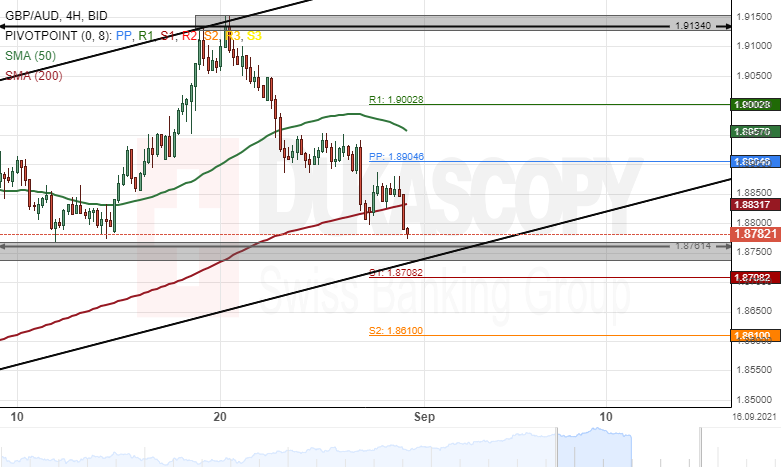
The British Pound has declined by 1.66% against the Australian Dollar since August 20. The slide was stopped by the 200– period simple moving average near the 1.8800 level during yesterday's trading session.
If the support level formed by the 200– period SMA holds, bullish traders could pressure the GBP/AUD exchange rate towards the 1.9100 area during the following trading session.
However, if the currency exchange rate breaks the support line, a decline towards the weekly support level at 1.8708 could be expected this week.
AUD/USD Elliott Wave Analysis – Finds Bottom
- USD trades lower since last Friday.
- AUD/USD eyes higher as USD slides downside.
- Immediate resistance seems around 0.7379 level.
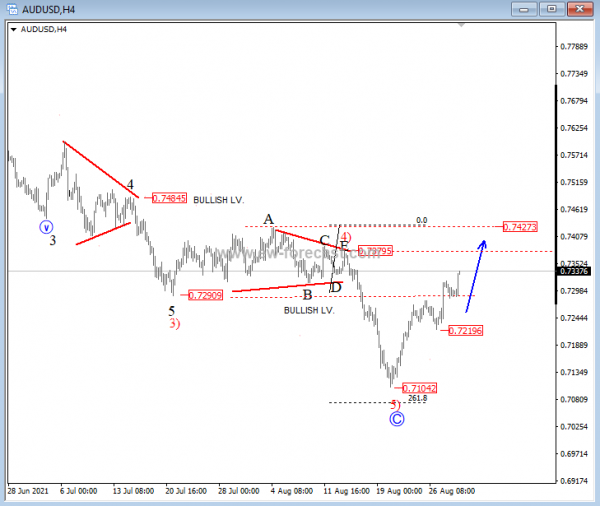
The USD keeps moving lower since Friday when speculators turned bearish on the buck as there is still some unclear situation regarding tapering. Technically, most of the markets moving as planed as risk-on resumes, but it seems that USD can see even more downside, especially after pullbacks. AUDUSD can be one very interesting pair if we consider that copper is also going turning bullish.
From an Elliott Wave analysis, AUDUSD is even higher, and it appears that we have a bottom formation after some nice impulsive intraday rally back to the previous wave 3) lows. It's a minimum ongoing three wave recovery that will be expected to resume, possibly towards the termination level of a fourth wave to 0.7379. IN the meantime, any pullbacks can stop at 0.7219 support.
AUD/USD 4h Elliott Wave analysis chart
Will The Powell Rally Rollover Into September?
Asian markets were mostly lower Tuesday morning as dismal Chinese economic data and growing concerns over surging Covid-19 cases in key regional markets sapped risk appetite. China’s factory activity expanded at a slower pace in August, raising concerns over the country’s economic growth. King dollar extended losses as US Treasury yields remained subdued while gold flirted near key resistance levels. In Europe, stocks have opened in the green as investors evaluate the latest inflation print from the continent released this morning before the September ECB meeting.
August has certainly been another positive month for global equity markets with the dovish comments from Federal Reserve Jerome Powell last Friday adding icing to the cake. Equity bulls are loving Powell’s messaging, especially after he stressed that Fed tapering and rate hikes are mutually exclusive events. With the S&P 500 on track for its seventh straight monthly advance and hitting its 12th all-time high this month, the path of least resistance certainly points north.
As we head into the new trading month of September, the key question is how much further can stock markets rally before bears enter the scene? Risks in the form of the Delta menace, concerns around China’s slowing economic growth and regulatory crackdown among other themes could impact upside gains. In the meantime, the overall market mood remains mixed with all eyes on the US jobs report on Friday.
Dollar humbled by Powell
The dollar is struggling to nurse the wounds inflicted by Jerome Powell’s dovish speech last Friday. It has weakened against every single G10 currency this morning with the Dollar Index dipping below 92.50.
Investors who were expecting the Fed Chair to make an official taper announcement or even provide fresh insight into the central bank's plan on tapering were left empty-handed. Powell offered no concrete taper signals and made it clear that the Fed was in no rush to raise interest rates, despite the recent spike in inflation. According to Powell, the “substantial further progress” test has been met for inflation while there has also been “clear progress towards maximum employment”. Given how he highlighted how there was “much ground to cover to reach maximum employment”, this makes Friday’s jobs report all the more important. Before this major risk event, investors will be offered appetisers in the form of the US August consumer confidence report and weekly jobless claims.
Currency spotlight – NZD/USD
The New Zealand dollar entered Tuesday’s session with a spring in its step, appreciating against every single G10 currency. Buying sentiment towards the currency remains supported by optimism over the lockdowns successfully reducing new Covid-19 infections. This optimism seems to have overshadowed the fact the New Zealand business sentiment fell in August, even before the lockdowns were enforced across the country. Looking at the technical picture, the NZDUSD has the potential to push higher if prices can conquer the 0.7080 – 0.7110 zone, where the 100 and 200-day Simple Moving Averages reside.
Commodity spotlight – Gold
After experiencing a sharp appreciation last Friday, gold continues to hover around key resistance levels. The precious metal may remain on standby ahead of the heavily anticipated US jobs report on Friday. In the meantime, gold is likely to be influenced by the dollar, treasury yields and risk sentiment. Should bulls fail to secure a daily close above $1818, prices may drift lower back towards $1800 in the near term.
GOLD Looks For Support
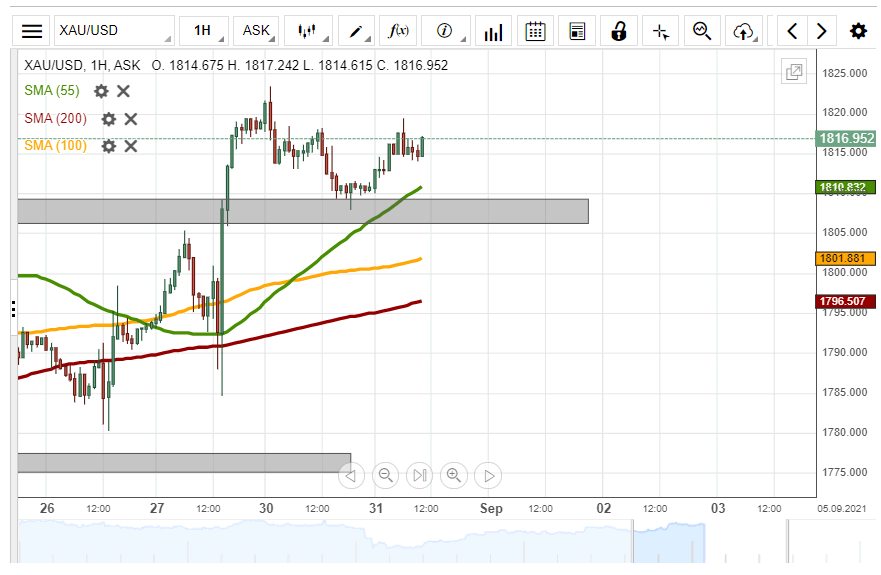
The yellow metal's price, on Monday, retraced down and found support in the late-August high level zone near 1,805.00/1,810.00. On Tuesday morning, additional support was approaching the bullion. Namely, the 55-hour simple moving average reached above the 1,810.00 level.
If the 55-hour SMA manages to push the price up, the metal would have to pass the 1,820.00 level first. Afterwards, the high level zone near 1,830.00/1,835.00 could provide resistance.
However, a decline below the SMA would look for support in the previous high levels close below the 1,810.00 mark before reaching the 100 and 200-hour simple moving averages near 1,800.00/1,795.00.
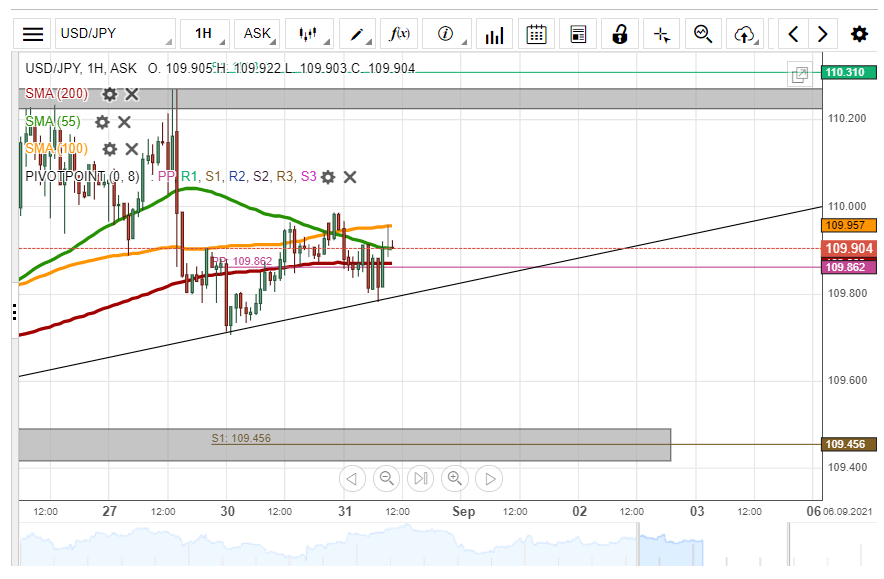
USD/JPY Remains Below 110.00
The USD/JPY ignored the resistance of the 55, 100 and 200-hour simple moving averages in the 109.85/109.95 zone. Moreover, the weekly simple pivot point at 109.85 provide the rate with resistance for only three hours before being passed. However, since the middle of Monday's trading hours, the pair has been respecting the 110.00 mark.
If the pair manages to pass the resistance of the 110.00 level, the currency pair could aim at the August high level zone above the 110.20 mark. Above this zone, the weekly R1 at 110.31 is providing technical resistance.
On the other hand, a decline of the USD/JPY might look for support in the trend line, which connects the rate's recent low levels. Below this line, the rate could look for support in round exchange rate levels before reaching the support zone at 109.42/109.50.