Sample Category Title
Euro Shrugs Off Jump in CPI
The euro is drifting in the Tuesday session. EUR/USD is currently trading at 1.1802, up 0.06% on the day.
Eurozone CPI hits 3.0%
Inflation has been a buzzword for central banks in recent months, most notably in the United States. The surge in inflation continues to concern the markets, despite the insistence of the Fed that inflation is transitory and will ease. The ECB finds itself in the unusual position of having to deal with a surge in inflation and trying to reassure the markets that the jump is temporary. Yet this message is unlikely to satisfy the markets, which will be looking for some insight from the Bank with regard to a potential taper.
The ECB recently adopted a revised forward guidance, which states that the ECB will not raise rates unless there is evidence that inflation will persist “durably” at the two percent target. Inflation has been well below the two percent threshold for years but is expected to overshoot this target this year. Will this translate into the ECB tapering its emergency pandemic bond programme in the near future?
Policymakers are expected to discuss at the September meeting the timing of a taper of a pandemic emergency bond programme. Still, the ECB is lagging behind the Fed when it comes to tapering and is unlikely to announce any timelines for tapering before December at the earliest. The Fed is yet to provide a timeline on tapering, and the ECB is unlikely to be any more transparent about its tapering plans.
EUR/USD Technical
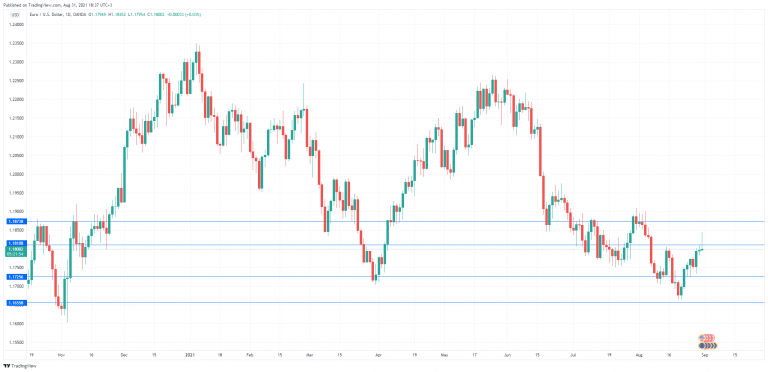
- EUR/USD is testing resistance at 1.1810. Above, there is resistance at 1.1873
- On the downside, there is support at 1.1725 and 1.1655
New Zealand Dollar Pushes above 70
The New Zealand dollar is up sharply on Tuesday. NZD/USD is currently trading at 0.7037, up 0.59% on the day.
ANZ Business Confidence slides
New Zealand released ANZ Business Confidence on Monday and the slide continued for the index, which has now mustered only one gain in six months. The August reading came in at -14.2, down sharply from -3.8 in July. Business sentiment took a nosedive in August as the government imposed a countrywide lockdown in response to an upsurge in Covid cases.
Despite the gloomy business confidence release, the kiwi went on a surge, as investors appeared more interested in the fact that Covid cases are on the decrease. The government has announced that lockdown restrictions will be reduced outside of Auckland, and if Covid numbers continue to fall, the New Zealand dollar has upside potential, with hopes rising that the economy will be able to reopen and that the RBNZ can move forward with a rate hike.
The next key date for investors to circle on their calendars is September 22, when the Fed holds its next policy meeting. Fed officials have been hinting that a timeline for tapering could be announced at that time. However, the timing of a rate hike is less clear. Powell’s Jackson Hole speech reminded the market that there was no link between tapering and a rate hike. Still, it seems a safe bet that the announcement of a taper would trigger widespread speculation about a rate hike and would be a bullish event for the US dollar.
NZD/USD Technical
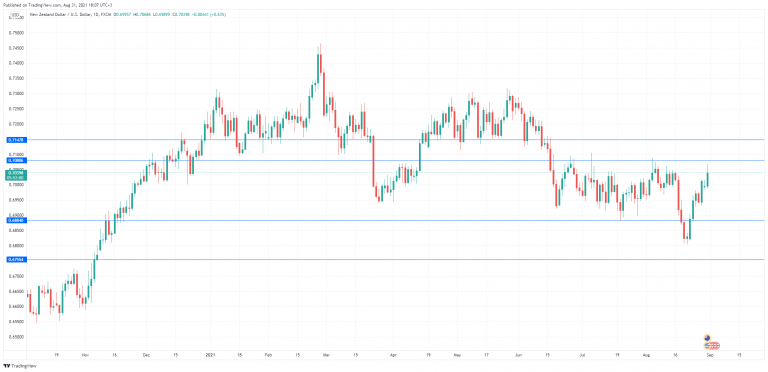
- There is resistance at 0.7080 and 0.7147
- On the downside, there is support at 0.6884. Below, there is support at 0.6755
ECB Knot: Decision next week would imply a reduction in PEPP purchase pace
ECB Governing Council member Klass Knot said he'd expects a decision in next week's meeting that "should not be incompatible" with ending the PEPP in March. And, "that would imply a reduction in the purchase pace."
Knot explained that "PEPP has a clearly delineated objective -- repairing the damage that the coronavirus has inflicted on the inflation outlook." And, "the stars are much better aligned than they have been for a long time for the return of inflation back to 2%."
Though, he added, "I can understand that next week we may want to maintain some optionality, also to see how the delta variant will play out."
US ISM and ADP Data Eyed ahead of Jobs Report; Can They Lift the Dollar?
The August jobs report is undoubtedly this week’s focal point for the US dollar but ahead of that, the ISM manufacturing PMI and ADP employment print could warm things up for jobs Friday. The ADP employment report is due at 12:15 GMT on Wednesday and the ISM manufacturing PMI will follow at 14:00 GMT. After Fed Chair Jerome Powell’s cautious nod to tapering at the Jackson Hole symposium, the freshly bruised US dollar might be able to pare some losses should the data bolster expectations of a September taper move.
Is Delta surge scuppering the recovery?
The US economy may have recouped all the lost output from the pandemic but many of the scars have yet to heal and the recovery in the labour market is far from complete. This is one explanation as to why the Fed has yet to pull back some of its emergency stimulus as it wants to get as close to full employment as possible before doing so. But a growing number of Fed policymakers lately think the economic recovery is more than sufficient to begin the tapering process and Powell also appears to be converging towards this view.
The problem is the economy may have suffered a setback in August when the rampant Delta variant started to cause significant disruption to both consumer and business lives. For now, policymakers are merely keeping an eye on how the Delta outbreak is unfolding and are not hugely worried. But should more of the incoming data paint a deteriorating economic picture, the Fed might have second thoughts about an Autumn taper move.
ISM gauge will be key indicator for August activity
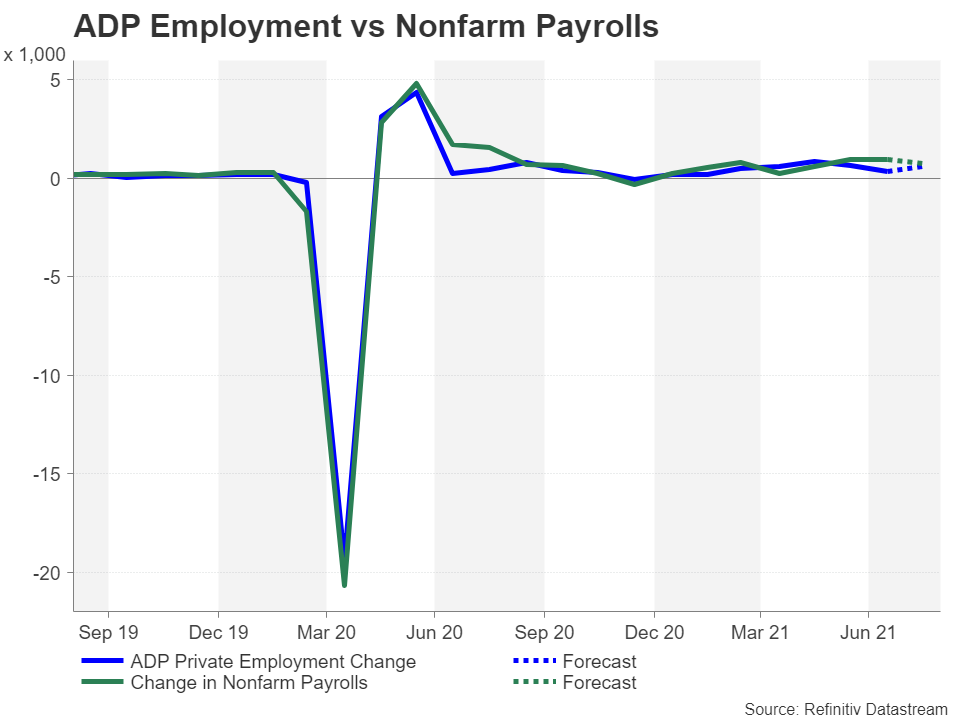
September’s FOMC meeting alone will be heavily swayed by Friday’s nonfarm payrolls numbers. However, the data leading up to the NFP report may set the mood, exacerbating the market reaction. The ADP employment report, which measures private sector payrolls, is often considered a precursor to the official jobs print. It is expected to show payrolls rising by 613k in August, up from 330k in the prior month.
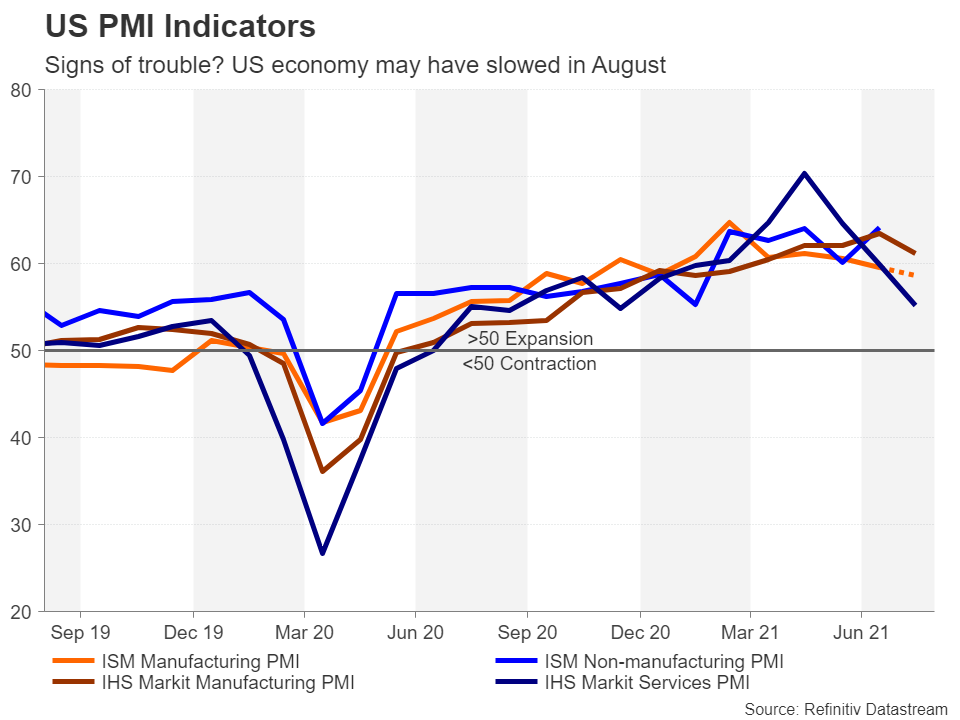
The ISM manufacturing PMI will be the one to watch, however, as some other surveys such as the flash PMIs by IHS Markit pointed to a worsening trend. The index is forecast to decline from 59.5 to 58.6 in August, which would not be particularly worrisome as it’s still well above the 50 level that separates expansion from contraction. An even bigger drop, though, might raise some alarm bells. Investors will also be monitoring the PMI’s sub-components such as the prices paid and employment indices for any clues about whether input costs are easing and if hiring slowed due to the Delta strain.
Dollar index is testing its 50-day MA
Weaker-than-expected figures overall could accelerate the latest selloff in the greenback. The dollar’s index against a basket of currencies slid below its 50-day moving average on Tuesday and further losses would turn attention to the 38.2% Fibonacci retracement of the May-August uptrend at 92.13. Below that level, the 91.80 support will be a crucial point of defence for the bulls.
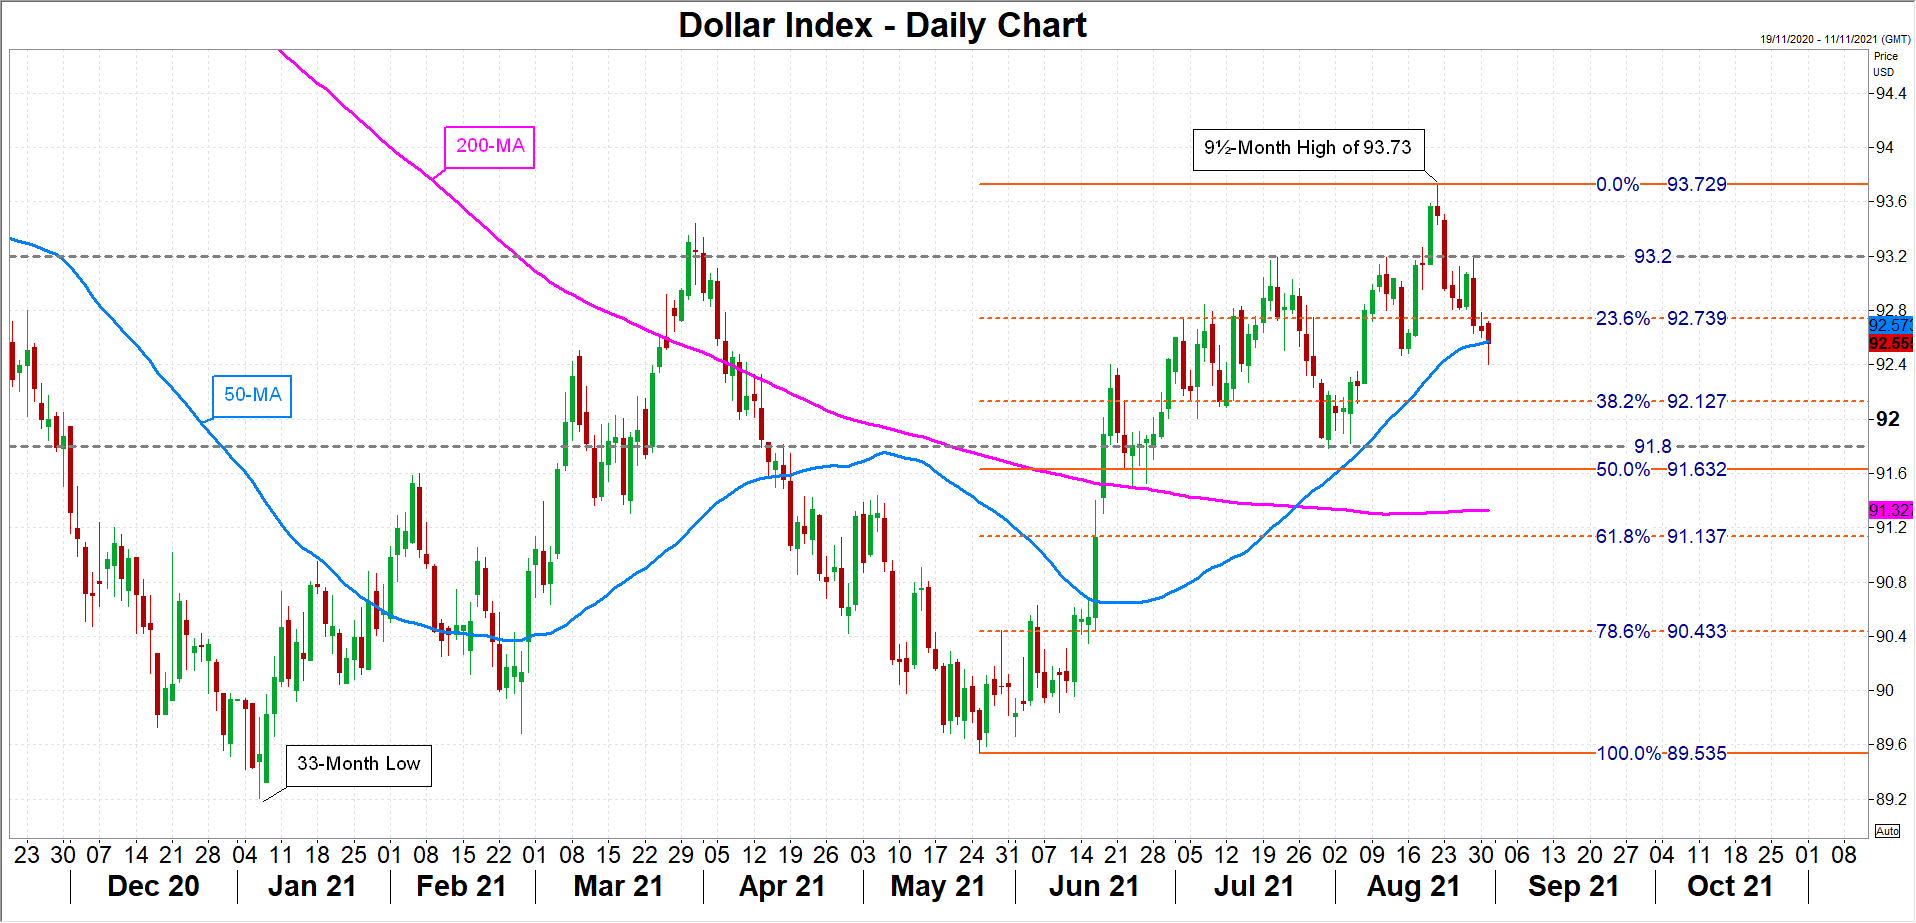
However, if Wednesday’s data restores some confidence in the growth momentum, the dollar index might claw back above the 23.6% Fibonacci retracement of 92.74 and head for the 93.20 resistance, reinforcing the bullish structure.
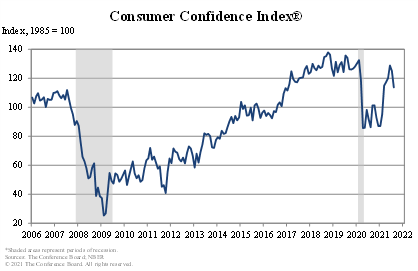
US consumer confidence dropped to 113.8 in Aug, lowest since Feb
US Conference Board Consumer Confidence dropped from 125.1 to 113.8 in August, missed expectation of 123.3. Present Situation Index dropped from 157.2 to 147.3. Expectations Index dropped from 103.8 to 91.4.
"Consumer confidence retreated in August to its lowest level since February 2021 (95.2)," said Lynn Franco, Senior Director of Economic Indicators at The Conference Board.
"Concerns about the Delta variant—and, to a lesser degree, rising gas and food prices—resulted in a less favorable view of current economic conditions and short-term growth prospects. Spending intentions for homes, autos, and major appliances all cooled somewhat; however, the percentage of consumers intending to take a vacation in the next six months continued to climb. While the resurgence of COVID-19 and inflation concerns have dampened confidence, it is too soon to conclude this decline will result in consumers significantly curtailing their spending in the months ahead."
CAD Steady But GDP Disappoints
The Canadian dollar has consolidated recent gains and is trading quietly on Tuesday. Currently, USD/CAD is trading at 1.2598, down 0.08% on the day. The dollar index is down 0.18% on Tuesday, dipping to 0.9248 in North America.
Canada’s economy contracts in Q2
The Canadian currency missed a golden opportunity to make some inroads against a weak US dollar, as Canada released GDP for Q2. The economy contracted 1.1% (QoQ), missing expectations and surprising the markets. Retail Sales slipped 0.7% in the second quarter and in volume terms, down 0.9%. As well, home resales and exports declined. This marked the first quarterly decline since Q2 of 2020, during the first wave of Covid-19.
The weak GDP will likely shelve any plans that the Bank of Canada had for a second round of tapering, as the weak economy simply doesn’t justify any tightening in policy. With total economic activity 1.5% lower than the pre-pandemic level (February 2020), we can expect the BoC to be in a dovish mood, and any rise in interest rates seems a long way off.
The BoC cannot determine policy simply based on the strength of the Canadian economy; policy makers must also keep a close eye on monetary policy south of the border. If the Fed embarks on a series of tapers and the BoC lags behind, the Canadian dollar could take a tumble.
The markets are looking ahead to the US non-farm payrolls release on Friday. Investors will likely be pleased with a reading of 800 thousand, and a 1.0 million-plus read could result in a taper tantrum. Conversely, a release of 500 thousand or lower would serve to pour cold water on taper hopes and would be bearish for the US dollar.
USD/CAD Technical
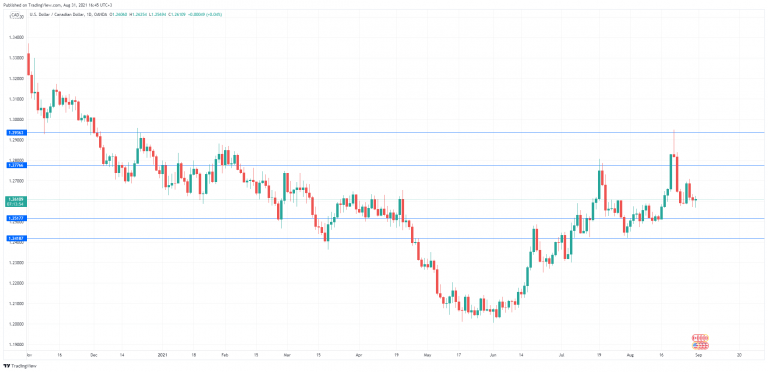
- There are resistance lines at 1.2776 and 1.2936
- The next support levels are at 1.2517 and 1.2418
Sunset Market Commentary
Markets
Spotlights on Europe today. August CPI inflation beat consensus, rising by 0.4% M/M and 3% Y/Y (from 2.2% vs 2.7% consensus). This matches the peak levels from end 2011 with EMU inflation only exceeding this level in 2008. Underlying core EMU inflation surged from 0.7% Y/Y to 1.6% Y/Y, the strongest reading since 2012. Volatile components are responsible for the lion share of the inflation increase, but service price inflation and non-energy industrial goods are on the rise as well as economies reopens, but still face prolonged supply bottle necks. Europe is facing a similar problem as the US, where the definition of peak inflation and temporary higher inflation have been rewritten for months. European inflation will increase further until the end of the year, but will drop back early next year as base effects and Germany’s tax reduction unwind. The new equilibrium level could be higher than earlier anticipated though. Short term inflationary pressures will be visible in next week’s fresh ECB inflation forecasts (higher), but Lagarde (as Fed chair Powell) will still stress the need to look though temporary higher prices. Apart from the inflation argument, it today became clear that minds in Frankfurt are gradually shifting towards becoming slightly less accommodative. Heavyweight ECB Villeroy this morning pointed to easier financial conditions over Summer. Back in March & June, the ECB justified and increased weekly amount of PEPP purchase by referring to an unwarranted tightening in those same financial conditions. All else equal, this suggests that the debate on slowing weekly purchases will be part of the agenda. Especially with the March 2022 PEPP shelf date rapidly approaching. Framing the transition period after March 2022 – with APP partly taking over PEPP – will probably something for the October or December meeting. ECB Holzman backed Villeroy’s covered hint by explicitly mentioning that the ECB is in the position to think about reducing pandemic aid. He has inflation risks on his mind and backs a Q4 slowdown of net PEPP-purchases.
We argued before that following a one-sided, USD-focused Summer, there was/is room for European market moves given very low expectations. Today served as a point in case. EUR/USD took out 1.1805 intermediate resistance to test the incoming downtrend line (connecting June post Fed, July and now August tops) in the high 1.1840 zone. EUR/GBP tried to take out the 0.86 big figure for the first time since mid-July. German Bunds underperform US Treasuries. German yields add 1.7 bps (2-yr) to 4.5 bps (10-yr) across the curve. The Italian 10-yr yield spread adds 3 bps. US yields trade 0.4 bps to 1 bp higher in a daily perspective. European stock markets cede on average 0.5%.
News Headlines
Polish August preliminary inflation unexpectedly jumped 0.2% M/M to be up 5.4% Y/Y (from 5% vs 5.1% consensus). Yearly price growth is now at the highest level in more than 20-years. Price of Electricity & gas rose 0.8% M/M and 6.1% Y/Y. Fuels for personal transport jumped 1.8% M/M to be up 28% Y/Y. The majority of MPC members indicated they don’t aim to raise the policy rate anytime soon. A motion to raise the policy rate by 0.15% was rejected at the June and July policy meetings. NBP assessed that the rise in inflation was caused by the reopening of the economy and due to factors that were beyond control of monetary policy. Even so, the zloty jumped from EUR/PLN 4.56 to trade near 4.5375 as markets see a growing chance that the NBP will have to change tactics.
Czech growth accelerate to 1% Q/Q in Q2 (from 0.6% Q/Q), slightly below the CNB forecast. Growth was mainly supported by domestic demand. Household consumption rose 6.5% Q/Q after the spring easing of restrictions and by the release of forced savings. Growth in gross capital formation (4.3% Q/Q) mainly reflects a strong contribution of change in inventories, but the CNB also sees a recovery in investment. The Q2 export performance (0.6% Q/Q) was dampened by shortages of parts in industrial production and forced stockpiling of unfinished products. Import growth thus outpaced export growth. The CZK temporary gained early this morning testing sub EUR/CZK 25.50.
Canadian GDP growth weaker-than-expected into the summer
- GDP unexpectedly posted a 1.1% decline at an annualized rate in Q2.
- June output rose 0.7%, but early estimate for July was for a 0.4% decline - in contrast to expectations for a solid gain.
- High-contact service sectors bouncing back into the summer largely as expected, but supply chain disruptions and slowing housing markets keeping a lid on output.
The drop in Q2 GDP was surprising given earlier monthly GDP reports showing a modest increase despite the spring wave of virus spread and lockdowns. Activity bounced back 0.7% in June (matching the early estimate a month ago) but April and May data were revised to show larger declines. The larger surprise was a preliminary estimate that GDP declined 0.4% in July despite most provincial economies continuing to ease restrictions.
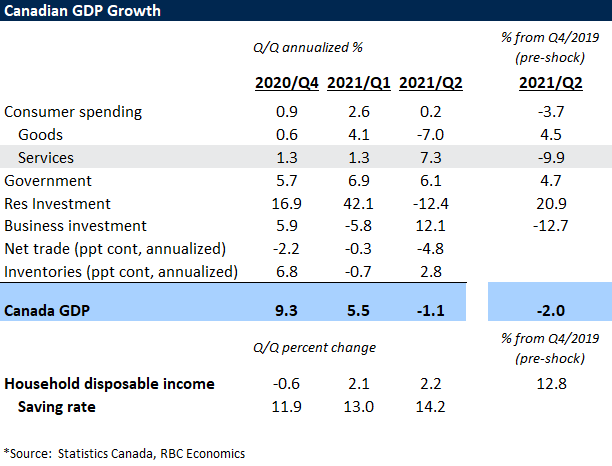
Our own tracking of card transactions shows spending in those hardest-hit high-contact service sectors like accommodation & food services continuing to accelerate through July, but supply chain disruptions are limiting goods production and a cooling in housing markets , which continue to come off the boil, means residential investment has shifted from a major driver of growth to a drag. Exports plunged 15% (annualized) in Q2 - led by a pullback in motor vehicle and parts production. Residential investment fell 12% on cooling home resale markets, but was still over 20% above pre-shock levels in Q2.
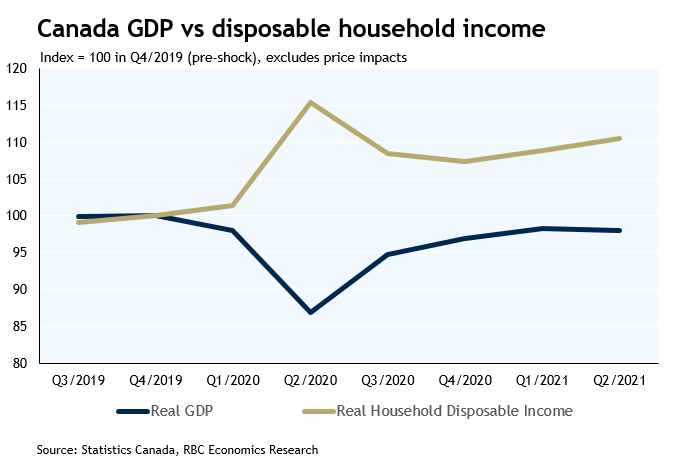
While the GDP numbers are clearly softer than expected, not all the data was bad. The preliminary estimate that July output dropped 0.4% was at odds with an earlier-reported 1.3% increase in hours worked that month. Business investment strengthened sharply in Q2, and household purchasing power continued to build. Household disposable income rose another 2.2% in Q2 (non-annualized) and the saving rate increased to 14.2%. Household spending on services was almost 10% below pre-shock levels, so there is still substantial room for stronger spending on services to help drive stronger economic growth over the second half of the year, even with goods production bumping up against capacity constraints. The recovery, particularly in spending on services, depends heavily on virus risk, but relatively high vaccination rates are expected to limit the need for a repeat of the widespread lockdowns of the last year and a half. All said, though, the data is clearly flagging less momentum than previously expected heading into the summer.
Canada’s Economic Recovery Slows in the Second Quarter
Real GDP declined 1.1% (annualized) in the second quarter, well below consensus expectations for a 2.5% expansion. This left GDP around 2% below pre-pandemic (2019-Q4) levels. In nominal terms, GDP increased by 7.9% annualized in the second quarter.
The weakness in the quarter was driven by a substantial drop in residential investment (-12.4%), and exports (-15%). The former was held down by significantly lower home resale activity as home ownership transfer costs fell 54.2% (annualized) in the quarter, while exports were hobbled by supply chain disruptions, particularly the semiconductor shortage which lowered motor vehicles and parts production.
Meanwhile, business investment rebounded on the back of greater spending in the machinery and equipment category (+24.9%). Non-residential structures (+5.1%) and intellectual property products (+3.3%) also advanced in the second quarter. In terms of household consumption, spending was fairly flat (+0.2%). A rebound in outlays for services (+7.3%) was largely offset by a drop in goods expenditure (-7%). Notably, 32 out of 48 goods categories experienced declines in the second quarter.
On the income side, household disposable income rose 9.2% in annualized terms in the second quarter, outpacing the gain in consumption. As a result, the savings rate increased to 14.2%, the fifth consecutive quarters it's been in double-digit territory.
Statistics Canada also released monthly GDP data for June, which showed a 0.7% m/m expansion. The statistical agency also stated that preliminary data for July indicates a 0.4% decline in output for the month.
Key Implications
The Canadian economy lost momentum in its road to recovery in the second quarter of 2021. The cooling housing market and ongoing supply chain disruptions, particularly in motor vehicles, weakened economic activity during the quarter. The third wave and pandemic restrictions also kept a lid on household consumption. This was the first decline in quarterly GDP since the pandemic struck in the second quarter last year.
That said, today's data were not all gloomy. The GDP performance in June was encouraging as the vaccine rollout ramped up, and provinces gradually reopened their economies. The advance estimate for July was disappointing, but this was again probably due to cooling housing market activity, and supply chain disruptions. On the consumption side, consumers are reorienting their spending from goods to services, which is weighing on retail trade output. But as spending and saving patterns normalize, we expect consumption to drive GDP growth in the third quarter.
Looking further ahead, clouds are forming for the Canadian economy. Primarily, the Delta variant is spreading quickly in Canada, resulting in an uptick in cases and hospitalizations. International experience suggests this could be the beginning of a prolonged battle with this strain of the virus. Provinces and businesses are already responding to the threat with a number of policies such as vaccine passports, mandatory vaccinations and regular testing. While this will likely help mitigate the impact of the fourth wave, business and consumer confidence could be negatively affected. The pandemic is not yet over, and as long as its here, the road to recovery will be a bumpy one.
USD/JPY Mid-Day Outlook
Daily Pivots: (S1) 109.77; (P) 109.86; (R1) 110.03; More...
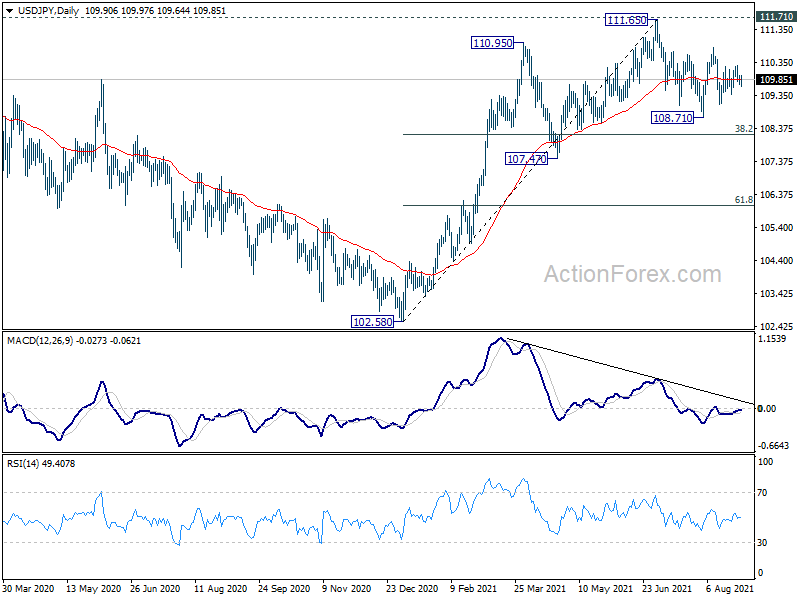
Intraday bias in USD/JPY remains neutral as range trading continues. On the downside, break of 109.10 will target 108.71 support first. Firm break there will resume the decline from 111.65 and target 38.2% retracement of 102.58 to 111.65 at 108.18 next. On the upside, break of 110.79 will resume the rebound from 108.71 to retest 111.65 high.
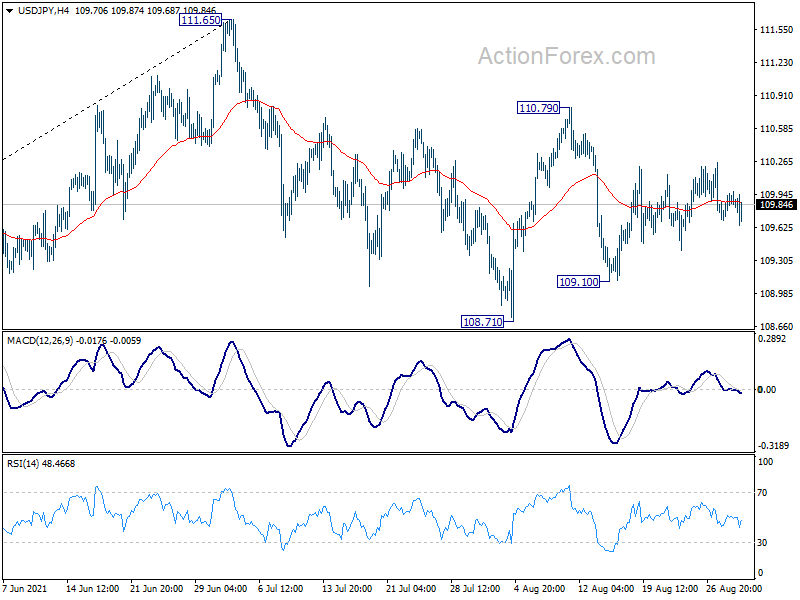
In the bigger picture, medium term outlook is staying neutral with 111.71 resistance intact. The pattern from 101.18 could still extend with another falling leg. Sustained trading below 55 day EMA will bring deeper fall to 107.47 support and below. Nevertheless, strong break of 111.71 resistance will confirm completion of the corrective decline from 118.65 (2016 high). Further rise should then be seen to 114.54 and then 118.65 resistance.