

Sample Category Title
GBP/USD Books New High
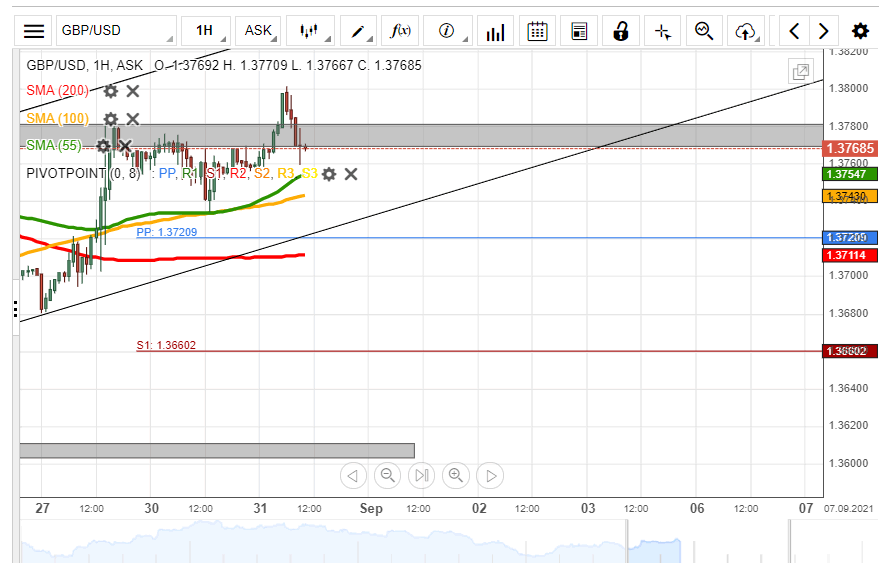
The GBP/USD has passed the August high level zone and reached the 1.3800 level. During Tuesday's early London trading hours, the rate had retraced back down and looked for support.
The pair could gain support from the 55 and 100-hour simple moving averages or the previously passed August high level zone. A resumed surge of the GBP/USD would have to pass the 1.3800 level before reaching the weekly R1 simple pivot point at 1.3826.
Meanwhile, a potential decline of the currency exchange rate could look for support in the lower trend line of a channel up pattern just below the 1.3750 level, the weekly simple pivot point at 1.3721 and the 200-hour simple moving average at 1.3710.
EUR/USD Reaches 1.1830 Level
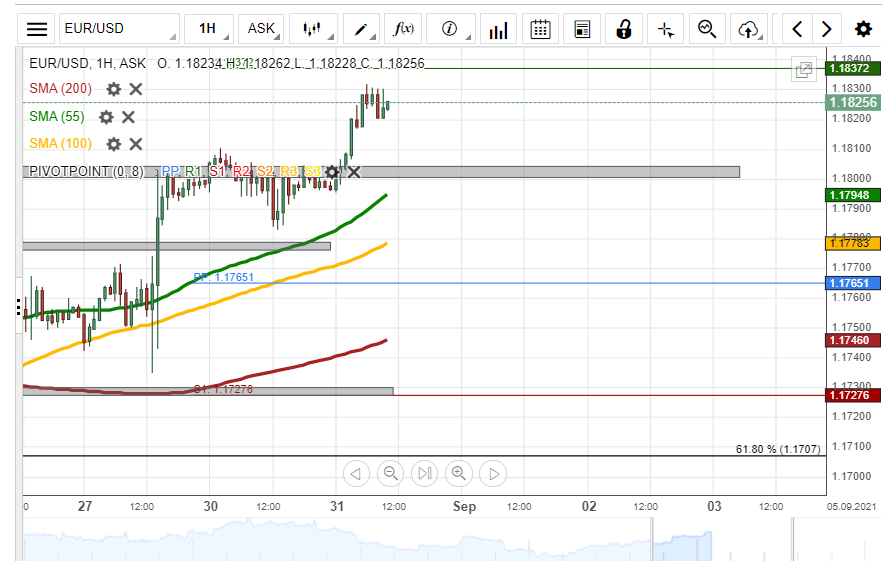
The EUR/USD has clearly passed the previous August high level near 1.1800. On Tuesday morning, the currency exchange rate reached the 1.1830 level. After reaching the 1.1830, the pair began to consolidate.
In the near term future, the pair could trade sideways until it is approached by the support of the 55 and 100-hour simple moving averages. The SMAs could provide support and push the rate into the resistance of the weekly R1 and weekly R2 simple pivot points at 1.1837 and 1.1875.
However, the rate might also consolidate its gains by retracing back down and look for support in the 1.1800 level and the previous August high levels.
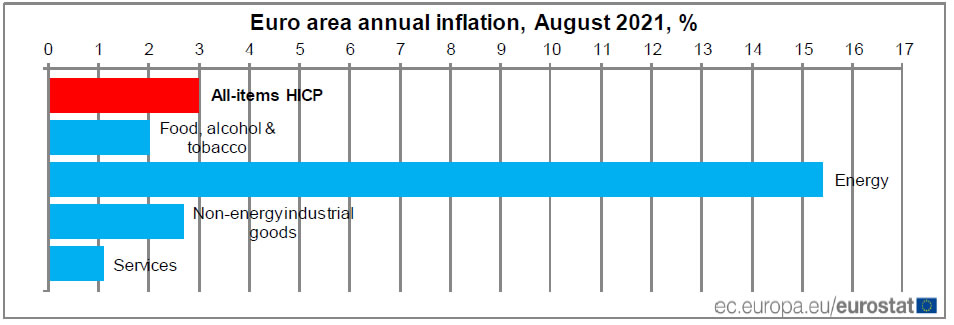
Eurozone CPI jumped to 3.0% yoy in Aug, core CPI rose to 1.6% yoy
Eurozone CPI accelerated to 3.0% in August, up sharply from 2.2% yoy, above expectation of 2.8% yoy. CPI core rose to 1.6% yoy, up from 0.7% yoy, above expectation of 0.5% yoy.
Looking at the main components of euro area inflation, energy is expected to have the highest annual rate in August (15.4%, compared with 14.3% in July), followed by non-energy industrial goods (2.7%, compared with 0.7% in July), food, alcohol & tobacco (2.0%, compared with 1.6% in July) and services (1.1%, compared with 0.9% in July).
The Analytical Overview Of The Main Currency Pairs
The EUR/USD currency pair
Technical indicators of the currency pair:
Prev Open: 1.1792
Prev Close: 1.1796
% chg. over the last day: +0.03%
In Germany, inflation jumped to a 13-year high of 3.4%. Companies are struggling with supply shortages, which is putting pressure on prices. Other European countries will also report on the level of inflation today. Economists expect consumer prices to reach 2.7% on a year-on-year basis in Europe, which is significantly higher than the 2% target of the ECB.
Trading recommendations
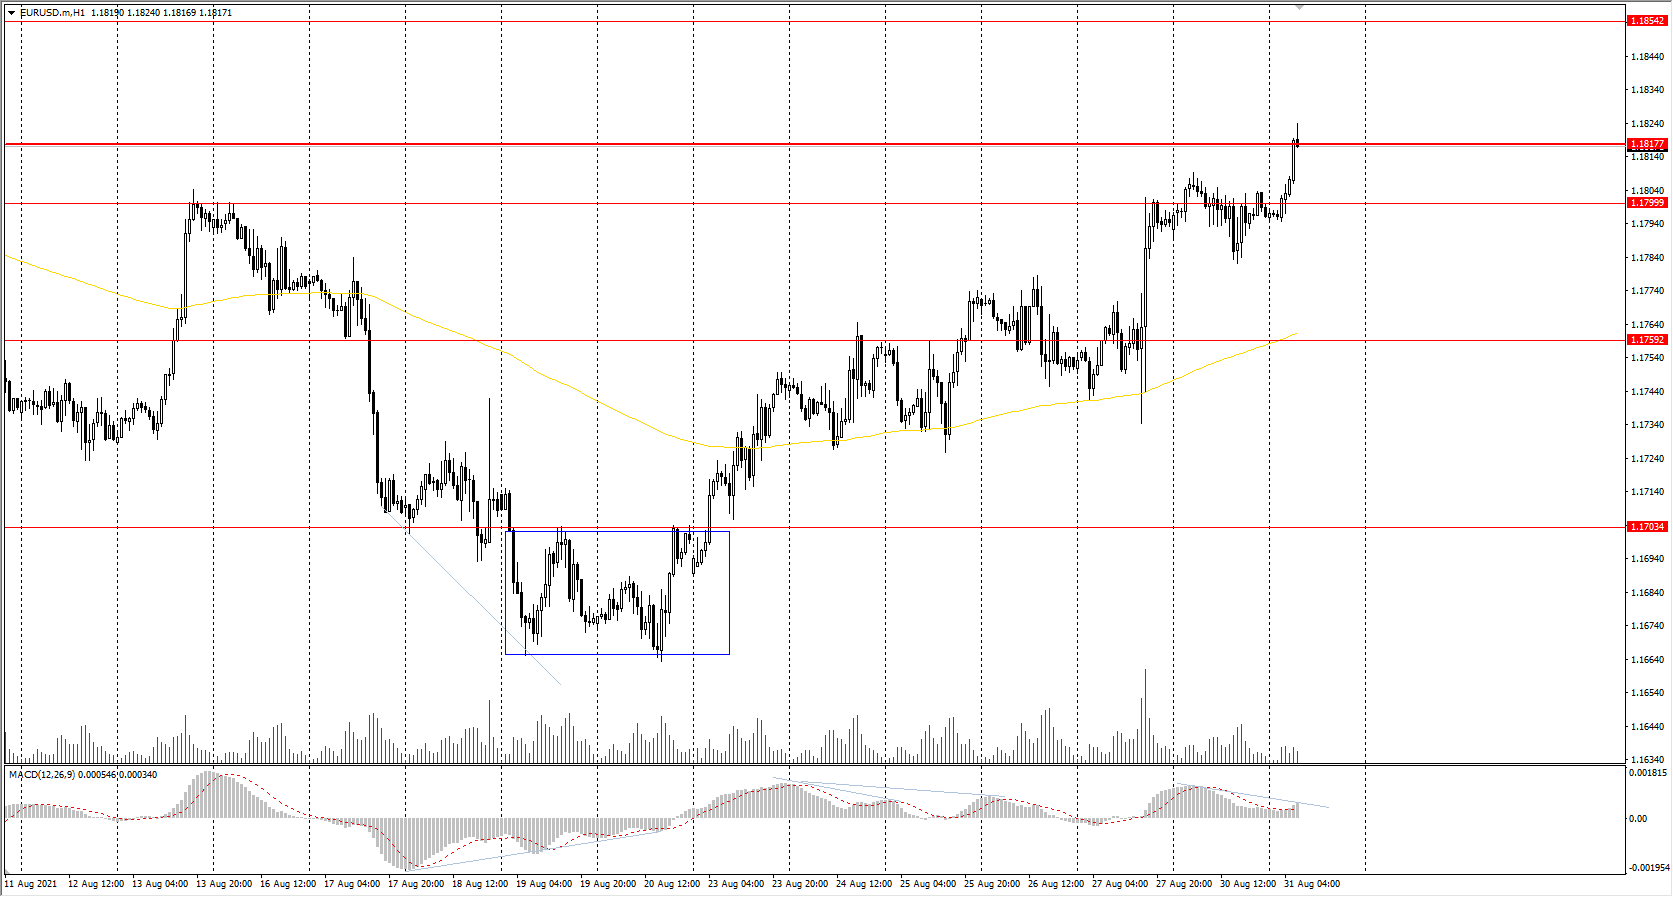
Support levels: 1.1799, 1.1759, 1.1704, 1.1620
Resistance levels: 1.1817, 1.1854, 1.1894, 1.1934, 1.1969
From a technical point of view, the general trend of the EUR/USD currency pair is bearish. But the price is trading above the moving average and has approached the priority change level. The MACD is signaling a divergence in the opposite direction. Under such market conditions, it is best to look for sell trades from the resistance levels, where sellers show initiative. Buy trades can be considered only after a pullback or after a breakthrough of the priority change level.
Alternative scenario: if the price breaks through the 1.1817 resistance level and fixes above, the mid-term uptrend will likely resume.
News feed for 2021.08.31:
- Germany Unemployment Rate (m/m) at 10:55 (GMT+3);
- Eurozone Consumer Price Index (m/m) at 12:00 (GMT+3);
- US CB Consumer Confidence (m/m) at 17:00 (GMT+3).
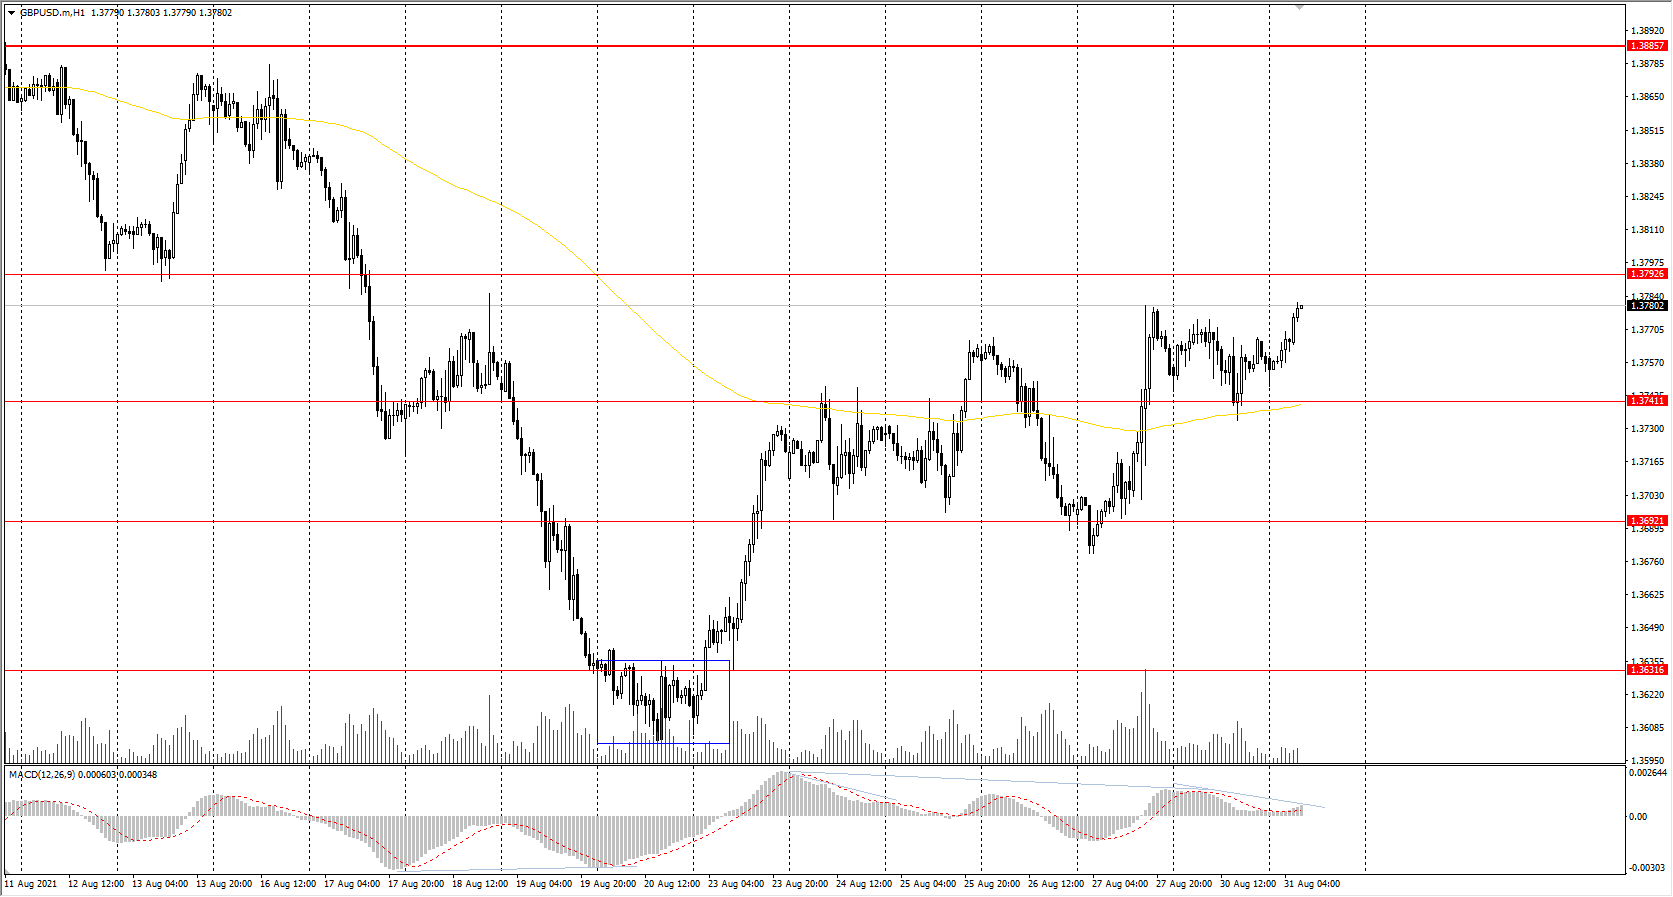
The GBP/USD currency pair
Technical indicators of the currency pair:
Prev Open: 1.3755
Prev Close: 1.3756
% chg. over the last day: +0.01%
There was a bank holiday in the UK yesterday, so the pound sterling maintained its position amid the stabilization of the dollar index. Today, at the opening of trading, the dollar index is slightly decreasing, which plays in favor of the British currency strengthening. But the divergence on the technical indicators shows that there is a possibility of a temporary decline.
Trading recommendations
Support levels: 1.3741, 1.3692, 1.3632, 1.3614, 1.3525
Resistance levels: 1.3793, 1.3772, 1.3886, 1.3935, 1.4002
On the hourly time frame, the GBP/USD trend is bearish but the price is trading above the moving average; the local trend is upward. The MACD indicator became positive, but there is a divergence on the higher timeframe, which indicates an impending downward movement. Under such market conditions, it is better to look for sell trades from the resistance level, where sellers show initiative. Buy positions can be considered only with short targets throughout the day.
Alternative scenario: if the price breaks through the 1.3885 resistance level and consolidates above, the bullish scenario will likely resume.
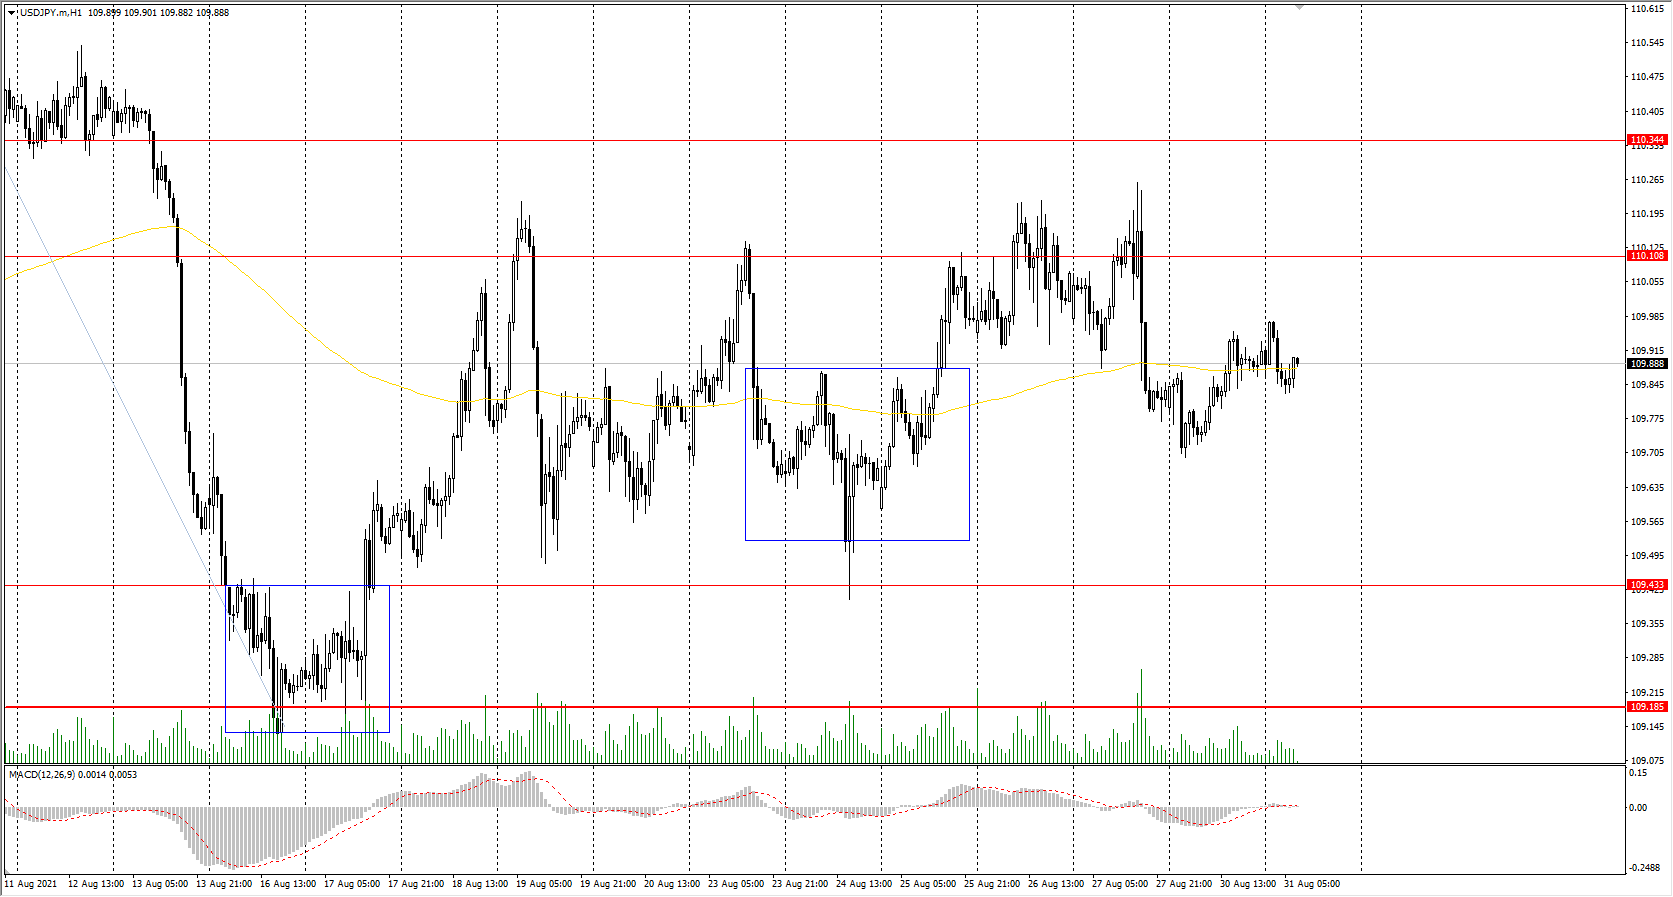
The USD/JPY currency pair
Technical indicators of the currency pair:
Prev Open: 109.80
Prev Close: 109.91
% chg. over the last day: +0.10%
Japan's unemployment rate fell to 2.8% (previous - 2.9%). But industrial production decreased in July, which is not surprising since the surge of the Delta strain made the government introduce restrictions that caused interruptions in supply chains, especially semiconductor products and components for automakers.
Trading recommendations
Support levels: 109.43, 109.19, 108.65
Resistance levels: 110.11, 110.34, 110.66, 110.95, 111.48
The main trend of the USD/JPY currency pair is bullish. The price is now trading in a wide corridor with the range of 109.43-110.11, inside which other smaller fled structures are formed. The MACD indicator has become inactive again. Under such market conditions, traders should look for buy trades from the support level, where the buyers show initiative. Sell positions should be considered only on lower timeframes from the resistance levels with short targets.
Alternative scenario: if the price falls below 109.18, the uptrend is likely to be broken.
News feed for 2021.08.31:
- Japan Unemployment Rate (m/m) at 02:30 (GMT+3);
- Japan Industrial Production (m/m) at 02:50 (GMT+3).
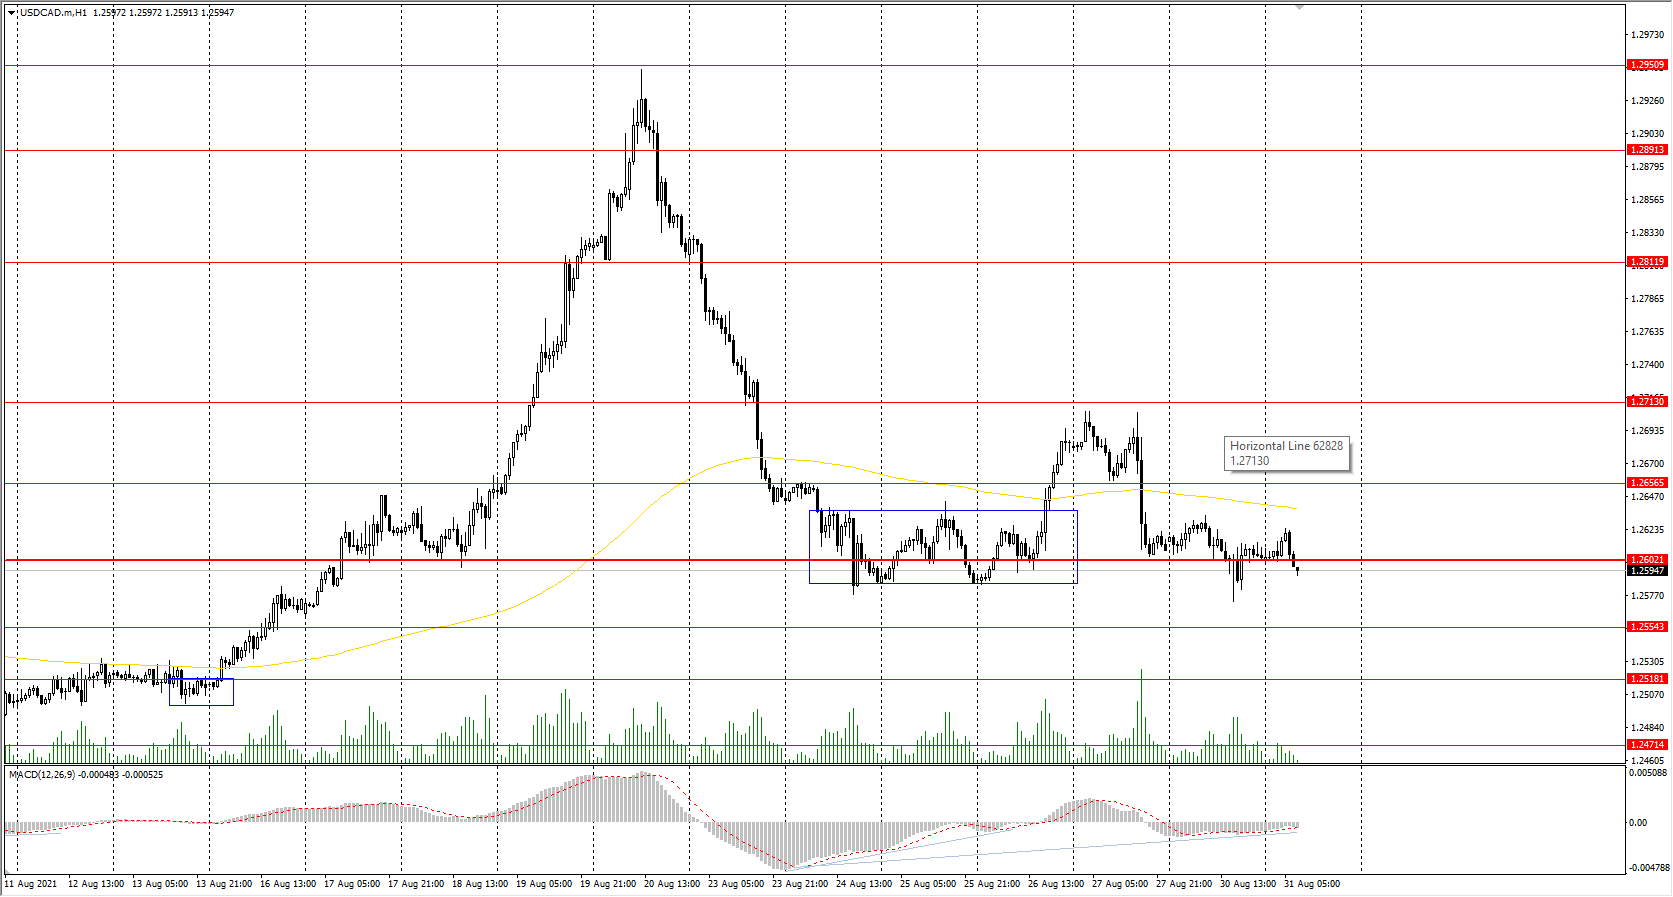
The USD/CAD currency pair
Technical indicators of the currency pair:
Prev Open: 1.2615
Prev Close: 1.2604
% chg. over the last day: -0.09%
The Canadian dollar is a commodity currency, so the USD/CAD currency pair is highly dependent on the dynamics of the dollar index and oil prices. The dollar index is slowly decreasing, while oil is increasing. As a result, the USD/CAD currency pair is declining, which increases the probability of priority change. Canada will report its GDP for the quarter today.
Trading recommendations
Support levels: 1.2602, 1.2554
Resistance levels: 1.2656, 1.2713, 1.2812, 1.2891, 1.2951
In terms of technical analysis, the USD/CAD trend is still bullish but the price returned to the priority change level. The probability of a breakthrough of the support level is increasing. It is better to look for buy positions from the priority change level but after buyers show initiative. Sell positions can be considered from the resistance levels, or after the breakthrough of the 1.2602 support level.
Alternative scenario: if the price breaks through the 1.2602 support level and fixes below, the uptrend will likely be broken.
Major US Indices Continue To Update Historic Highs
The US stock market showed multidirectional dynamics. Technology, healthcare, and consumer cyclical sectors demonstrated growth. The oil and gas and financial sectors declined. At the close of trading, the S&P 500 increased by 0.43%, while the Nasdaq added 0.9%; both indices updated the price highs. But the Dow Jones Industrial Average decreased by 0.16%, even despite the growth of Apple and Microsoft's shares, which increased yesterday by 3.04% and 1.29%, respectively. The US dollar index is under pressure right now. Excess liquidity in the financial system is driving the dollar index lower and major stock indices higher. And most likely, the situation will not change much before the next Federal Reserve meeting, held on September 22. The only thing that could significantly affect the market before that date is strong labor market data later this week, which could trigger a sharp rise in the dollar index and a decline in the major stock indices.
The earnings of more than 75% of major US companies surpassed 2019 levels in Q2. This suggests that many types of businesses have adapted to the new conditions.
The majority of European stock indices grew yesterday. The activity was lower than usual due to the bank holiday in the UK. German DAX increased by 0.2%, French CAC 40 and Italian FTSE MIB added 0.1% each. However, the Spanish index IBEX 35 lost 0.6%. Inflation in Germany jumped to a 13-year high of 3.4%. Companies are struggling with supply shortages, which are putting pressure on prices. Other countries in Europe will also report on the level of inflation today. Economists expect consumer prices in Europe to reach 2.7% annually, which is significantly higher than the 2% target of the ECB. Due to the growth of COVID-19, Europe will tighten the rules for US citizens to enter Western European countries. As a result, the capitalization of Deutsche Lufthansa and EasyJet airlines decreased by 1.5% and 0.3%, respectively, the shares of TUI tour operator fell by 1.1%.
Oil rose on Monday as US Gulf Coast refineries faced uncertainty over the timing of a restart after Hurricane IDA damaged the region. Natural gas prices in Europe continue to rise. The gas price in the European futures market exceeded $600 per thousand cubic meters for the first time in history. High prices are supported by such factors as low storage levels in Northwest Europe and the uncertainty with the launch of Nord Stream 2.
The US Treasury yields are declining. This indicator correlates inversely with gold and silver prices. As long as the Fed maintains a soft monetary policy, the price of precious metals will rise. Industrial metals are also on investors' radars right now.
Asia-Pacific stocks have decreased during Tuesday’s morning trading as data shows a slowdown in manufacturing activity in China in August. Japan's Nikkei 225 index decreased by 0.1%, South Korea's Kospi lost 0.15%, Hong Kong's Hang Seng index and China's CSI300 blue-chip index opened lower by 0.1% and 0.2%, respectively. In response to growing concerns about gaming addiction, Chinese regulators reduced the period of time players can spend playing online games. Users under 18 will only be allowed to play games between 8 p.m. and 9 p.m. local time and only on specific days. Online gaming companies will be prohibited from providing gaming services to minors in any form outside of those hours.
Main market quotes:
- S&P 500 (F) 4,528.79 +19.42 (+0.43%)
- Dow Jones 35,399.84 −55.96 (−0.16%)
- DAX 15,887.31 +35.56 (+0.22%)
- FTSE 100 7,148.01 +23.03 (+0.32%)
- USD Index 92.68 0.00 (0.00%)
Important events for today:
- Japan Unemployment Rate (m/m) at 02:30 (GMT+3);
- Japan Industrial Production (m/m) at 02:50 (GMT+3);
- China Manufacturing PMI (m/m) at 04:00 (GMT+3);
- German Unemployment Rate (m/m) at 10:55 (GMT+3);
- Eurozone Consumer Price Index (m/m) at 12:00 (GMT+3);
- Canada GDP (m/m) at 15:30 (GMT+3);
- US CB Consumer Confidence (m/m) at 17:00 (GMT+3).
Fed Shockwaves Reverberate
- Equities shine, dollar bruised as markets digest Fed signals
- Chinese PMIs disappoint, setting the stage for more stimulus
- European inflation data coming up as euro attempts rebound
Wall Street hits fresh records
The party in US stock markets continues to rage. The S&P 500 and the Nasdaq hit new milestones yesterday, with tech heavyweights being at the tip of the spear after the Fed chief reassured investors that the cheap money punchbowl won’t be taken away immediately.
With the Fed playing it slow on normalization and Congress set to unleash another multi-trillion spending spree to power up growth at a time when the US economic engine is already revving, the stars have really aligned for equity markets. Best of all, it seems like any corporate tax hikes will be watered down significantly as industry lobbies chip away at the massive reconciliation bill.
The main worry is the Delta outbreak, but as we’ve seen time and again, markets rarely bleed because of virus developments. If anything, an escalation of the outbreak could fuel hopes for an even more patient Fed and put additional pressure on the politicians to step up their spending game. Virus worries are essentially a self-correcting dynamic for stocks, especially in the tech sector.
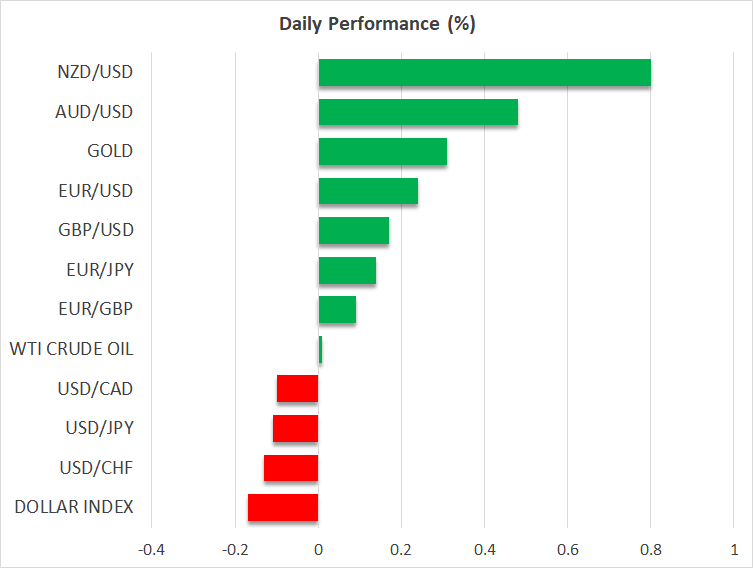
Dollar bleeds, commodity FX capitalizes
Over in the FX arena, the US dollar continues to bleed as markets price in lower chances for a September taper announcement by the Fed. The good news for dollar bulls is that this is a case of tapering being delayed, not derailed. Hence why the retreat in the greenback has been minor.
Markets are now trading on whether the Fed will signal tapering in September and start the process in November, or whether it will be pre-announced in November and implemented in December. The next edition of nonfarm payrolls this week will go a long way in settling this debate, but in the big picture, it doesn’t matter much. It’s only a matter of time.
Capitalizing the most on the dollar’s latest troubles have been the usual commodity FX suspects. The kiwi in particular has enjoyed a very sharp rebound as markets turn more confident that New Zealand will defeat the virus once again, allowing the RBNZ to initiate its planned rate hike cycle.
China slowdown, euro inflation
What’s especially striking about the recovery in commodity-linked currencies is that it is taking place despite signs that China is slowing down. The nation’s PMI surveys for August confirmed that growth is losing momentum, with the composite index crossing below the crucial threshold of 50.
This raises all kinds of questions. How long can foreign stocks and currencies of nations that rely on China’s endless commodity demand stay cheerful if the economy is losing strength? Will Chinese authorities respond with an avalanche of stimulus or will they take a more measured approach, in fear of an already over-leveraged private sector?
Making matters worse, Beijing continues its regulatory crusade. This time regulators are going after private equity firms and are also limiting the access of minors to online gaming. The issue here is the timing of these changes - structural reforms into a slowing economy rarely pay off.
As for today, we get the latest Eurozone inflation stats and growth numbers from Canada. There’s growing chatter the ECB could also dial back its asset purchases in September. Even in this case though, it would be almost a ‘fake taper’, with the ECB slowing its emergency pandemic purchases only to increase its regular purchases later on. Rates won’t rise for several years, which is ultimately what matters for FX markets.
GBPUSD Picks Up Bullish Steam, Crucial Resistance Nearby
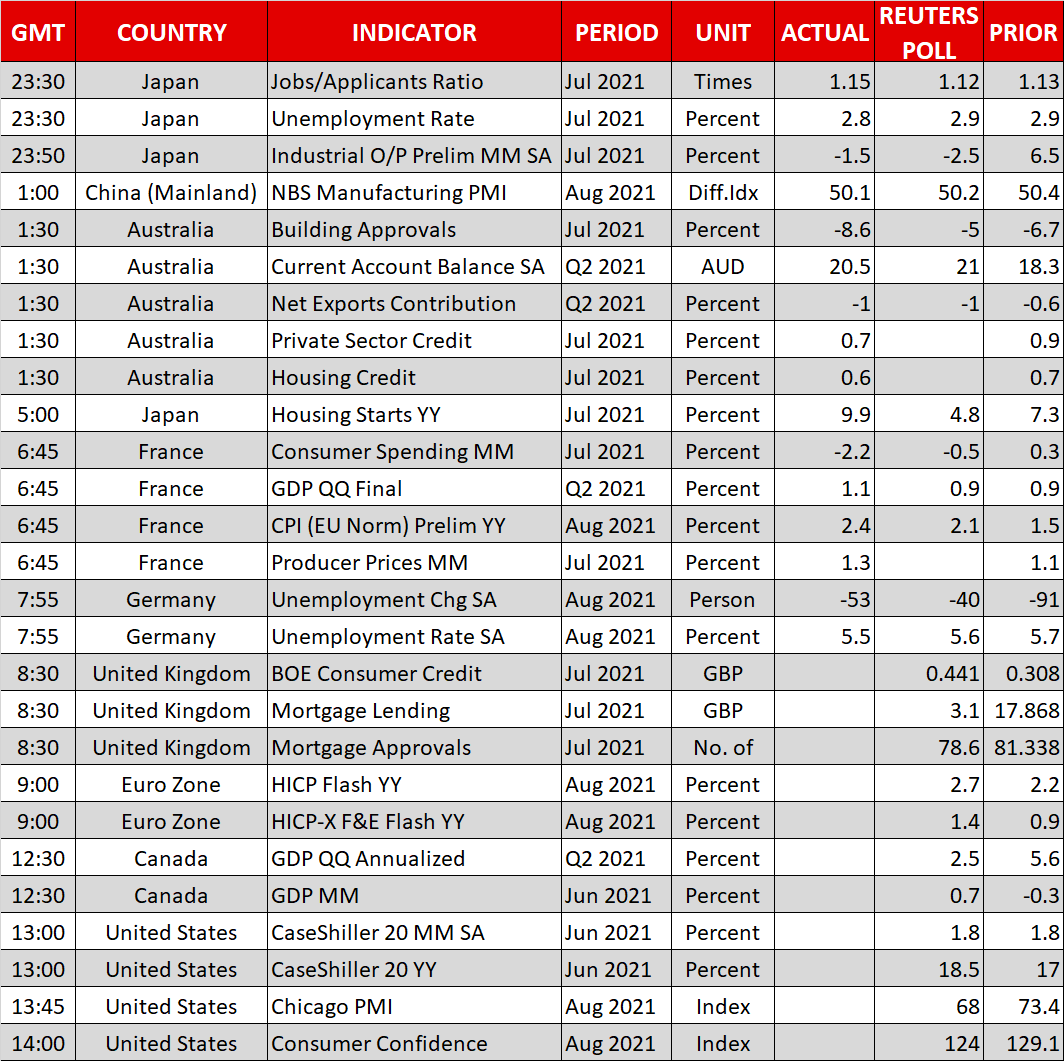
GBPUSD opened the day with strong positive momentum with scope to breach its simple moving averages (SMAs) currently within the 1.3780 – 1.3810 area.
The bullish action is invoking a sense of déjà vu from late July, when attempts to pierce the 50-day SMA evaporated around the dashed descending trendline.
From a technical perspective, downside corrections cannot be ruled out as the Stochastics are entering the overbought area, suggesting the bulls could soon run out of fuel. Nevertheless, the indicator has yet to peak within that territory and the RSI is looking to extend its uptrend above its 50 neutral mark, while the MACD continues to gain ground above its red signal line, overall endorsing the buying appetite in the market.
Of note, however, the 20-day SMA has confirmed a double bearish cross with the longer-term SMAs, whilst the 50- and 200-day SMAs are also set to negatively intersect each other, raising questions about whether the recent upside correction can activate the long-term uptrend above the 1.4248 peak.
In the meantime, a decisive close above the SMAs and the dashed trendline at 1.3830 could see an extension up to the 1.3874 resistance. A successful move higher from here could then challenge the 1.3982 – 1.4000 restrictive region, a break of which would open the door for the 1.4100 psychological mark.
Should the bulls give up the rally around the SMAs, the price could reverse southwards to meet support near 1.3692. Sliding lower, all eyes will turn to the 1.3600 bottom, where any violation would bring the downtrend from the 1.4248 back into play, likely triggering a steeper decline towards the 1.3500 level and the broken descending trendline.
In brief, GBPUSD is currently viewed as cautiously bullish as the price is approaching a crucial resistance territory. A decisive close above 1.3830 could ease fears of a downside reversal.
XAUUSD Is Probably Bullish
Technical analysis
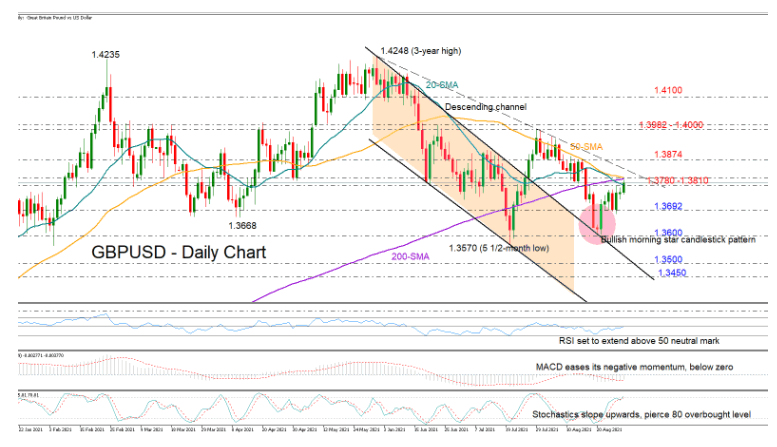
The EMA(24) is higher than the EMA(124), which is advantageous for bulls
The RSI is above 50 suggesting a prevailing uptrend
The CCI suggests correction downwards.
What the possible outcomes are
All focus is on Nonfarm payrolls this Friday at 12.30 p.m. GMT.
At the moment, the price may attempt to break the first resistance level of 1,815. Above lies the two resistance levels of 1,823 and 1,830.
If bears defend the resistance level of 1,800, the price may recoil towards the support level of 1,809. A breakout of that level can push the price lower towards 1,800 and 1,793.
Key levels
Support 1,790 1,793 1,800
Resistance 1,815 1,823 1,830
AUDNZD Slumps To April 2020 Low After Weak Australian Data
The price of crude oil was little changed in the overnight session even as many US producers shut down their oil rigs following Hurricane Ida. Brent, the international benchmark, is trading at $71.25 while the West Texas Intermediate is trading at $68.77. This price action is mostly because the market was expecting the closure of these rigs as the hurricane season went on. Later today, the price will react to the latest inventories numbers by the American Petroleum Institute (API). The median estimate by a panel by Reuters expect that inventories declined by more than 2.8 million barrels last week.
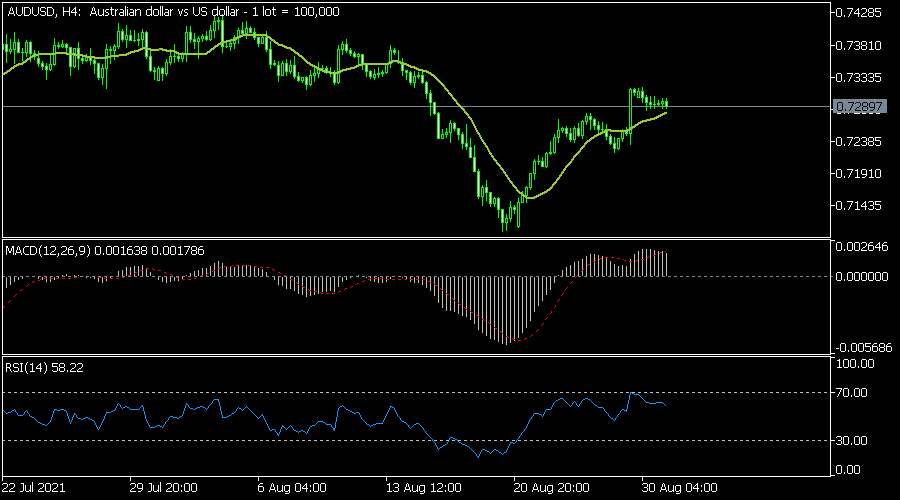
The AUD/USD was in a tight range in early trading as the market reflected on the relatively weak data from Australia and China. In Australia, data showed that building approvals declined by 8.6% in July after falling by 5.5% in the previous month. Similarly, the country’s housing credit increased by 0.6% in July after rising by 0.7% in the previous month. Additionally, private house approvals declined by 5.8%. This price action was mostly because of the new wave of the Covid-19 pandemic. Meanwhile, in China, data by China Logistics revealed that the manufacturing PMI declined to 50.1 while non-manufacturing PMI fell to 47.5.
The economic calendar will have some key events today. In Europe, the key data to watch will be the flash Eurozone consumer inflation data. Analysts expect the data to show that the headline CPI rose from 2.2% in July to 2.7% in August. This increase is mostly because of the rising logistics challenges going on globally. In the UK, the Bank of England (BOE) will publish the latest mortgage approvals data. Meanwhile, in Canada, the statistics agency will release the latest GDP data. Most importantly, in the US, the Conference Board will publish the latest consumer confidence data.
AUDUSD
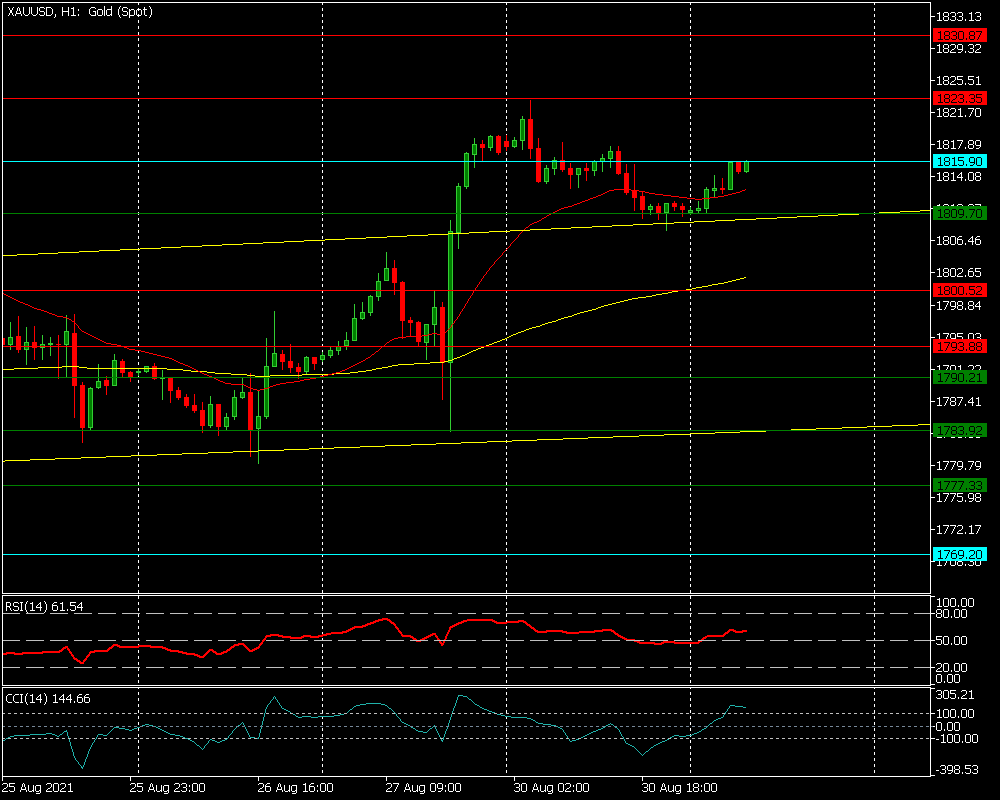
The AUDUSD price was little changed after the relatively weak Chinese and Australian economic data. It is trading at 0.7290, which is substantially higher than last week’s low of 0.7105. On the four-hour chart, the pair has formed a V-shaped recovery and moved above the 25-day and 15-day moving averages. The current level is relatively important since it was the lowest level on June 20. Therefore, the pair will likely keep rising as bulls target the key resistance at 0.7350.
EURUSD
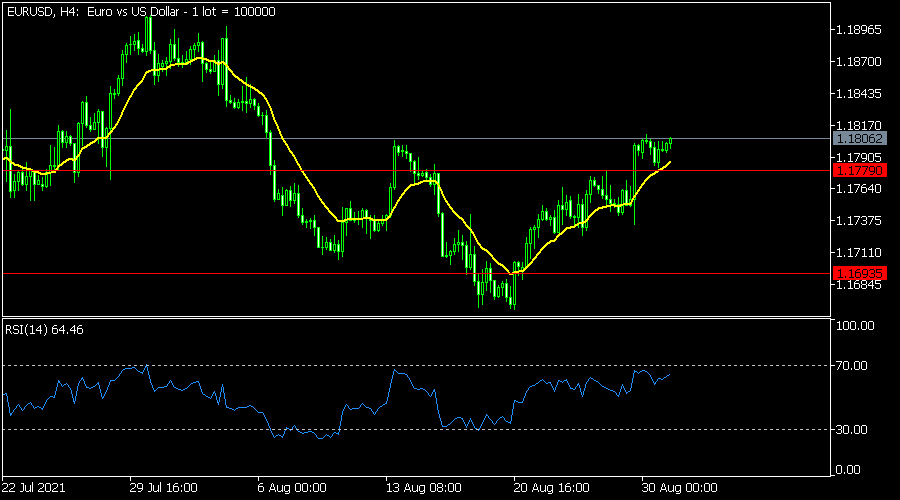
The EURUSD pair rose to an intraday high of 1.1805 during the Asian session. On the four-hour chart, the pair managed to move above the key resistance level at 1.1780 and the 25-day moving average. It has also formed an inverted head and shoulders pattern, which is usually a bullish sign. The Relative Strength Index (RSI) has also formed a bullish divergence pattern. Therefore, the pair will likely keep rising as bulls target the key resistance at 1.1900.
AUDNZD
The AUDNZD crashed to the lowest level since April last year after the weak Australian data. It fell to an intraday low of 1.0340, which was also substantially higher than last year’s high of 1.1047. On the daily chart, the pair moved below the key support level at 1.0418. It also declined below the 25-day and 15-day moving averages. Therefore, the path of the least resistance for the pair is to the downside.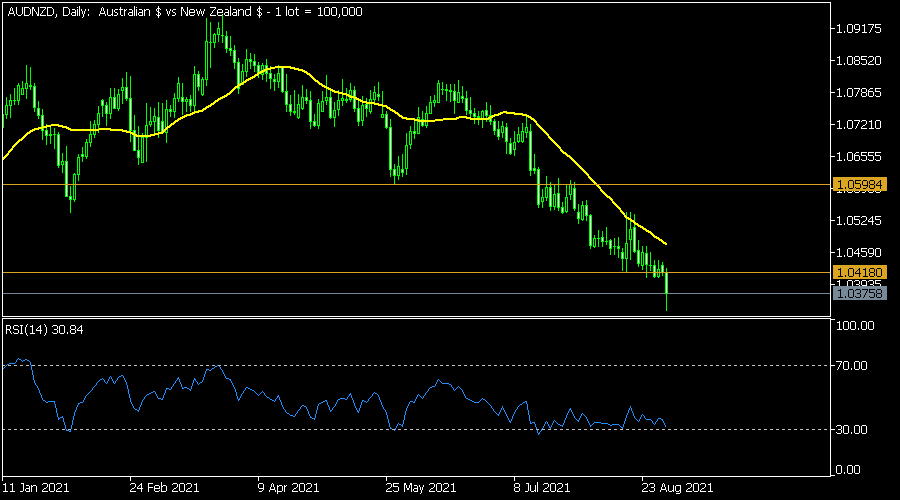
Chinese Market Has Accumulated Upside Potential
The Chinese market is lagging behind Wall Street and European indices due to the ongoing regulatory pressure. Investor sentiment in the region is also under pressure from worsening macroeconomic indicators.
The latest initiatives by the Chinese government include a strict restriction on online gaming for teenagers, limiting them to just one hour daily on Fridays and weekends.
The manufacturing PMI fell in August from 50.4 to 50.1, and the non-manufacturing indicator collapsed from 53.3 to 47.5, reflecting a tight lockdown to quell the coronavirus outbreak.
Nevertheless, markets have managed to digest this negative sentiment during Asian trading. There are emerging signs that investors found Chinese equities attractive enough to buy, even given the risks involved.
The Shanghai China A50 blue-chip index gained support on the decline to 14500, an area of highs set in 2015 and early 2017 and 2020. The former resistance area now acts as a major support line.
Technically, there is sufficient room on the bearish side for a decline into the area of 13300 by the end of the year, where the lower boundary of the long-term uptrend channel passes.
Similar potential remains in the Hang Seng, whose long-term uptrend channel support passes through about 22,000 by the end of the year against the current 25700.
The Hong Kong-listed mainland equity index, H-shares, is close to a long-term support level of around 9000.
In all three cases, on the weekly charts, we can see attempts to move out of the oversold area and signs of RSI and index level divergence, with new price lows corresponding to higher indicator levels.
On the daily charts, the divergence between the RSI and the price is even more visible, making the Chinese market interesting for long-term investors who believe in the potential of the second world economy.
It is worth cautioning against aggressive buying of these indices or individual stocks right now. So far, there are no signs that China intends to stop the overhaul of regulations for technology and online companies. The People's Bank of China has not yet gone for a loosening of monetary policy, although many market observers expect this move later this year.
Perhaps the more cautious speculators should not look for an entry point at the lowest price but join the buying after signs confirming a change in the regulator's mood. It could be the easing of PBC policy or signals that no new restrictions for technology companies are planned.