Sample Category Title
USD/CAD Daily Outlook
Daily Pivots: (S1) 1.2709; (P) 1.2770; (R1) 1.2890; More...
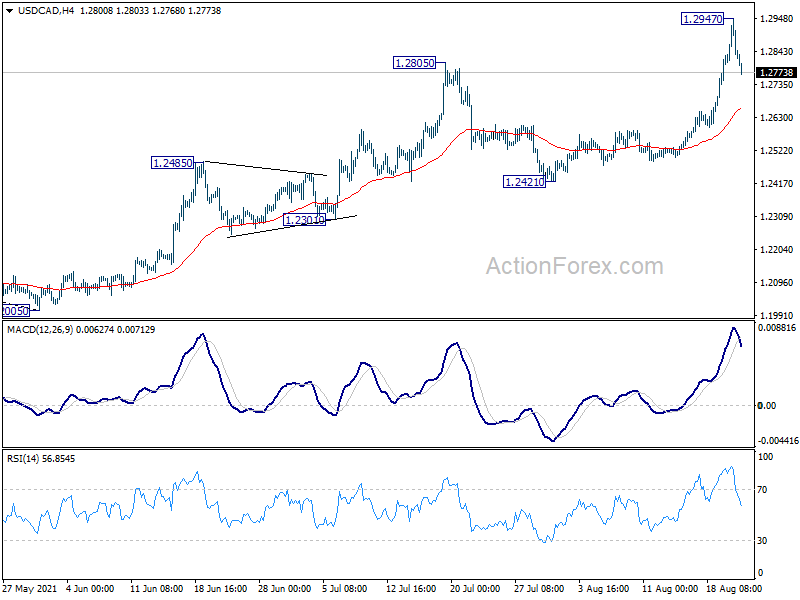
USD/CAD's retreat from 1.2947 extends lower today but intraday bias remains neutral first. We'd expect downside to be contained by 4 hour 55 EMA (now at 1.2660) to bring rebound. Break of 1.2947 will resume the rise from 1.2005 to 1.3022 fibonacci level next. Nevertheless, sustained trading below 4 hour 55 EMA will bring deeper fall back to 1.2421 support.
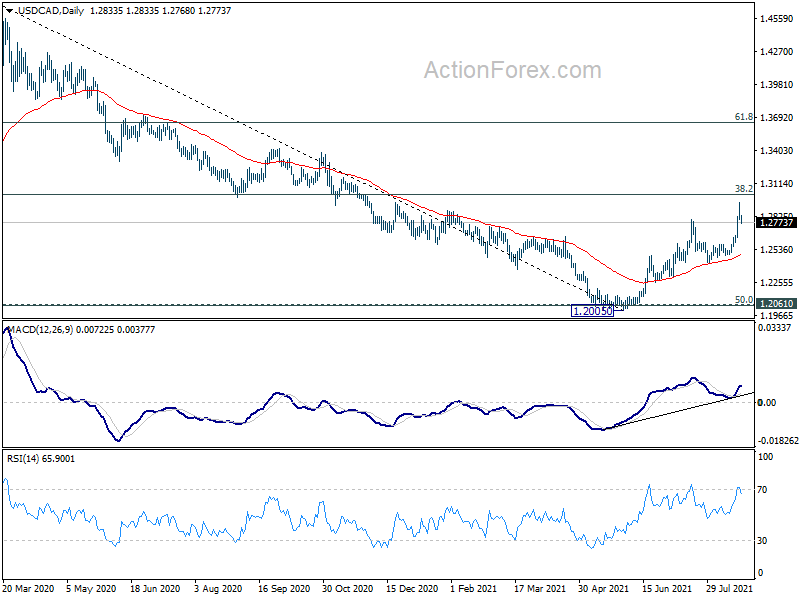
In the bigger picture, fall from 1.4667 is seen as the third leg of the corrective pattern from 1.4689 (2016 high). It should have completed after hitting 1.2061 (2017 low) and 50% retracement of 0.9406 to 1.4689 at 1.2048. Sustained break of 38.2% retracement of 1.4667 to 1.2005 at 1.3022 will pave the way to 61.8% retracement at 1.3650 and above. Overall, medium term outlook remains neutral at worst with 1.2048/61 support zone intact.
Dollar Paring Gains as Asian Markets Rebound Despite Poor PMIs
Asian markets are staging a strong rebound today, despite poor economic data out of Japan and Australia. Investors are probably reassessing the timing of Fed's tapering, which would be delayed by the current surge in Delta variant. Meanwhile, China reported zero case of local transmission of COVID-19 for the first time since July. Dollar, Yen and Swiss Franc are paring some of last week's gains. Canadian Dollar leads commodity currencies higher.
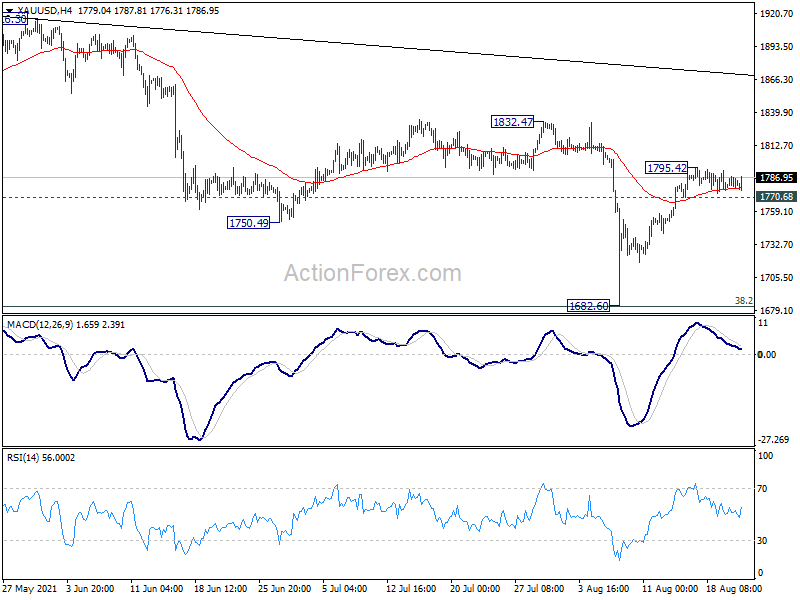
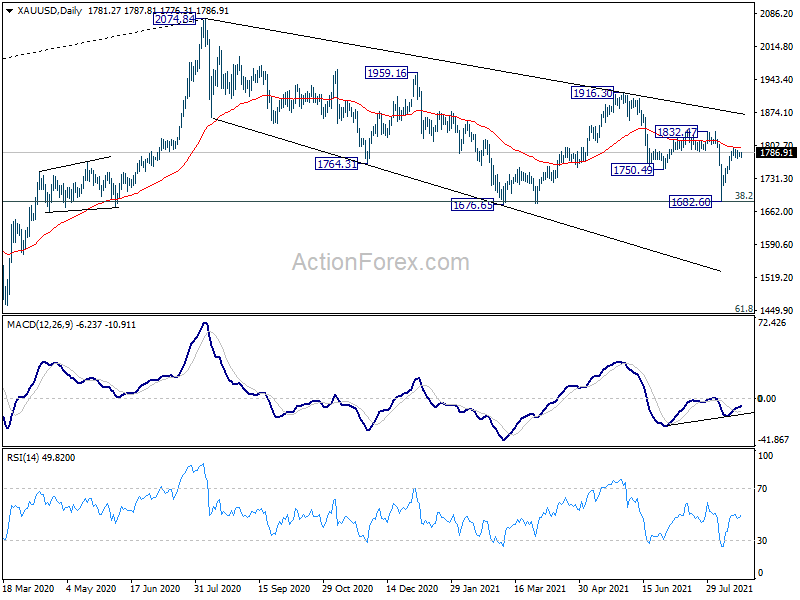
Technically, we'll pay some attention to the development in Gold today. It has been rather resilient last week despite the strong rise in Dollar. A break of 1795.42 will resume the rebound from 1682.60 and put 1800 handle to immediate focus. Sustained trading above 1800 would raise the change of bullish reversal. Further break of 1832.47 resistance could extend the rally to 1916.30 resistance. That, if happens, might signal a return to weakness in the greenback.
In Asia, at the time of writing, Nikkei is up 1.73%. Hong Kong HSI is up 2.09%. China Shanghai SSE is up 1.13%. Singapore Strait Times is up 0.09%. Japan 10-year JGB yield is up 0.010 at 0.022.
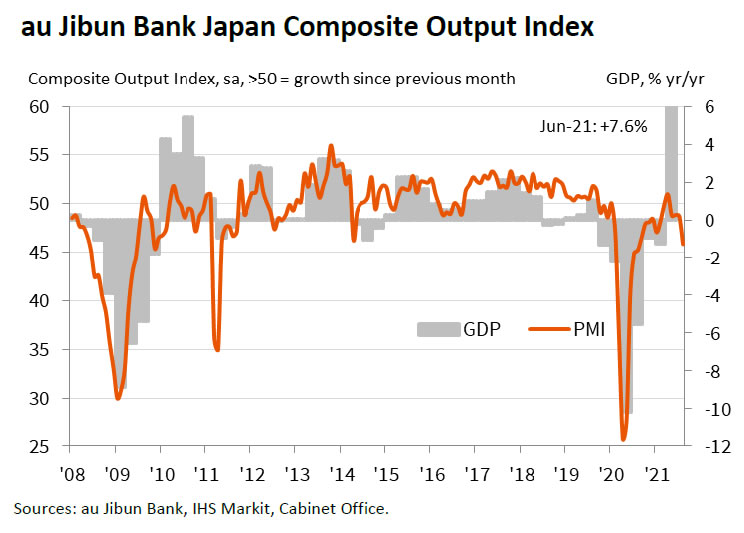
Japan PMI composite dropped to 45.9 in Aug, weaker demand and sustained supply chain pressures
Japan PMI Manufacturing dropped from 53.0 to 52.4 in August, below expectation of 53.4. PMI services dropped sharply from 47.4 to 43.5, worst in 15 months. PMI Composite dropped from 48.8 to 45.9, worst since August 2020.
Usamah Bhatti, Economist at IHS Markit, said: "The Japanese private sector economy saw business conditions deteriorate further midway through the third quarter of the year, with flash PMI data signalling a quicker decline in business activity in August. The latest contraction was the quickest recorded since August 2020, while incoming business was reduced at the sharpest pace for seven months. Survey respondents commonly attributed weaker demand to ongoing COVID-19 restrictions, coupled with sustained supply chain pressures."
Australia PMI composite dropped to 15-month low, heavily impacted by restrictions
Australia PMI Manufacturing dropped from 56.9 to 51.7 in August, hitting a 14-month low. PMI Services dropped from 44.2 to 43.3, a 15-month low. PMI Composite dropped from 45.2 to 43.5, also a 15-month low.
Jingyi Pan, Economics Associate Director at IHS Markit, said: "Australia's private sector remained stuck in decline in August... as activity remained heavily impacted by current mobility restrictions brought about by the spread of the COVID-19 Delta variant. Not only were demand and business activity hit, employment conditions also deteriorated, with private sector staffing levels falling for the first time since October 2020... The one bright spot had been an improvement in the outlook amongst Australian private sector firms in August, with hopes of an improvement in the COVID-19 situation expected to spark an eventual rebound for the Australian economy."
Fed Chair Powell unlikely to deliver something substance at Jackson Hole
Fed Chair Jerome Powell's speech in Jackson Hole symposium will be the highlight of the week. But he's actually unlikely to deliver anything ground breaking. Instead, focuses would be on comments from other Fed officials, in particular the known hawks, regarding the timing of tapering. Some of them could follow Robert Kaplan's step and turn more cautious.
Meanwhile, PMI data would be closely watched to gauge sentiments, together with Germany Ifo business climate. Other economic data like US durable goods orders, personal income and spending, PCE inflation will be featured. New Zealand retail sales and trade balance, and Australia retail sales could also trigger some volatility. Here are some highlights for the week:
- Monday: Australia PMIs; Japan PMI manufacturing; Eurozone PMIs; UK PMIs; US PMIs, existing home sales.
- Tuesday: New Zealand retail sales; Germany GDP final; US new home sales.
- Wednesday: New Zealand trade balance; Germany ifo business climate; Swiss Credit Suisse economic expectations; US durable goods orders.
- Thursday: Japan corporate services price index; Australia private capital expenditure; Germany Gfk consumer climate; Eurozone M3 money supply, ECB meeting accounts; US GDP, jobless claims.
- Friday: Japan Tokyo CPI, Australia retail sales; Germany import prices; Canada IPPI and RMPI; US goods trade balance, personal income and spending, wholesale sales.
USD/CAD Daily Outlook
Daily Pivots: (S1) 1.2709; (P) 1.2770; (R1) 1.2890; More...
USD/CAD's retreat from 1.2947 extends lower today but intraday bias remains neutral first. We'd expect downside to be contained by 4 hour 55 EMA (now at 1.2660) to bring rebound. Break of 1.2947 will resume the rise from 1.2005 to 1.3022 fibonacci level next. Nevertheless, sustained trading below 4 hour 55 EMA will bring deeper fall back to 1.2421 support.
In the bigger picture, fall from 1.4667 is seen as the third leg of the corrective pattern from 1.4689 (2016 high). It should have completed after hitting 1.2061 (2017 low) and 50% retracement of 0.9406 to 1.4689 at 1.2048. Sustained break of 38.2% retracement of 1.4667 to 1.2005 at 1.3022 will pave the way to 61.8% retracement at 1.3650 and above. Overall, medium term outlook remains neutral at worst with 1.2048/61 support zone intact.
Economic Indicators Update
| GMT | Ccy | Events | Actual | Forecast | Previous | Revised |
|---|---|---|---|---|---|---|
| 23:00 | AUD | Manufacturing PMI Aug P | 51.7 | 56.9 | ||
| 23:00 | AUD | Services PMI Aug P | 43.3 | 44.2 | ||
| 00:30 | JPY | Manufacturing PMI Aug P | 52.4 | 53.4 | 53 | |
| 07:15 | EUR | France Manufacturing PMI Aug P | 57.3 | 58 | ||
| 07:15 | EUR | France Services PMI Aug P | 57 | 56.8 | ||
| 07:30 | EUR | Germany Manufacturing PMI Aug P | 65 | 65.9 | ||
| 07:30 | EUR | Germany Services PMI Aug P | 61 | 61.8 | ||
| 08:00 | EUR | Eurozone Manufacturing PMI Aug P | 62 | 62.8 | ||
| 08:00 | EUR | Eurozone Services PMI Aug P | 59.8 | 59.8 | ||
| 08:30 | GBP | Manufacturing PMI Aug P | 59.5 | 60.4 | ||
| 08:30 | GBP | Services PMI Aug P | 59 | 59.6 | ||
| 13:45 | USD | Manufacturing PMI Aug P | 63 | 63.4 | ||
| 13:45 | USD | Services PMI Aug P | 59.9 | 59.9 | ||
| 14:00 | USD | Existing Home Sales Jul | 5.83M | 5.86M | ||
| 14:00 | EUR | Eurozone Consumer Confidence Aug P | -5 | -4 |
Japan PMI composite dropped to 45.9 in Aug, weaker demand and sustained supply chain pressures
Japan PMI Manufacturing dropped from 53.0 to 52.4 in August, below expectation of 53.4. PMI services dropped sharply from 47.4 to 43.5, worst in 15 months. PMI Composite dropped from 48.8 to 45.9, worst since August 2020.
Usamah Bhatti, Economist at IHS Markit, said: "The Japanese private sector economy saw business conditions deteriorate further midway through the third quarter of the year, with flash PMI data signalling a quicker decline in business activity in August. The latest contraction was the quickest recorded since August 2020, while incoming business was reduced at the sharpest pace for seven months. Survey respondents commonly attributed weaker demand to ongoing COVID-19 restrictions, coupled with sustained supply chain pressures."
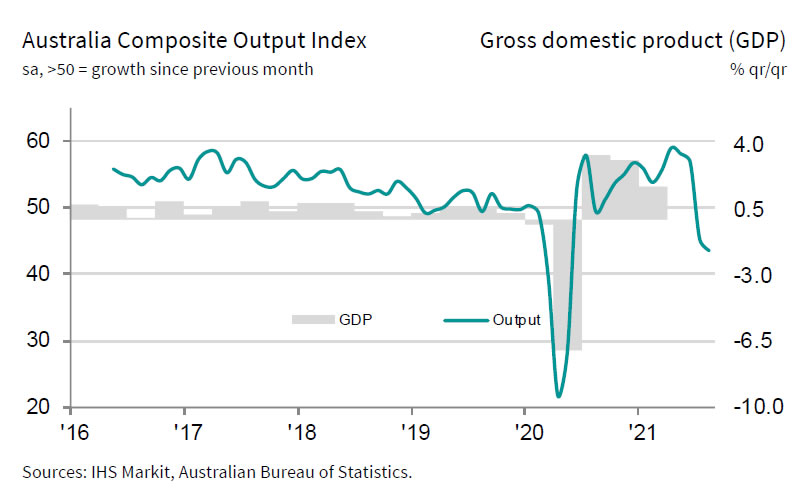
Australia PMI composite dropped to 15-month low, heavily impacted by restrictions
Australia PMI Manufacturing dropped from 56.9 to 51.7 in August, hitting a 14-month low. PMI Services dropped from 44.2 to 43.3, a 15-month low. PMI Composite dropped from 45.2 to 43.5, also a 15-month low.
Jingyi Pan, Economics Associate Director at IHS Markit, said: "Australia's private sector remained stuck in decline in August... as activity remained heavily impacted by current mobility restrictions brought about by the spread of the COVID-19 Delta variant. Not only were demand and business activity hit, employment conditions also deteriorated, with private sector staffing levels falling for the first time since October 2020... The one bright spot had been an improvement in the outlook amongst Australian private sector firms in August, with hopes of an improvement in the COVID-19 situation expected to spark an eventual rebound for the Australian economy."
Forex and Cryptocurrencies Forecast
EUR/USD: Fed Needs Strong Dollar, ECB Needs Weak Euro
A previous review named the publication of the US Fed's FOMC meeting minutes on Wednesday 18 August as the most important event of the past week. This document was supposed to clarify the situation regarding the timing of the curtailment of the monetary stimulus (QE) program. Of course, 100% clarity never came out. Some Fed executives still believe that it is necessary to start winding down stimulus at the earliest in spring 2022. However, there is also the opposite view that a parting with QE should happen before the end of this year. And it was this view that led to another decline in investor risk appetites and a further strengthening of the dollar.
Stock indexes - the Dow Jones, S&P500, Nasdaq Composite, have been falling since the start of the week, with the release of the minutes pushing them further down. And while a certain wave of purchases could be observed after each pullback, the trend still remains downward: the market gets rid of stocks, preferring dollars. The DXY index, which tracks the USD against a basket of 6 major currencies, heaped nearly 1.3 per cent over the week, rising from 92.500 to 93.700.
In addition to anticipating the early start of QE, the new strain of Delta coronavirus is also pressing the stock and commodity markets. In anticipation of new lockdowns, investors fear for the fate of both the global economy as a whole and its locomotive, the US economy. According to the Ministry of Health, the number of new infections totaled more than 268,000 in one day on August 17 alone, which compares with the peaks of the beginning of the year.
That being said, the US job market feels pretty good at all. At least for now. Thus, the number of initial applications for unemployment benefits decreased from 377 thousand to 348 thousand for the week, which is much better than the forecast of 363 thousand. This has been the best indicator since the beginning and has benefited the dollar.
Another source of support for the USD was the widening spreads between the yields of US and foreign bonds. Foreign investors support and will support the demand for dollars in order to then purchase American Treasuries.
Because of the above factors, the result of the past week was the strengthening of the dollar against the euro by 130 points. having started Monday from 1.1795, EUR/USD groped the local bottom at 1.1665 by the end of the week and finished five days in 1.1700.
A strong dollar is needed by the Fed to reassure investors about unmanageable inflation. Therefore, new, clearer signals regarding the folding of QE can be expected from this regulator. But the ECB is not at all opposed to further weakening of the euro, which has been repeatedly stated by the head of the bank Christine Lagarde. So, according to many experts, the downtrend of the EUR/USD pair will continue in the medium term.
The pair has now fallen below the low of April 01, 2021, 1.1704, and if this breakdown is confirmed, the next targets will be the lows of last autumn in the 1.1600-1.1610 zone. If it is able to overcome this barrier, it will open a road to targets in zones 1.1450 and 1.1240. A 300-400 point path is likely to take a month or two to overcome. But if the Fed announces the completion of QE, the pair will fly that distance in a matter of days. This development is supported by 65% of experts.
The remaining 35% believe that the dollar may take a pause in its growth and the EUR/USD pair will return to the 1.1700-1.1900 range for a while. The nearest targets here are 1.1750 and 1.1830.
In terms of technical analysis, D1 has 100% of the trend indicators and 75% of the oscillators painted red. The remaining 25% oscillators give signals that the pair is oversold.
In the coming week, we should note the publication of Markit's German and Eurozone PMI on Monday 23 August, as well as of capital orders goods and durable goods in the US on Wednesday 25 August. On Thursday, we'll find out preliminary US GDP figures. In addition, the annual symposium will be held in Jackson Hole from August 26 to 28, where Fed Chairman Jerome Powell will speak on Friday.

GBP/USD: Escape from the Pound
If the pound could still struggle with the dollar two weeks ago, it surrendered all its positions last week. Investors rushed to secure assets due to the rapid spread of the Delta strain and its impact on the global economic recovery. Plus, the possible winding down of QE in the USA. And then the Gfk UK Consumer Confidence Index fell from minus 7 in July to minus 8 in August, the worst performance since the start of the COVID-19 pandemic. As a result, GBP/USD falls almost 270 points to mid-term support in the 1.3600 zone and finishes at 1.3622.
We would like to remind that in the previous forecast, the specialists of the German Commerzbank designated the July 20 low at 1.3571 as the target for the pair. Given the slight backlash, this forecast proved correct. And now they say that in its fall, the pair may test the 200-week moving average at 1.3146. The strongest support along the way is located in the 1.3480 and 1.3200 zones.
South is also indicated by 100% of trend indicators and 65% of oscillators on D1. However, only 30 per cent of experts agree with them among analysts. The remaining 70% believe that the British currency's potential for resistance is far from exhausted, especially if the Bank of England takes a more active position. 35% of oscillators in the oversold zone talk of a possible reversal to the north as well. The nearest resistance is at 1.3725, the nearest target is the return of GBP/USD to the 1.3800-1.3875 zone. The nearest resistance levels are 1.3910 and 1.3960.
Of the most significant macro statistics to be released next week, the publication of Markit's UK services business index on Monday 23 August can be singled out.
USD/JPY: Yen Is Not Afraid of Dollar
Against the backdrop of investors" defection from risk, unlike the rest of the currencies, the yen, as a quiet haven, successfully resists the dollar's gaining strength. Since past March, USD/JPY has been moving along the 110.00 horizon, making rare attempts to get outside the 108.30-111.00 trading channel. This time, starting the week from 109.55 mark, it finished it almost there, at 109.80, and the range of fluctuations barely exceeded 110 points: from 109.10 at the low to 110.22 at the high.
This behavior of the pair forces both experts and indicators to make very contradictory forecasts. Among the first, 45% side with the bulls, 35% side with the bears and 20% take a neutral position. Among the oscillators on D1, 35% are colored red, 15% - green, 50% - neutral gray. Among trend indicators, the ratio is 60% to 40% in favor of green.
Support levels are 109.10, 108.70 and 108.30. The bears' dream is to retest the April low of 107.45. The nearest resistance levels are the 110.00, 110.55, 110.80, 111.00 and 111.65 zones. The ultimate goal of the bulls is still the same: to get to the cherished height of 112.00.
CRYPTOCURRENCIES: The Lull Before the Storm?
Bitcoin has slowly and uncertainly creeped up all week, trying to overcome a strong level of resistance around $48,000. Two attempts, on August 14 and 16, ended in failure, after which BTC/USD rolled back to the support of $44,000. At the time of writing this review, towards the end of Friday, August 20, it went to the assault again, broke through the resistance and reached the level of $49,000 in the thin market.
The total crypto market capitalization increased over the week from $1.957 trillion to $2.043 trillion, that is, by just 4.4%. And, although it has overcome the $2.0 trillion bar, it is not at all a fact that it will be able to gain a foothold above this level. Trading volumes on the BTC network remain low. The Crypto Fear & Greed Index has also remained still at 70 points.
This sluggishness and uncertainty may be due to the fact that large institutional investors are currently focusing on the traditional market. But we must not forget that mid-August is the height of the holiday period, and many traders will not step up until the end of the month.
Very strong drivers are needed to dramatically push the market up or down. World media reporters drew attention to Jerome Powell's online speech to students at the Town Hall conference. The Fed chief noted the ever-increasing importance of cryptocurrencies, outlining the phrase about the U.S. Treasury's examination of holding a portion of the country's reserves in digital assets. Making such a decision would literally blow up the cryptocurrency market, repeating the situation of 2017. The price of bitcoin soared then from $750 to $19,270, which is 25 times, getting the slang name "To the Moon". But for now, the head of the Federal Reserve's reasoning about supporting cryptocurrencies is only theoretical.
Bloomberg analyst Michael McGlone also spoke in favor of the first cryptocurrency, who emphasized that "digitalizing money and the financial industry" gives bitcoin a huge boost to growth. Once upon a time, similar factors allowed the US dollar to dominate the global financial arena. At the same time gold, according to the analyst, has no strong drivers for growth, and BTC is therefore quite capable of replacing this metal as an asset for risk hedging and wealth accumulation.
According to McGlone's forecast, bitcoin could well reach $100,000 in the medium term. The well-known cryptanalyst PlanB calls a slightly bigger figure. In his opinion, bitcoin follows the Stock-to-Flow (S2F) model he developed very closely, so the BTC/USD pair should reach $135,000 by the end of December.
Of course, all these figures are only the assumptions of specialists. Another cryptocurrency analyst Benjamin Cowen believes bitcoin is facing a crucial test this September, which will determine the future direction of the entire market. Bitcoin has tested the 20-week moving average every September since 2017 and either bounced or broke through it. And if another test happens this September, it will be possible to make a forecast basing on it until April 2022. "We will find out if the market will be bullish or if growth will stall for several months," the analyst says.
The 20-week MA is currently around $43,500 and if BTC can hold that level as support, according to Benjamin Cowen, we will see an upward move.
Santiment, a web data analysis firm, reported encouraging data for investors. Bitcoin supply on exchanges fell to a two-week low. This suggests that a large amount of BTC will go to cold wallets. Analyst firm Glassnode has made a similar observation: "Bitcoin continued to leave exchanges in August at rates ranging from 75,000 to 100,000 coins per month. This outflow is similar to the period between 2020 and the Q1 21, when large accumulations prevailed."
Bitcoin miners are also in no hurry to part with their coins, over the past month, their balance has grown steadily. This means that they expect further growth in the price of the coin as well, so they do not want to take profits now.
Despite the fact that the dominance of bitcoin has decreased from 69.7% to 43.8% since the beginning of the year, this coin is without a doubt still the main engine of the digital market. It is clear that the main competitor for BTC at the moment is ethereum. On some exchanges, it overtakes the reference cryptocurrency in terms of trading volumes already. And according to some experts, such as the head of the deVere Group Nigel Green, ETH may push bitcoin to second place in a few years.
As for the closer prospects, the popular cryptocurrency analyst and trader with the nickname DonAlt named several altcoins that are ready for a rally and may surpass BTC in profitability in the near future. The first on the list is ripple. According to the trader, the XRP/BTC pair is already "up 50 per cent but is still far from the level of resistance." DonAlt believes this pair could yet show 185% growth from current levels.
Eco Data 8/23/21
[php_everywhere instance="1"]
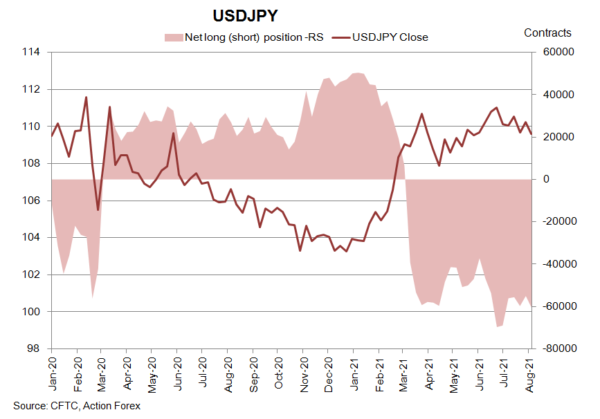
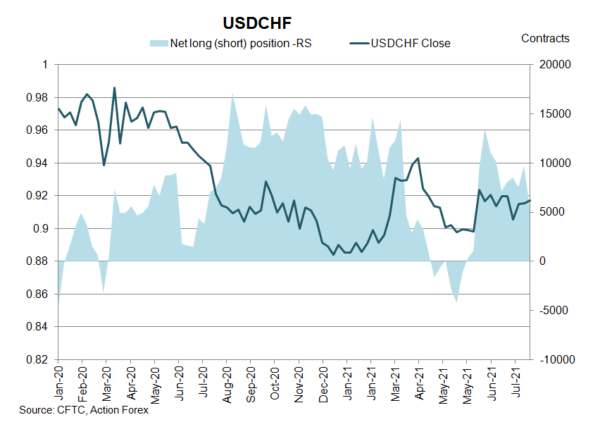
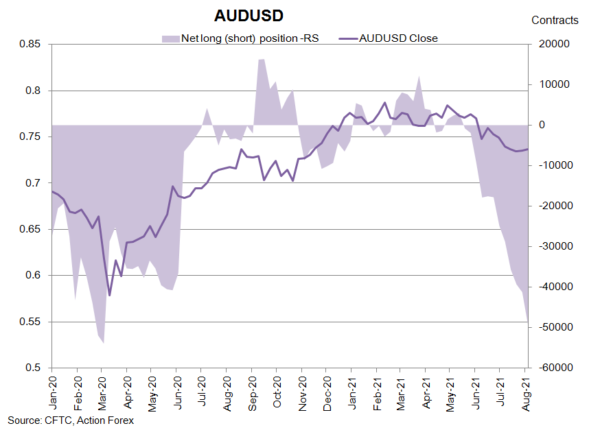
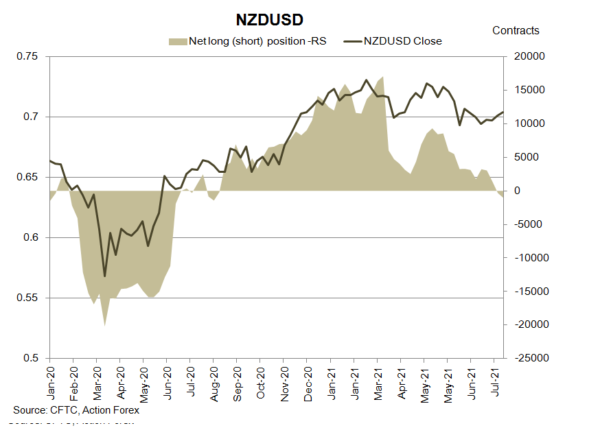
CFTC Commitments of Traders – Risk Currencies Got Dumped on Hopes of Fed’s Tapering and Resurgence of Pandemic
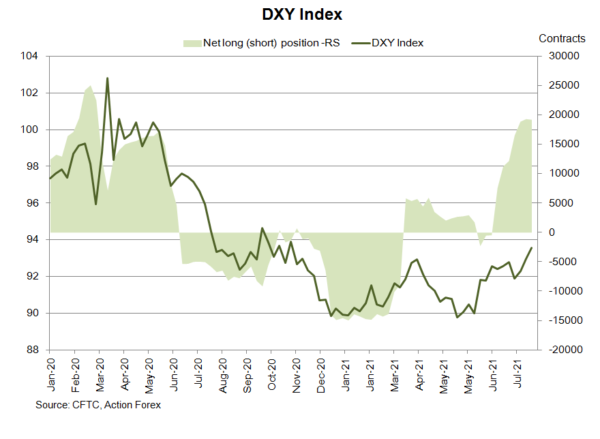
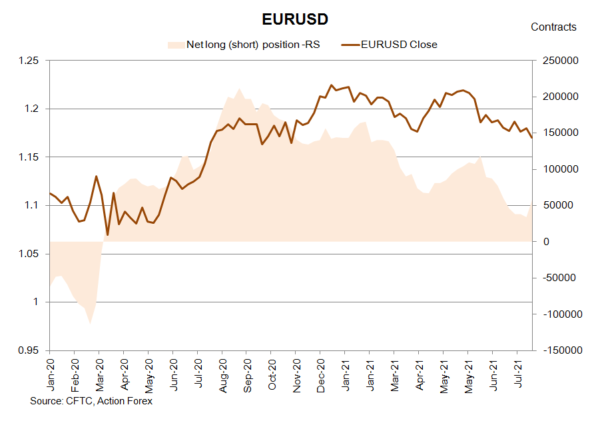
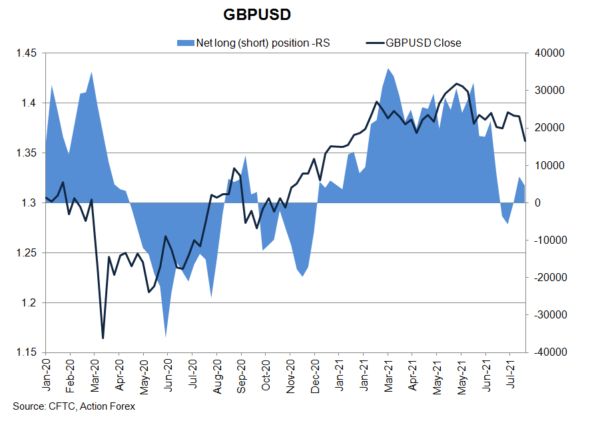
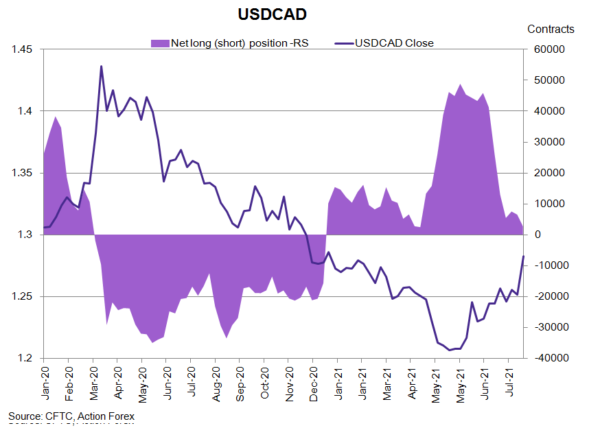
As suggested in the CFTC Commitments of Traders report in the week ended August 17, NET SHORT of USD index futures dropped -115 contracts to 19 211. Speculative long positions slipped -515 contracts while shorts decreased -400 contracts. Concerning European currencies, NET LENGTH in EUR futures jumped +23 783 contracts to 57 640. GBP futures' NET LENGTH fell -2 419 contracts to 4 651. We expect net length in EUR and GBP futures to fall in the coming weeks due to the sharp selloff.
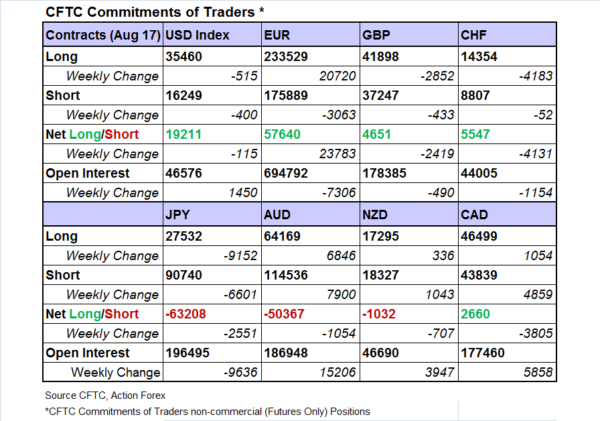
 On safe-haven currencies, NET LENGTH of CHF future fell -4 131 contracts to 5 547 while while NET SHORT of JPY futures gained +2 551 contracts to 63 208. Concerning commodity currencies, NET SHORT of AUD futures added +1 054 contracts to 50 367 while that of NZD futures dropped -797 contracts to 235 during the week. NET LENGTH of CAD futures sank -3 805 contracts to 2 660 during the week. Commodity currencies were worse off amidst the loss in risk appetite. We expect this trend to continue in the coming week.
CFTC Commitments of Traders – Risk Aversion Trumped Oil, Lifted Precious Metals
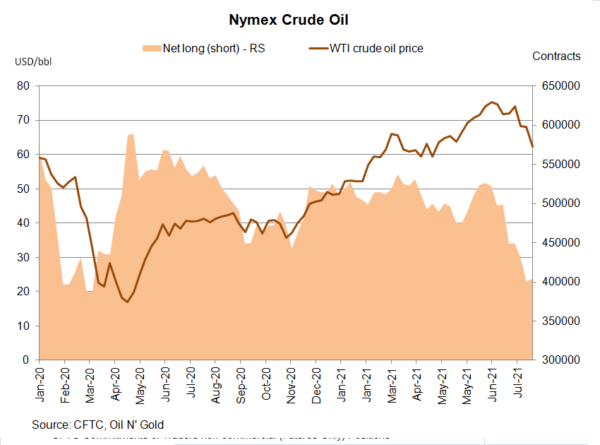
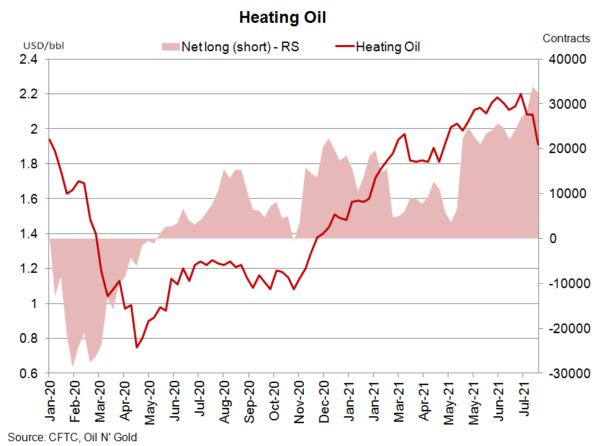
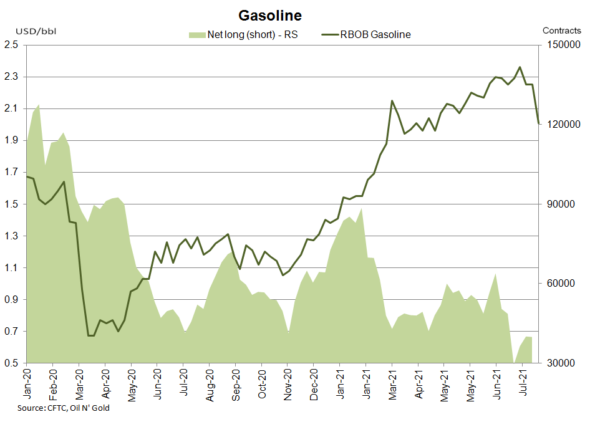
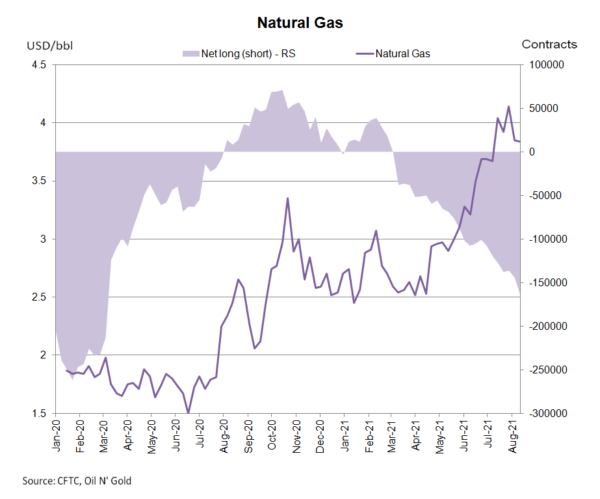
Trader trimmed bets on crude oil futures as the outlook has become more uncertain amidst rising coronavirus cases and Fed's tapering in the near future. According to the CFTC Commitments of Traders report for the week ended August 17. NET LENGTH for crude oil futures added +3 910 contracts to 404 323 for the week. Speculative long position declined -17 200 contracts, while shorts decreased -21 110 contracts. Net length should decline in the coming week due to the sharp fall of crude oil prices (the front-month WTI crude contract on Friday settled at the lowest since mid-April). For refined oil products, NET LENGTH for heating oil dropped -1 336 contracts to 32 579, while that for gasoline fell -4 091 contracts to 35 747. NET SHORT of natural gas futures rose +12 145 contracts to 163 065 during the week.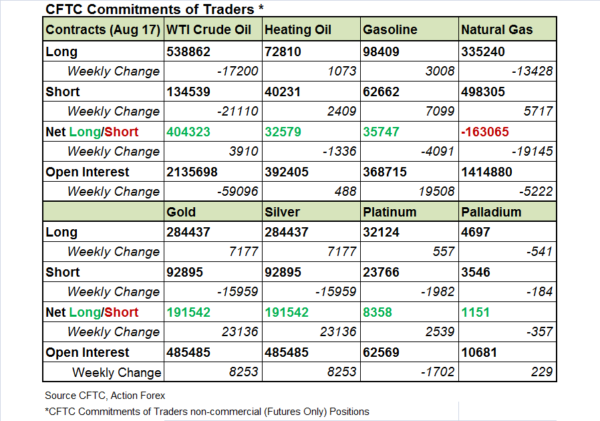
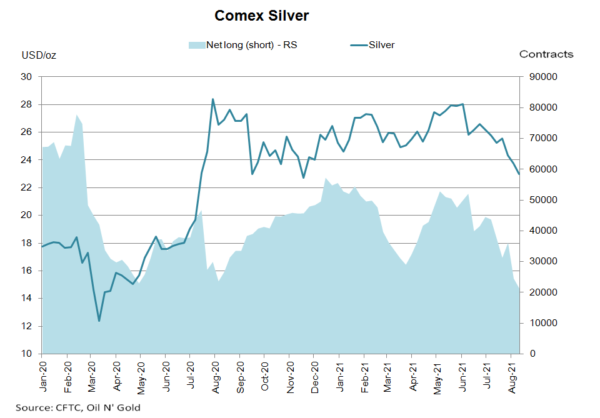
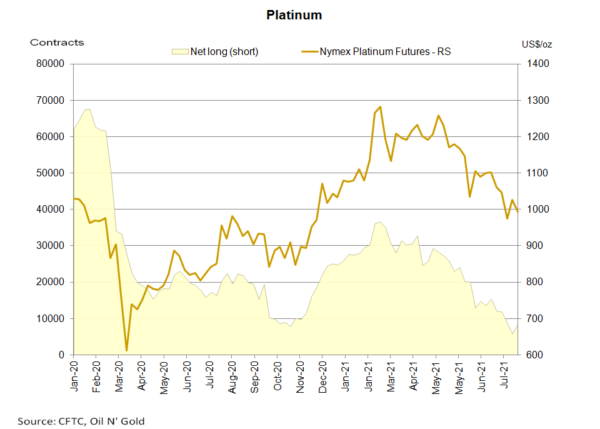
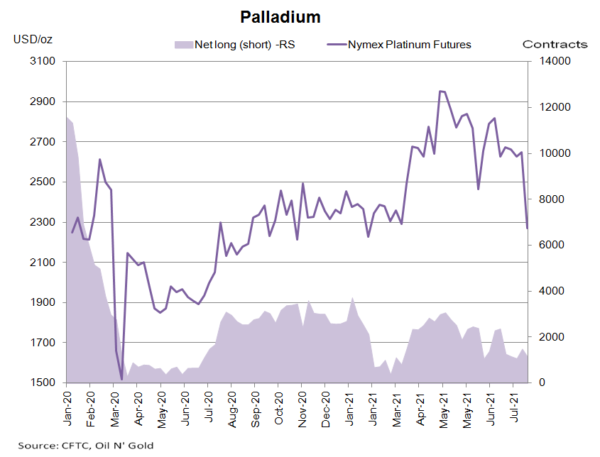
 Precious metals gained some grounds on risk aversion. Speculative long positions in both gold and silver futures increased, while shorts fell, last week. Gold futures’ NET LENGTH soared +23 136 contracts to 191 542 while silver futures’ NET LENGTH dropped -3 254 contracts to 21 220. For PGMs, NET LENGTH of Nymex platinum futures gained +2 539 contracts to 8 358 while that for palladium dropped -357 contracts to 1 151.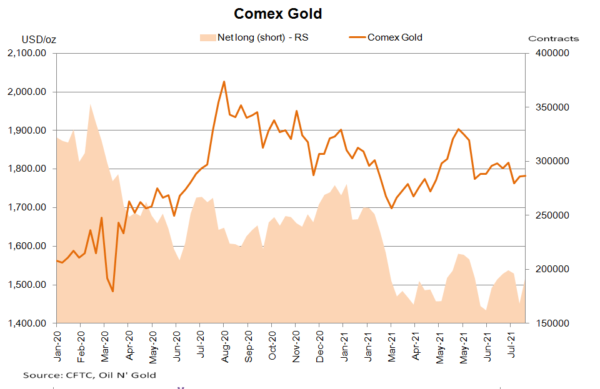
EUR/USD Weekly Outlook
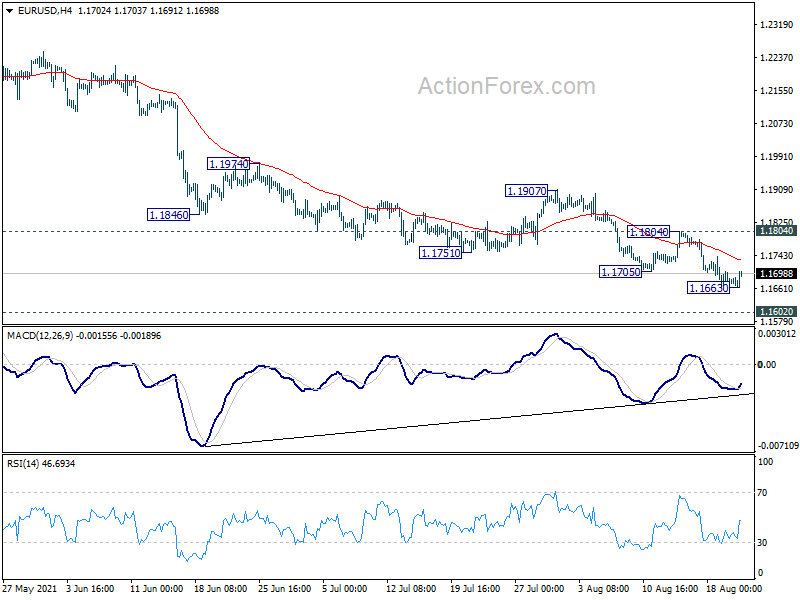
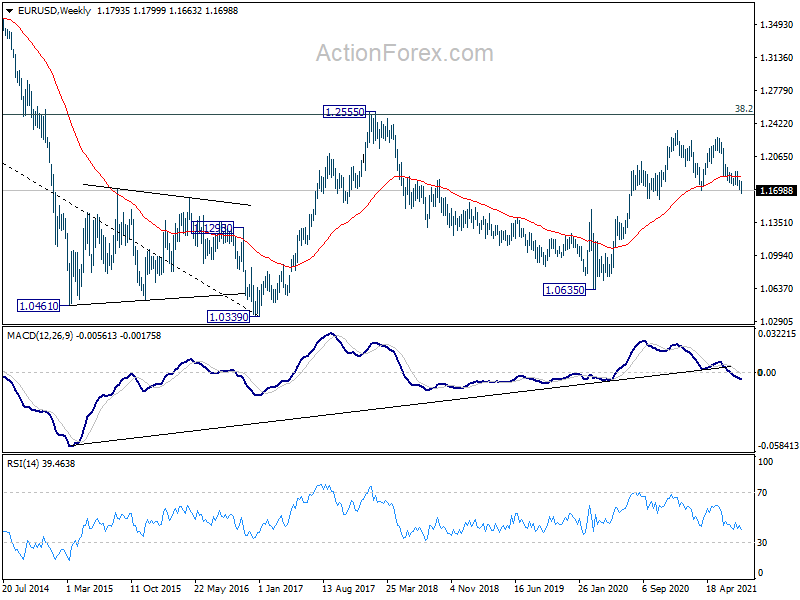
EUR/USD's decline resumed last week and hit 1.1663. But downside momentum has clearly diminished. Initial bias is turned neutral this week. We'd continue to look for strong support from 1.1602/1703 key support zone to bring rebound. On the upside, above 1.1804 resistance will turn bias back to the upside for 1.1907 resistance first. However, sustained break of 1.1602/1703 will carry larger bearish implication and pave the way to 1.1289 fibonacci support.
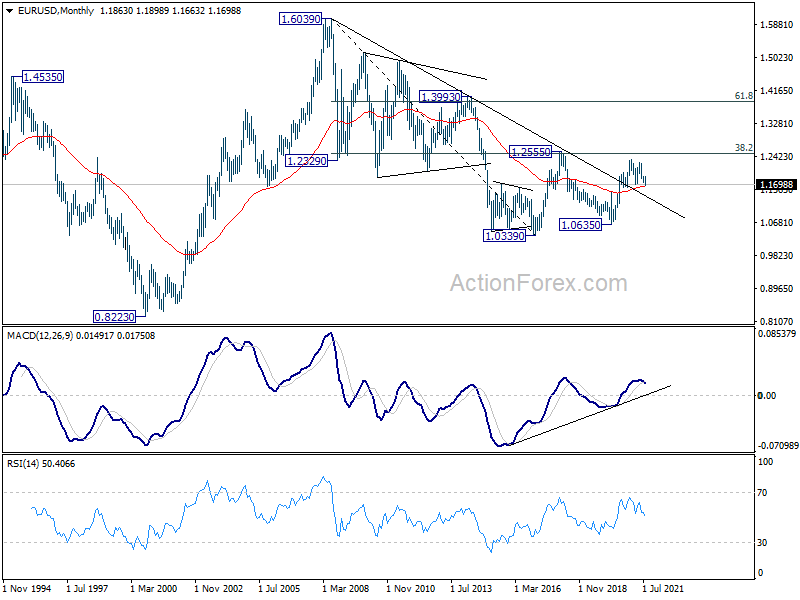
In the bigger picture, rise from 1.0635 is seen as the third leg of the pattern from 1.0339 (2017 low). Further rally remains in favors long as 1.1602 support holds, to cluster resistance at 1.2555 next, (38.2% retracement of 1.6039 to 1.0339 at 1.2516). However sustained break of 1.1602 will argue that the rise from 1.0635 is over, and turn medium term outlook bearish again. Deeper fall would be seen to 61.8% retracement of 1.0635 to 1.2348 at 1.1289 and below.
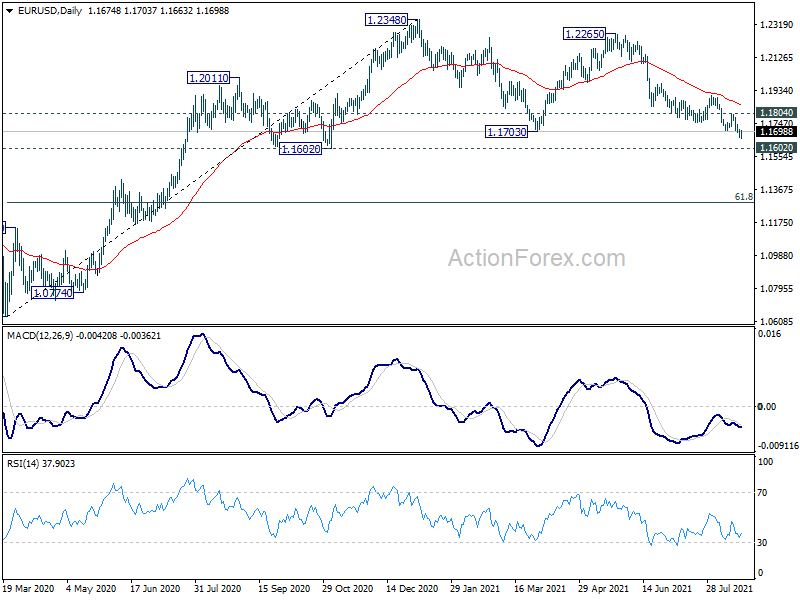
In the long term picture, focus remains on 1.2555 cluster resistance (38.2% retracement of 1.6039 to 1.0339 at 1.2516). Sustained break there should confirm long term bullish reversal and target 61.8% retracement at 1.3862 and above. However, rejection by 1.2555 will keep long term outlook neutral first, and raise the prospect of down trend resumption at a later stage.
USD/JPY Weekly Outlook
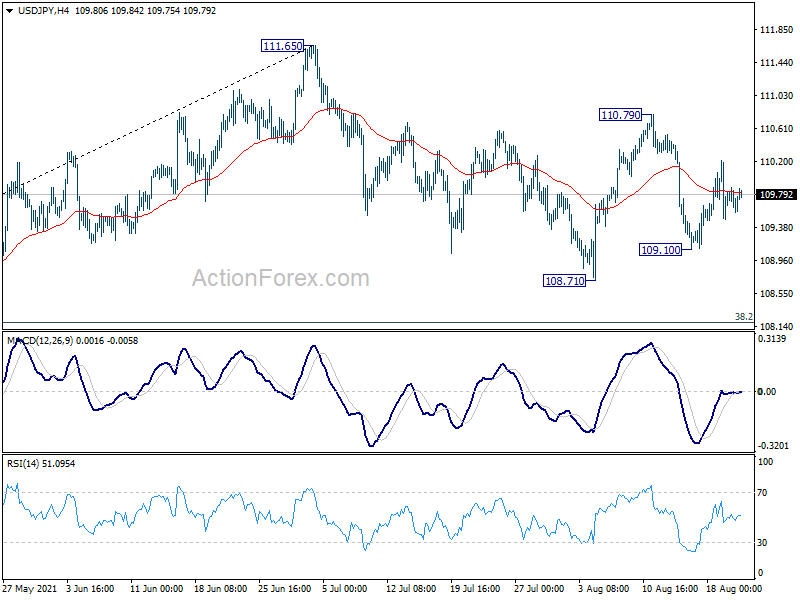
USD/JPY stayed in sideway trading last week and outlook is unchanged. Initial bias remains neutral this week first. On the upside, break of 110.79 will resume the rebound from 108.71 to retest 111.65 high. On the downside, break of 109.10 will target 108.71 support first. Firm break there will resume the decline from 111.65 and target 38.2% retracement of 102.58 to 111.65 at 108.18 next.
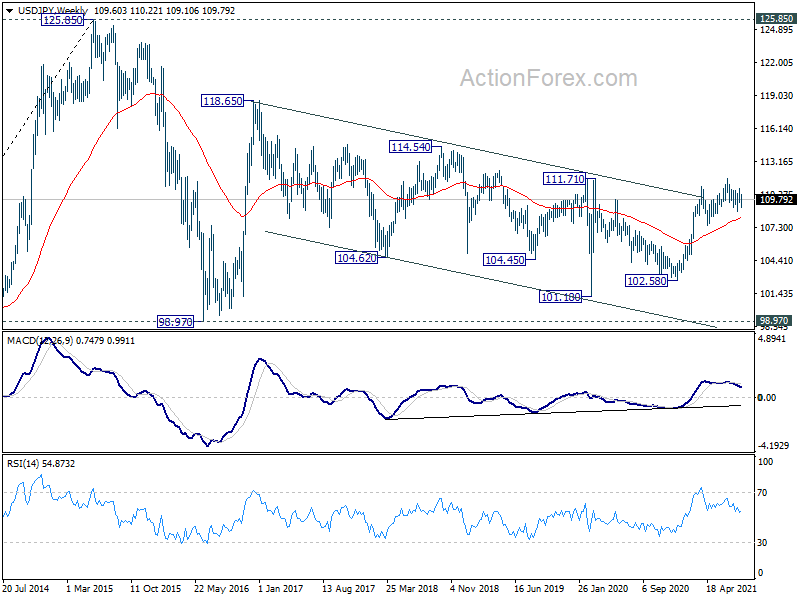
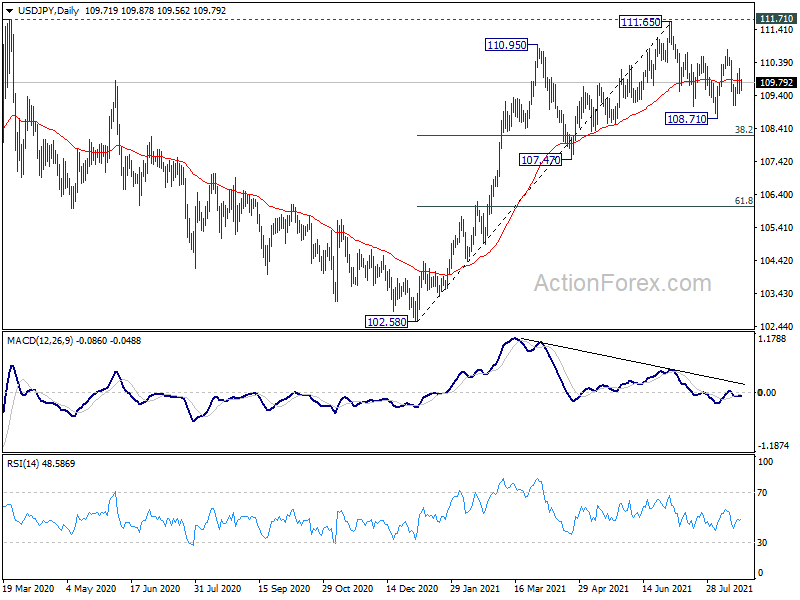
In the bigger picture, medium term outlook is staying neutral with 111.71 resistance intact. The pattern from 101.18 could still extend with another falling leg. Sustained trading below 55 day EMA will bring deeper fall to 107.47 support and below. Nevertheless, strong break of 111.71 resistance will confirm completion of the corrective decline from 118.65 (2016 high). Further rise should then be seen to 114.54 and then 118.65 resistance.
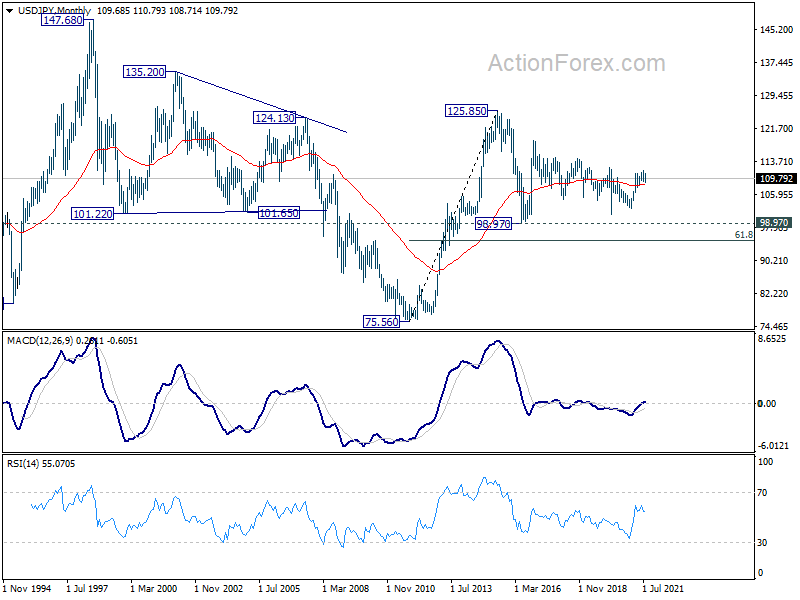
In the long term picture, the rise from 75.56 (2011 low) long term bottom to 125.85 (2015 high) is viewed as an impulsive move, no change in this view. Price actions from 125.85 are seen as a corrective pattern which could still extend. In case of deeper fall, downside should be contained by 61.8% retracement of 75.56 to 125.85 at 94.77. Up trend from 75.56 is expected to resume at a later stage for above 135.20/147.68 resistance zone.