

Sample Category Title
GBP/USD Weekly Outlook
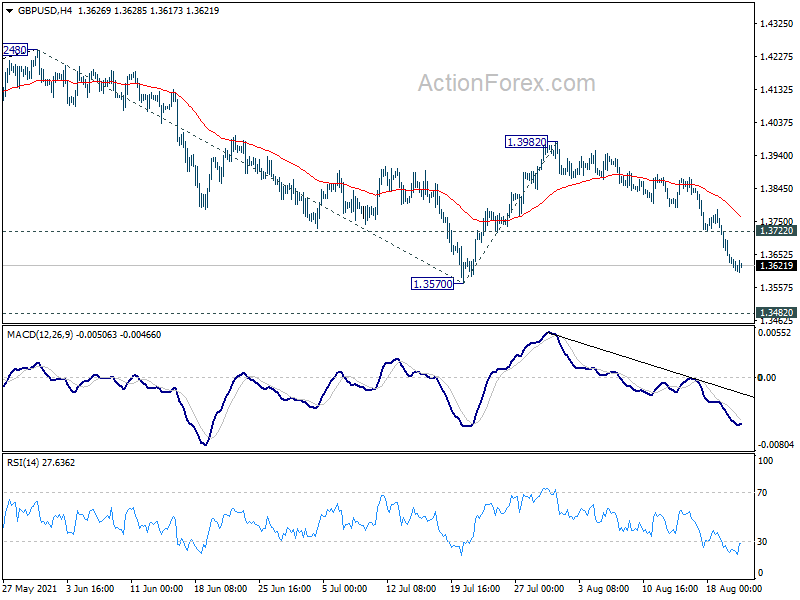
GBP/USD's fall from 1.3982 accelerated lower last week and the development suggests that rebound from 1.3570 has completed already. Initial bias stays on the downside this week for 1.3570 first. Firm break there will resume larger fall from 1.4248 to 1.3482 resistance turned support next. Break there will target 100% projection of 1.4248 to 1.3570 from 1.3982 at 1.3304. On the upside, above 1.3722 minor resistance will mix up the near term outlook and turn intraday bias neutral first.
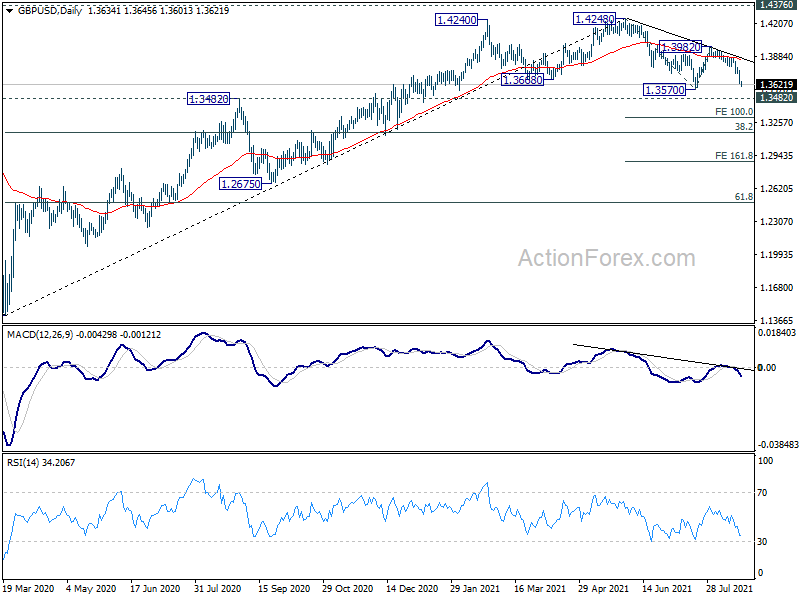
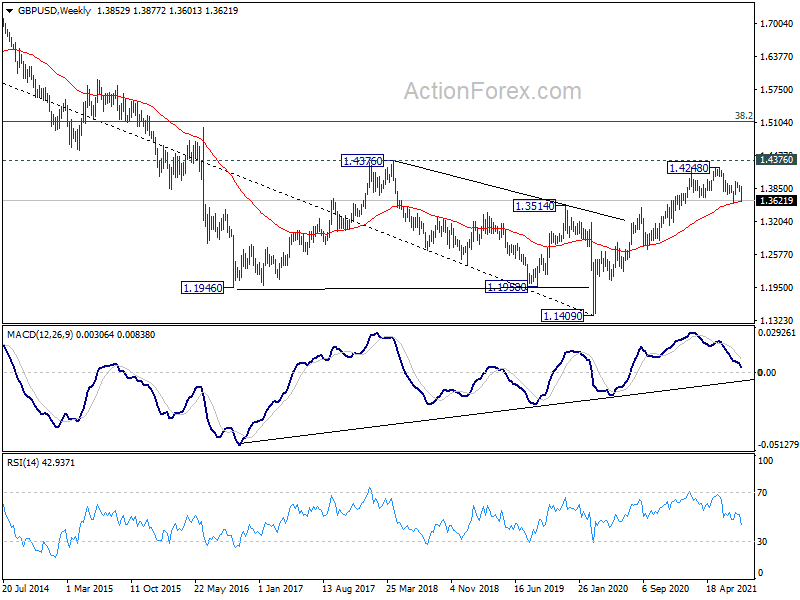
In the bigger picture, current development argues that rise from 1.1409 (2020 low) has completed at 1.4248, after failing 1.4376 resistance. Fall from there could either be correcting the rise form 1.1409, or starting another falling leg inside long term sideway pattern. In either case, sustained break of 1.3482 resistance turned support will target 38.2% retracement of 1.1409 to 1.4248 at 1.3164 first. Break there will pave the way to 61.8% retracement at 1.2493.
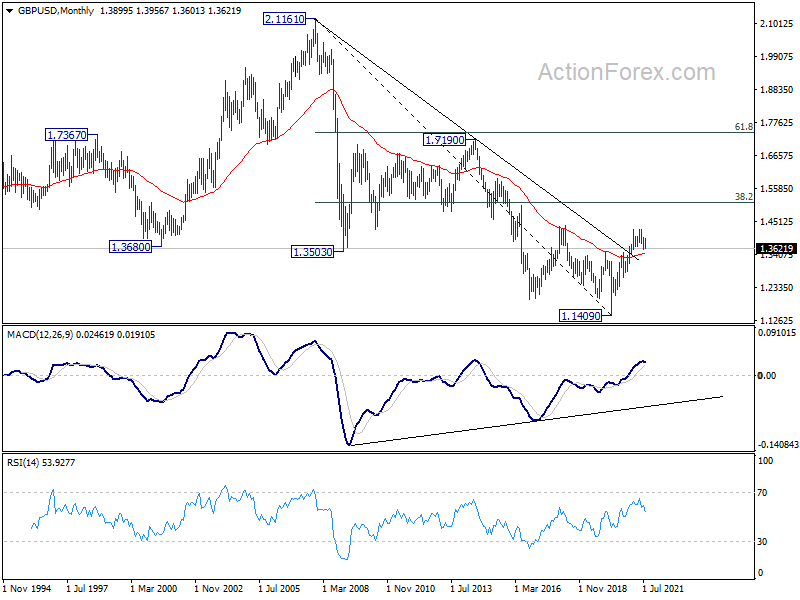
In the longer term picture, a long term bottom should be in place at 1.1409, on bullish convergence condition in monthly MACD. Rise from there would target 38.2% retracement of 2.1161 to 1.1409 at 1.5134. Reaction from there would reveal whether rise from 1.1409 is just a correction, or developing into a long term up trend.
USD/CHF Weekly Outlook
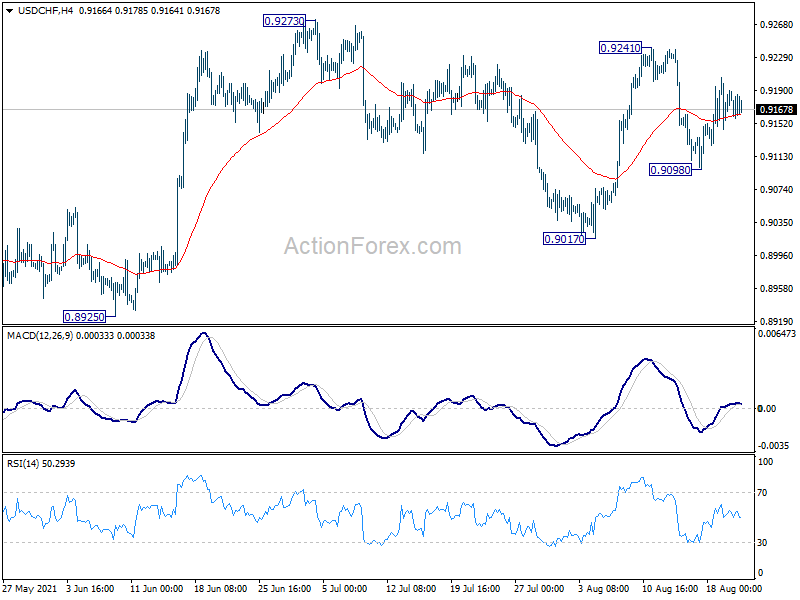
USD/CHF stayed in established range last week and near term outlook is mixed. Initial bias remains neutral this week first. On the upside, break of 0.9241 resistance should resume the rise from 0.8925 through 0.9273. On the downside, break of 0.9098 will target 0.9017 support first. Further break there will likely resume the decline from 0.9471 through 0.8925 low.
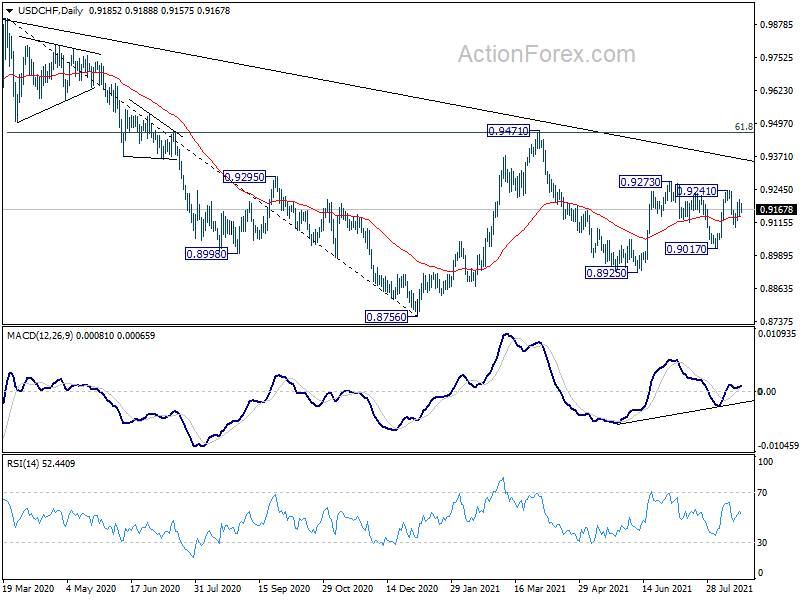
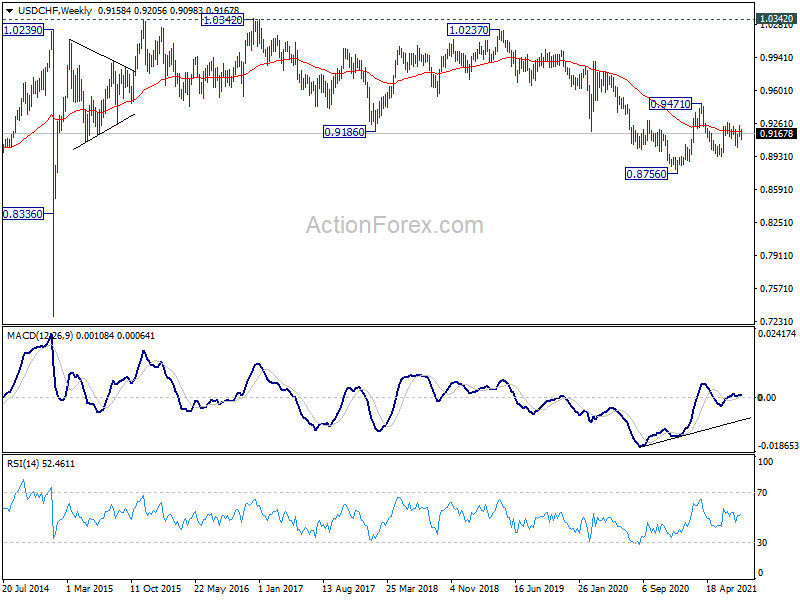
In the bigger picture, the failure to sustain above 55 week EMA (now at 0.9180) retains medium term bearishness in USD/CHF. Break of 0.8925 support should resume the whole decline form 1.0342 (2016 high) through 0.8756 low. However, break of 0.9273 resistance and sustained trading above 55 week EMA will be an early sign of bullish trend reversal. Focus will then turn to 0.9471 resistance for confirmation.
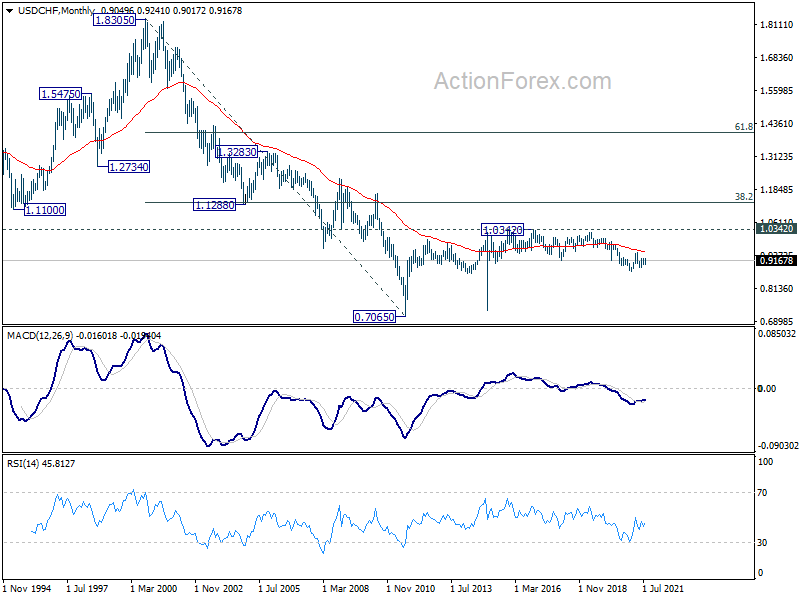
In the long term picture, price actions from 0.7065 (2011 low) are currently seen as developing into a long term corrective pattern, at least until a firm break of 1.0342 resistance.
AUD/USD Weekly Outlook
AUD/USD's decline from 0.8006 resumed last week and accelerated to as low as 0.7105. 161.8% projection of 0.8006 to 0.7530 from 0.7890 at 0.7120 was already met. While deeper fall might be seen, we'd look for strong support from 0.6991/7051 cluster support to bring rebound. On the upside break of 0.7288 support turned resistance will indicate short term bottoming, and turn bias back to the upside for stronger rebound.
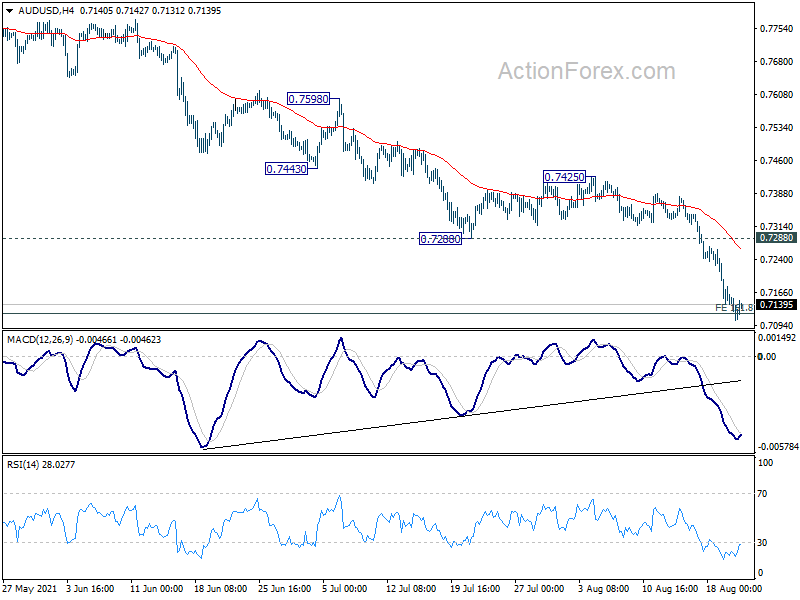
In the bigger picture, rise from 0.5506 medium term bottom could have completed at 0.8006, after failing 0.8135 key resistance. Correction from there could target 0.6991 cluster support (38.2% retracement of 0.5506 to 0.8006 at 0.7051). We'd look for strong support from there to bring rebound. However, sustained break of this level would argue that the whole medium term trend has indeed reversed. Deeper decline would be seen to 61.8% retracement at 0.6461.
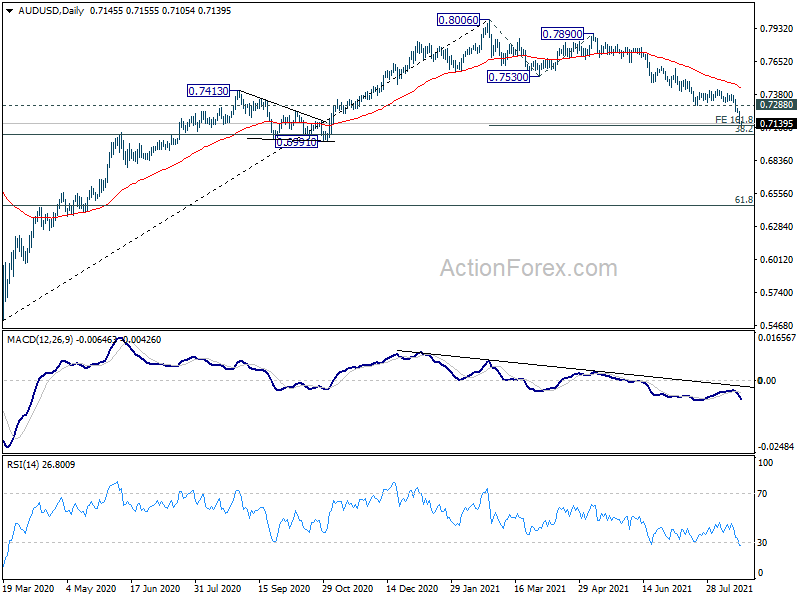
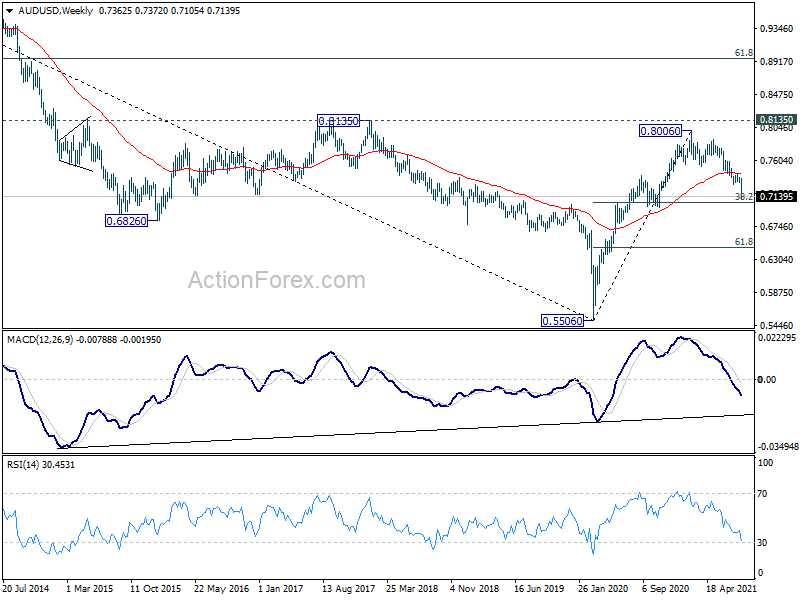
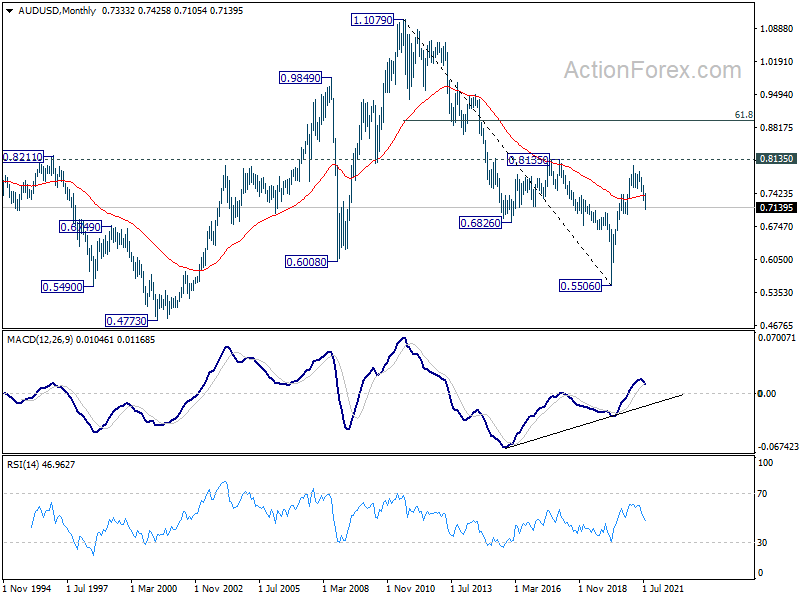
In the longer term picture, rise from 0.5506 could have completed at 0.8006. Subsequent fall is now seen as a correction only. As long as 0.6991 structural support holds, we'd expect another rise through 0.8006 at a later stage. However, sustained break of 0.6991 would argue that the trend has reversed and put 0.5506 low back into radar.
USD/CAD Weekly Outlook
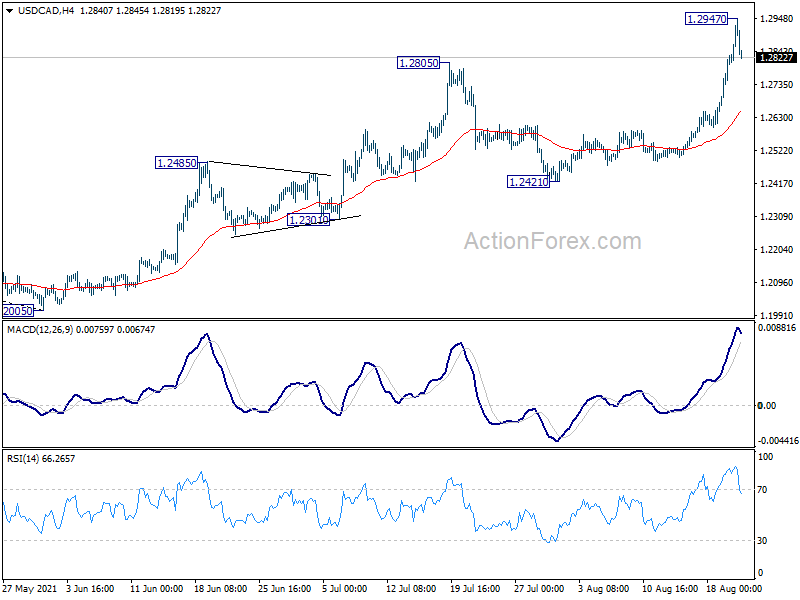
USD/CAD's rise form 1.2005 resumed last week and reached as high as 1.2947. As a temporary top was formed there. Initial bias is turned neutral this week first. Downside of retreat should be contained well above 1.2421 support to bring rise resumption. On the upside, above 1.2947 will target 1.3022 fibonacci level next.
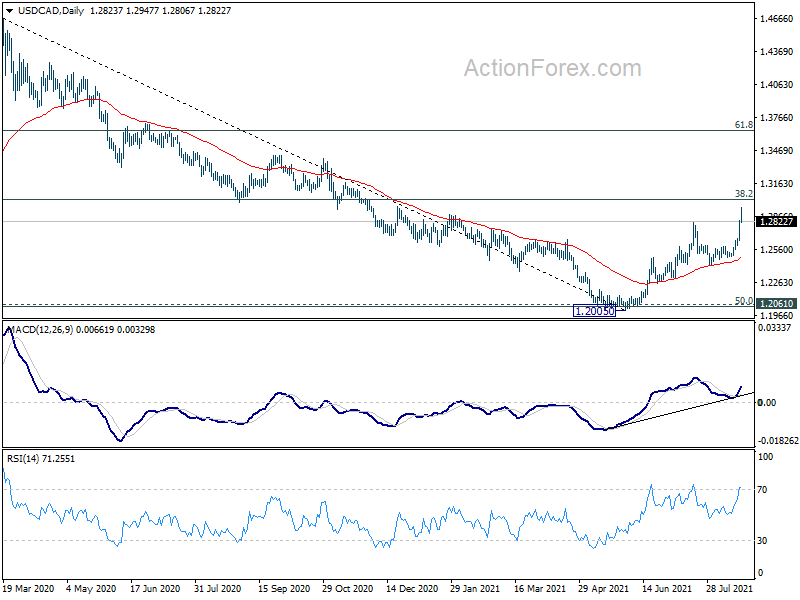
In the bigger picture, fall from 1.4667 is seen as the third leg of the corrective pattern from 1.4689 (2016 high). It should have completed after hitting 1.2061 (2017 low) and 50% retracement of 0.9406 to 1.4689 at 1.2048. Sustained break of 38.2% retracement of 1.4667 to 1.2005 at 1.3022 will pave the way to 61.8% retracement at 1.3650 and above. Overall, medium term outlook remains neutral at worst with 1.2048/61 support zone intact.
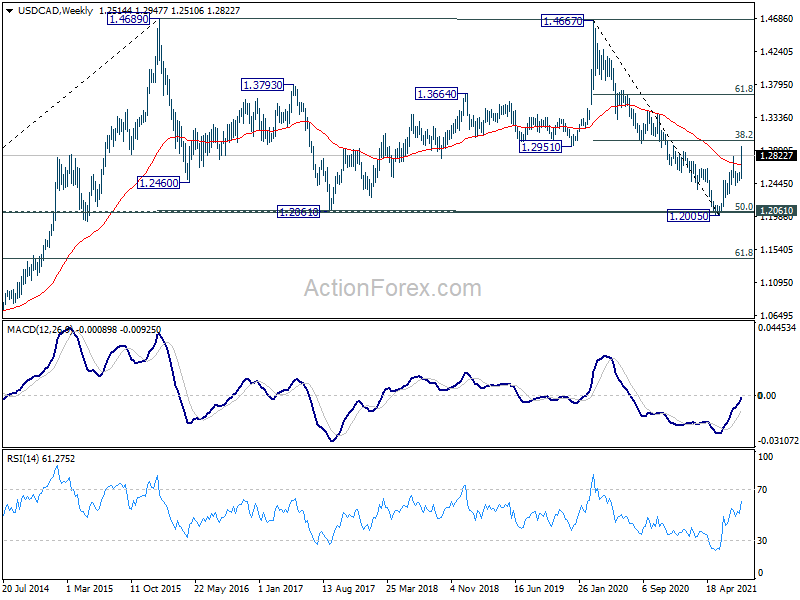
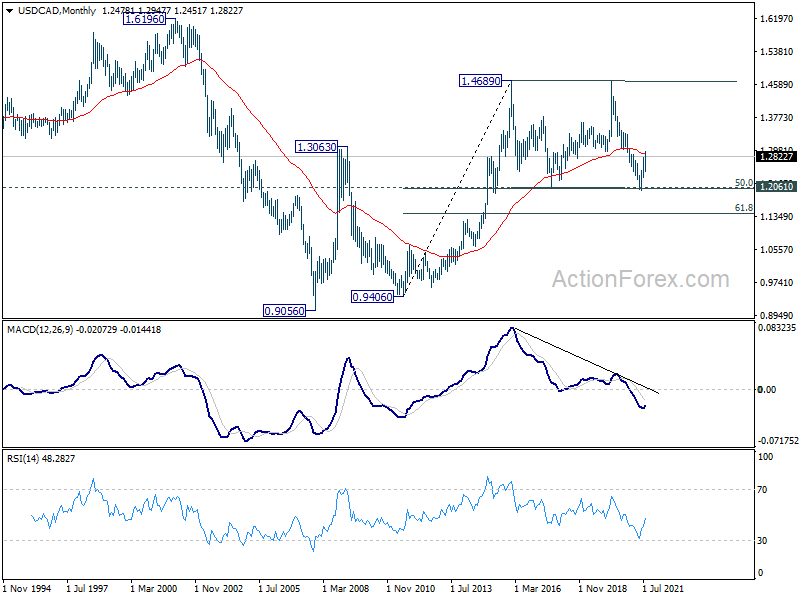
In the longer term picture, we're viewing price actions from 1.4689 as a consolidation pattern. Thus, up trend from 0.9506 (2007 low) is still expected to resume at a later stage. This will remain the favored case as long as 1.2061 support holds, which is close to 50% retracement of 0.9406 to 1.4689 at 1.2048. Firm break of 1.4689 will pave the way to 1.6196 high next.
GBP/JPY Weekly Outlook
GBP/JPY's break of 151.14 support last week suggests that rebound from 148.43 has completed. Initial bias stays on the downside this week for 148.43 support first. Decisive break there will carry larger bearish implication and target 143.78 fibonacci level next. On the upside, above 151.38 minor resistance will turn bias back to the upside for 153.42 resistance instead.
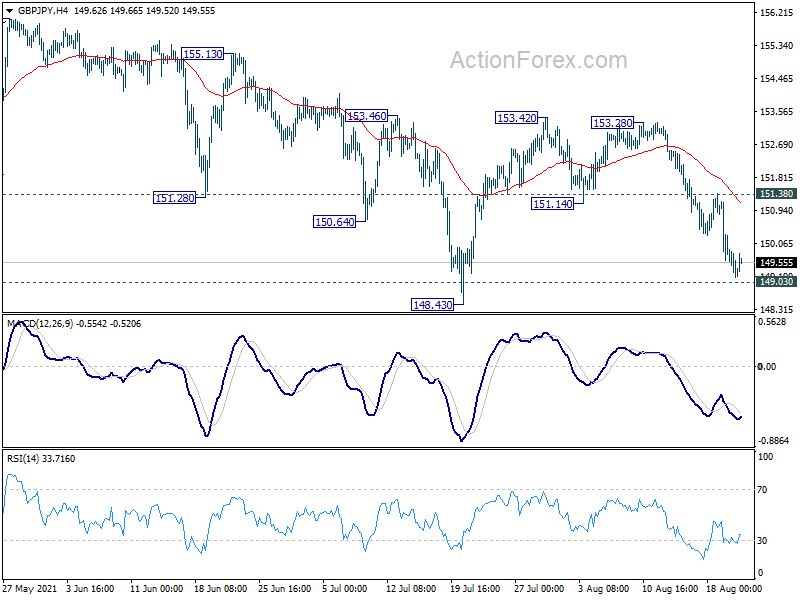
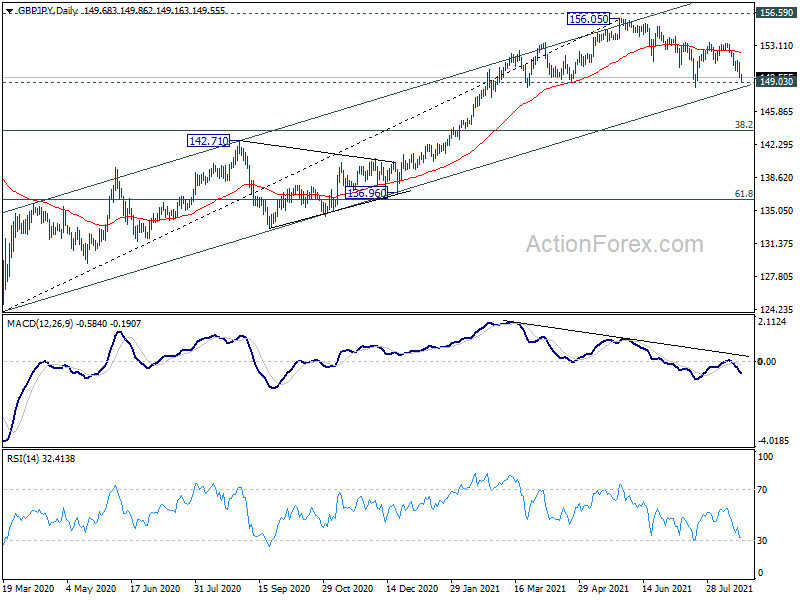
In the bigger picture, rise from 123.94 is seen as the third leg of the pattern from 122.75 (2016 low). As long as 149.03 support holds, such rise would still resume at a later stage. However, sustained break of 149.03 support will indicate rejection by 156.59. Fall from 156.05 would be at least correcting the whole rise from 123.94. Deeper fall would be seen back 38.2% retracement of 123.94 to 156.05 at 143.78 first.
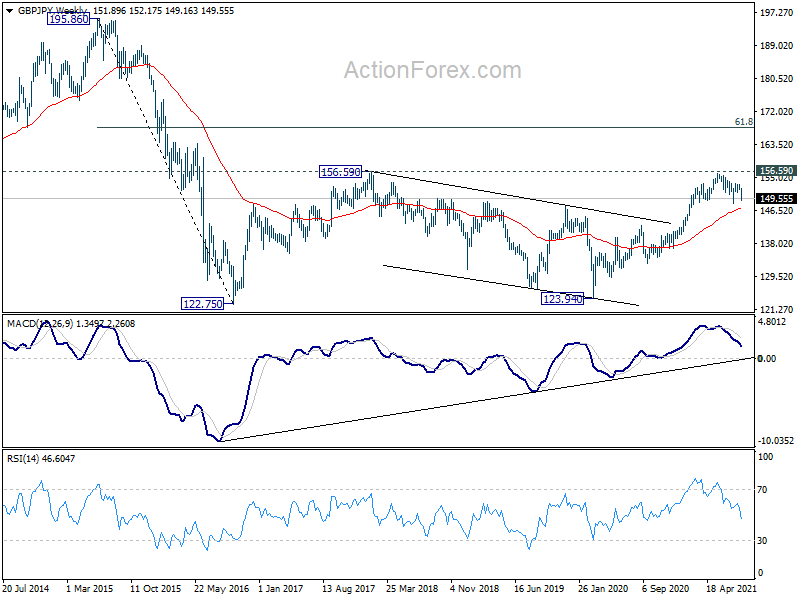
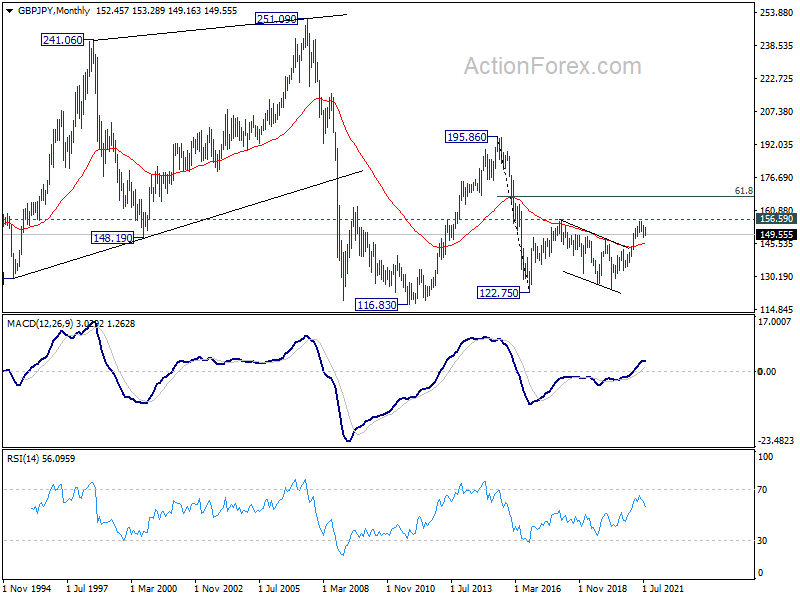
In the longer term picture, the strong break of 55 months EMA was an early sign of long term bullish reversal. Firm break of 156.69 resistance should now confirm the start of an up trend for 195.86 (2015 high). However, rejection by 156.69 will invalidate the bullish signal and keep long term outlook neutral first.
EUR/JPY Weekly Outlook
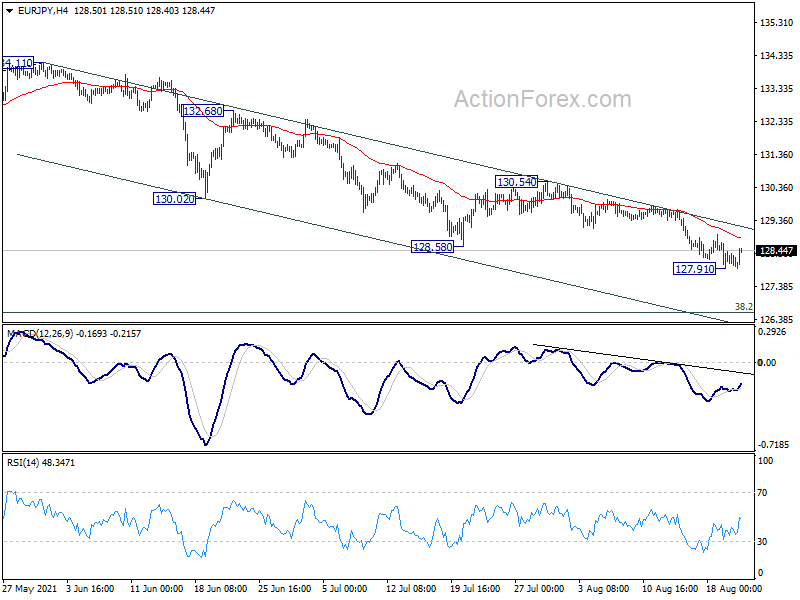
EUR/JPY's fall from 134.11 resumed last week and edged lower to 127.91. But a temporary low was formed there, and initial bias is turned neutral this week for some consolidations. Near term outlook will stay bearish as long as 130.54 resistance holds. On the downside, break of 127.91 will target 127.07 resistance turned support. That is close to 38.2% retracement of 114.42 to 134.11 at 126.58.
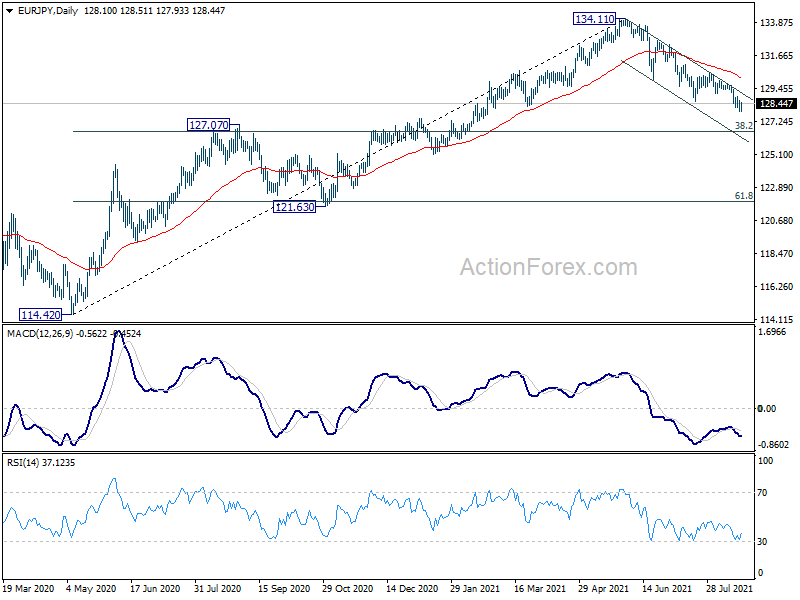
In the bigger picture, rise from 114.42 is seen as a medium term rising leg inside a long term sideway pattern. As long as 127.07 resistance turned support holds, further rise is still expected to retest 137.49 (2018 high). However, firm break of 127.07 will argue that the medium term trend has reversed, deeper fall would be seen to 61.8% retracement of 114.42 to 134.11 at 121.94.
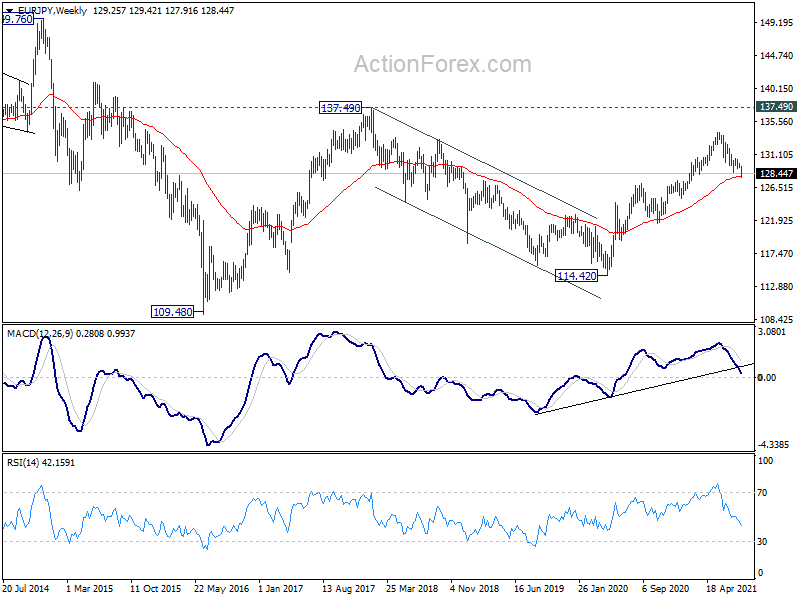
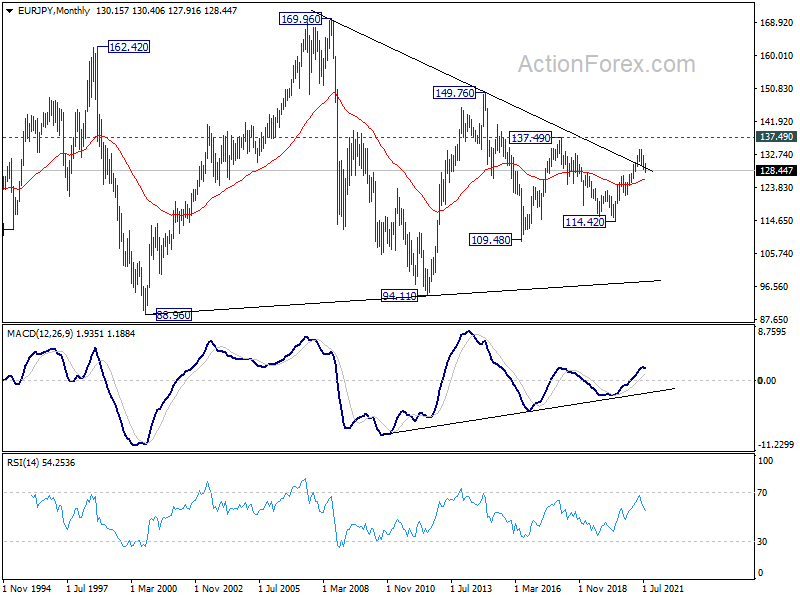
In the long term picture, EUR/JPY is staying in long term sideway pattern, established since 2000. Another rising leg in progress for 137.49 resistance and above.
EUR/GBP Weekly Outlook
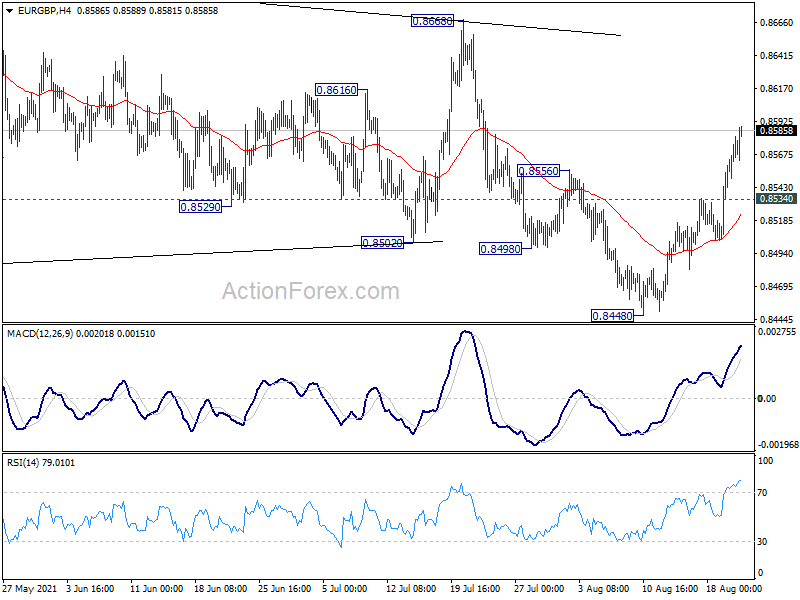
EUR/GBP's rebound from 0.8448 extended sharply higher last week. The development suggests that fall from 0.8668 has completed already. Initial bias stays on the upside this week for retesting 0.8668 first. Firm break there will be a strong sign of near term bullish reversal at least. On the downside, break of 0.8534 resistance turned support will mix up the near term outlook again and turn intraday bias neutral first.
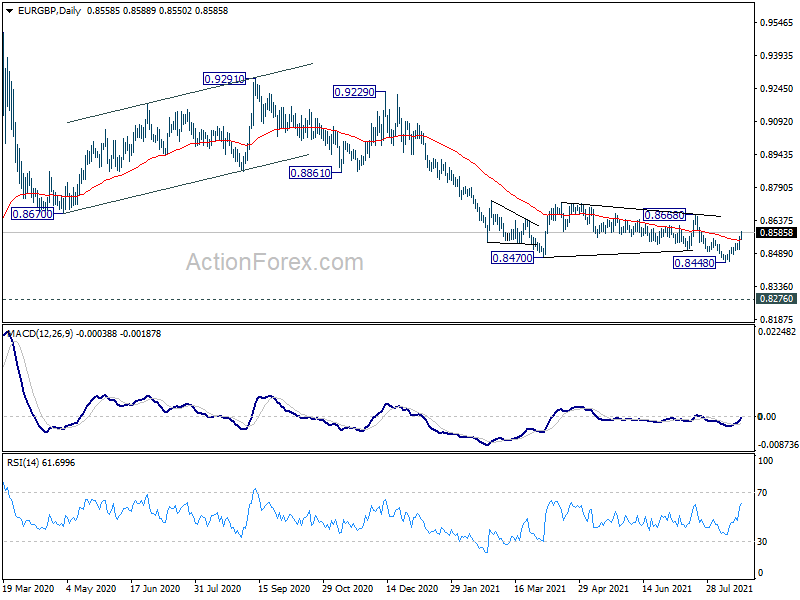
In the bigger picture, price actions from 0.9499 (2020 high) are still seen as developing into a corrective pattern. Deeper fall could be seen as long as 0.8668 resistance holds, towards long term support at 0.8276. However, firm break of 0.8668 resistance would argue that a medium term bottom was already formed. Stronger rise would be seen to 0.8861 support turned resistance to confirm completion of the corrective pattern.
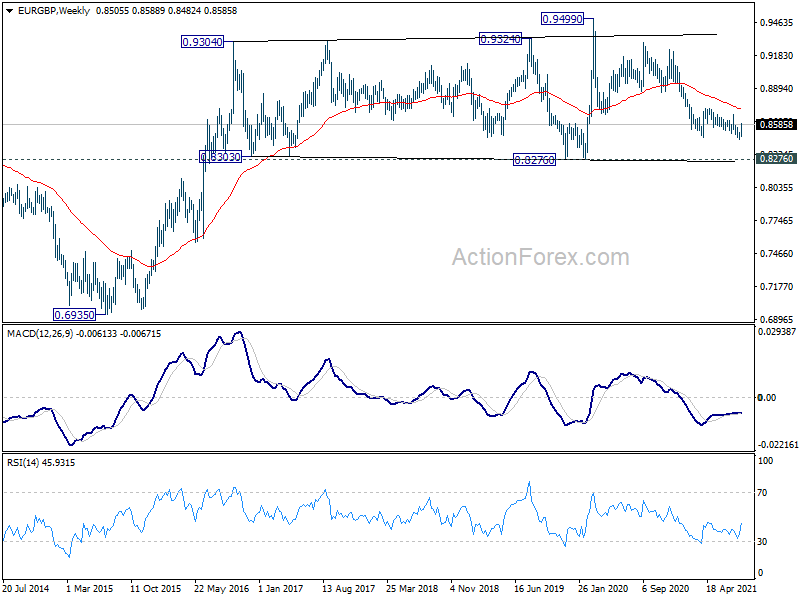
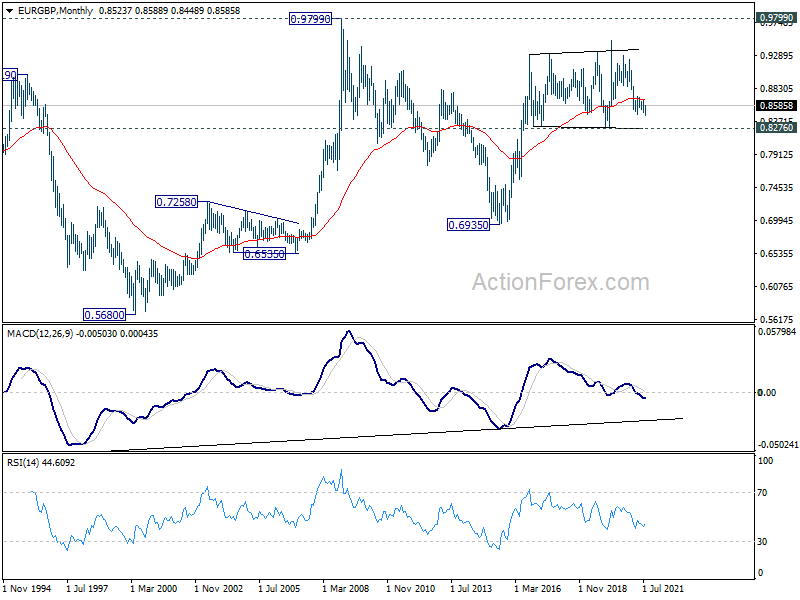
In the long term picture, outlook will stay bullish as long as 0.8276 support holds. Break of 0.9499 is in favor at a later stage, to resume the up trend from 0.6935 (2015 low).
EUR/AUD Weekly Outlook
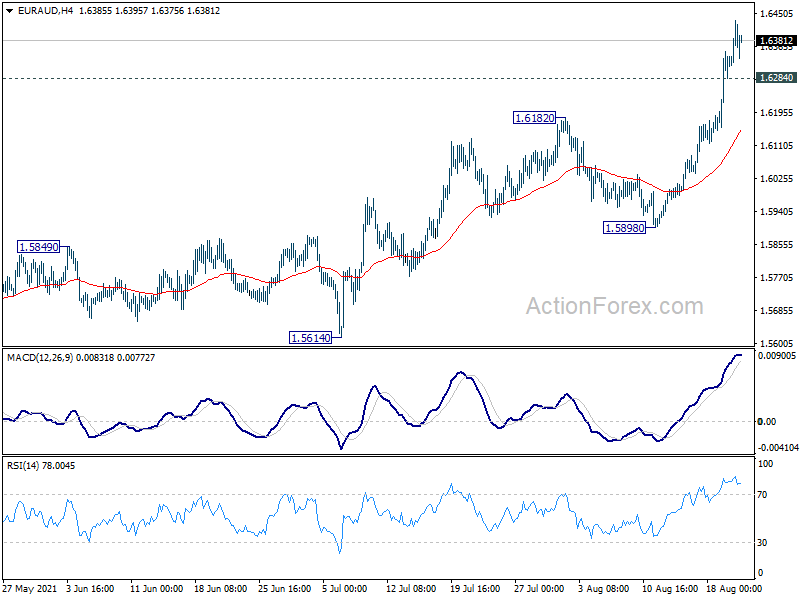
EUR/AUD's strong break of 1.6182 resistance last week confirmed resumption of whole rise from 1.5250. Initial bias stays on the upside this week for 1.6827 resistance next. On the downside, below 1.6284 minor support will turn intraday bias neutral and bring consolidations first. But outlook will stay bullish as long as 1.5898 support holds, in case of retreat.
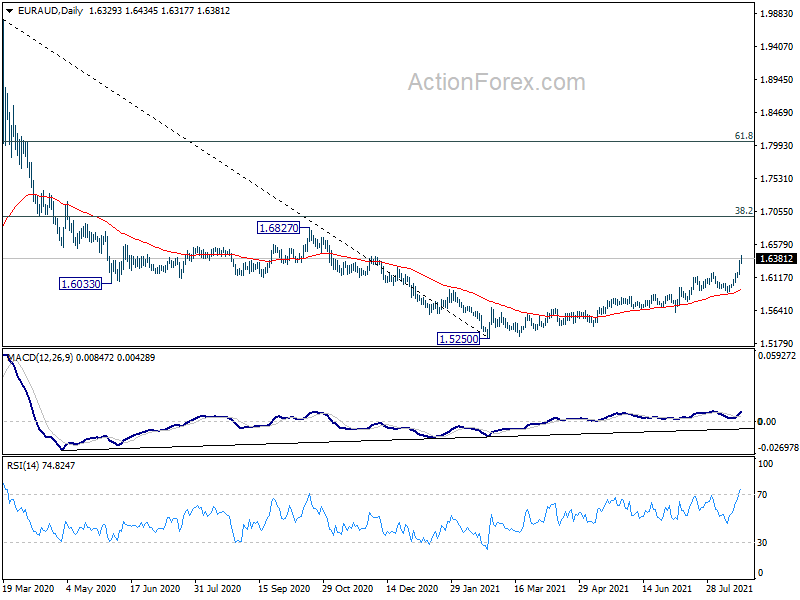
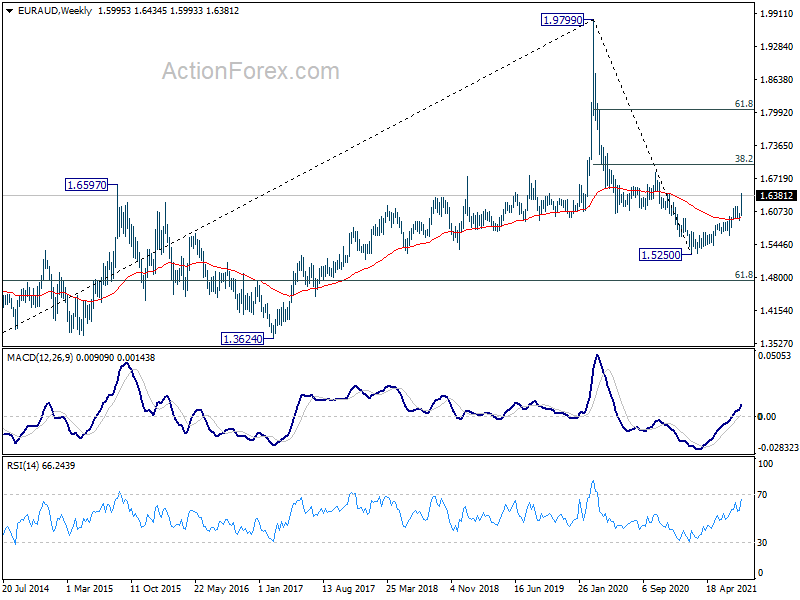
In the bigger picture, rise from 1.5250 medium term bottom is currently seen as a correction to the down trend from 1.9799 first. Stronger rise would be seen to 38.2% retracement of 1.9799 to 1.5250 at 1.6988 next. We'd tentatively expect strong resistance from there to limit upside, at least on first attempt. Meanwhile, break of 1.5898 support will indicate that the rebound has completed and bring retest of 1.5250 low.
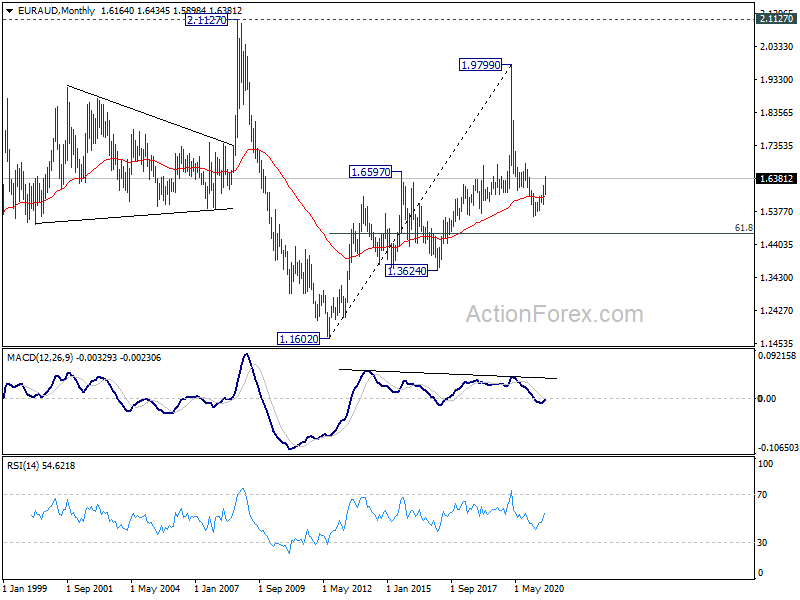
In the longer term picture, rise from 1.1602 (2012 low) should have already completed with three waves up to 1.9799 (2020 high). Fall from there is seen as a medium term to long term down leg as a long term down trend, or a sideway pattern. We'll assess the odds again at a later stage.
EUR/CHF Weekly Outlook
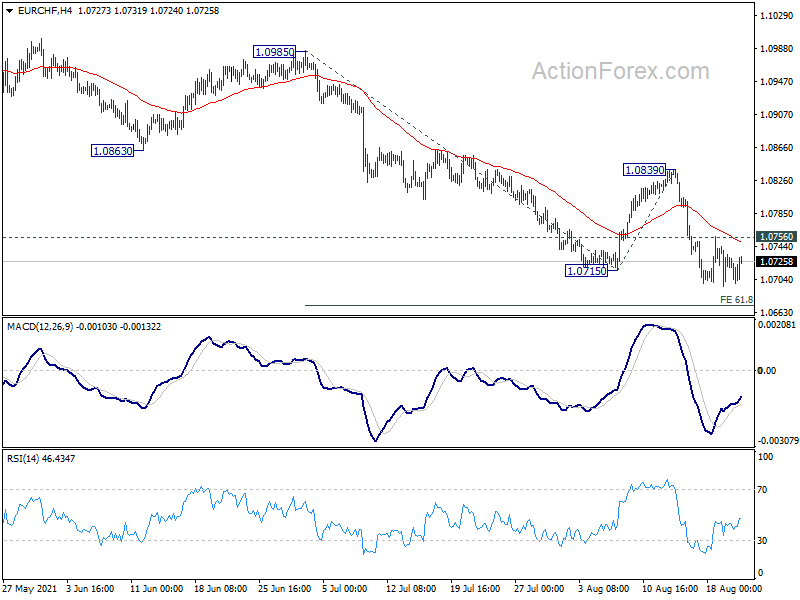
EUR/CHF's break of 1.0715 support last week suggests resumption of whole decline from 1.1149. While downside momentum is a bit week, initial bias stays on the downside this week first. next target is 61.8% projection of 1.0985 to 1.0715 from 1.0839 at 1.0672 first. Break will target 100% projection at 1.0569 next. On the upside, above 1.0756 minor resistance will bring recovery. But outlook will remain bearish as long as 1.0839 resistance holds.
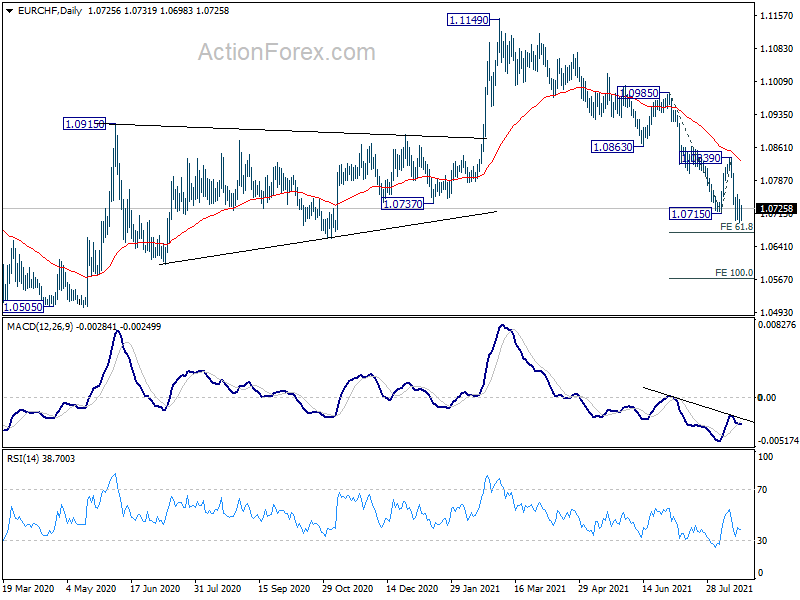
In the bigger picture, rebound from 1.0505 (2020 low) should have completed at 1.1149 already. The three-wave corrective structure argues that the downtrend from 1.2004 (2018 high) is not over yet. Medium term outlook will now stay bearish as long as 55 week EMA (now at 1.0863) holds. Break of 1.0505 low would be seen at a later stage.
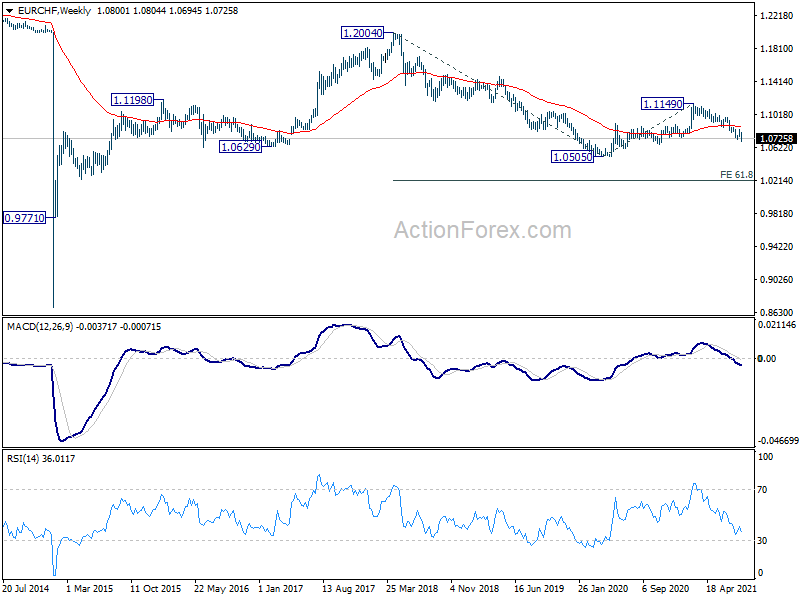
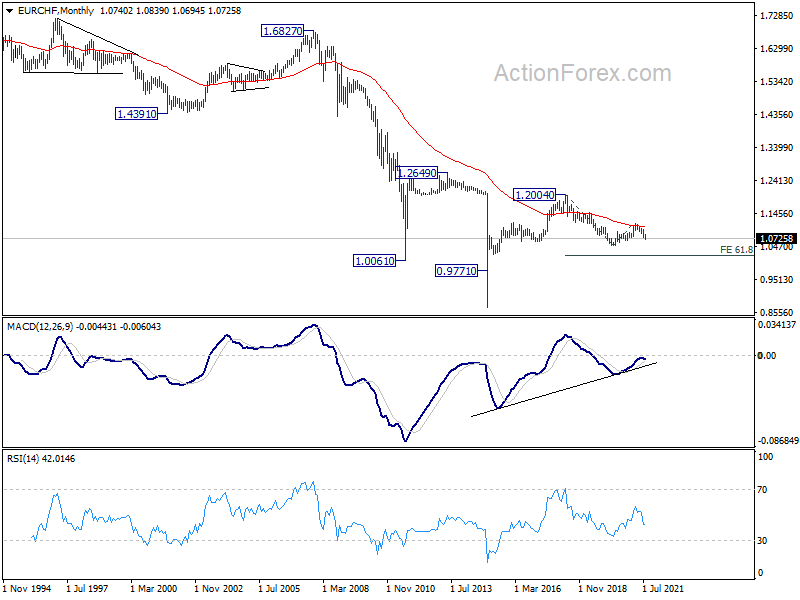
In the long term picture, rejection by 55 month EMA (now at 1.1056) retains long term bearishness. Break of 1.0505 low will resume down trend to 61.8% projection of 1.2004 to 1.0505 to 1.1149 at 1.0223.
Sentiments Deteriorated on Delta, China and Fed Tapering
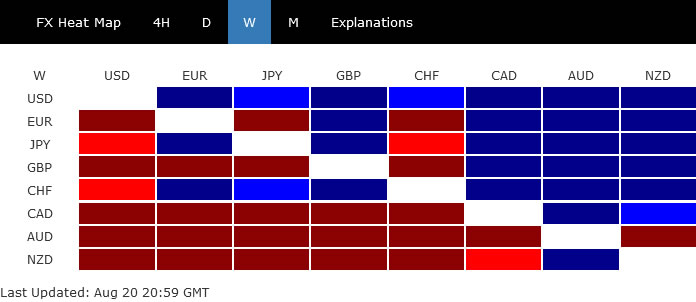
Overall market sentiments deteriorated notably last week, with concerns over the swift spread of Delta variant and return to lockdowns, Fed's tapering and slowdown in China. A softening tone from a Fed hawk on tapering gave sentiment a late lift, but it remained to bee seen if that could last. Dollar ended as the strongest one, followed by Swiss Franc and Yen. But the three winners were actually very close with respect pairs staying in range only.
On the other hand, commodity currencies were under extremely heavy selling. Aussie was the worst as pressured by free fall in iron ore price and tougher pandemic restrictions. Kiwi followed as RBNZ changed their mind by keeping interest rate unchanged, as New Zealand returned to lockdown too. Canadian Dollar was dragged by extended correction in oil price. Jackson Hole Symposium is unlikely to be inspiration this week. Focus will remain on the virus, as well as overall risk market developments.
US stocks resilient as Fed hawks could adjust their tapering plan
US stocks displayed a lot of resilience last week as major indexes struck a sizeable rebound after initial selloff. On the one hand, the spread of Delta variant prompted some worries that the economic impact is going to last longer. Yet, sentiment was somewhat lifted as a known hawk in Fed indicated that he could be changing his mind on the timing of tapering.
Dallas Fed President Rob Kaplan had been clear that he'd prefer announcing the plan in September and then start tapering in October. But on Friday, he said he's "watching very carefully" how the Delta would impact the economy, and he'd ready to "adjust" his views on policy somewhat. It's not getting even more unlikely for Fed chair Jerome Powell to indicate anything concrete regarding tapering in the Jackson Hole Symposium this week. Indeed, we might hear more Fed hawks turning cautious if the situation worsen.
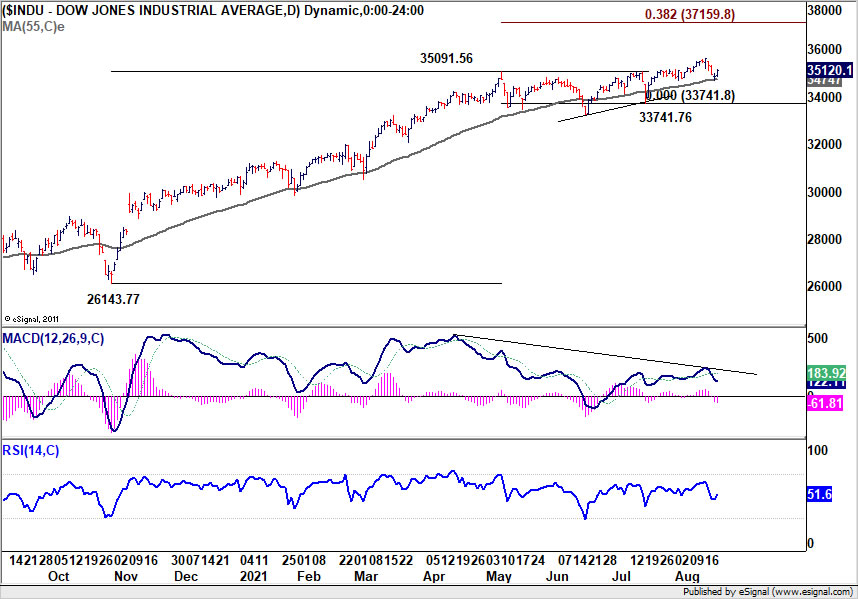
DOW recovered after hitting as low as 34690.3 and drew support from 55 day EMA, to close at 35120.1. Upside momentum weakened apparently as seen in daily MACD. Yet, there is no confirmed topping yet. The up trend is still in favor to extend to 61.8% projection of 26143.77 to 35091.56 at 37159.80. However, considering the possibility of bearish divergence condition in daily MACD, sustained trading below the 55 day EMA would raise the chance of a medium term correction, and turn focus to 33741.76 support for confirmation.
Nikkei and HSI broke support level as Asian outlook worsen
The picture in Asia, however, is much worse. Infections in Japan skyrocketed after the Olympics even though death tolls remained relatively low. Seven more prefectures declared state of emergency last week while the National Governors' Association urged the government to imposing stricter lockdown.
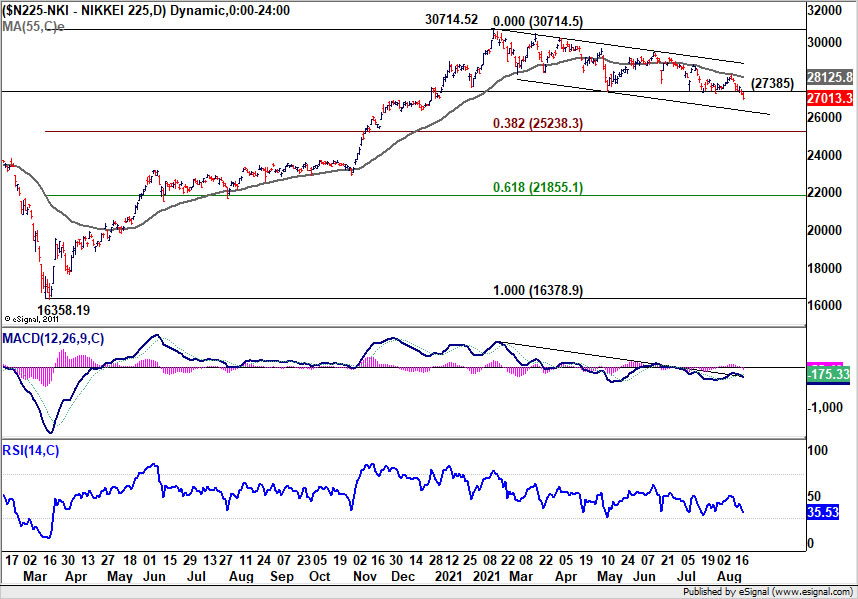
Nikkei dropped through a key support level at 37385 finally, resuming the choppy fall form 30714.52. Such decline should be correcting the whole up trend from 16378.9. A main point to watch is whether there would be downside acceleration through falling channel support. But still, deeper decline to 38.2% retracement of 16378.9 to 30714.52 at 25238.3 is likely before the correction completes.
The set of data released from China last week also triggered some concerns over a serious slowdown in the second half. The aftermath of the massive flood in central Henan province is not reflected in the data yet. Additionally, return of the coronavirus to the country could drag the economy down. At the same time, the grip on sectors like tech, gaming, private eduction and real estate continued to tighten. It's uncertain who would be the next target.
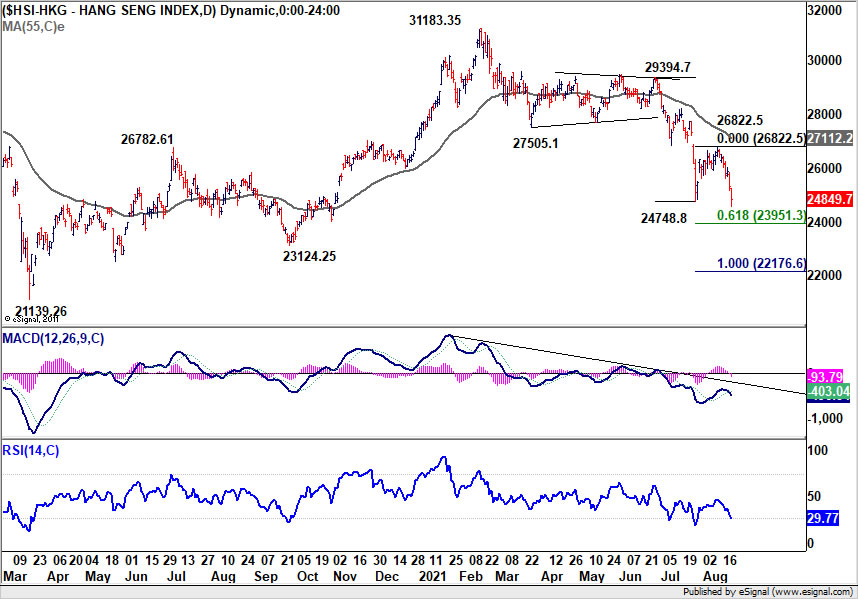
Hong Kong HSI broke near term support at 24748.8 last week, as the decline from 31183.35 resumed. The downside momentum suggests that more fall should be seen at least for the near term. Key level is indeed on 61.8% projection of 29394.7 to 24748.8 at 23951.3, which is close to 24k handle. Sustained break there could bring even deeper selloff to 100% projection to 21139.2 long term support (2020 low).
Aussie weighed down further by free falling iron ore
Talking about China, iron ore prices's free fall continued last week on concerns over the decline in the country's demand. The contraction was seen as a result of renewed pandemic restrictions, as well as weaker conditions in the property and infrastructure, which leads to reduced steel output cuts in the second half. Also, the China Iron an Steel Association has proposed limiting steel exports and cutting shipments of lower-grade products.
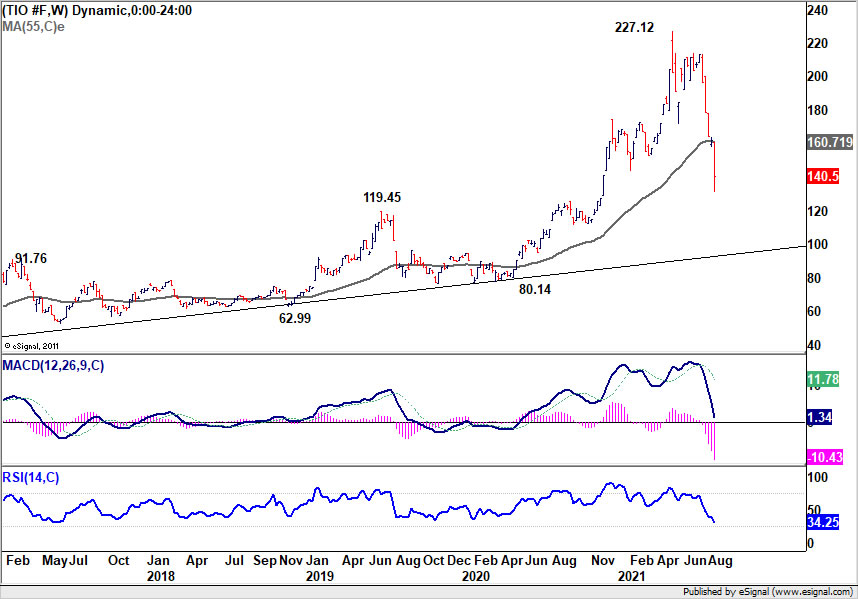
The fall in iron ore price put additional weight on Aussie, which was already pressured by return to tough lockdowns and spread of Delta. It's getting more inevitable for RBA to delay tapering of asset purchases from the September schedule. Or, if situation in New South Wales worsens, RBA could indeed reverse and raise the target of asset purchases.
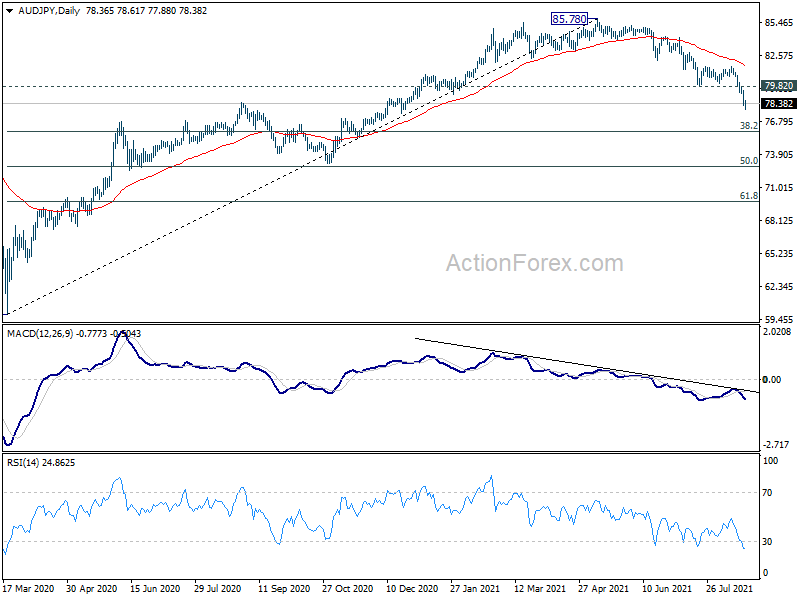
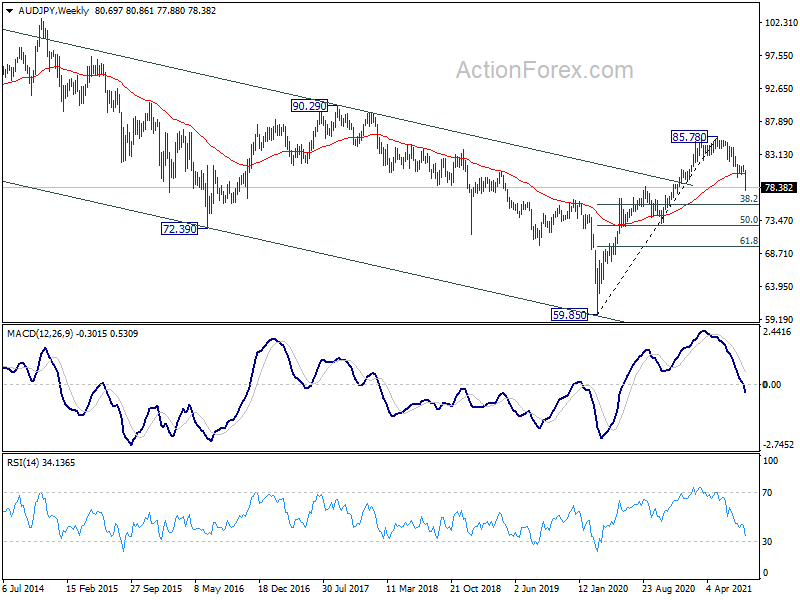
AUD/JPY's fall from 85.78 resumed last week, and dived through 55 week EMA, hitting as low as 77.88. Such decline is seen as correcting whole up trend from 59.85. It a bit early to predict the eventual depth of the correction. But we'd look for support from 38.2% retracement of 59.85 to 85.78 at 75.87 to bring rebound, at least on first attempt. Nevertheless, firm break of 79.82 support turned resistance is needed to be the first sign of bottoming, or near term outlook will stay bearish for now.
CAD/JPY completing head and shoulder top as oil price drags
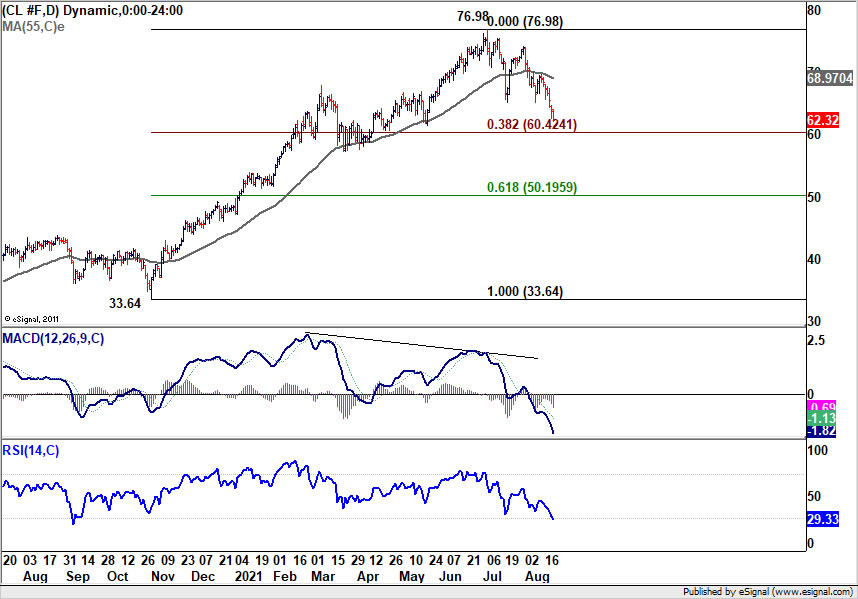
Meanwhile, Canadian Dollar was also dragged down by extended selloff in oil price. The decline is WTI crude oil was not unexpected, as corrective pattern from 76.89 extended. While further fall is in favor, we'd tentatively look for strong support from 38.2% retracement of 33.64 to 76.98 at 60.42 (i.e., close to 60 handle) to contain downside to bring rebound. However, sustained break there would probably bring even deeper correction to 61.8% retracement at 50.19, which is close to 50 handle.
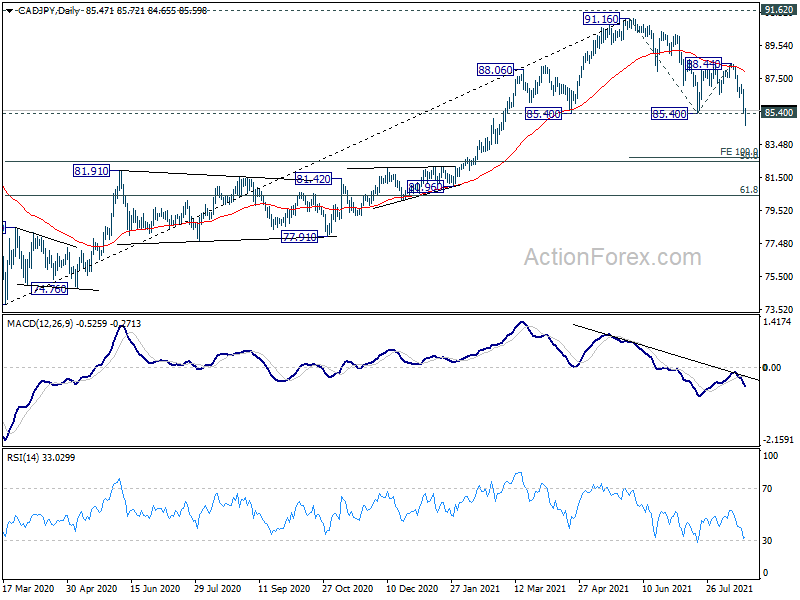
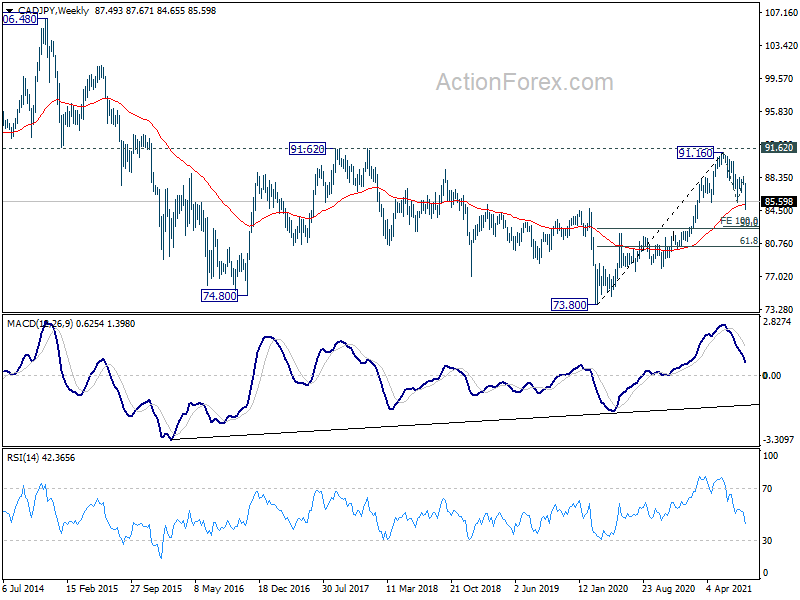
CAD/JPY dropped to as low as 84.65 last week, but quickly recovered to close slightly above 85.40 support at 85.60. It remains to be confirmed if the head and shoulder top pattern (ls: 88.06, h: 91.16, rs: 88.44) has completed. The coming days will be crucial. Sustained trading below 85.40 will extend the fall from 91.16 to 100% projection of 91.16 to 85.40 from 88.44 at 82.68. That is close to 50 % retracement of 73.80 to 91.16 at 82.48.
Dollar index resumed rally, target 94.46 fibonacci resistance
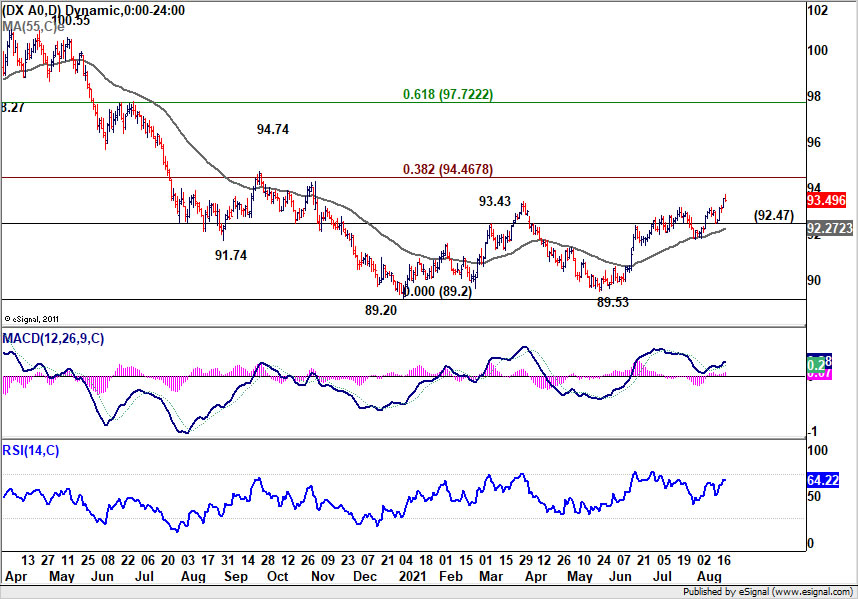
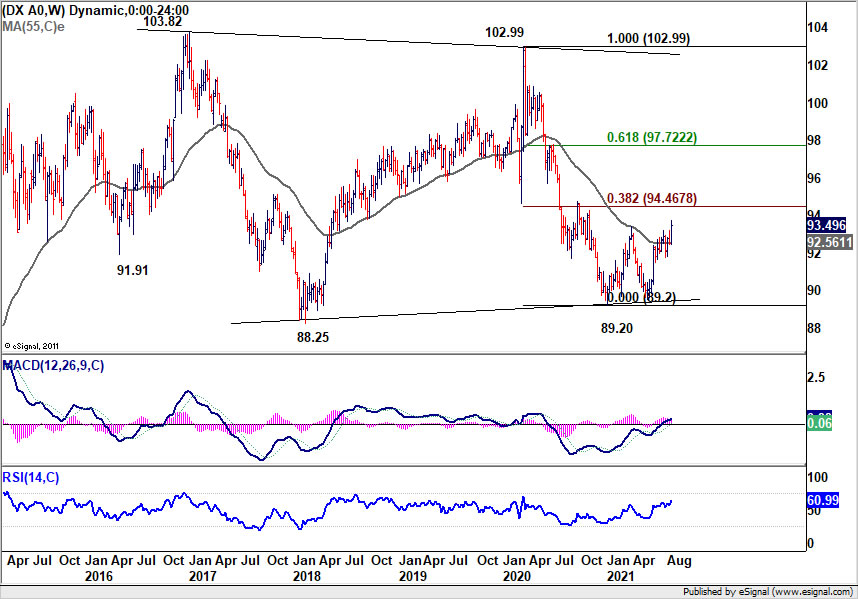
Back to the greenback, Dollar index resumed the rise from 89.53 last week and hit as high as 93.72, before closing at 93.49. Near term outlook will stay bullish as long as 92.47 support holds. Next target is 38.2% retracement of 102.99 to 89.20 at 94.46.
The fibonacci level at 94.46 will be important to determine the underlying trend. Strong break there would indicate that DXY is already in a medium term up trend, that would extend through 61.8% retracement at 97.72. However, failure there and (early) break of 92.47 support could bring another attempt below 90 handle before taking a committed direction.
USD/CHF Weekly Outlook
USD/CHF stayed in established range last week and near term outlook is mixed. Initial bias remains neutral this week first. On the upside, break of 0.9241 resistance should resume the rise from 0.8925 through 0.9273. On the downside, break of 0.9098 will target 0.9017 support first. Further break there will likely resume the decline from 0.9471 through 0.8925 low.
In the bigger picture, the failure to sustain above 55 week EMA (now at 0.9180) retains medium term bearishness in USD/CHF. Break of 0.8925 support should resume the whole decline form 1.0342 (2016 high) through 0.8756 low. However, break of 0.9273 resistance and sustained trading above 55 week EMA will be an early sign of bullish trend reversal. Focus will then turn to 0.9471 resistance for confirmation.
In the long term picture, price actions from 0.7065 (2011 low) are currently seen as developing into a long term corrective pattern, at least until a firm break of 1.0342 resistance.