Sample Category Title
GBP/USD Weekly Outlook
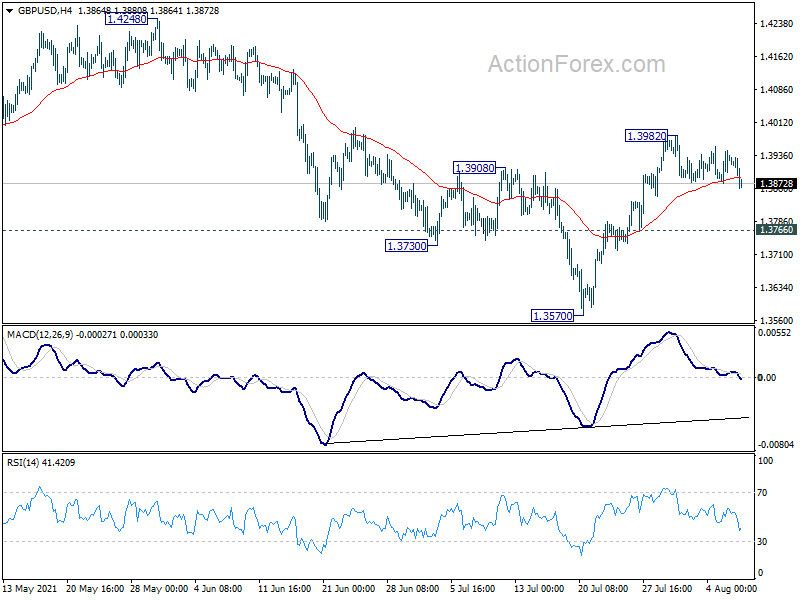
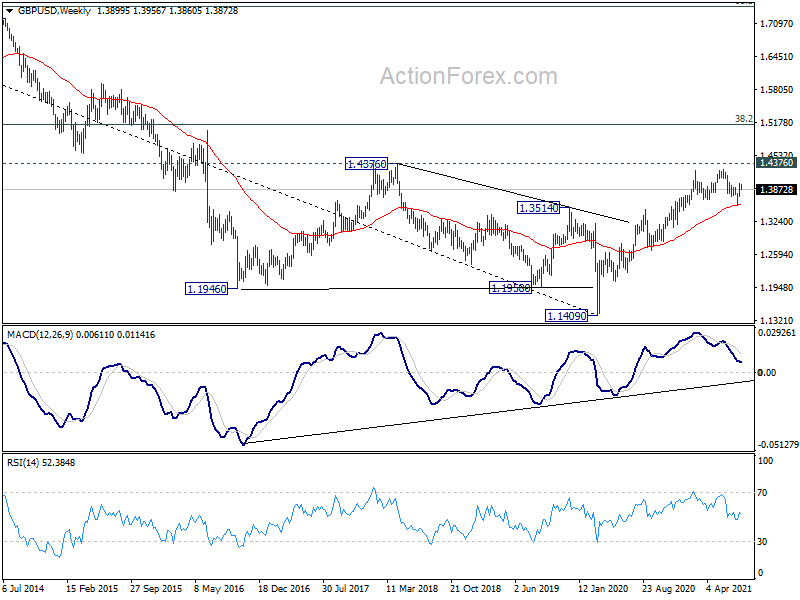
GBP/USD stayed in consolidation below 1.3982 last week and outlook is unchanged. Initial bias remains neutral this week first. Further rise is expected as long as 1.3766 support holds. Corrective pattern from 1.4240 could have completed with three waves down to 1.3570. On the upside, break of 1.3982 will resume the rise from 1.3570 to retest 1.4248 high. However, break of 1.3766 support will dampen this bullish view and bring retest of 1.3570.
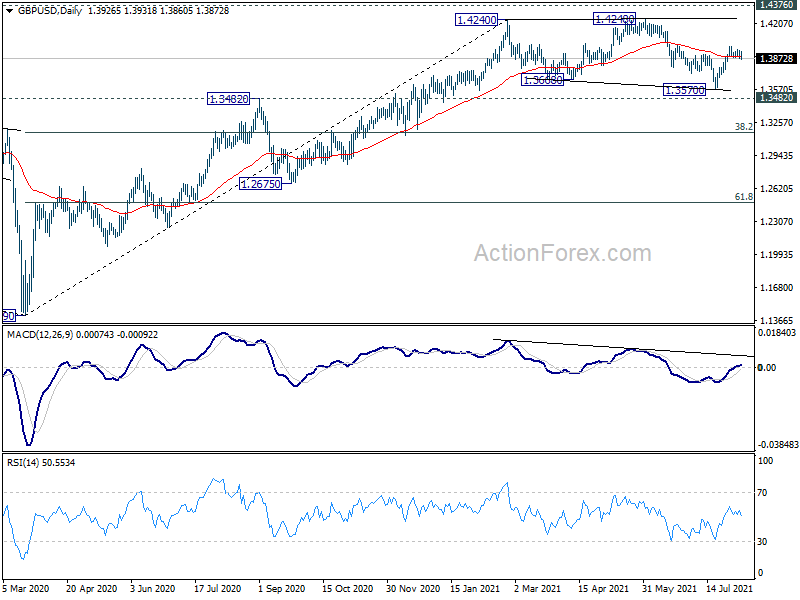
In the bigger picture, as long as 1.3482 resistance turned support holds, up trend from 1.1409 should still continue. Decisive break of 1.4376 resistance will carry larger bullish implications. However, firm break of 1.3482 support will argue that the rise from 1.1409 has completed. GBP/USD would then be seen in another leg of long term range pattern between 1.1409 and 1.4376. Deeper fall could then be seen to 61.8% retracement of 1.1409 to 1.4248 at 1.2493, and even below.
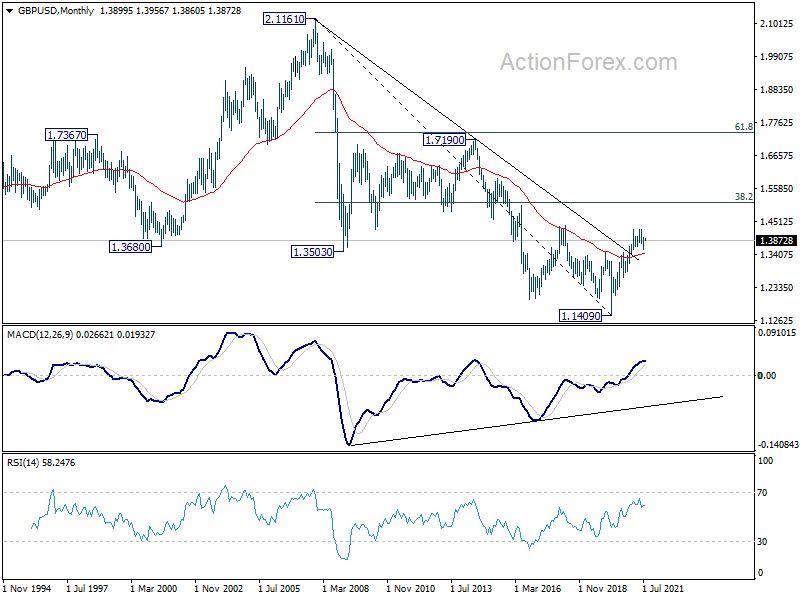
In the longer term picture, a long term bottom should be in place at 1.1409, on bullish convergence condition in monthly MACD. Rise from there would target 38.2% retracement of 2.1161 to 1.1409 at 1.5134. Reaction from there would reveal whether rise from 1.1409 is just a correction, or developing into a long term up trend.
USD/CHF Weekly Outlook
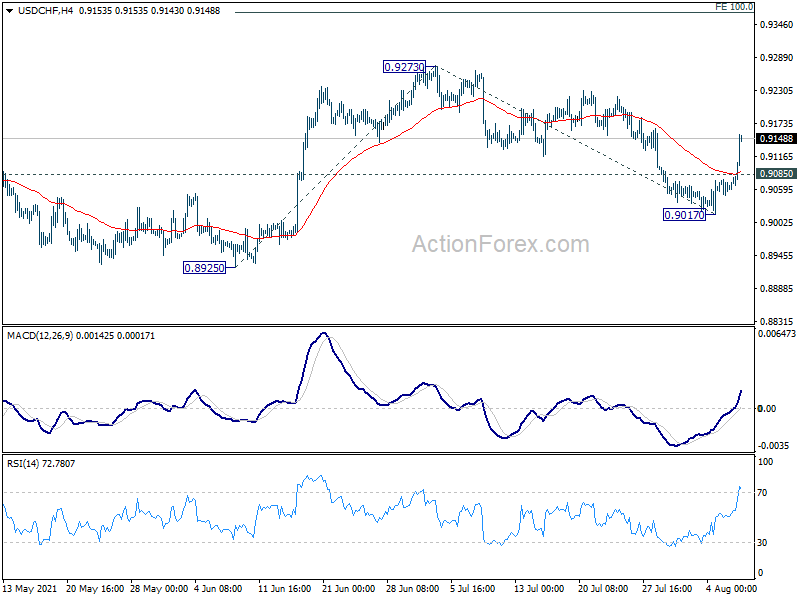
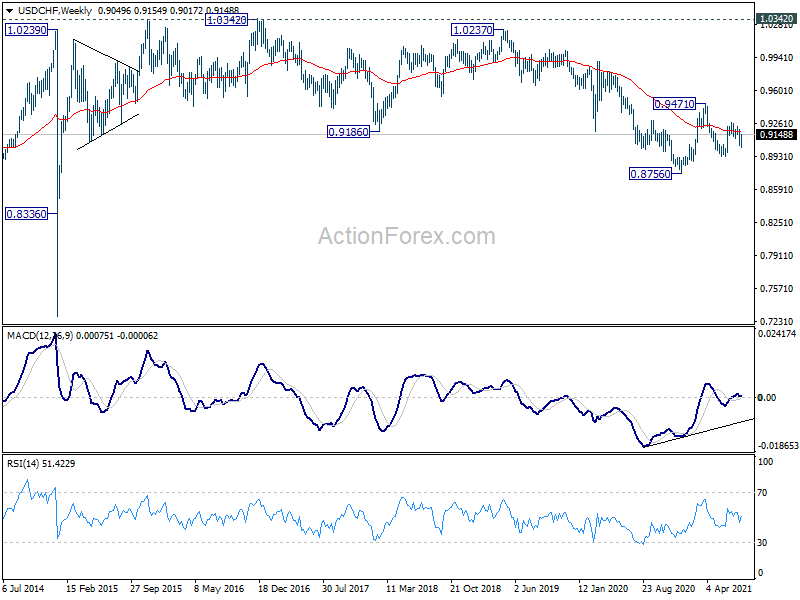
USD/CHF's strong rebound last week suggests that pull back from 0.9273 has completed with three waves down to 0.9017. Initial bias is back on the upside for 0.9273 resistance first. Break there will resume rise form 0.8925 to 100% projection of 0.8925 to 0.9273 from 0.9017 at 0.9365. On the downside, below 0.9085 minor support will turn bias back to the downside for 0.9017 support instead.
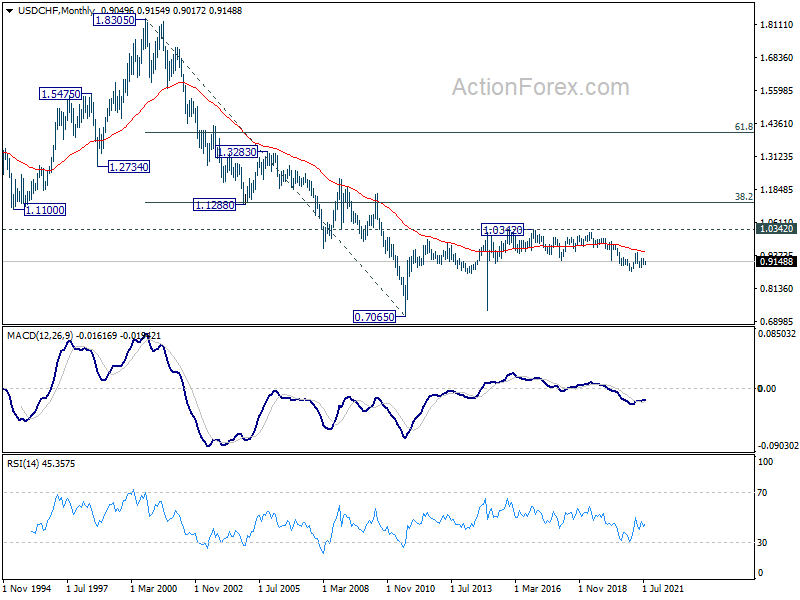
In the bigger picture, the failure to sustain above 55 week EMA (now at 0.9183) retains medium term bearish in USD/CHF. Break of 0.8925 support should resume the whole decline form 1.0342 (2016 high) through 0.8756 low. However, break of 0.9273 resistance and sustained trading above 55 week EMA will be an early sign of bullish trend reversal. Focus will then turn to 0.9471 resistance for confirmation.
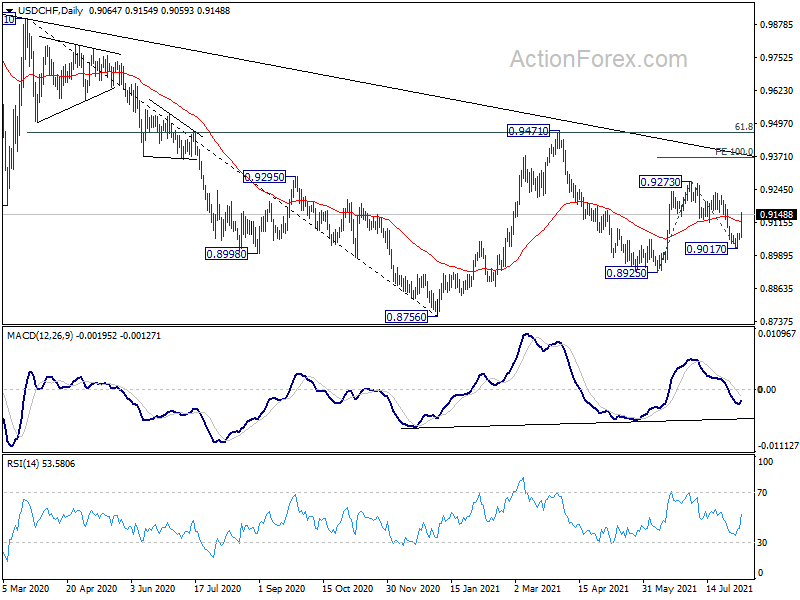
In the long term picture, price actions from 0.7065 (2011 low) are currently seen as developing into a long term corrective pattern, at least until a firm break of 1.0342 resistance.
AUD/USD Weekly Outlook
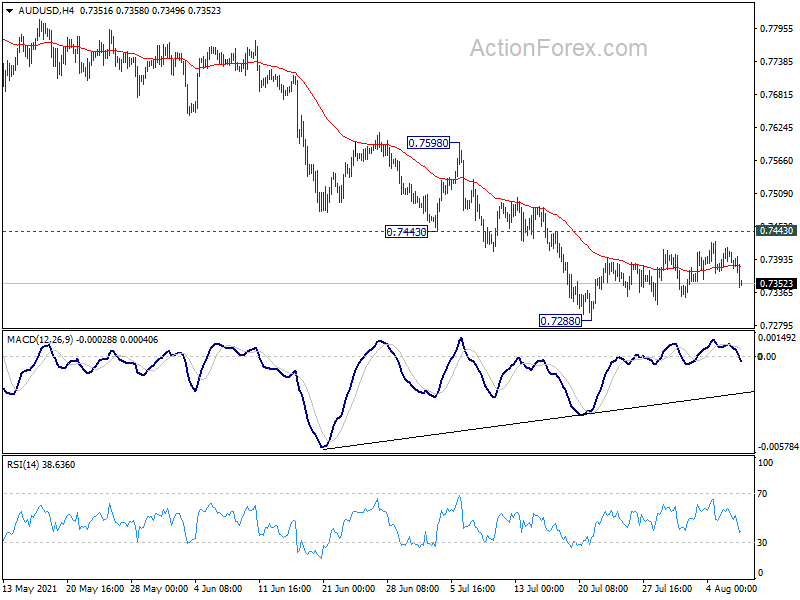
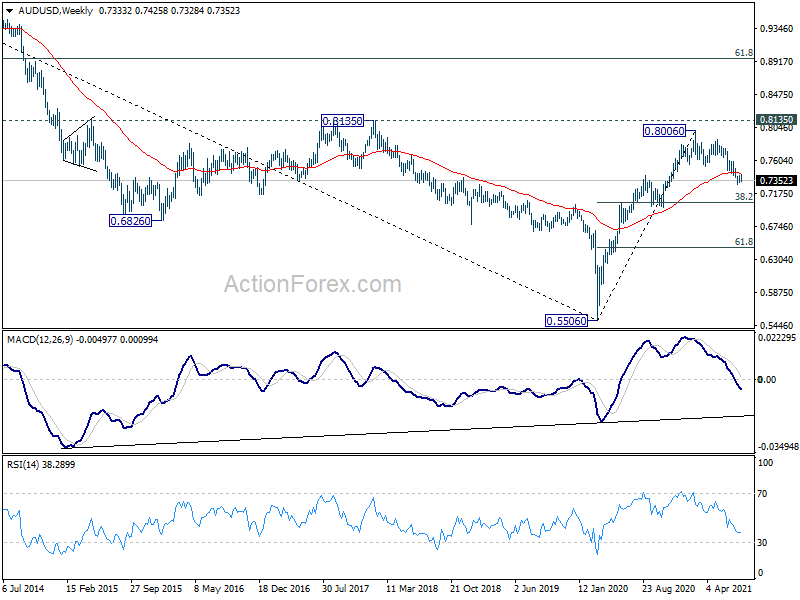
AUD/USD stayed in consolidation above 0.7288 last week and outlook is unchanged. Initial bias remains neutral this week first. Outlook stays bearish as long as 0.7443 resistance holds. On the downside, break of 0.7288 will resume the fall from 0.8006 to 161.8% projection of 0.8006 to 0.7530 from 0.7890 at 0.7120 next. On the upside, break of 0.7443 will bring stronger rebound to 0.7530 support turned resistance instead.
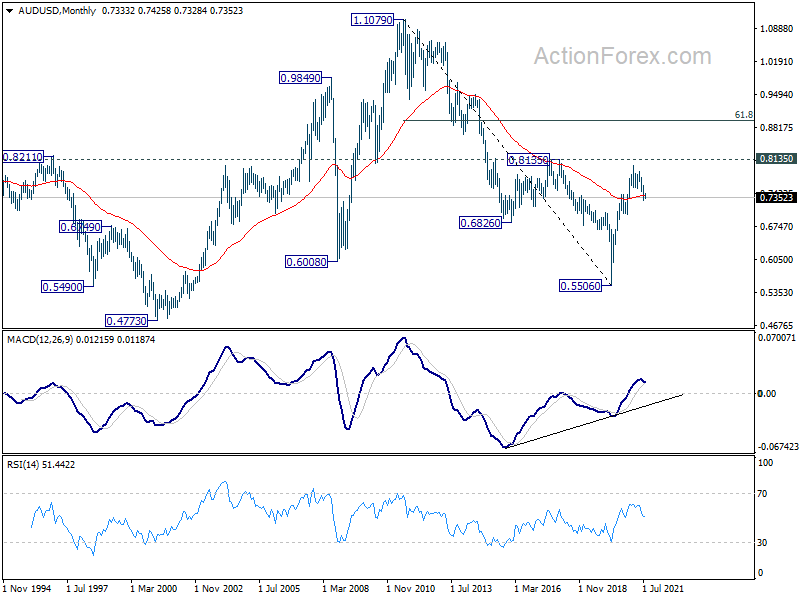
In the bigger picture, rise from 0.5506 medium term bottom could have completed at 0.8006, after failing 0.8135 key resistance. Correction from there could target 0.6991 cluster support (38.2% retracement of 0.5506 to 0.8006 at 0.7051). We'd look for strong support from there to bring rebound. However, sustained break of this level would argue that the whole medium term trend has indeed reversed.
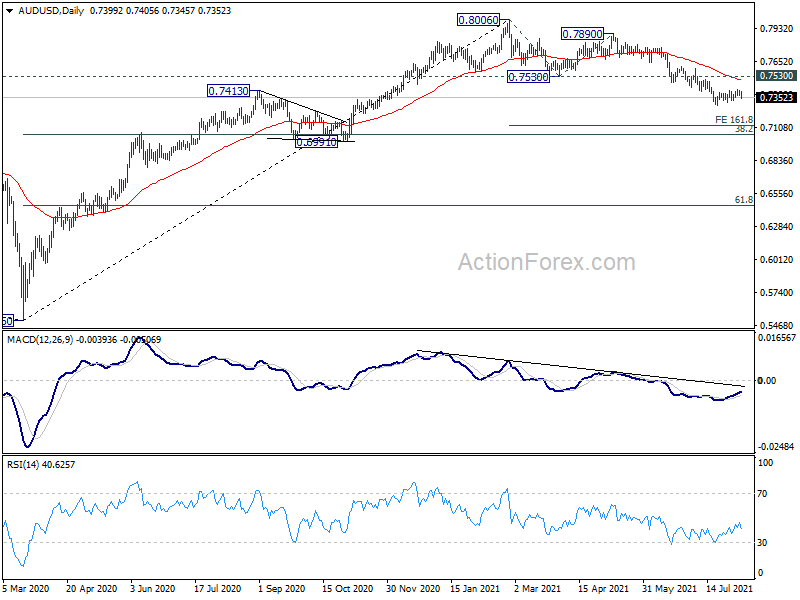
In the longer term picture, rise from 0.5506 could have completed at 0.8006. But subsequent fall is now seen as a correction only. As long as 0.6991 structural support holds, we'd expect another rise through 0.8006 at a later stage. However, sustained break of 0.6991 would argue that the trend has reversed and put 0.5506 low back into radar.
USD/CAD Weekly Outlook
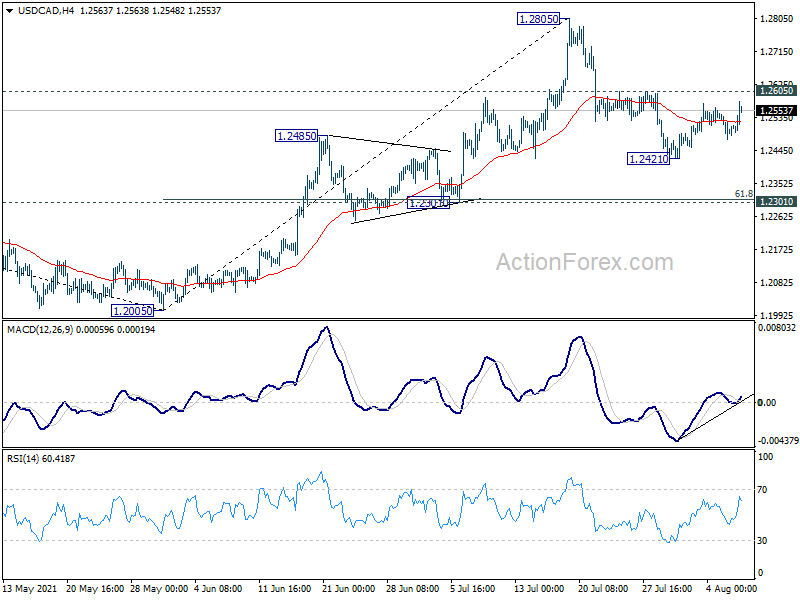
USD/CAD stayed in consolidation from 1.2421 last week and outlook is unchanged. Initial bias remains neutral this week for some consolidations. Further fall is expected with 1.2605 resistance intact. Below 1.2421 will resume the fall from 1.2805 to 1.2301 cluster support (61.8% retracement of 1.2005 to 1.2805 at 1.2311). On the upside, break of 1.2605 will turn bias back to the upside for retesting 1.2805 high instead.
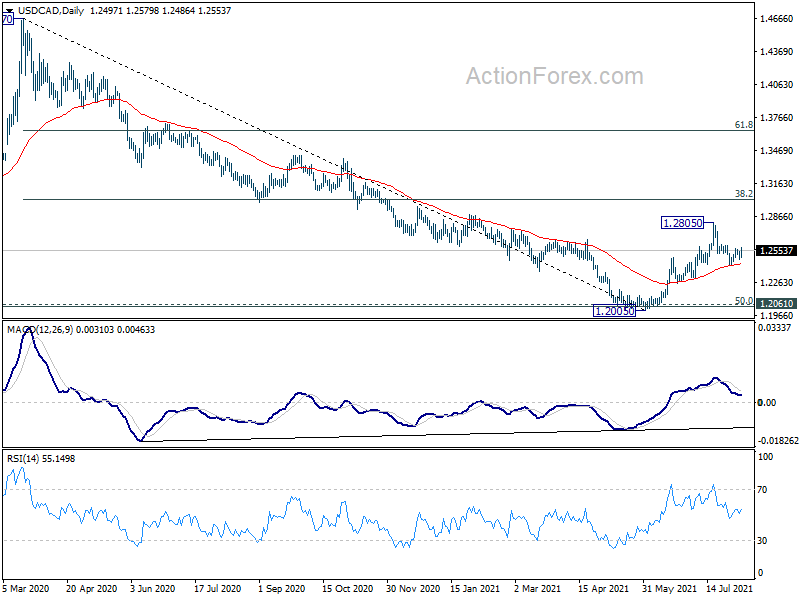
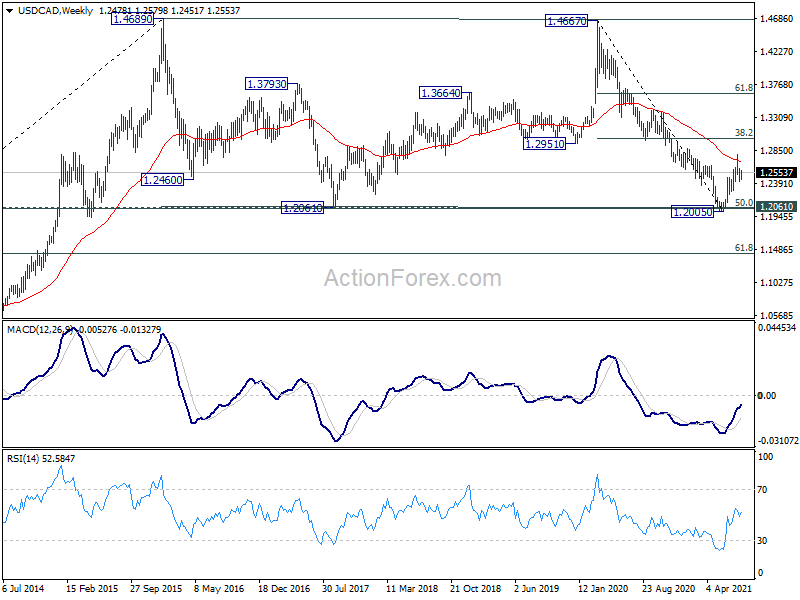
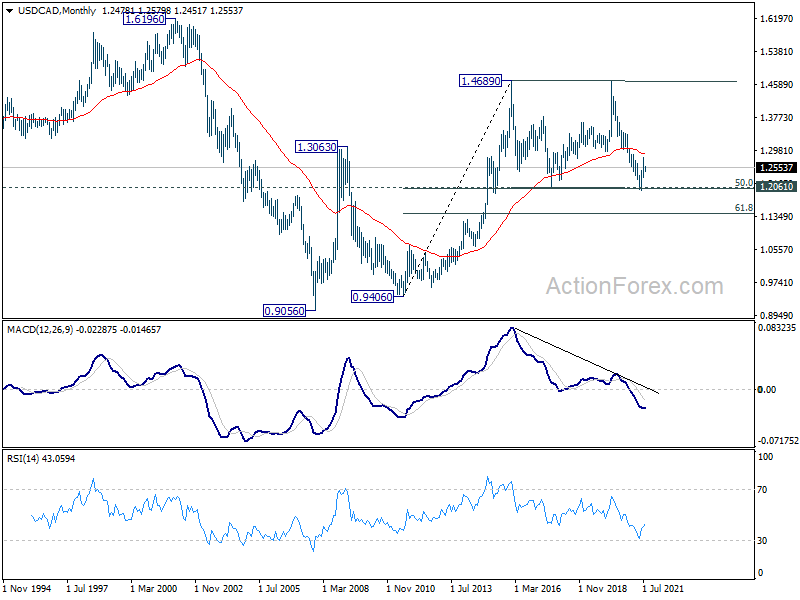
In the bigger picture, fall from 1.4667 is seen as the third leg of the corrective pattern from 1.4689 (2016 high). It should have completed after hitting 1.2061 (2017 low) and 50% retracement of 0.9406 to 1.4689 at 1.2048. Sustained break of 38.2% retracement of 1.4667 to 1.2005 at 1.3022 will pave the way to 61.8% retracement at 1.3650 and above. Overall, medium term outlook remains neutral at worst with 1.2048/61 support zone intact.
In the longer term picture, we're viewing price actions from 1.4689 as a consolidation pattern. Thus, up trend from 0.9506 (2007 low) is still expected to resume at a later stage. This will remain the favored case as long as 1.2061 support holds, which is close to 50% retracement of 0.9406 to 1.4689 at 1.2048. However, sustained break of 1.2061 will be a sign of long term bearishness. Deeper fall would be seen to 61.8% retracement at 1.1424 and below.
GBP/JPY Weekly Outlook
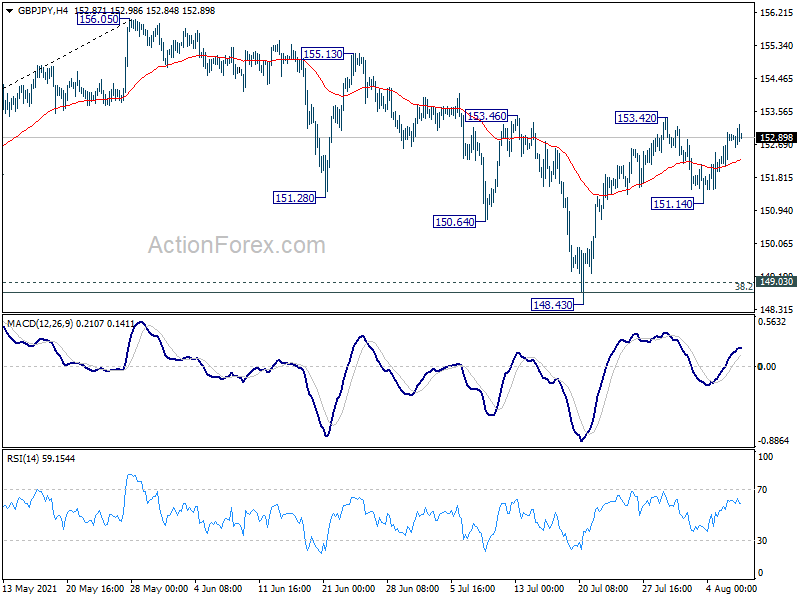
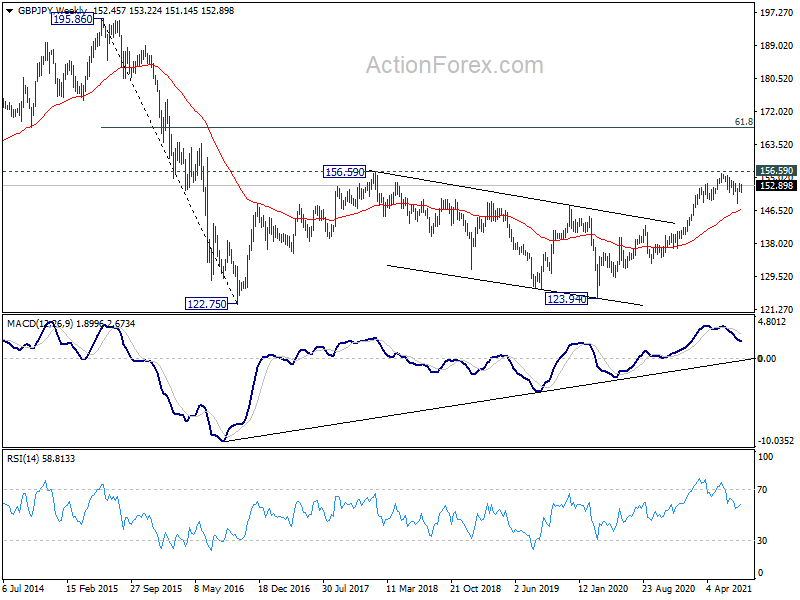
GBP/JPY turned into range trading between 151.14 and 153.42 last week. Initial bias remains neutral this week first. On the upside, break of 153.42/46 resistance will reaffirm the case that correction from 156.05 has completed at 148.43. Intraday bias will be back on the upside for retesting 156.05. On the downside, though, below 151.14 will bring deeper fall back to retest 148.43.
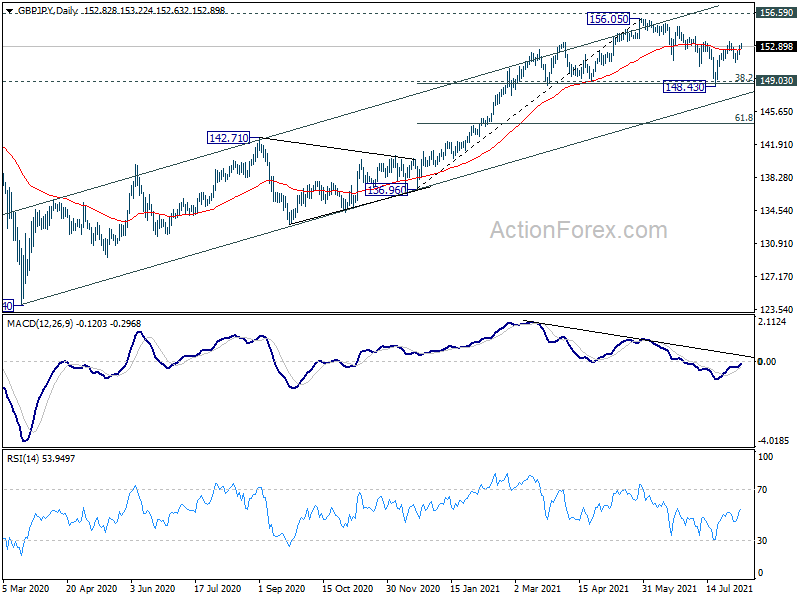
In the bigger picture, rise from 123.94 is seen as the third leg of the pattern from 122.75 (2016 low). Focus remains on 156.59 resistance (2018 high). Sustained break there should confirm long term bullish trend reversal. Next target is 61.8% retracement of 195.86 (2015 high) to 122.75 at 167.93. On the downside, sustained break of 149.03 support, however, will argue that rise from 123.94 has completed. Further break of 142.71 would open up the bearish case for retesting 122.75 low.
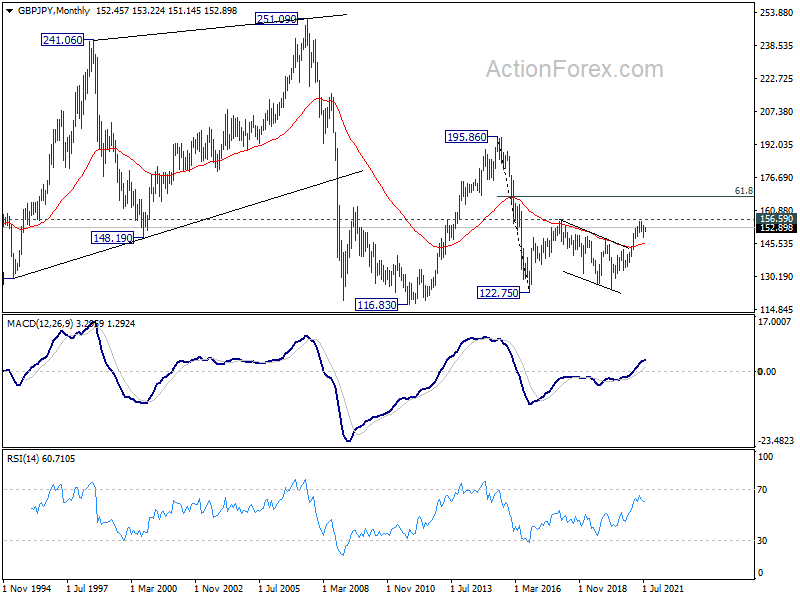
In the longer term picture, the strong break of 55 months EMA was an early sign of long term bullish reversal. Firm break of 156.69 resistance should now confirm the start of an up trend for 195.86 (2015 high).
EUR/JPY Weekly Outlook
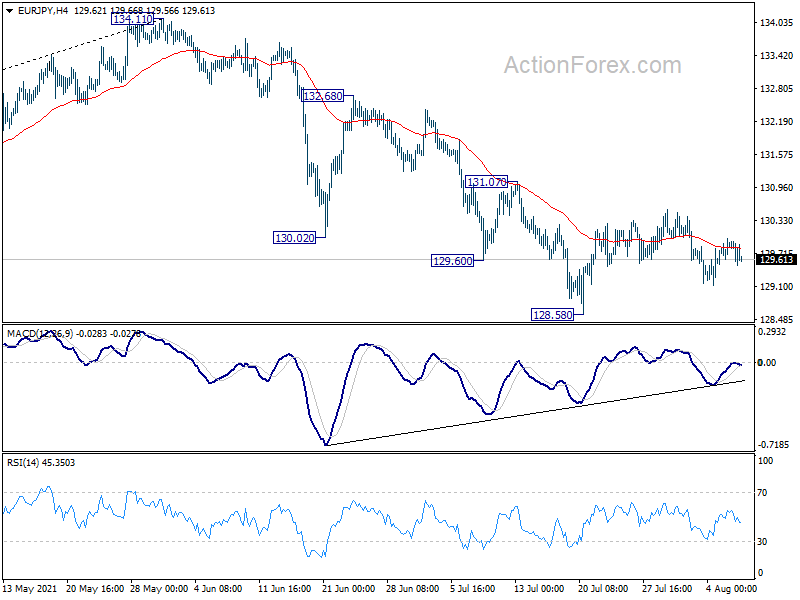
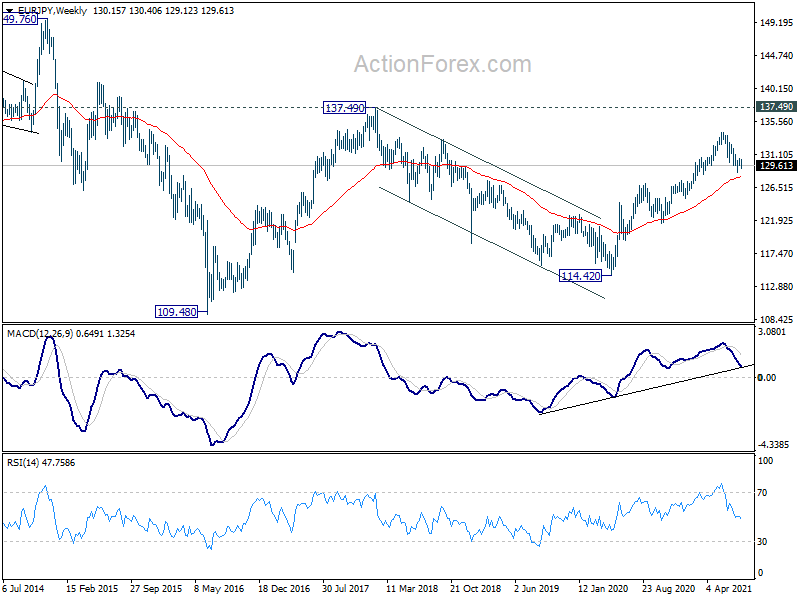
EUR/JPY continued to be bounded in consolidation in range of 128.58/131.07 last week. Initial bias remains neutral this week for sideway trading. Overall, outlook stays bearish with 131.07 resistance intact. On the downside, break of 128.85 will resume the fall from 134.11 to 127.07 resistance turned support next. On the upside, break of 131.07 resistance will argue that choppy fall from 134.11 has completed. Intraday bias will be turned back to the upside for 132.68 resistance first.
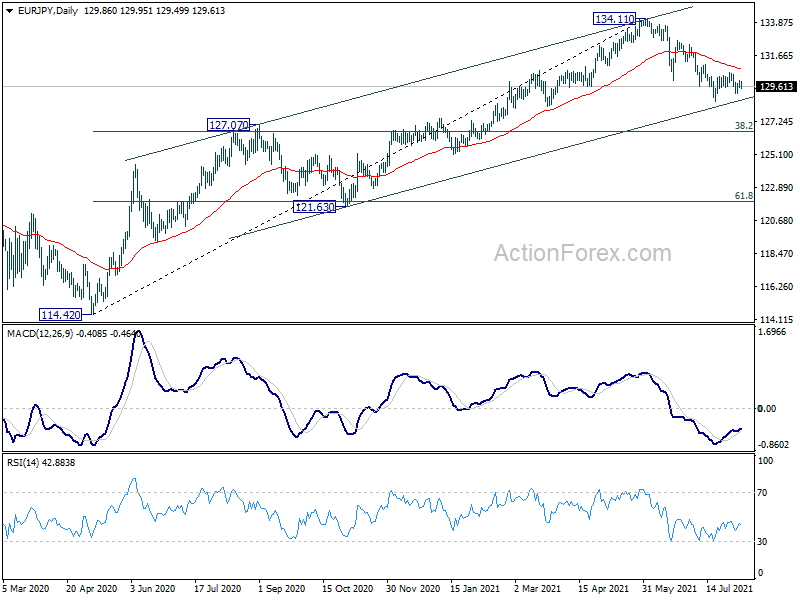
In the bigger picture, rise from 114.42 is seen as a medium term rising leg inside a long term sideway pattern. As long as 127.07 resistance turned support holds, further rise is still expected to retest 137.49 (2018 high). However, firm break of 127.07 will argue that the medium term trend has reversed, and open up the case for retesting 114.42.
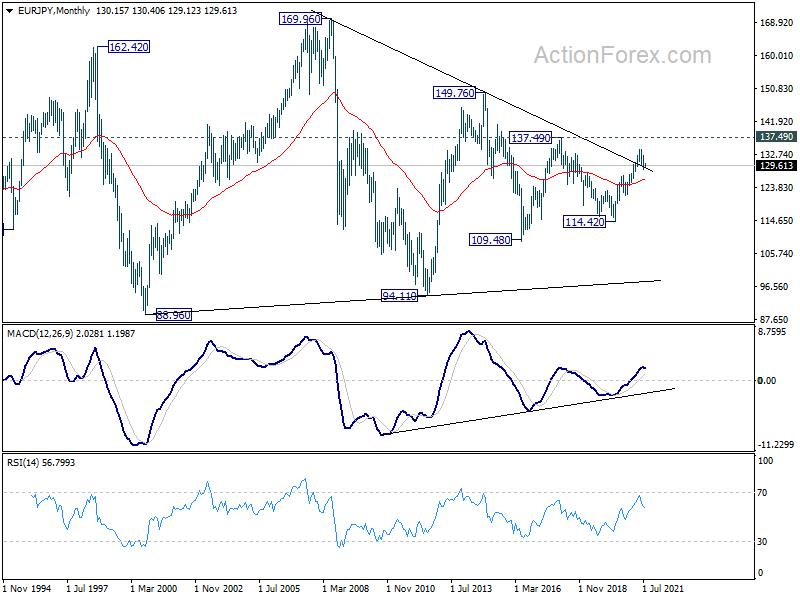
In the long term picture, EUR/JPY is staying in long term sideway pattern, established since 2000. Another rising leg in progress for 137.49 resistance and above.
EUR/GBP Weekly Outlook
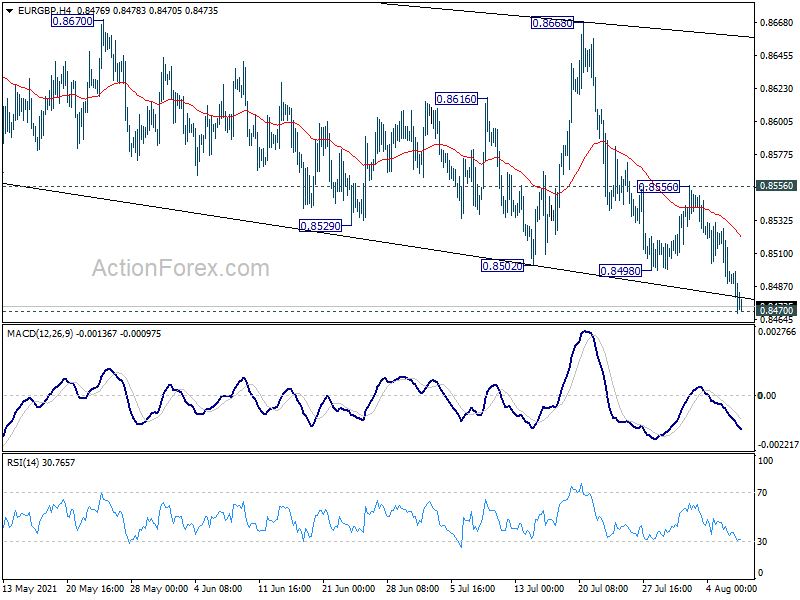
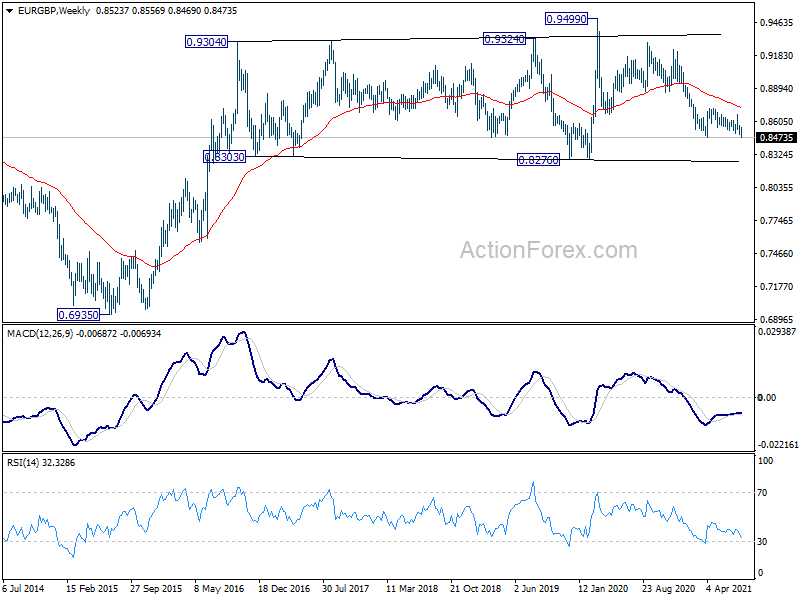
EUR/GBP dropped to as low as 0.8469 last week and there is no sign of bottoming yet. Initial bias remains on the downside this week with focus on 0.8470 low. Decisive break there will resume larger fall from 0.9499, towards next key support at 0.8276. On the upside, break of 0.8556 will indicate short term bottoming and turn bias back to the upside for strong rebound.
In the bigger picture, price actions from 0.9499 are still seen as developing into a corrective pattern. Deeper fall could be seen as long as 0.8718 resistance holds. Firm break of 0.8470 will target long term support at 0.8276. However, firm break of 0.8718 would argue that a medium term bottom was already formed. Stronger rise would be seen to 0.8861 support turned resistance to confirm completion of the corrective pattern.
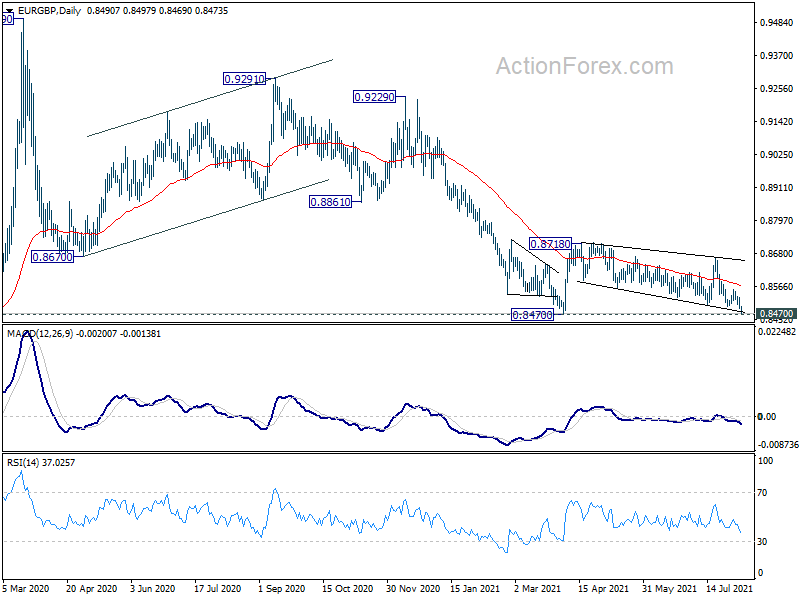
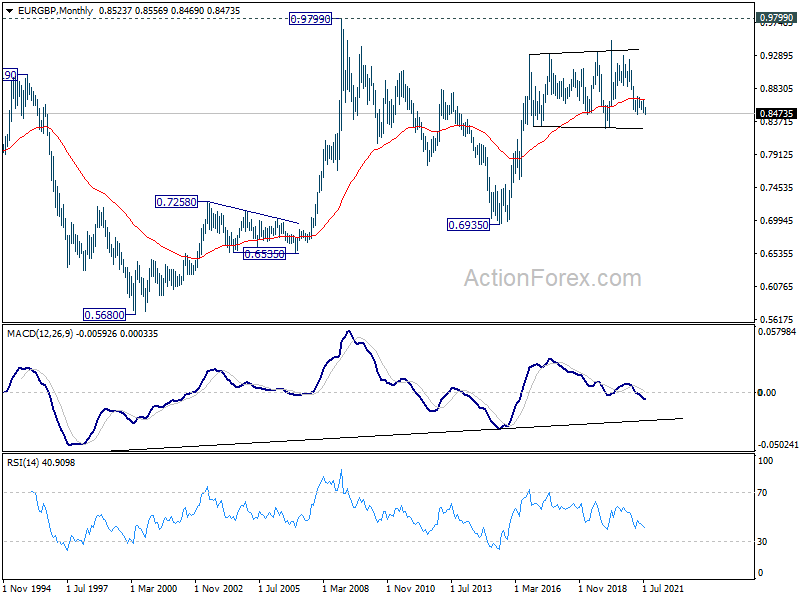
In the long term picture, outlook will stay bullish as long as 0.8276 support holds. Break of 0.9499 is in favor at a later stage, to resume the up trend from 0.6935 (2015 low).
EUR/AUD Weekly Outlook
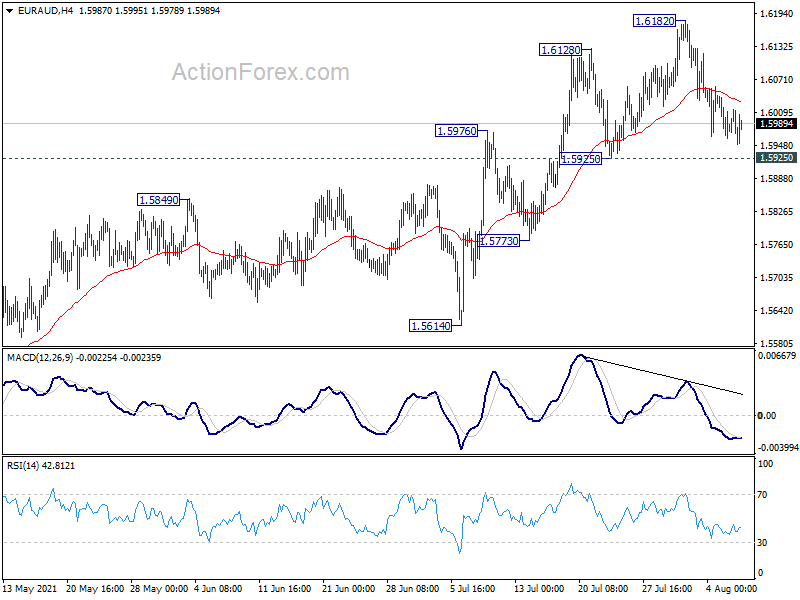
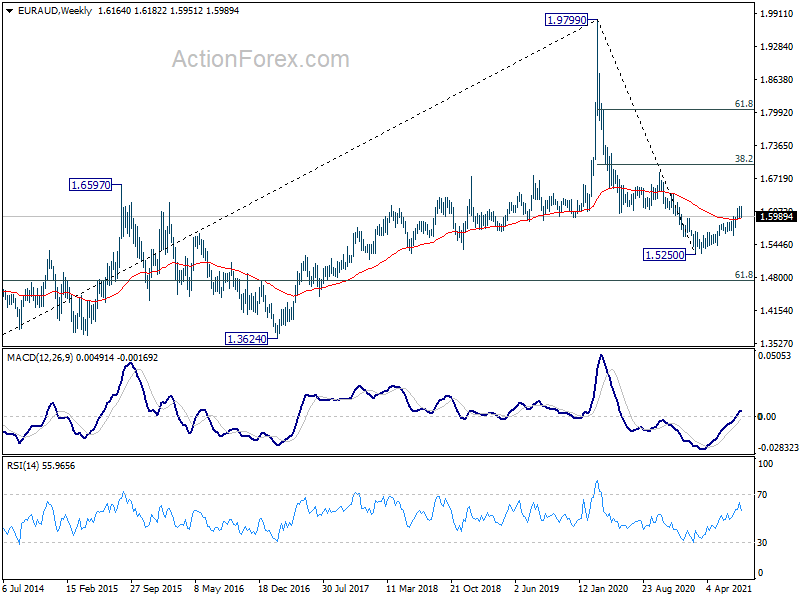
EUR/AUD edged higher to 1.6182 last week but retreated since then. Initial bias remains neutral this week for some consolidations. Further rise is expected as long as 1.5925 support holds. On the upside, break of 1.6182 will resume the rise from 1.5250 to 1.6827 resistance next. However, on the downside, firm break of 1.5925 will bring deeper fall back to 1.5614 structural support instead.
In the bigger picture, a medium term bottom was formed at 1.5250, on bullish convergence condition in daily MACD. Rise from 1.5250 is currently seen as a correction to the down trend from 1.9799 first. Stronger rise would be seen to 38.2% retracement of 1.9799 to 1.5250 at 1.6988 next. We'd tentatively expect strong resistance from there to limit upside, at least on first attempt. Meanwhile, break of 1.5614 support will indicate that the rebound has completed and bring retest of 1.5250 low.
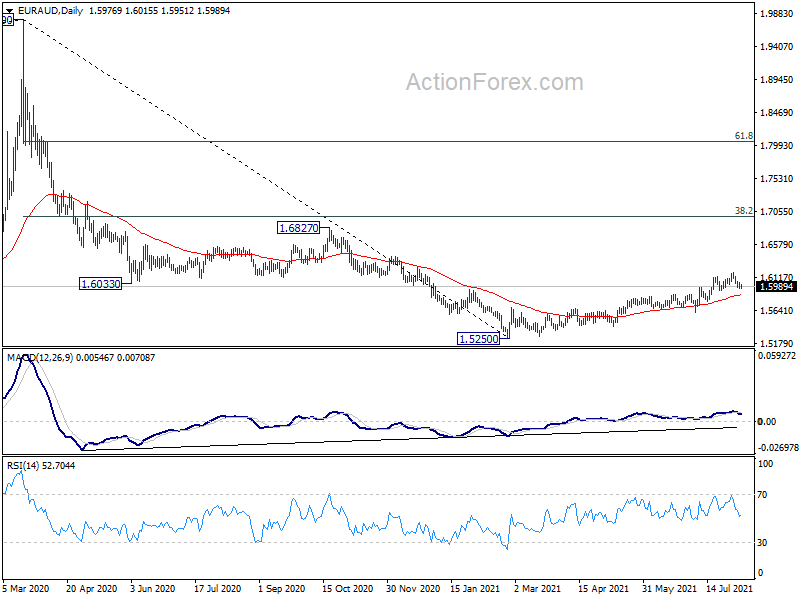
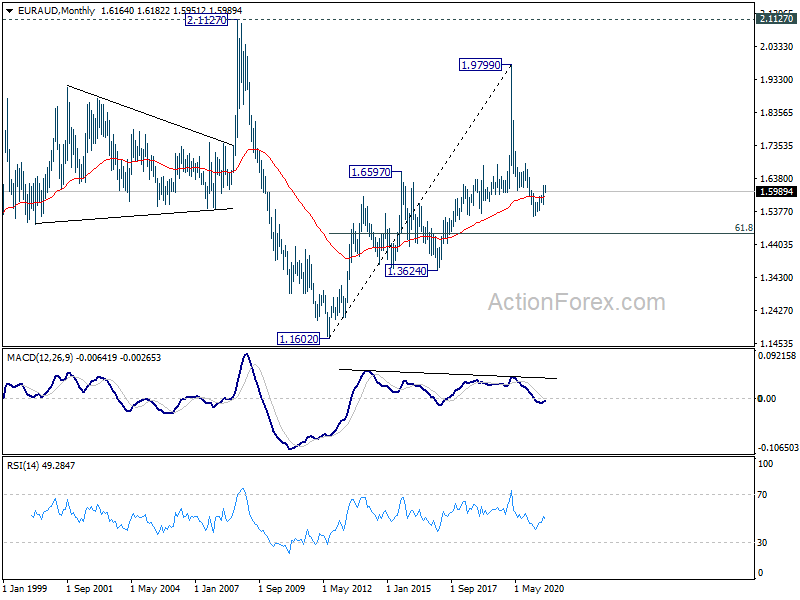
In the longer term picture, rise from 1.1602 (2012 low) should have already completed with three waves up to 1.9799 (2020 high). Fall from there is seen as a medium term to long term down leg as a long term down trend, or a sideway pattern. We'll assess the odds again at a later stage.
EUR/CHF Weekly Outlook
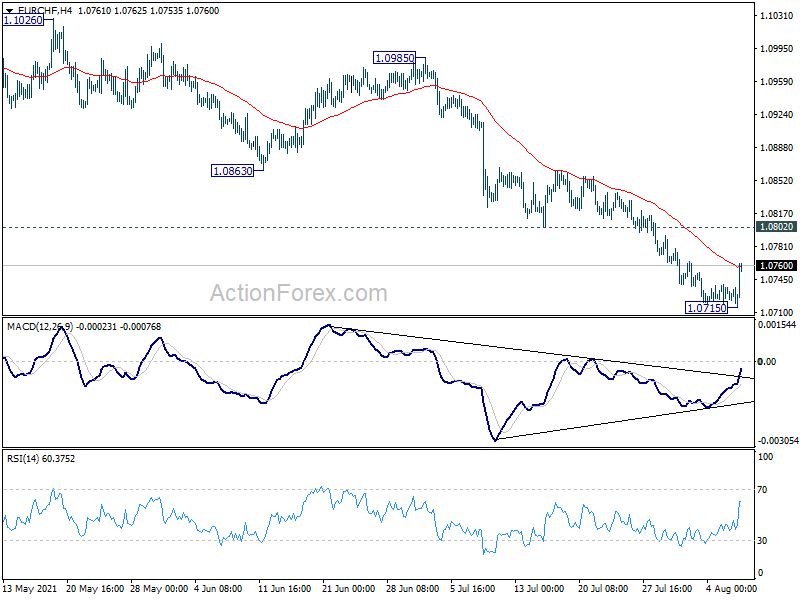
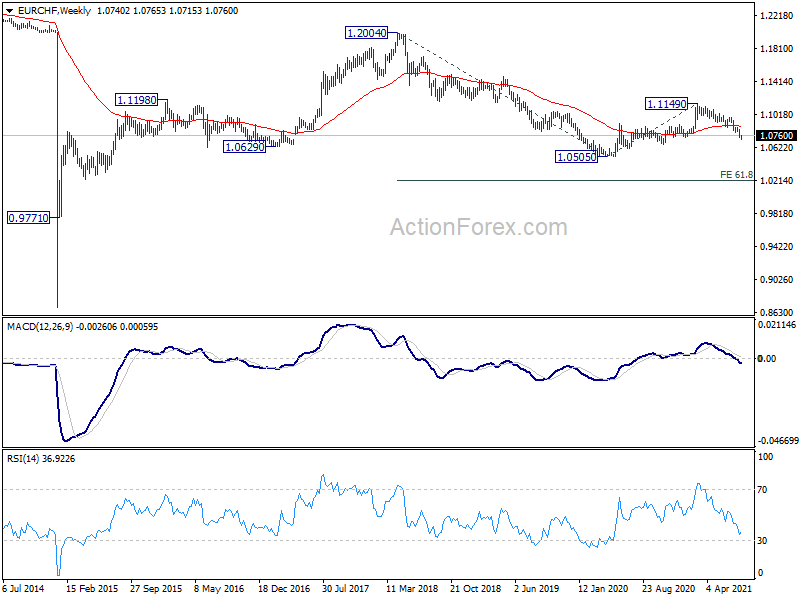
EUR/CHF dropped further to 1.0715 last week but recovered. Initial bias is turned neutral for some consolidations first. But outlook will stay bearish as long as 1.0802 support turned resistance holds. On the downside, break of 1.0715 will resume larger fall from 1.1149 to retest 1.0505 low. On the upside, though, break of 1.0802 will indicate short term bottoming and bring stronger rebound first.
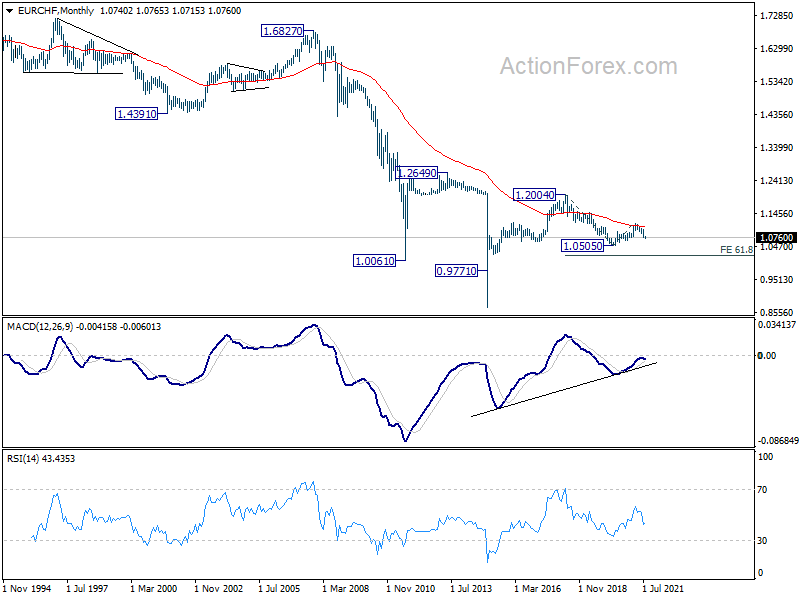
In the bigger picture, rebound from 1.0505 (2020 low) should have completed at 1.1149 already. The three wave corrective structure argues that the downtrend from 1.2004 (2018 high) is not over yet. Medium term outlook will now stay bearish as long as 1.1149 resistance holds. Break of 1.0505 low would be seen at a later stage.
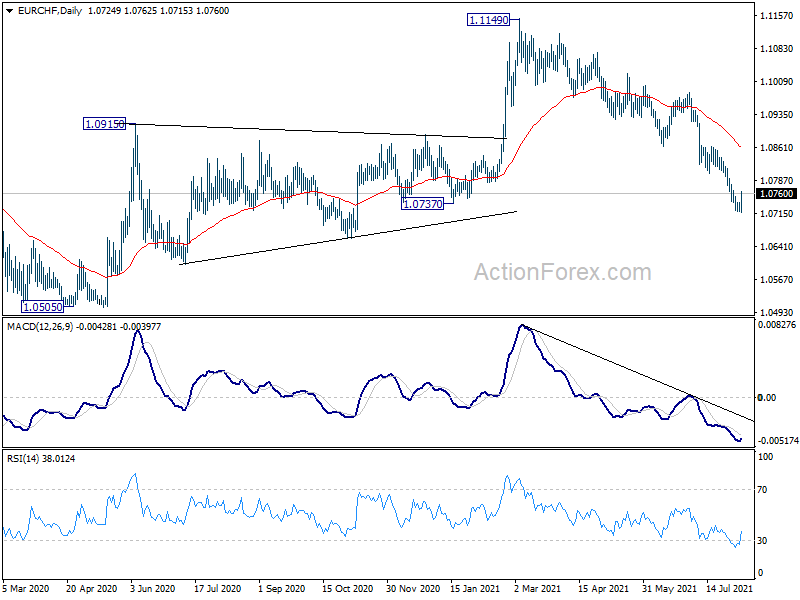
In the long term picture, rejection by 55 month EMA (now at 1.1068) retains long term bearishness. Break of 1.0505 low will resume down trend to 61.8% projection of 1.2004 to 1.0505 to 1.1149 at 1.0223.
Dollar Turned Around While Tapering Talks Heated Up Again
Dollar soared towards the end of the week as the stellar job report should give Fed much confidence to start tapering later in the year. Reactions from stock markets and yields were also positive, with DOW and S&P closing at new records while 10-year yield rebounded. Together with the steep fall in gold, overall development supports first rally in Dollar ahead, at least for the near term.
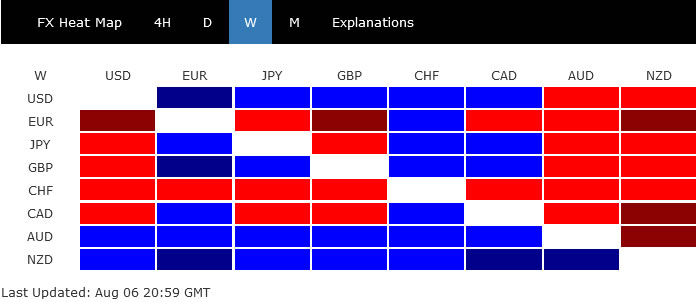
Nonetheless, Dollar's strength was mainly seen against Euro, Swiss Franc and Yen. Aussie and Kiwi were in deed the strongest for the week while Euro and Swiss Franc were themselves the weakest. A key to watch now is whether comments from Fed officials could help push Dollar through recent resistance levels against Euro, as well as commodity currencies like Aussie, to solidify its momentum.
NFP a big step forward for Fed tapering
Fed moved a big step forward on tapering the asset purchase program with strong July non-farm payrolls job growth. Some officials like Governor Christopher Waller were clear that if job growth exceeds 800k in both July and August, then September is ready for a tapering announcement.
We'd expect more talks about the timing of tapering to come in the coming weeks, leading up to the Jackson Hole Symposium on August 26-28. Chair Jerome Powell might not be very clear on the tapering time by then, as August job numbers won't be available yet. Also, there are still a lot of uncertainties over the spread of Delta variant and its impact on the economy. Nevertheless, more affirmative comments by him and other Fed officials could continue to give Dollar support.
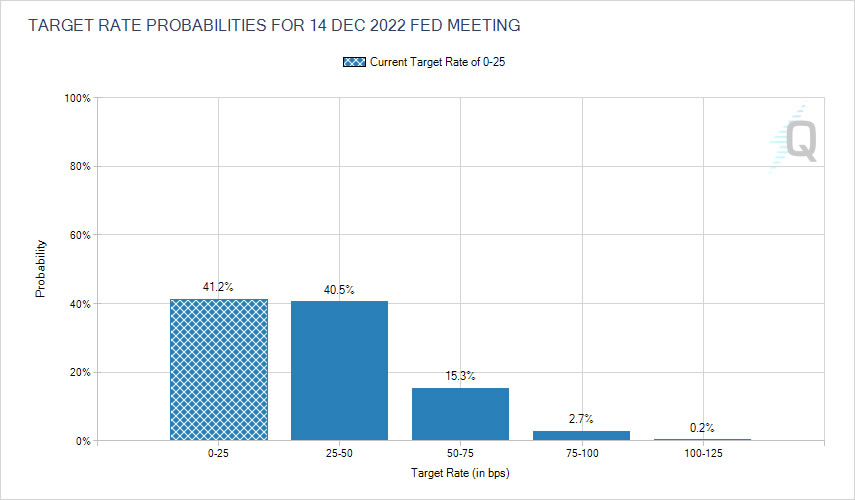
Meanwhile, one more thing to be clear is that rate hike is a totally different topic to tapering. An early rate hike would really require inflation data proving itself rather non-transitory. For now, though, Fed funds futures are firmly pricing in nearly 60% chance of at least one hike by December 2022.
DOW hit new record, ready to extend up trend
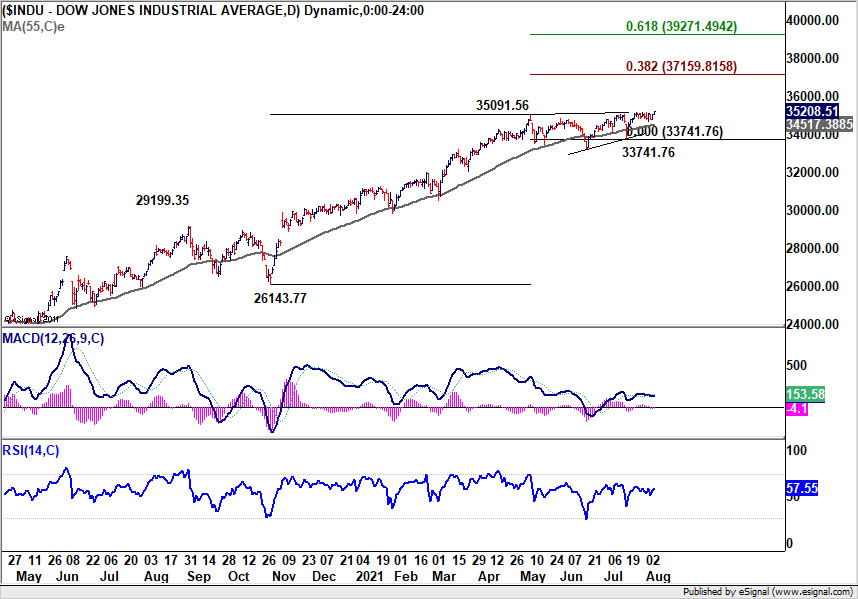
The US stock markets have indeed responded rather well to the strong job numbers and expectations on Fed tapering. Both DOW and S&P 500 closed at new records highs. In particular, it now looks like DOW is ready to stand firm above 35k handle to resume the long term up trend.
Outlook will continue to stay bullish as long as 55 day EMA (now at 34517.38) holds. Next target is 38.2% projection of 26143.77 to 35901.56 from 33741.76 at 37159.81. That would be the key test to determine whether DOW could extend the up trend through to next year, as the economy would then hopefully be fully back to normal. If 37159.81 could be taken out decisively later in the year, 40k handle would be within reach next year.
10-year yield rebounded after drawing support again
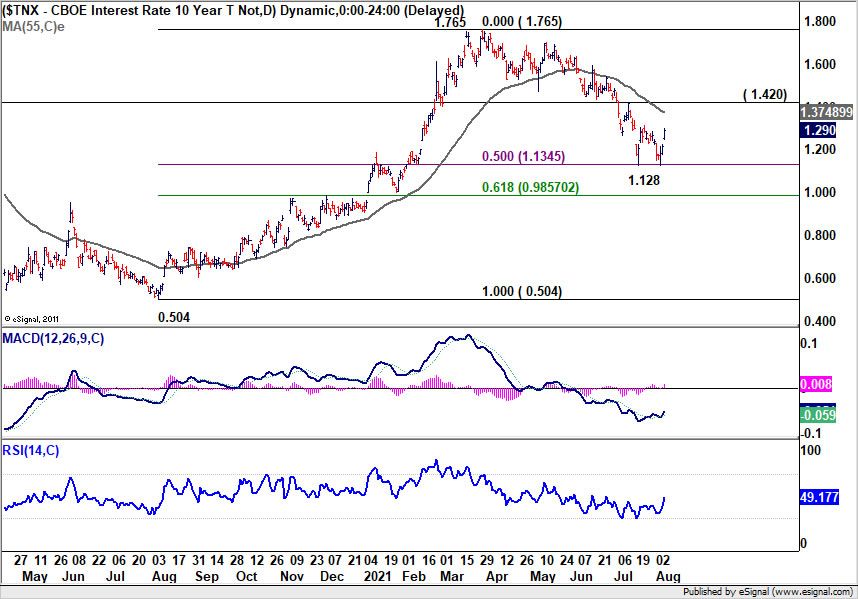
10-year yield also rebounded strongly on Friday. 50% retracement of 0.504 to 1.765 at 1.134 provided strong support once again. It's likely to see TNX breaking through 1.134 firmly if the economy continues to improve. Instead, break of 1.420 resistance will suggest that correction from 1.765 has completed at 1.128. Stronger rise would then be see back to 1.765 resistance. Such scenario could happen when Fed shows more confidence on tapering in Q4, and talk of a rate hike next year heat up.
DXY drew strong support from 55 day EMA
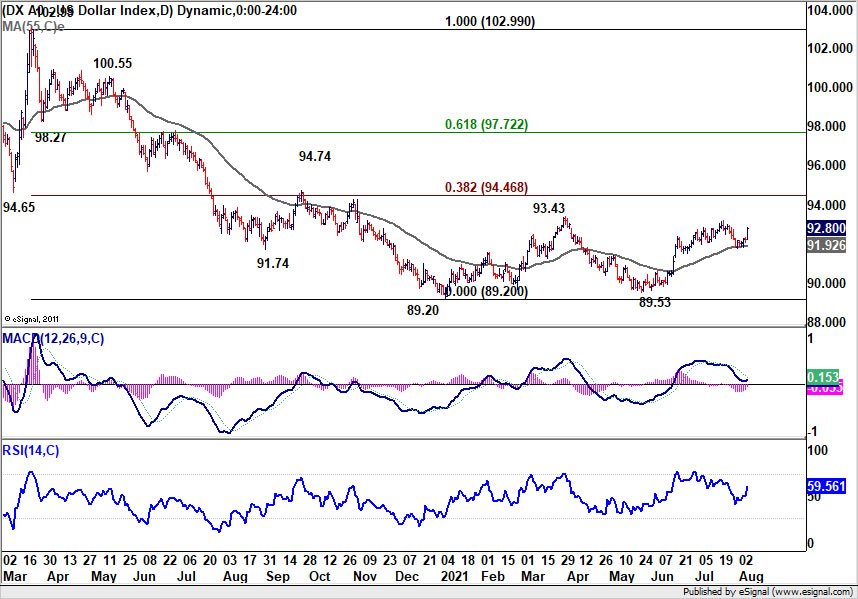
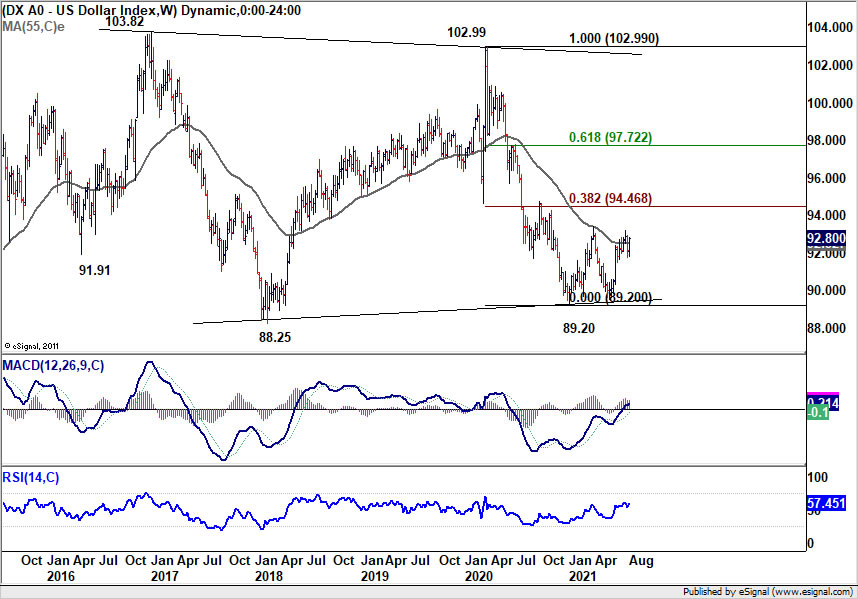
Dollar index also rebounded strongly to close the week at 92.80. The strong support from 55 day EMA is a bullish development. Rise from 89.53 looks set to resume for the near term, probably through 93.43 resistance. If that happens, DXY would also be taking out 55 week EMA rather firmly, which is a medium term bullish development.
The key focus would then be on 38.2% retracement of 102.99 to 89.20 at 94.46. As long as this fibonacci level holds, we'd continue to treat price actions from 89.20 as a corrective pattern only. However, strong break of 94.46 will argue that DXY is already in a medium term up trend, that would extend through 61.8% retracement at 97.72.
Gold to extend decline through 1750 to retest 1676 low
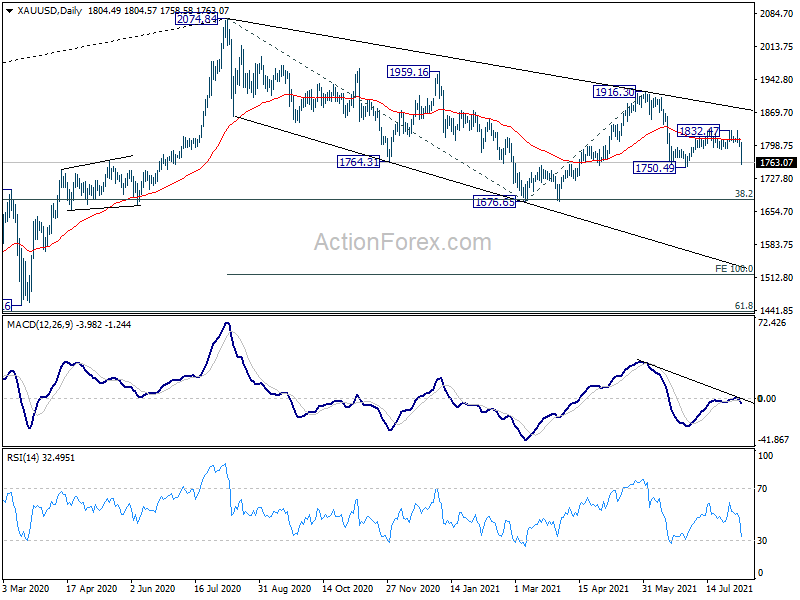
Gold also drops sharply along with the broad based rally in Dollar. The development suggests that recovery from 1750.49 has completed after failing to sustain above 55 day EMA. Fall from 1916.30 is ready to resume through 1750.49 to 1676.65 low.
We'd pay special attention to the reaction to 1676.65 support. Firm break there would bring some downside acceleration to extend whole down trend from 2074.84. Next medium term target would be 100% projection of 2074.84 to 1676.65 from 1916.30 at 1518.11. Such scenario, if happens, would be used to double-confirm DXY's break of 94.46 fibonacci resistance, and probably TNX's break of 1.765 high.
EUR/USD Weekly Outlook
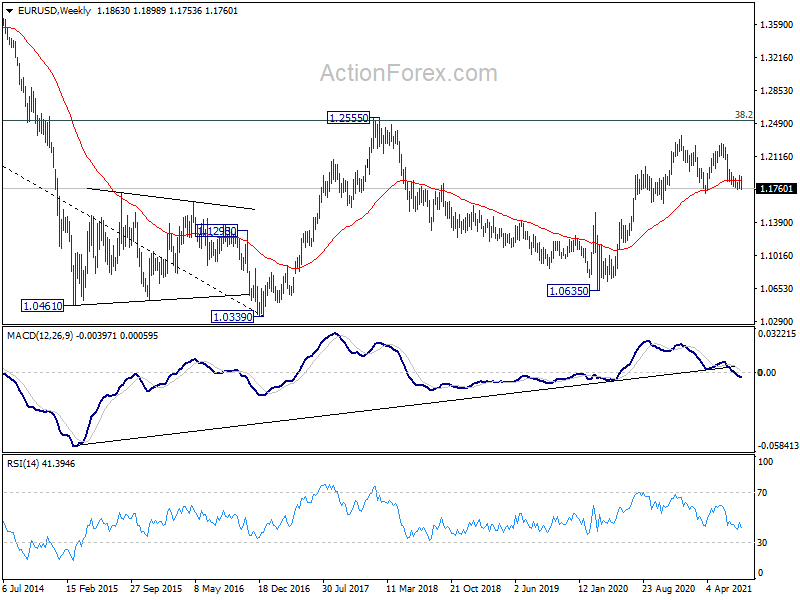
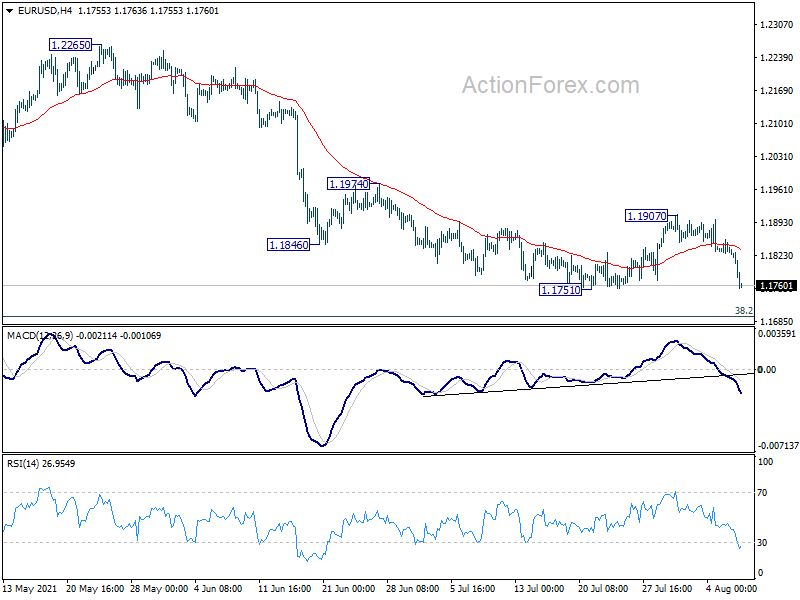
EUR/USD dropped sharply last week and the development suggest rejection by 55 day EMA. Immediate focus is now on 1.1751 support. Break will resume fall from 1.2265 to 1.1602/1703 support zone. We'd look for strong support from there to bring rebound. But break of 1.1907 resistance is needed to confirm short term bottoming. Meanwhile, sustained break of 1.1602 will argue that it's already reversing the trend from 1.1603, and target 61.8% retracement of 1.1603 to 1.2348 at 1.1888.
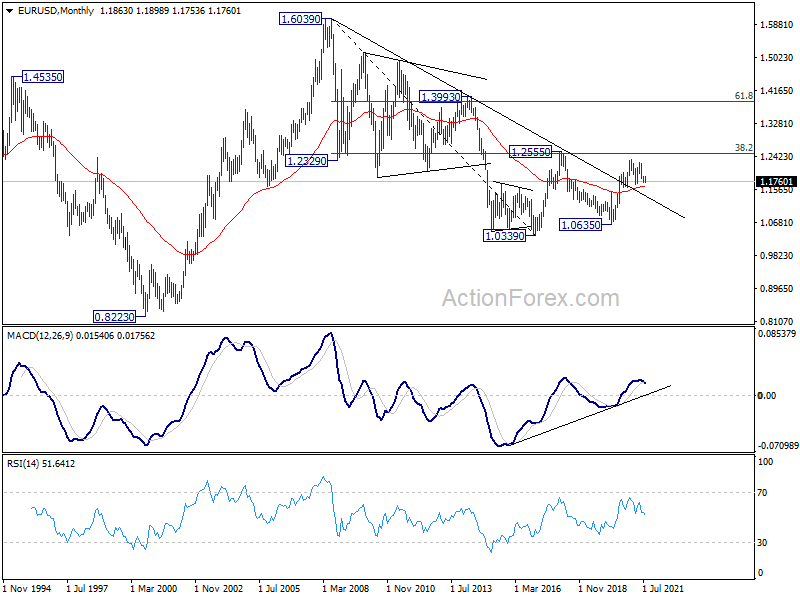
In the bigger picture, rise from 1.0635 is seen as the third leg of the pattern from 1.0339 (2017 low). Further rally could be seen to cluster resistance at 1.2555 next, (38.2% retracement of 1.6039 to 1.0339 at 1.2516). This will remain the favored case as long as 1.1602 support holds. Reaction from 1.2555 should reveal underlying long term momentum in the pair. However sustained break of 1.1602 will argue that the rise from 1.0635 is over, and turn medium term outlook bearish again.
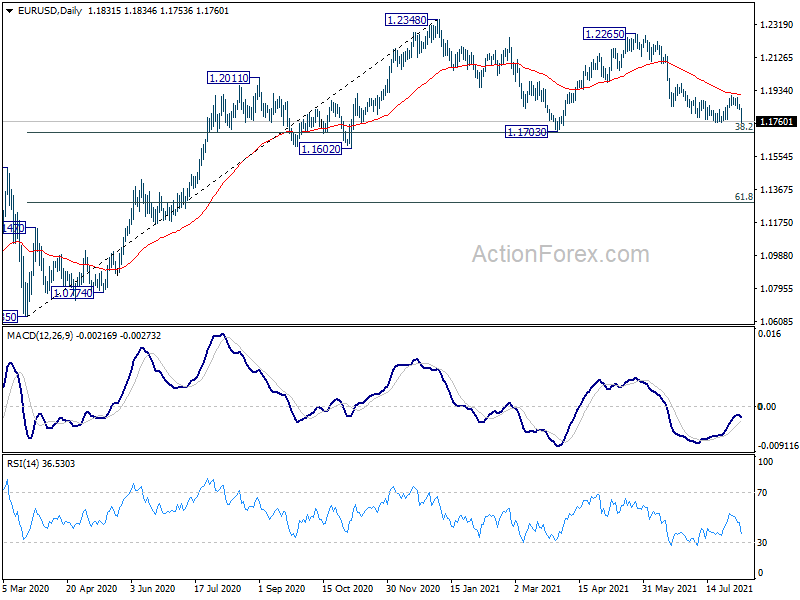
In the long term picture, focus remains on 1.2555 cluster resistance (38.2% retracement of 1.6039 to 1.0339 at 1.2516). Sustained break there should confirm long term bullish reversal and target 61.8% retracement at 1.3862 and above. However, rejection by 1.2555 will keep medium term outlook neutral first, and raise the prospect of down trend resumption at a later stage.